States Where Home Prices are Actually Falling
Since the start of the COVID-19 pandemic, home prices have surged in the United States. According to the Case-Shiller Home Price Index, home values increased by 42% between mid 2020 and mid 2022. More recently, despite some modest, short-lived declines, home prices rose by another 5% in the last two and a half years. 24/7 […] The post States Where Home Prices are Actually Falling appeared first on 24/7 Wall St..
Since the start of the COVID-19 pandemic, home prices have surged in the United States. According to the Case-Shiller Home Price Index, home values increased by 42% between mid 2020 and mid 2022. More recently, despite some modest, short-lived declines, home prices rose by another 5% in the last two and a half years.
24/7 Wall St. Key Points:
- America’s housing affordability crisis has continued into 2025, and according to a recent study, an estimated 75% of U.S. households are unable to afford a typical home in today’s market.
- Still, location matters when it comes to real estate, and in certain parts of the country, home prices have come down meaningfully in the last year.
- Also: 2 Dividend Legends To Hold Forever
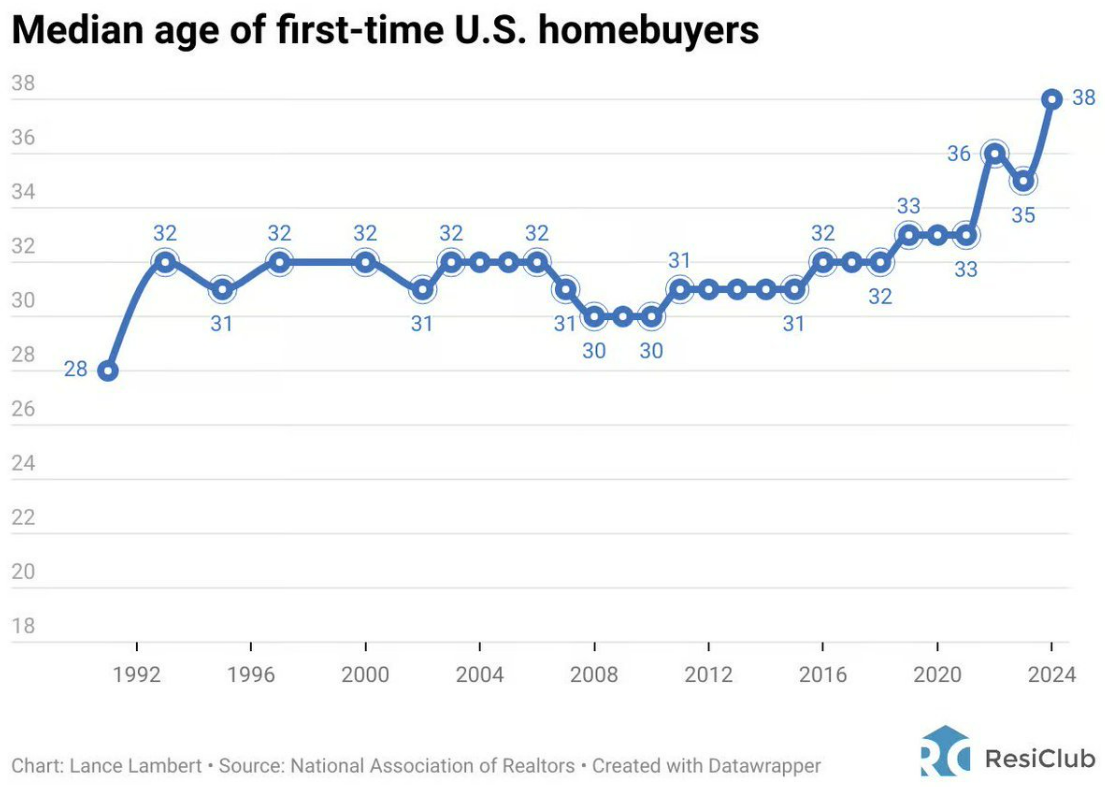
The substantial increase in home prices over the last half decade has been precipitated, in large part, by a supply shortage. According to Zillow, the U.S. may need at least another 4.5 million housing units to meet current demand. Limited housing inventory, in conjunction with historically high mortgage rates, has resulted in a housing affordability crisis. Currently, estimates from the National Association of Home Builders show that 75% of households cannot afford a typical home in the United States. (This is how Baby Boomers impacted the housing market for younger buyers.)
Real estate markets, however, are highly localized, and while home prices have been trending upwards for years, there are certain parts of the country where list prices have fallen substantially over the last 12 months.
Using data from Realtor.com, 24/7 Wall St. identified the 20 states where home prices are actually falling. States are ranked on the change in median list price between March 2024 and March 2025. All supplemental data is also from Realtor.com.
Among the states on this list, the typical listed home is anywhere from 0.2%to 8.1% less expensive now than it was a year ago. In monetary terms, home prices in some of these states have fallen by tens of thousands of dollars over the last 12 months.
Perhaps not surprisingly, falling home prices in many of these places have coincided with rising inventory. In 18 of the 20 states on this list, there are more listed homes now than there were a year ago. Lower home prices are also partially attributable to the kinds of homes people are selling, as in each of these 20 states, the typical listed home is smaller than the typical listed home was at this time last year. (Here is a look at the most affordable cities for renters in every state.)
These are the states where home prices are actually falling
Why It Matters

Rising demand, in conjunction with limited supply, have sent home prices surging by 50% since the start of the COVID-19 pandemic in the United States. However, recent housing list price data shows that in some parts of the country, this trend may finally be reversing. Welcome news for the country’s housing affordability crisis, as well as prospective home buyers, there are 20 states where a typical home now costs less than it did only a year ago.
20. Montana

- 1-year change in median list price: -0.2% (-$1,000)
- Median list prices by year: $624,000 in March 2025; $625,000 in March 2024
- Median list price per square foot: $318 in March 2025; $327 in March 2024
- Median size of a listed home: 2,084 sq. ft. in March 2025; 2,087 sq. ft. in March 2024
- Total number of listed homes in Montana: 5,070 in March 2025; 4,575 in March 2024
19. Georgia

- 1-year change in median list price: -0.2% (-$715)
- Median list prices by year: $389,000 in March 2025; $389,715 in March 2024
- Median list price per square foot: $190 in March 2025; $188 in March 2024
- Median size of a listed home: 2,044 sq. ft. in March 2025; 2,084 sq. ft. in March 2024
- Total number of listed homes in Georgia: 54,743 in March 2025; 44,921 in March 2024
18. Minnesota

- 1-year change in median list price: -0.2% (-$900)
- Median list prices by year: $399,000 in March 2025; $399,900 in March 2024
- Median list price per square foot: $205 in March 2025; $206 in March 2024
- Median size of a listed home: 1,965 sq. ft. in March 2025; 1,985 sq. ft. in March 2024
- Total number of listed homes in Minnesota: 16,832 in March 2025; 16,542 in March 2024
17. Massachusetts

- 1-year change in median list price: -0.2% (-$1,900)
- Median list prices by year: $798,000 in March 2025; $799,900 in March 2024
- Median list price per square foot: $446 in March 2025; $442 in March 2024
- Median size of a listed home: 1,824 sq. ft. in March 2025; 1,835 sq. ft. in March 2024
- Total number of listed homes in Massachusetts: 8,633 in March 2025; 7,480 in March 2024
16. Nevada
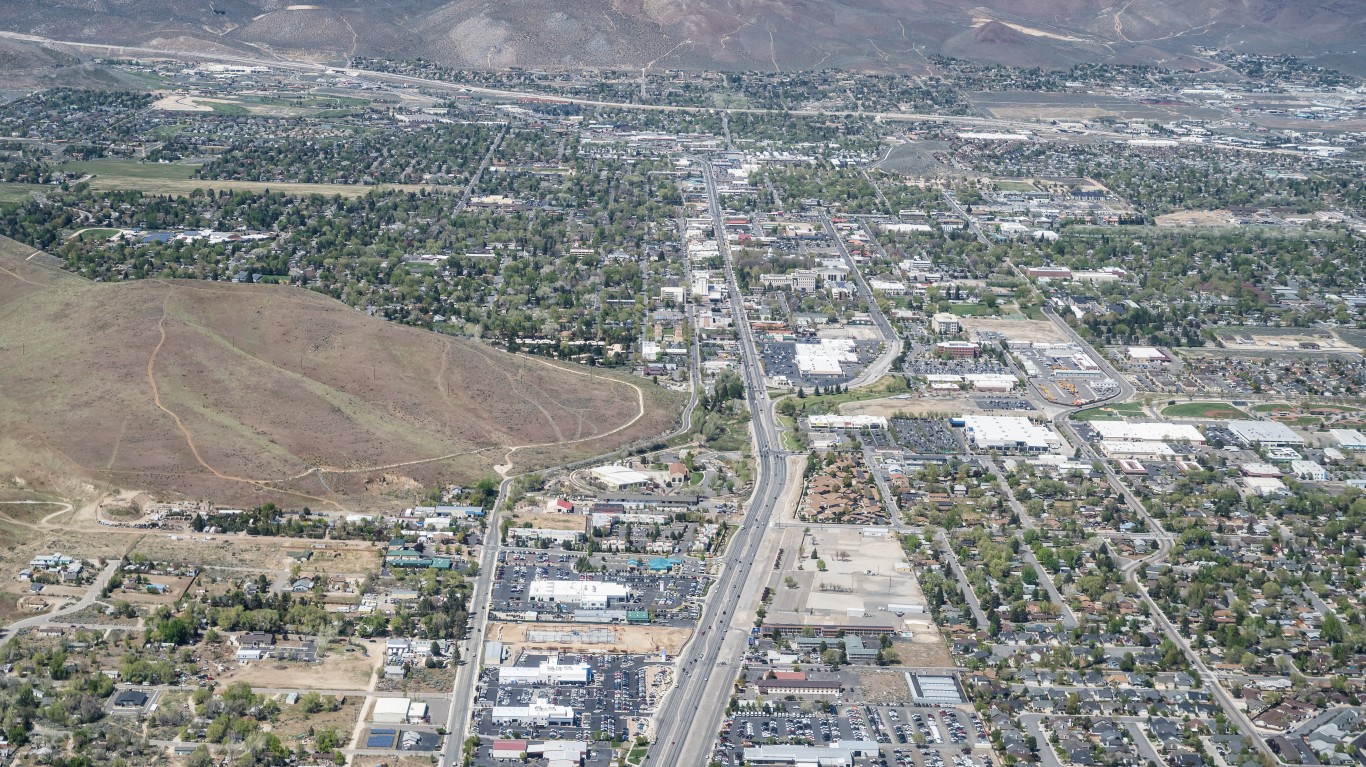
- 1-year change in median list price: -0.4% (-$2,000)
- Median list prices by year: $485,000 in March 2025; $487,000 in March 2024
- Median list price per square foot: $276 in March 2025; $269 in March 2024
- Median size of a listed home: 1,780 sq. ft. in March 2025; 1,875 sq. ft. in March 2024
- Total number of listed homes in Nevada: 14,427 in March 2025; 10,703 in March 2024
15. Indiana

- 1-year change in median list price: -0.6% (-$1,800)
- Median list prices by year: $289,900 in March 2025; $291,700 in March 2024
- Median list price per square foot: $156 in March 2025; $153 in March 2024
- Median size of a listed home: 1,860 sq. ft. in March 2025; 1,909 sq. ft. in March 2024
- Total number of listed homes in Indiana: 19,868 in March 2025; 16,961 in March 2024
14. Connecticut

- 1-year change in median list price: -0.7% (-$3,750)
- Median list prices by year: $499,900 in March 2025; $503,650 in March 2024
- Median list price per square foot: $291 in March 2025; $262 in March 2024
- Median size of a listed home: 1,742 sq. ft. in March 2025; 1,973 sq. ft. in March 2024
- Total number of listed homes in Connecticut: 7,451 in March 2025; 7,459 in March 2024
13. Arizona

- 1-year change in median list price: -1.0% (-$5,000)
- Median list prices by year: $495,000 in March 2025; $500,000 in March 2024
- Median list price per square foot: $269 in March 2025; $272 in March 2024
- Median size of a listed home: 1,913 sq. ft. in March 2025; 1,955 sq. ft. in March 2024
- Total number of listed homes in Arizona: 39,046 in March 2025; 34,074 in March 2024
12. Kentucky

- 1-year change in median list price: -1.3% (-$3,900)
- Median list prices by year: $300,000 in March 2025; $303,900 in March 2024
- Median list price per square foot: $170 in March 2025; $167 in March 2024
- Median size of a listed home: 1,800 sq. ft. in March 2025; 1,824 sq. ft. in March 2024
- Total number of listed homes in Kentucky: 14,791 in March 2025; 12,751 in March 2024
11. Alabama

- 1-year change in median list price: -1.4% (-$4,645)
- Median list prices by year: $325,000 in March 2025; $329,645 in March 2024
- Median list price per square foot: $166 in March 2025; $166 in March 2024
- Median size of a listed home: 1,891 sq. ft. in March 2025; 1,920 sq. ft. in March 2024
- Total number of listed homes in Alabama: 25,958 in March 2025; 21,004 in March 2024
10. Utah

- 1-year change in median list price: -1.7% (-$10,010)
- Median list prices by year: $589,990 in March 2025; $600,000 in March 2024
- Median list price per square foot: $259 in March 2025; $263 in March 2024
- Median size of a listed home: 2,404 sq. ft. in March 2025; 2,442 sq. ft. in March 2024
- Total number of listed homes in Utah: 15,987 in March 2025; 13,047 in March 2024
9. Tennessee

- 1-year change in median list price: -1.7% (-$7,600)
- Median list prices by year: $427,400 in March 2025; $435,000 in March 2024
- Median list price per square foot: $231 in March 2025; $230 in March 2024
- Median size of a listed home: 1,960 sq. ft. in March 2025; 1,998 sq. ft. in March 2024
- Total number of listed homes in Tennessee: 38,611 in March 2025; 29,516 in March 2024
8. Delaware

- 1-year change in median list price: -2.0% (-$10,000)
- Median list prices by year: $485,000 in March 2025; $495,000 in March 2024
- Median list price per square foot: $238 in March 2025; $233 in March 2024
- Median size of a listed home: 2,045 sq. ft. in March 2025; 2,126 sq. ft. in March 2024
- Total number of listed homes in Delaware: 4,366 in March 2025; 3,812 in March 2024
7. Nebraska

- 1-year change in median list price: -2.2% (-$8,000)
- Median list prices by year: $350,000 in March 2025; $358,000 in March 2024
- Median list price per square foot: $174 in March 2025; $174 in March 2024
- Median size of a listed home: 2,080 sq. ft. in March 2025; 2,083 sq. ft. in March 2024
- Total number of listed homes in Nebraska: 6,944 in March 2025; 6,396 in March 2024
6. Florida

- 1-year change in median list price: -3.5% (-$15,900)
- Median list prices by year: $439,000 in March 2025; $454,900 in March 2024
- Median list price per square foot: $269 in March 2025; $278 in March 2024
- Median size of a listed home: 1,618 sq. ft. in March 2025; 1,642 sq. ft. in March 2024
- Total number of listed homes in Florida: 224,057 in March 2025; 184,926 in March 2024
5. Colorado

- 1-year change in median list price: -4.2% (-$24,900)
- Median list prices by year: $575,000 in March 2025; $599,900 in March 2024
- Median list price per square foot: $291 in March 2025; $296 in March 2024
- Median size of a listed home: 1,990 sq. ft. in March 2025; 2,073 sq. ft. in March 2024
- Total number of listed homes in Colorado: 30,195 in March 2025; 22,961 in March 2024
4. Iowa

- 1-year change in median list price: -5.0% (-$15,000)
- Median list prices by year: $284,900 in March 2025; $299,900 in March 2024
- Median list price per square foot: $174 in March 2025; $177 in March 2024
- Median size of a listed home: 1,594 sq. ft. in March 2025; 1,620 sq. ft. in March 2024
- Total number of listed homes in Iowa: 12,995 in March 2025; 11,548 in March 2024
3. Illinois

- 1-year change in median list price: -5.3% (-$16,916)
- Median list prices by year: $299,984 in March 2025; $316,900 in March 2024
- Median list price per square foot: $183 in March 2025; $181 in March 2024
- Median size of a listed home: 1,657 sq. ft. in March 2025; 1,710 sq. ft. in March 2024
- Total number of listed homes in Illinois: 30,824 in March 2025; 30,893 in March 2024
2. Hawaii

- 1-year change in median list price: -7.1% (-$60,000)
- Median list prices by year: $785,000 in March 2025; $845,000 in March 2024
- Median list price per square foot: $723 in March 2025; $721 in March 2024
- Median size of a listed home: 1,104 sq. ft. in March 2025; 1,178 sq. ft. in March 2024
- Total number of listed homes in Hawaii: 7,617 in March 2025; 5,856 in March 2024
1. Kansas

- 1-year change in median list price: -8.1% (-$25,500)
- Median list prices by year: $289,000 in March 2025; $314,500 in March 2024
- Median list price per square foot: $152 in March 2025; $155 in March 2024
- Median size of a listed home: 1,950 sq. ft. in March 2025; 2,015 sq. ft. in March 2024
- Total number of listed homes in Kansas: 9,920 in March 2025; 9,037 in March 2024
The post States Where Home Prices are Actually Falling appeared first on 24/7 Wall St..


