


The Greed and Fear Tango: Markets in April 2025
The Market Judgment!

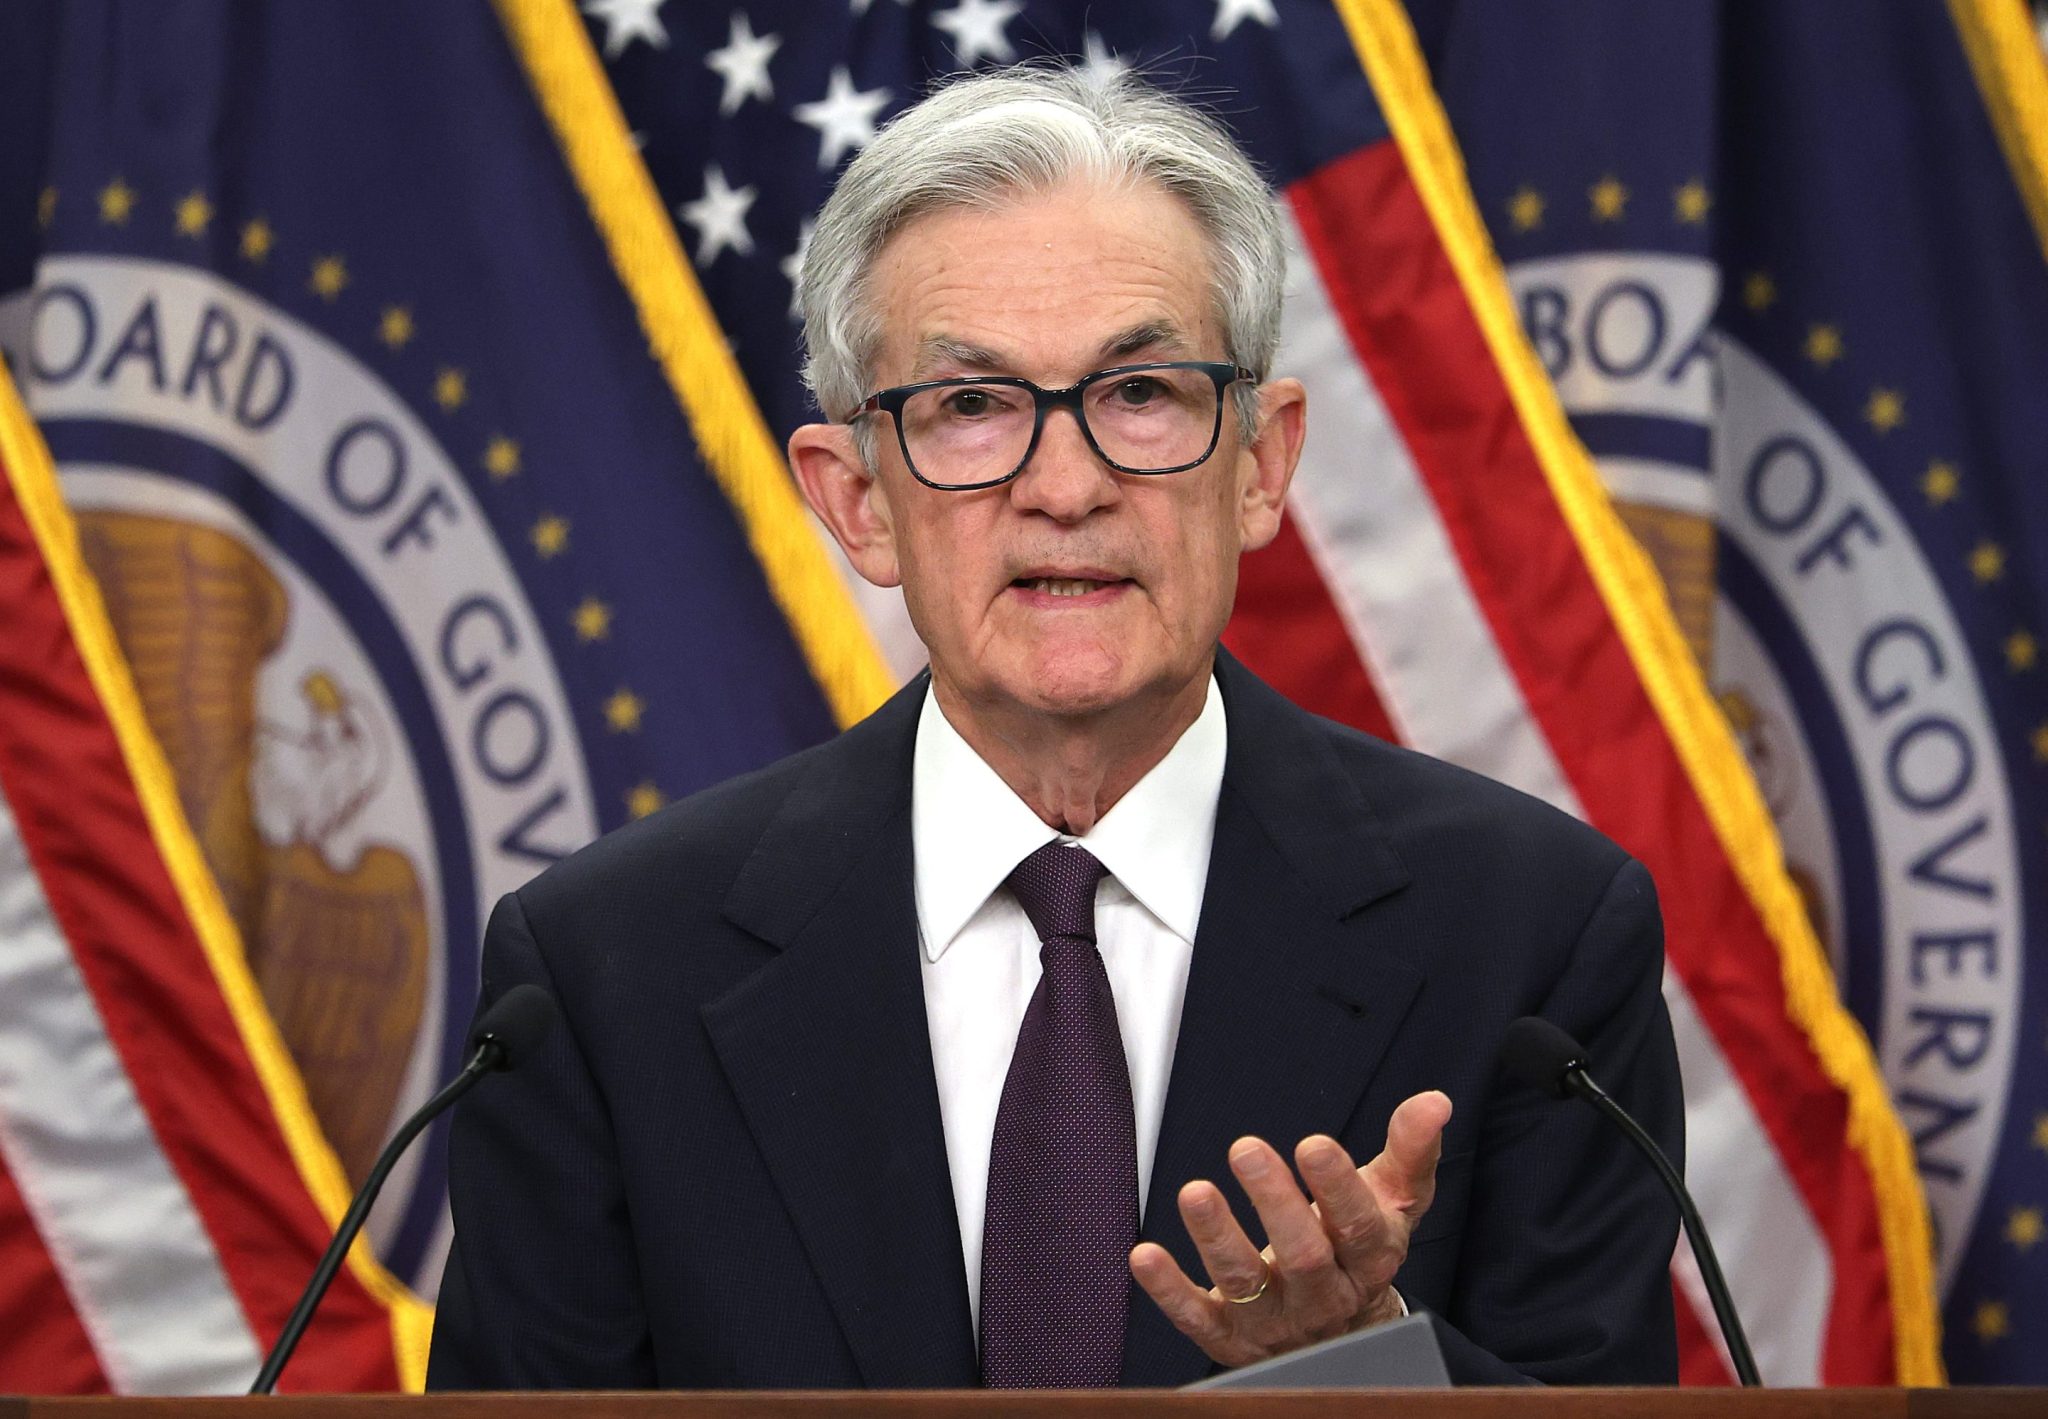
I started the month on a trip to Latin America, just as the tariff story hit my newsfeed and the market reacted with a sell off that knocked more than $9 trillion in market cap for global equities in the next two days. The month was off to a bad start, and tariffs remained the lead story for much of the month, contributing to both its biggest down days (with stories of trade war escalation) and to the biggest up days (with news of relief from the fight). To add to the volatility, there was talk midway through the month of replacing Jerome Powell as the Fed Chair, and assorted news adding to uncertainty about the direction of the economy. An observer reading just the news stories and asked to guess what the market did during the month would probably have bet on stocks falling steeply, but he or she would have lost that bet, because markets managed to surprise us all again, ending the month almost where they began.
Equities: Storm Clouds gather (and dissipate)!
It would be an understatement to describe equity markets in April 2025 as volatile, with the equity indices going through stomach wrenching up and down movements intraday and across days, as investors struggled to price in a world of tariffs, trade wars and policy uncertainty.
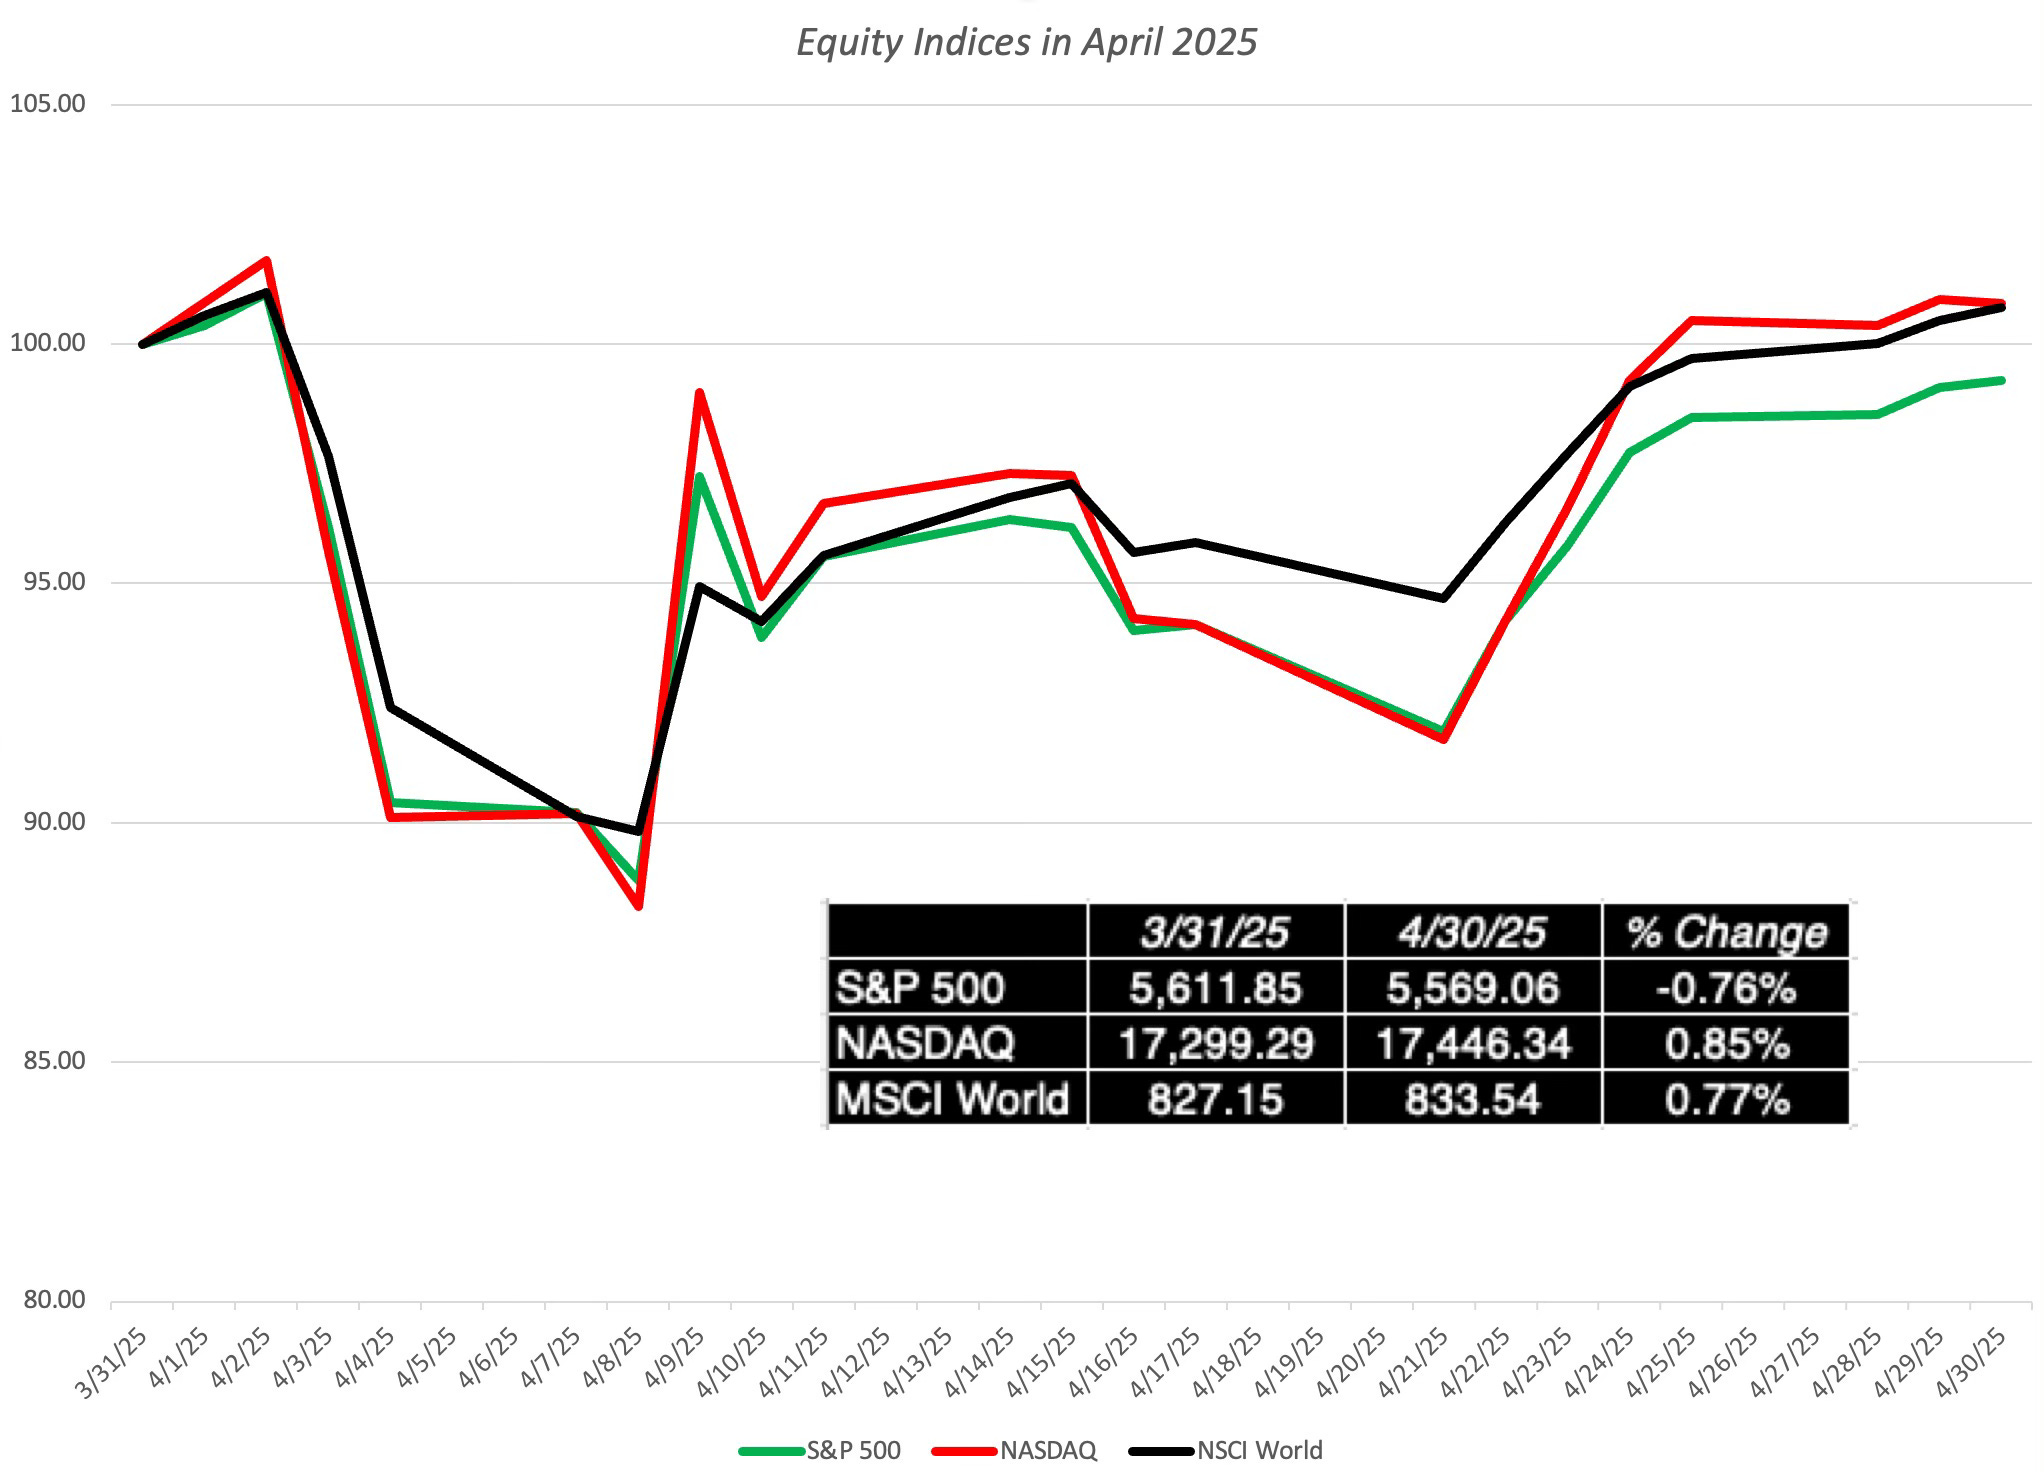
The journey that the indices went through during the course of the month has been extraordinary. Each of the indices lost close to 10% in the first two days of the month, went deeper into the hole in the second week of the month, but by the end of the month, they had each found their way back to almost where they started the month at, with the S&P 500, NASDAQ and the MSCI world index all within 1% of their start-of-the-month levels.
As I noted in my post right after the first couple of days of this month, where I framed the market crisis around tariffs, the indices sometimes obscure markets shifts that are occurring under the surface, and that looking at all publicly traded stocks on an aggregated basis provides a more complete picture. I will start by looking at the regional breakdown of what the month delivered in terms of change in market cap, in both dollar and percentage terms:
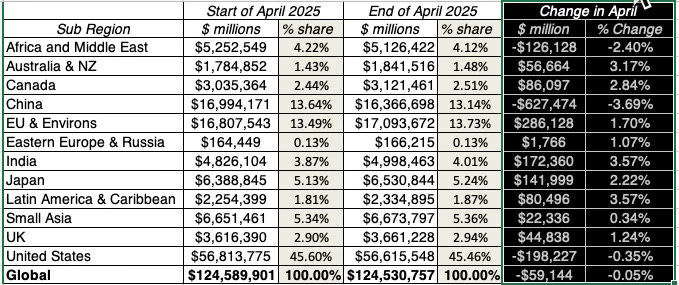
The crisis may have been birthed in the United States, but as has been the case with market crises in this century, it has spread across the world, with disparate impacts. There are truly no standouts in either direction, with China being the worst performing region, in terms of percentage change in dollar value, down 3.69%, and India and Latin America tied for best performing, up 3.57%. These are dollar returns, and since the US dollar came under selling pressure during the course of the month, the local currency returns were worse, especially in markets, like the EU, where the Euro gained about 5% in the courser of the month.
At the start of the month, as has been the case for much of the last decade, the focus was on technology, partly because of its large weight in overall equity value at the start of 2025, and partly because of the punishment meted out to tech stocks during the first quarter of the year. Focusing just on US equities, technology companies, which accounted for 29.4% of the overall market capitalization of all US companies at the start of 2025, lost $2.34 trillion (about 13.19%) in market capitalization in the first quarter of 2025. In the first few days of April, that trend continued as technology initially led the rout, losing an additional $1.78 trillion, but by the end of April, tech had made at least a partial comeback:
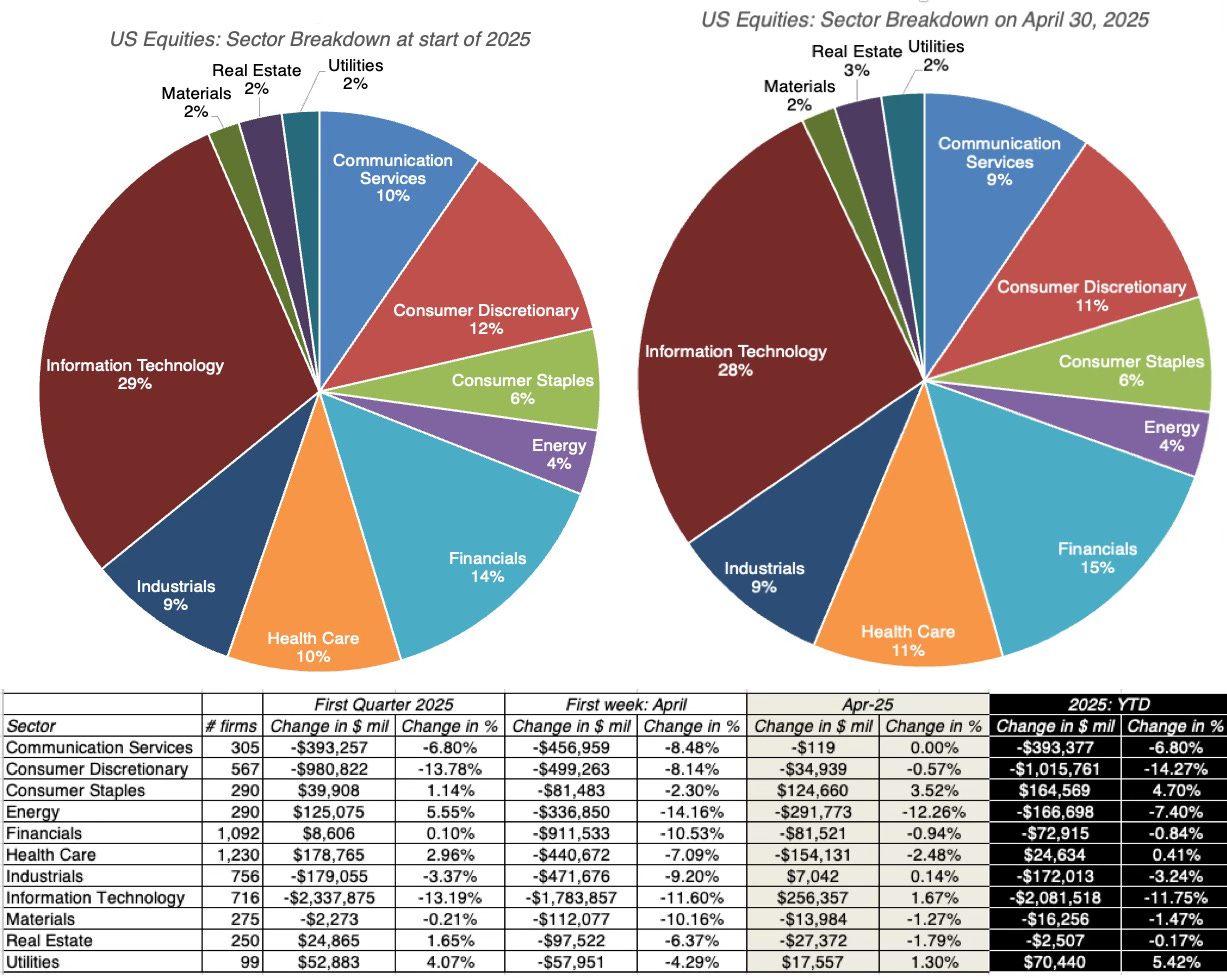
As you can see, technology ended the month as the second best performing sector, up 1.67% for the month, and in spite of the handwringing about their poor performance, their share of the market cap pie has barely changed after the first four months of 2025. While the first quarter continues to weigh the sector down, as was the case in 2022, the obituaries written for technology investing may have been premature.
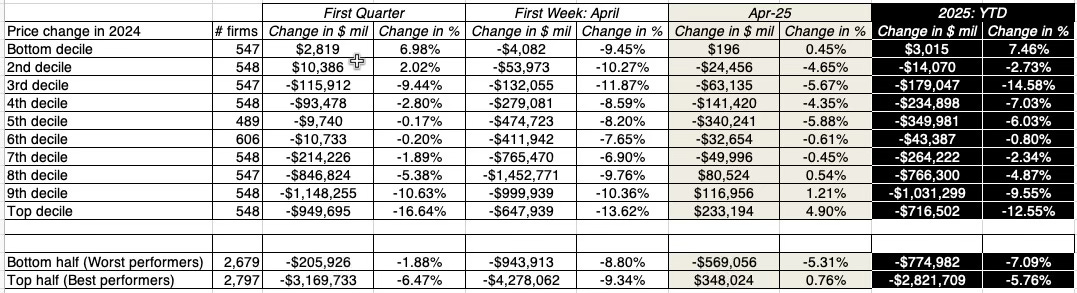
Staying in the weeds, I also looked at the push and pull of growth versus value, by breaking US equities down into deciles based on earnings to price ratios and assessing their performance leading into April and in April 2025 alone:
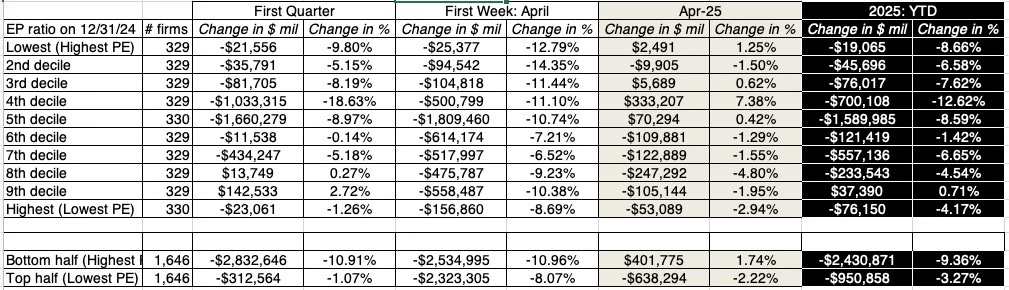
As you can see, while there is no clearly discernible pattern across deciles of US stocks based upon earnings to price ratios, breaking down US stocks into a top and bottom half, based upon the ratio, yields the conclusion that while high PE stocks had a bad start to the year, losing 10.9% of their value in the first quarter, they made a comeback in April, up 1.74% for the year, while low PE stocks were down 2.22% for the month. That pattern of a reversal in April 2025 of trends that had been forming in the first quarter of 2025 shows upon in other proxies for the value versus growth tussle:
Looking at companies broken down by market capitalization into deciles, you find that larger cap companies outperformed small cap stocks during April,
Breaking down stocks based on dividends, dividend paying stocks and companies buying back stock underperformed non-cash returning stocks, indicating that if there was a flight to safety in April, it did not take the conventional form.
Finally, I classified companies based upon their stock price performance in 2024 to see if what we are seeing in 2025 is just a correction of overreach in 2024. After all, if that is the case, we should see the stocks that have performed the best in 2024 be the ones that have taken the most punishment this year:
As you can see, momentum returned in force in April, with the best performing stocks in 2024 up 0.76% during the month, while the worst performing stocks of 2024 were down 5.31% for the month. In fact, the year-to-date numbers for 2025 indicate that momentum remains in the driver's seat, extending a long period of outperformance.
In sum, the market stresses in April 2025 seems to have pushed the market back into its 2024 ways, after a first quarter that promised reversal, as technology, growth and momentum all made a comeback in the last three weeks of April. The performance of the Mag Seven, which represent a combination of all three forces (large, high growth and technology), in April provides a tangible measure of this shift:
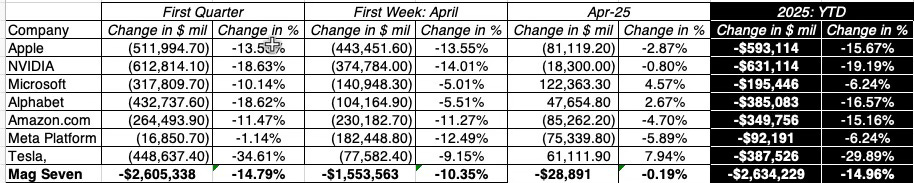
The Mag Seven have had a bad year to date, losing $2.6 trillion in market capitalization, but they made a comeback from the depths to finish April at about the same market cap that they had at the start of the month, recovering almost all of the $1.55 trillion that they lost in the first week of the month.
In short, not only did equities recover in the last three weeks of April 2025, but there seems have been a shift in sentiment back the forces that have borne markets upwards for the last few years, with technology, growth and momentum returning as market drivers. Of course, three weeks is a short time, but this is a trend worth watching for the rest of this year.
The Rest of the Market: Swirling Winds?
As equities careened through April 2025 between panic and delirium, the other asset classes were surprisingly staid, at least on the surface, starting with the US treasuries. Unlike other crises, where US treasuries saws funds flow in, pushing down yields and pushing up prices, treasury rates remained relatively stable through much of April:
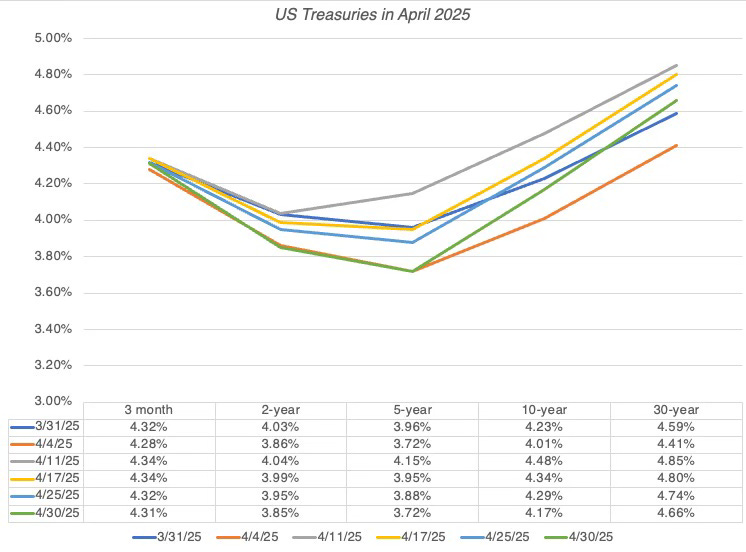
Not only did rates remain almost unchanged across the maturity spectrum, but they were stable on a week-to-week basis. The yield curve, downward sloping for much of the last two years, is now u-shaped, with 3-month rates and 2-year rates higher than 5-year rates, before reverting back to higher longer term (10-year and 30-year rates). Coming from the camp that we read too much economic significance into yield curve slopes and dynamics, I am reluctant to draw big conclusions, but some of this can be attributed to expectations of higher inflation in the near term. There is another force at play in this crisis that has not been as visible in past ones, at least in the US treasury market, and that is concerns about the trustworthiness of the US government Though this is still an early indicator, that can be seen in the sovereign CDS market, where investors pay for insurance against default risk, and where the US CDS spread has risen in April:
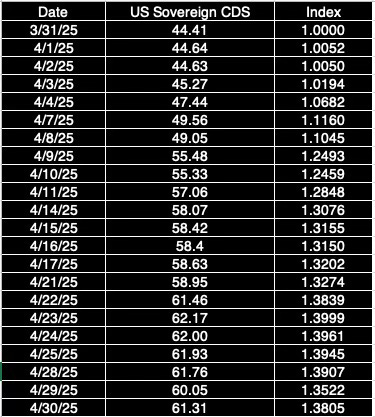
The sovereign CDS spread for the US has risen about 38% during the course of this month, and the interesting part is that much of that rise happened in the last three weeks of the month, and during the first week, when equities were collapsing. The rise in perceptions of US default risk is more likely to have been precipitated by the threat to fire Jerome Powell, and by extension to the independence of the Fed as an institution. While that threat was withdrawn, the sovereign CDS spread has stayed high, and it will be worth watching whether it will come back down or whether some permanent damage has been done to US treasuries as a safe haven. As some of you who follow my thinking on riskfree rates may know, I argue that the riskfree rate in a currency is not necessarily the government bond rate in that currency, and that the default spread has to netted out from the government bond rate two get to a riskfree rate, if the sovereign in question is not viewed as default-free. Building on that principle, I may soon have to revisit my practice of using the US treasury rate as the riskfree rate in US dollars and net out a default spread for the US from that rate to get to a riskfree rate.
During April 2025, commodity prices were also on the move, and in the graph below, I look at oil prices as well as an overall commodity index during the month:
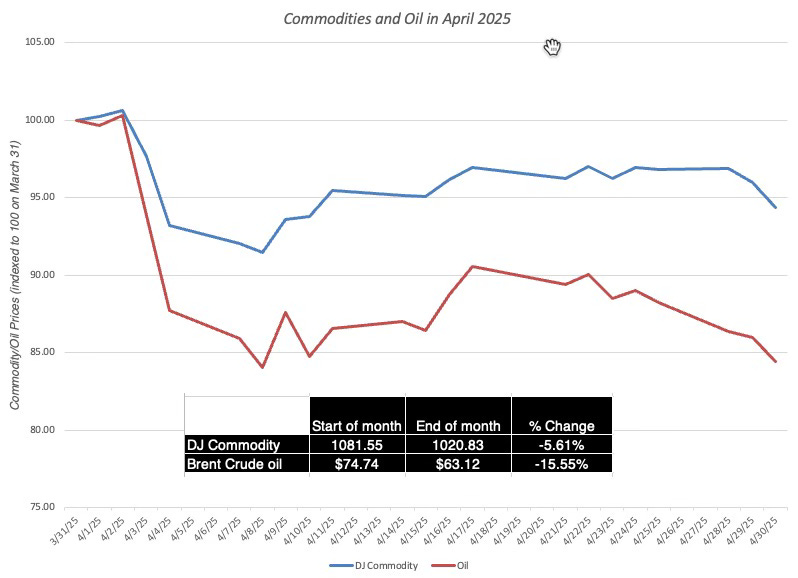
In the first third of the month, oil prices, in particular, and commodity prices, in general, joined equities, as they moved down, but in the last part of the month, they delinked, and stayed down, even as stock prices bounced back up. To the extent that the demand for commodities is driven by real economic growth, that would suggest that at least in the near term, the tariffs that precipitated the crisis will slow down global economies and reduce demand for commodities.
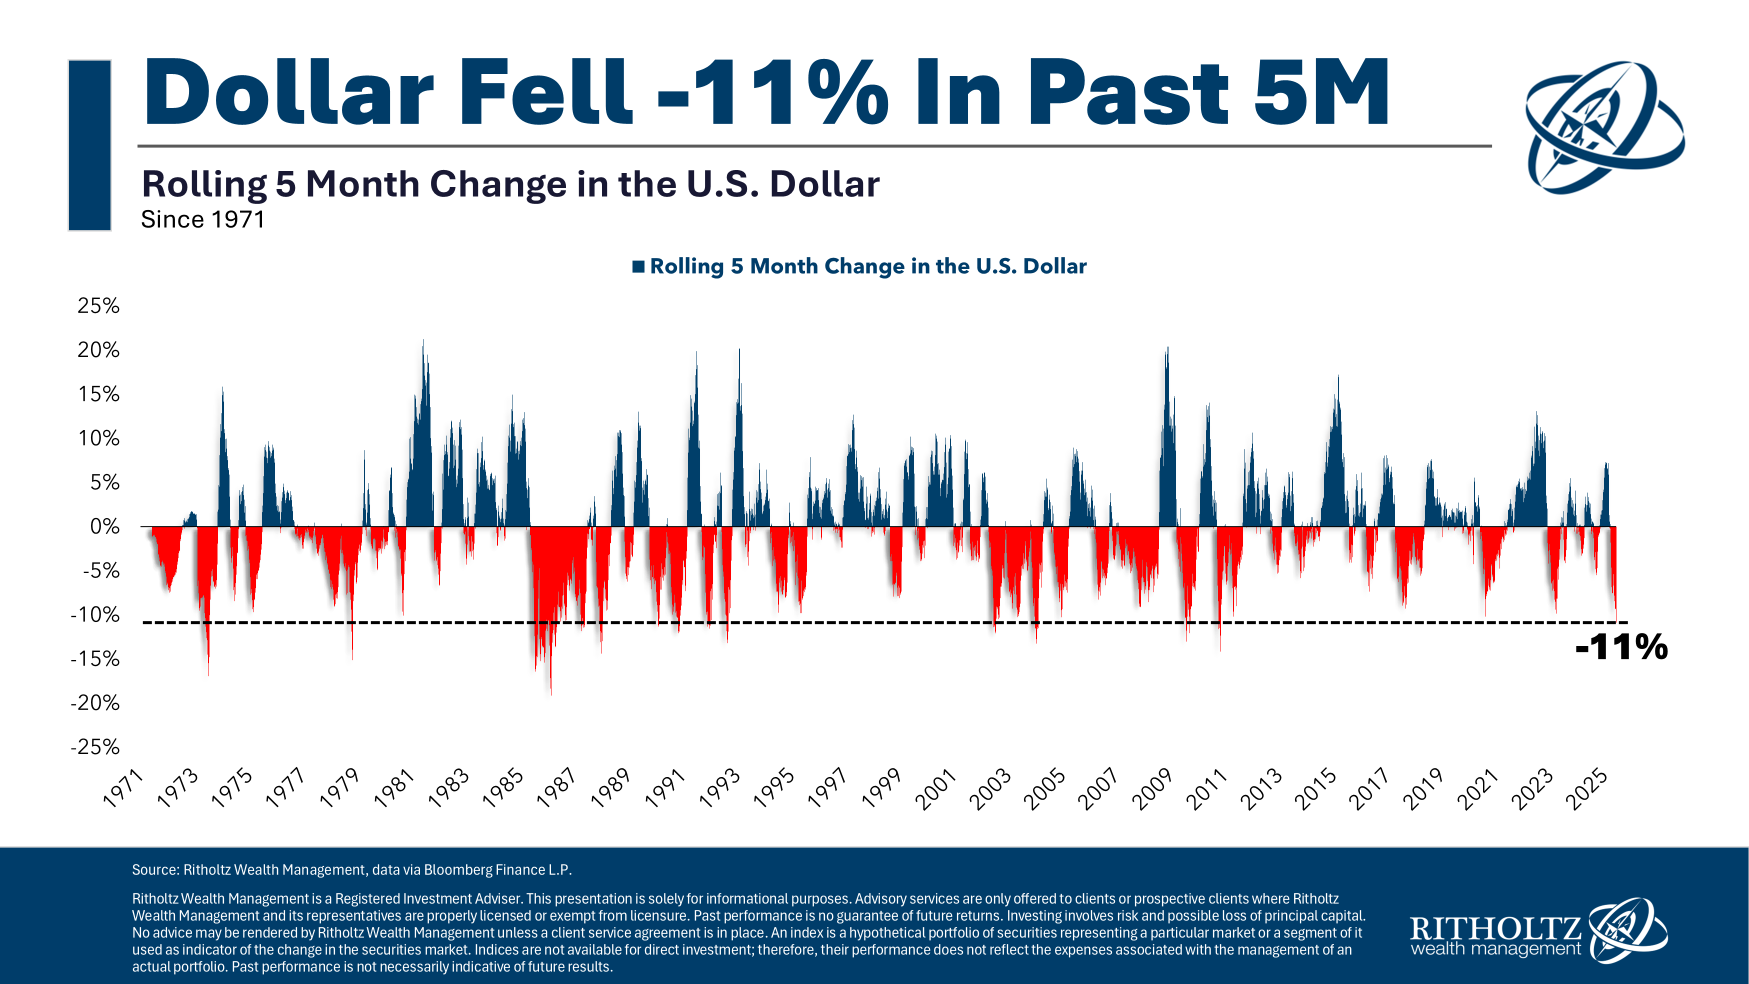
The concerns about central banking independence that triggered the surge in the US sovereign CDS spread also played out in currency markets, where the US dollar, already weakened in the first quarter, continued its decline in April. In the graph below, I look at the dollar-euro exchange rate and an index measuring the strength of the dollar against multiples currencies.
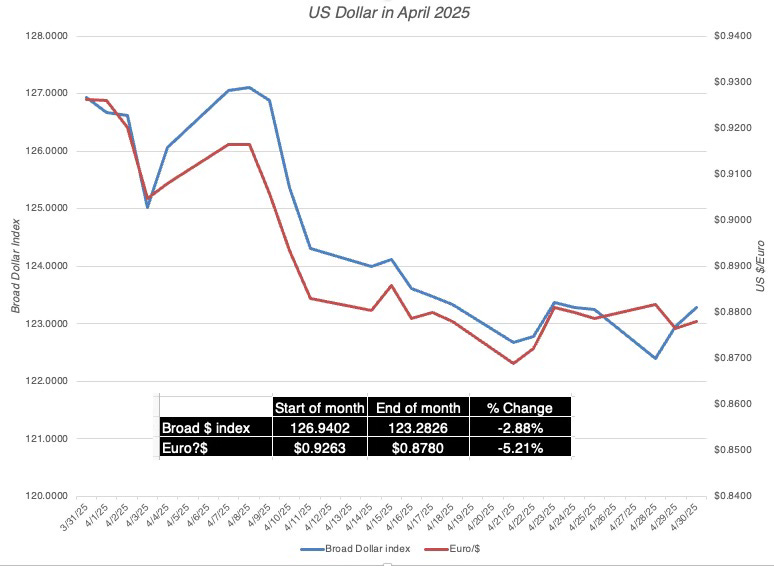
The dollar continued its decline in April, down about 3% against a broad basket of currencies, and more than 5% against the Euro.
Finally, I looked at two other investment classes - gold and bitcoin - for the same reasons that I brought them into the discussion at the start of April. They are collectibles, i.e., investments that investors are drawn to during crisis periods or when they lose faith in paper currencies and governments:
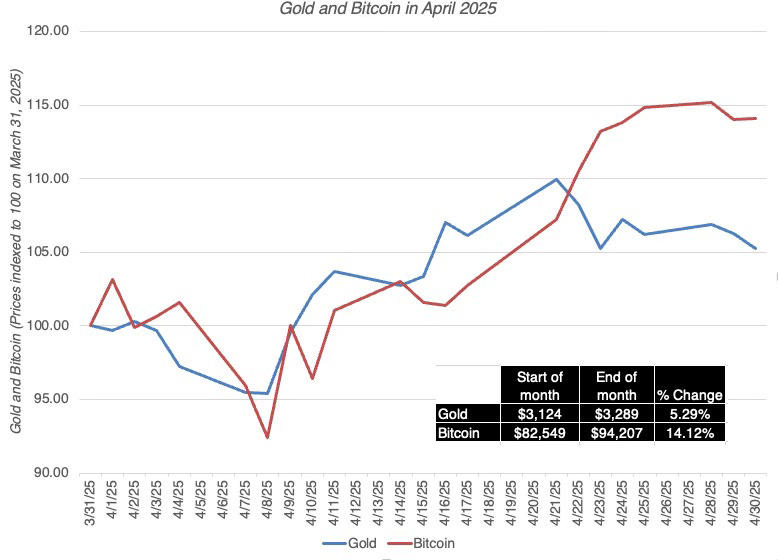
Gold had a good month in April, up about 5.3%, and hitting $3.500 towards the end of the month, but Bitcoin did even better rising almost 14.12% during the course of the month. That said, the fact that financial asset markets (equity and bond) recovered over the second part of the month made this a month where collectibles were not put to their test as crisis investments, and the rise in both can be attributed more to the loss of trust that has driven the sovereign CDS spread up and the US dollar down.
Risk and Co-movement
Early in April, I argued that the one number that would track the balance between greed and fear in markets would be the price of risk in markets, and I resolved to estimate that price every day, through April, for both equity and bond markets. With equity markets, the price of risk is the equity risk premium, and at least in my estimation process, it is a forward-looking number determined by the level of stock prices and expected cash flows. In the table below, I report on my estimates of the equity risk premium for the S&P 500 every trading day in April, in conjunction with the VIX, and equity volatility index that should be correlated:
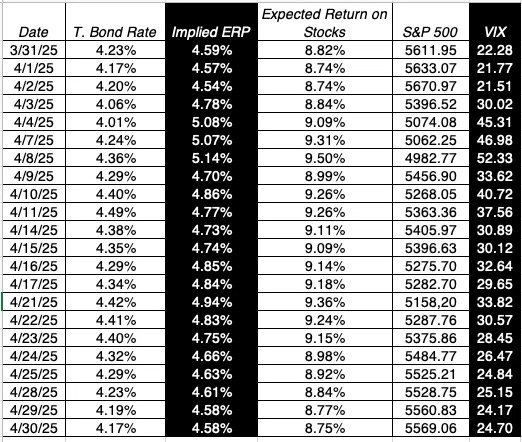
After rising above 5% in the first third of the month, the equity risk premium decreased in fits and starts over the rest of the month to end at almost the same value (4.58%) as at the start of the month (4.59%). In parallel, the VIX soared in the first few days of the month to peak at 52.33 on April 8, and then decreased over the rest of the month to a level (24.70) close to where it was at the start of the month (22.28).
In the bond market, the price of risk takes the form of default spreads, and these spreads followed a similar path to the equity risk measures:
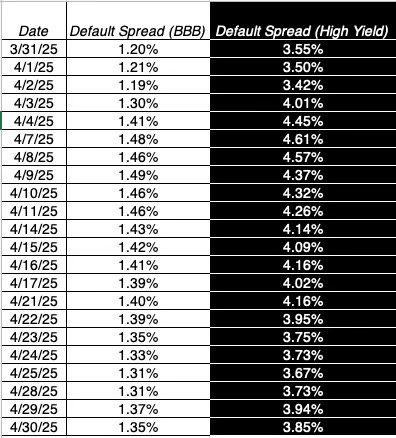
The default spread on high yield bonds surged, rising by more than 1% between the start of the month and April 7, before declining, but unlike the equity risk measures, the bond default spreads did end the month at levels higher than at the start, indicating at least at this point that near term concerns about the economy and the ensuing default risk have not subsided.
As a final exercise, I looked at the correlation in price changes across investment classes - stocks, treasuries, investment-grade and high-yield corporate bonds, commodities, gold and bitcoin:
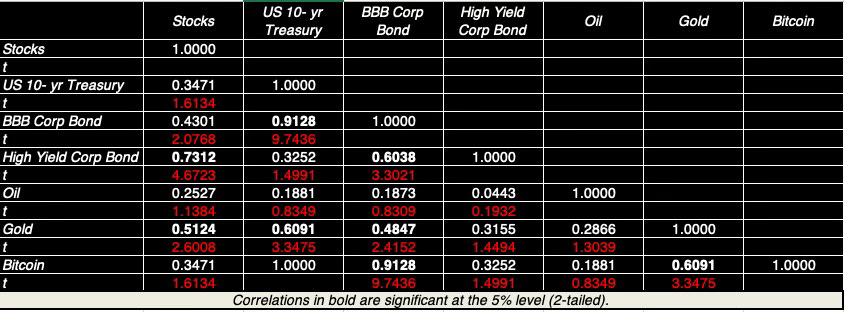
With the caveat that this is just 22 trading days in one month, it does yield some preliminary results about co-movements. First, stock and treasury bond prices moved together much of the month, not something that you would expect during a crisis, when bond prices gain as stock prices fall. Second, while both gold and bitcoin prices moved with stocks, gold prices movements were more closely tied to stock price movements, at least during the month. In sum, the movement across asset markets affirms our conclusion from looking at company-level data that this was more a month of asset reprising than panic selling or buying.
In sum, if I were to summarize what the data is pointing me towards, here are the general conclusions that I would draw, albeit with a small sample:
The market movements through much of the month were less driven by panic and more by investors trying to reprice companies to reflect a world with more trade barriers and tariffs and political turmoil.
While equities, in the aggregate, ended the month roughly where they started the month, a shift in sentiment seemed to occur in the last three weeks of the month, as technology, growth and momentum, three forces that seemed to be in retreat in the first quarter of 2025, made a come back.
With US treasuries, there was little movement on the rates, but under the surface, there were shifts that could be tectonic in the long term. There was clearly a drop in trust in the US government and its institutions, which played out in rising sovereign CDS spreads and a declining dollar, and trust once lost can be difficult to gain back.
The investment classes that are most vulnerable to the real economy, i.e.. commodities and higher yield corporate bonds, were down for the month, indicating a slowing down of global economic growth.
In the coming months, we will see whether the last three weeks of April were an aberration or the start of something bigger.
Lessons Learned
Every market meltdown carries pain to investors, but that pain is often spread unevenly across these investors, with the variation driven as much as by what they held coming into the crisis, as it is by how they behaved in response to the sell off. I am not sure April 2025 falls into the crisis column, but it did feel like one early in the month, and as I look back at the month, I come back to three market characteristics that stood out.
Market resilience: In the last five years, markets have repeatedly not only got the big trends right, but they have also shown far more resilience than any expert group. I would wager that if you had given a group of macro economists or market strategists just the news stories that came out during the course of the month and asked them to guess how they would play out in market reaction, almost none of them would have guessed the actual outcome (of flat markets). At the time of COVID, I argued that one reason for market resilience is that market influence has become diffuse, with social media and alternative sources of information supplementing and often replacing the traditional influencers - the financial press, media and investment talking heads, and market movements are less driven by large portfolio managers exhibiting herd behavior and more by disparate groups of traders, with different motives, models and patterns.
Market power: A key reason for the turnaround in markets during April was the administration's decision to walk back, reverse or delay actions that the market reacted to strongly and negatively. The "liberation day" tariffs that triggered the initial sell off have largely been put on hold or suspended, and the talk about replacing the Fed Chair was walked back quickly the week after it was made. In short, an administration that has been impervious to Wall Street journal editorials, warnings from economists and counter threats from other governments has been willing to bend to market selling pressure.
Market unpredictability: As markets rose and fell during the course of the month, the debate about the value added by active investing kicked into full gear. I heard quite a few advocates of active investing argue that it was during times like this (volatility and crisis) that the "sage counsel" and "timely decisions" of wealth or fund managers would protect investors on the downside. I would suggest the opposite, and am willing to bet that the extent of damage that April did to investor portfolios was directly proportional to how much time they spent watching CNBC and listening to (or reading) what market experts told them to do.
On a personal note, I stuck to my resolution early in the crisis to use it to stay true to my investment philosophy. As someone who stinks at market timing, I made no attempt to buy and sell the market through the month, perhaps leaving a great deal of money on the table, or more likely, saving myself just as much from getting the timing wrong. In the middle of April, I talked about three strands of contrarian investing, and in that post, I put myself in the opportunistic contrarian camp. I did use the mid-month sell off to add BYD, a stock that I like, to my portfolio, when its price dipped below my limit price ($80). Palantir and Mercado Libre (my two other limit buys) came close but not low enough to break through my limits, but I am willing to wait, revisiting my valuations along the way.
I do have some portfolio maintenance work that I need to do in the coming weeks, especially on the six of the seven Mag Seven stocks that remain in my portfolio (Tesla is out of my portfolio and Nvidia is at a quarter of my original holding). As these companies report their first quarter earnings, I plan to revisit my valuations from last year, when in the face of mild to moderate over valuation, I chose to maintain my holdings. As in prior years, I will post my assessments of value and my hold/sell judgments, but that has to wait because I do have more immediate priorities. First, as a teacher, with the semester end approaching, I have a stack of grading that has to get done. Second, as a father, I am looking forward to my daughter having her first child next week, and the market and my portfolio take a distant second place to getting acquainted with my new granddaughter.
YouTube Video
My Posts (from April 2025)
Data Links