


Short Term Energy Outlook, March 2025
The EIA Short Term Energy Outlook (STEO) was published recently. An estimate for World C+C output from 2015 to 2026, with forecast values for 2024 to 2026 based on the recent STEO n chart below. A slightly different methodology was used this month by looking at World C+C minus US C+C from the EIA’s International […]
The EIA Short Term Energy Outlook (STEO) was published recently. An estimate for World C+C output from 2015 to 2026, with forecast values for 2024 to 2026 based on the recent STEO n chart below. A slightly different methodology was used this month by looking at World C+C minus US C+C from the EIA’s International Energy Statistics and World crude minus US Crude as reported in the STEO to find World minus US condensate output. The trend for the condensate data from 2018 to 2023 was used to project condensate from 2024 to 2026 for World minus US and then the forecast for US C+C was added to the World minus US crude forecast along with the condensate forecast to arrive at World C+C.
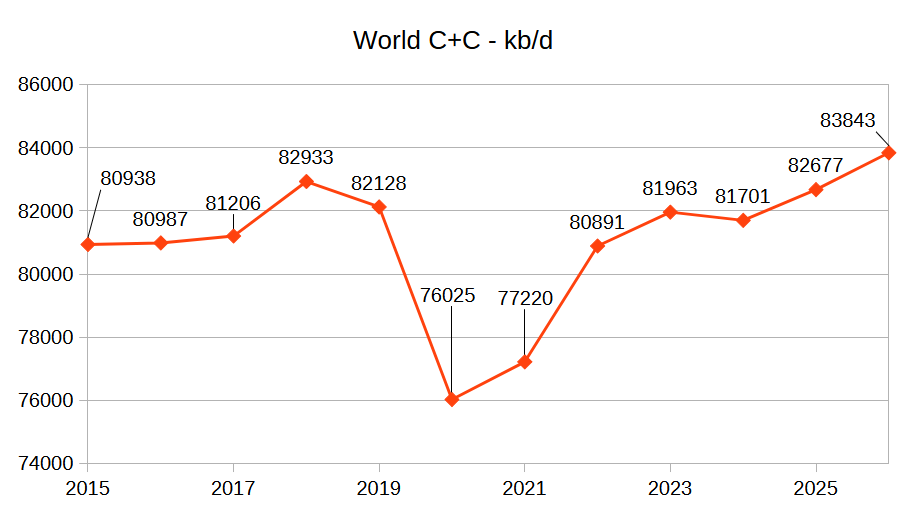
World C+C increases by 2142 kb/d from 2024 to 2026 an annual increase of 1071 kb/d. The growth rate looks optimistic especially when the low prices of the STEO forecast are considered. Last month’s estimates were 81861, 83229, and 84460 for 2024, 2025 and 2026 respectively, so the estimates are all lower this month compared to last month.
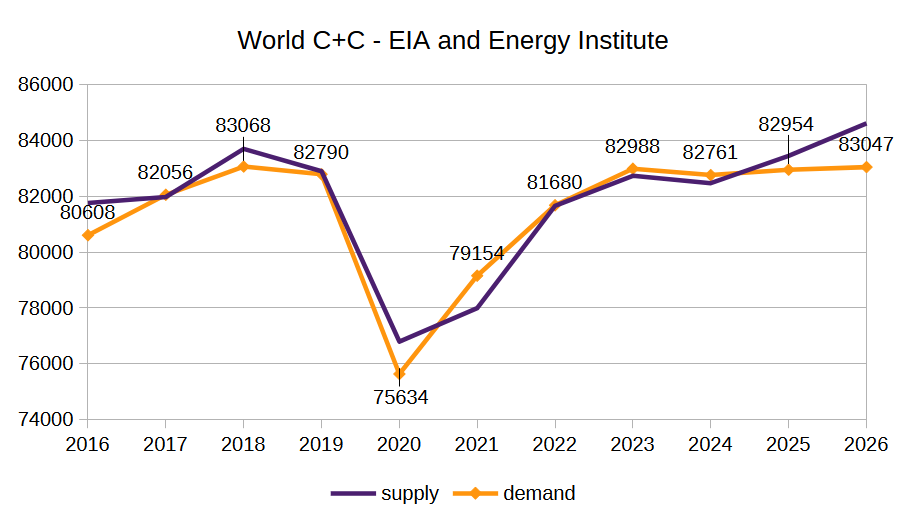
The demand estimate above is the EIA and Energy Institute estimate from my previous post, the supply curve is adjusted 770 kb/d higher to coincide with the Energy Institute C+C estimate from 2015 to 2023, the 770 kb/d is also added to my 2024 to 2026 forecast in the previous chart. I expect the 2026 forecast (84613 kb/d in the chart above) is at least 1000 kb/d too high.
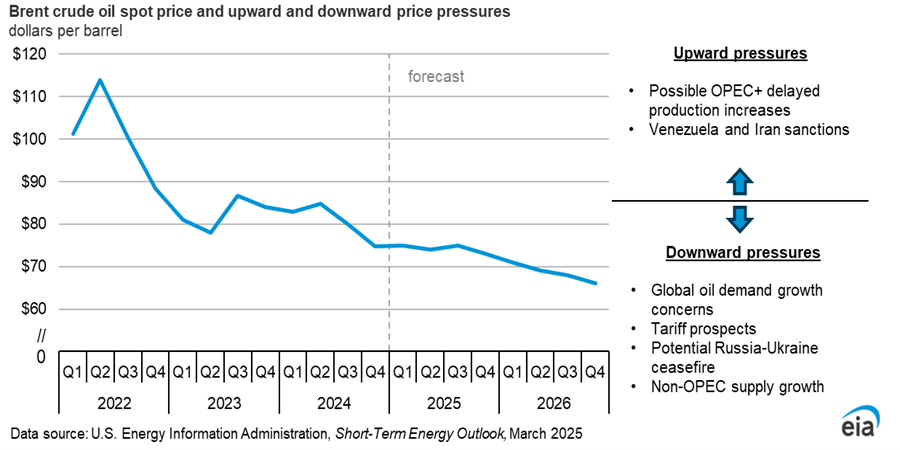
Brent oil prices are expected to fall due to oversupply in late 2025 and 2026.
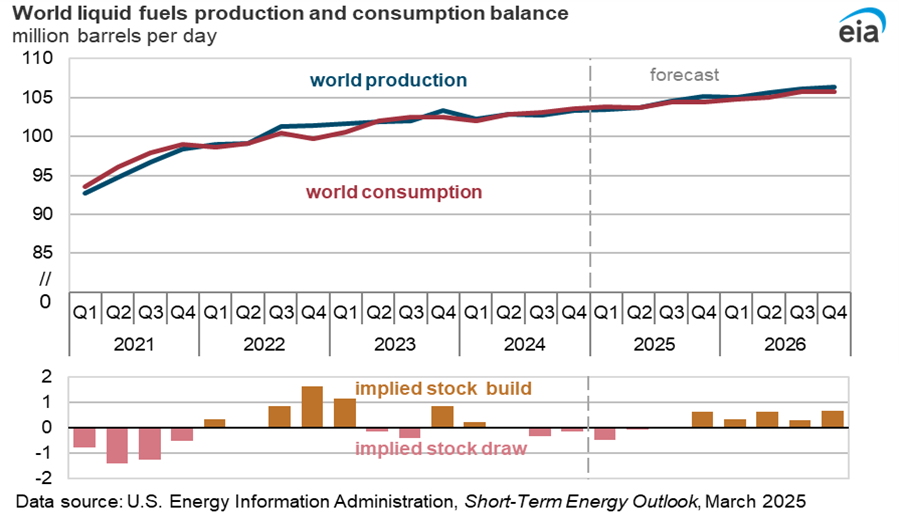
I believe looking at C+C supply and demand is more useful that total liquids, particularly when considering the price of crude oil. The demand estimate by the EIA looks more reasonable in my view than the supply estimate. At a Brent price of $68/b in 2026, I would not expect a surge in C+C output.
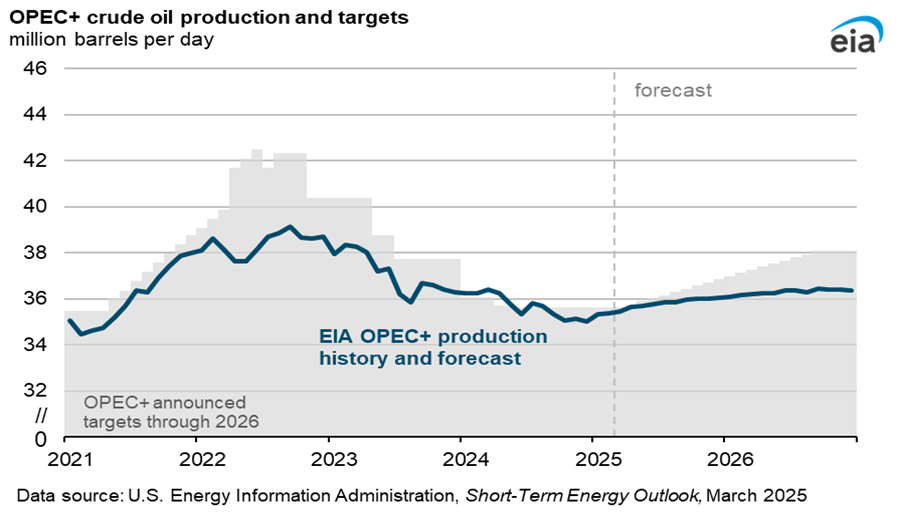
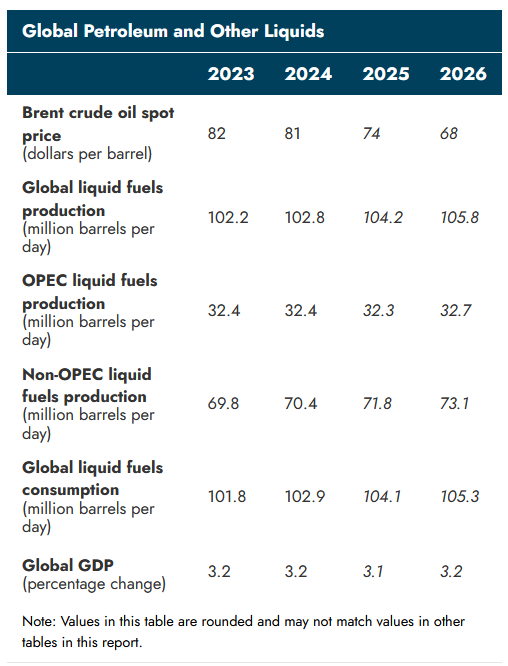
The Trump administration is trying to reduce oil exports from Iran and Venezuela which will tend to reduce OPEC+ crude output, low oil prices may also reduce the growth in OPEC+ output so more than 36 Mb/d seems unlikely if the oil price forecast proves correct.
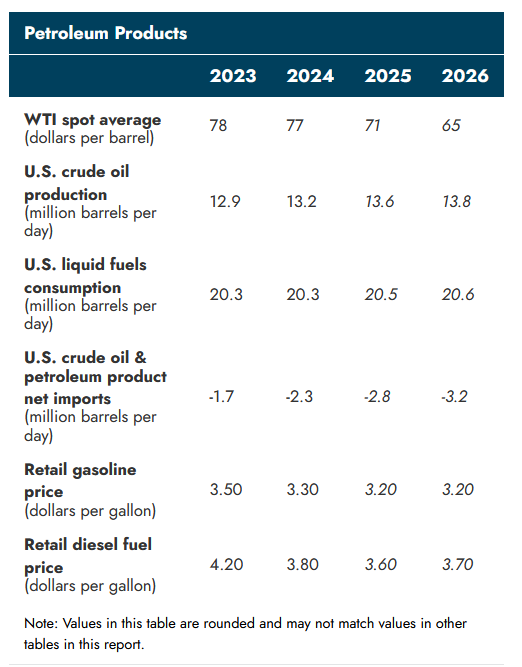
The forecast for WTI in 2026 is $3/b higher than last month’s report and output in 2026 is also higher by 100 kb/d compared to last month as a result. The other figures in this table are unchanged from last month’s report.
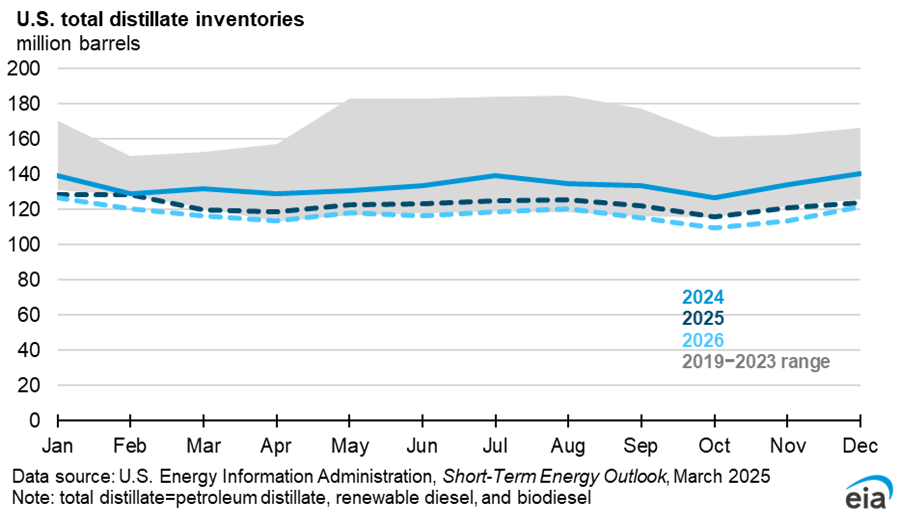
Distillate stocks are expected to fall to below the 2019-2023 range in 2026 due to refinery closures and higher demand.
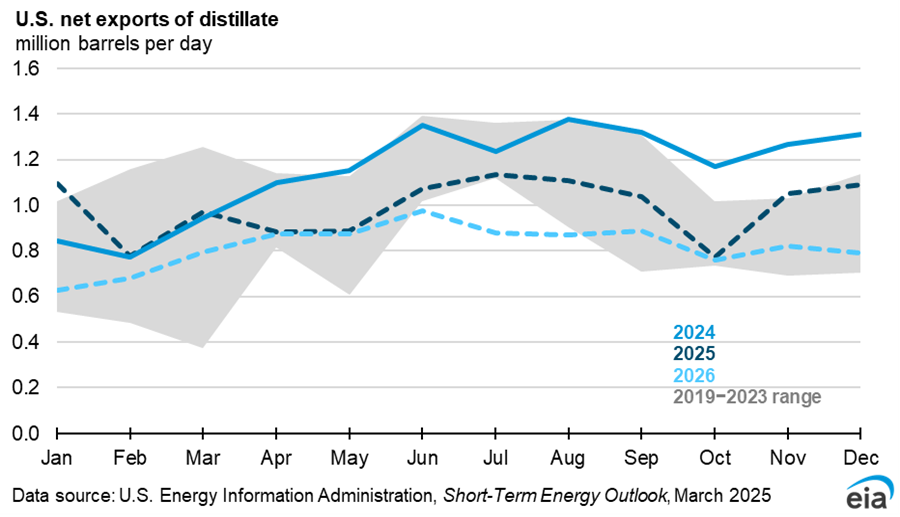
The lower stock levels of distillate fuel will lead to lower net exports in 2025 and 2026 compared to 2024.
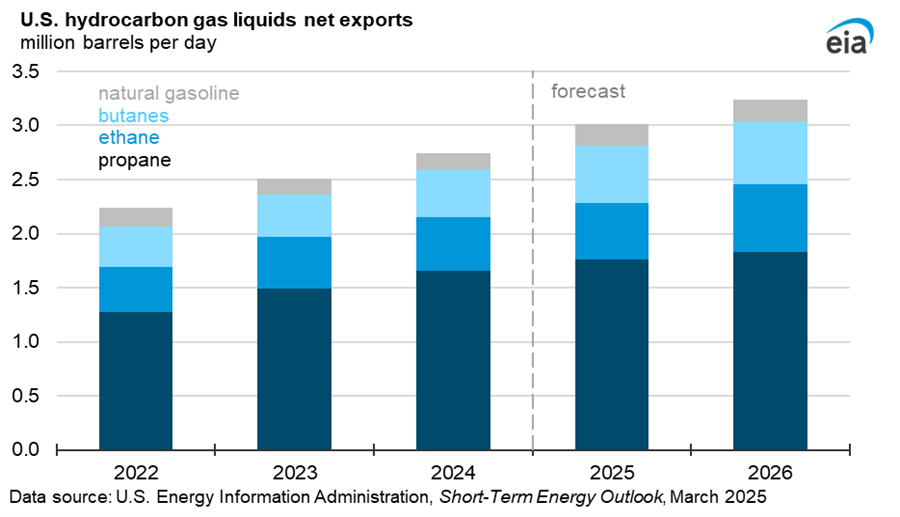
Net exports of HGL increase by 10% in 2025 and by 7% in 2026 as there is high demand for these products in the petrochemical industry. Domestic consumption is expected to be flat for these products while higher natural gas output leads to higher NGL output most of which will be exported.
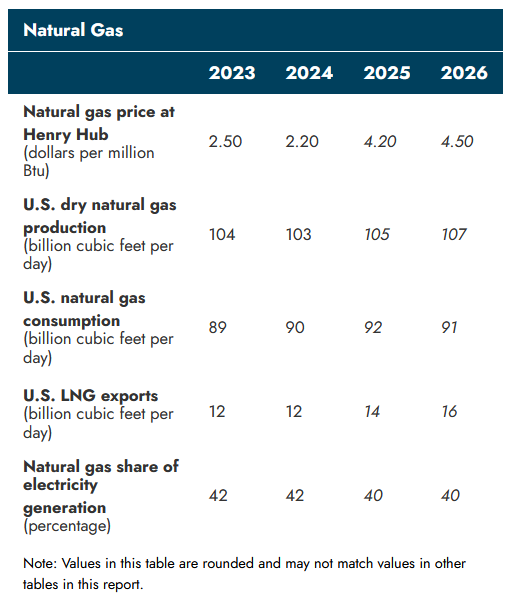
Last month the forecast for Natural gas price was $3.80 and $4.20 per MMBtu in 2025 and 2026, so a significant increase this month with 2025 at $4.20/MMBtu and 2026 at $4.50/MMBtu. Also the consumption of natural gas has been revised higher in 2025 and 2026 relative to last month’s forecast (91 and 90 BCF/d.)
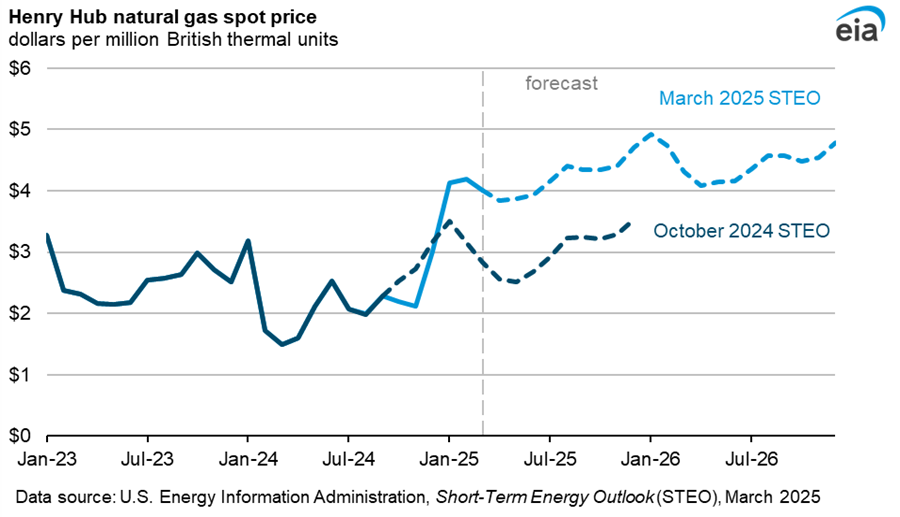
The chart above shows the significant change in the natural gas price forecast since last October. For the first two months of 2025 natural gas prices were $0.80/MMBtu higher than the October 2024 forecast.
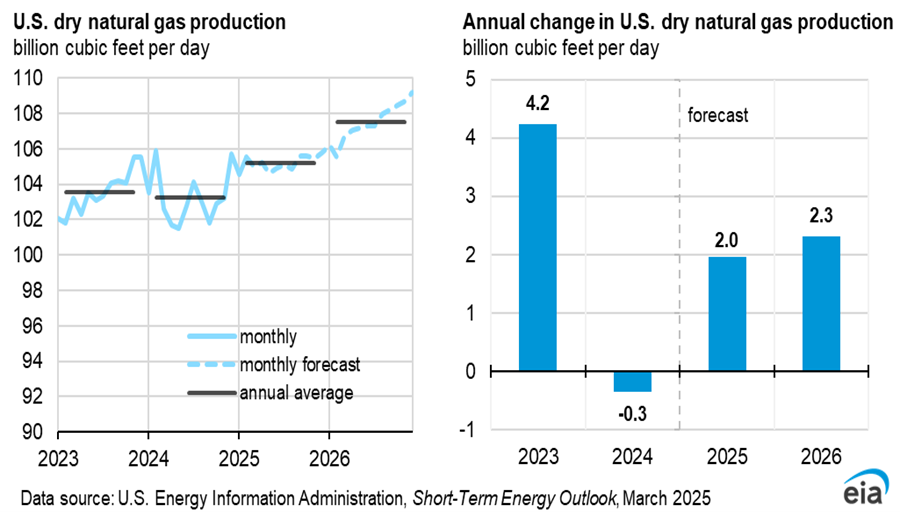
Natural gas output was 103 BCF/d in 2024 and rises by 2% in both 2025 and 2026.
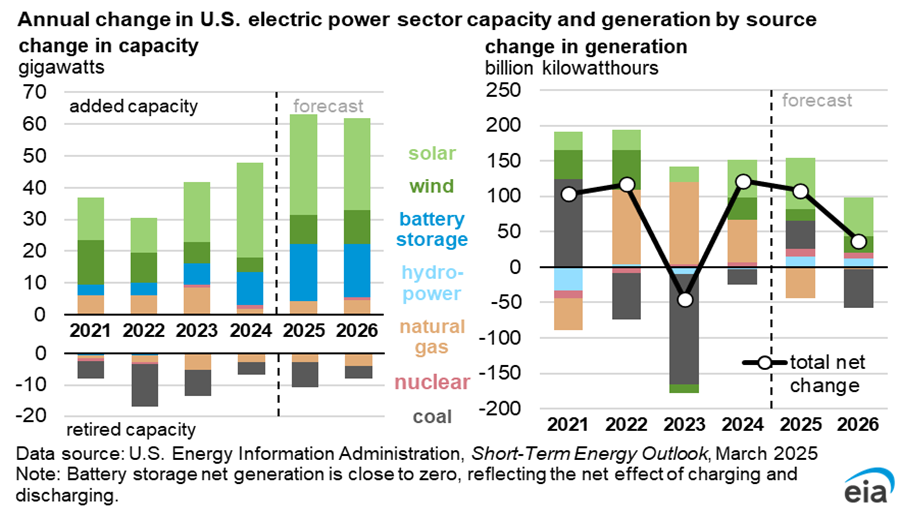
The right hand side of the chart above is more useful as comparisons of capacity are not straightforward between wind, solar and fossil fuel sources. Output from natural gas power plants falls in 2025 due to higher natural gas prices and coal output is expected to fall in 2026 due to a smaller increase in demand and expanding output from wind and solar.
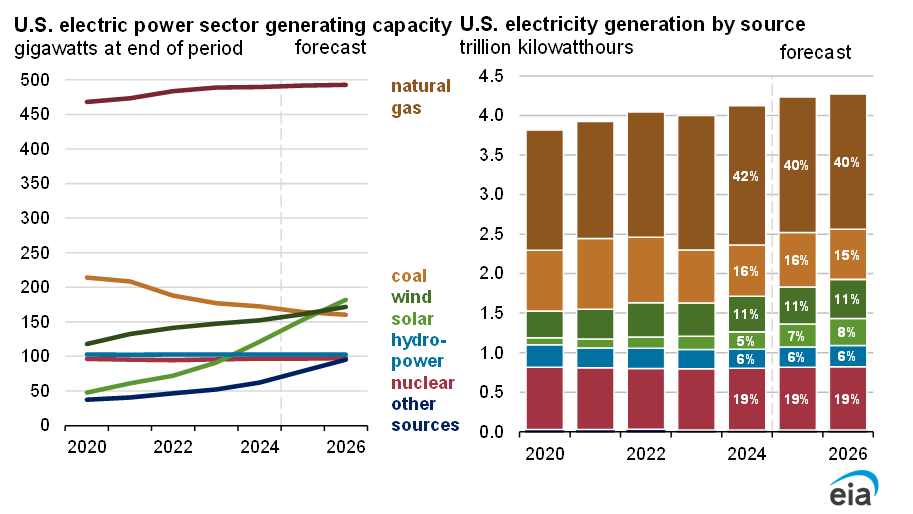
Again I focus on the right side of the chart above (generation of electric power) with wind and solar output expanding to 19% of total power output by 2026 and all non-fossil fuel power output (solar, wind, hydro, and nuclear) at 44% of total electric power output (up from 41% in 2024.)
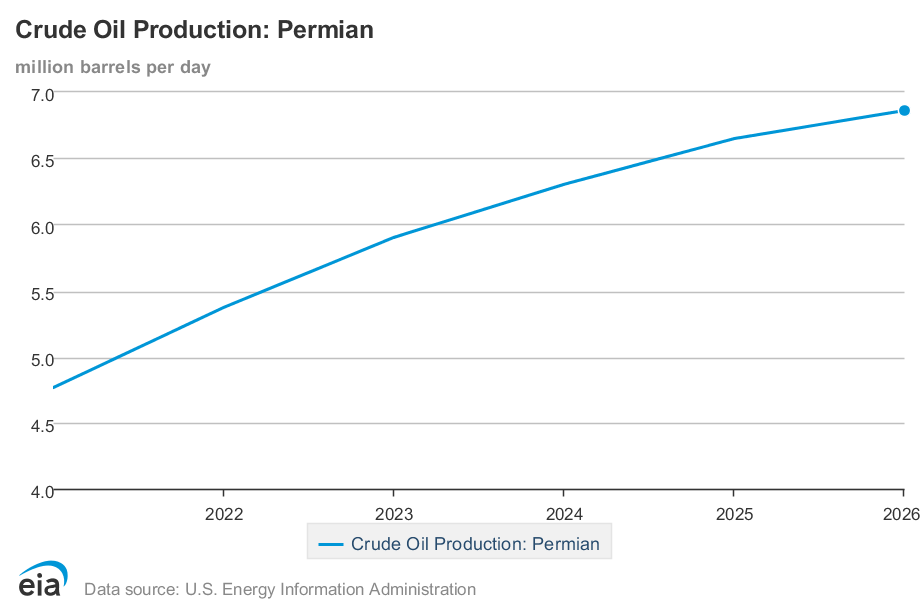
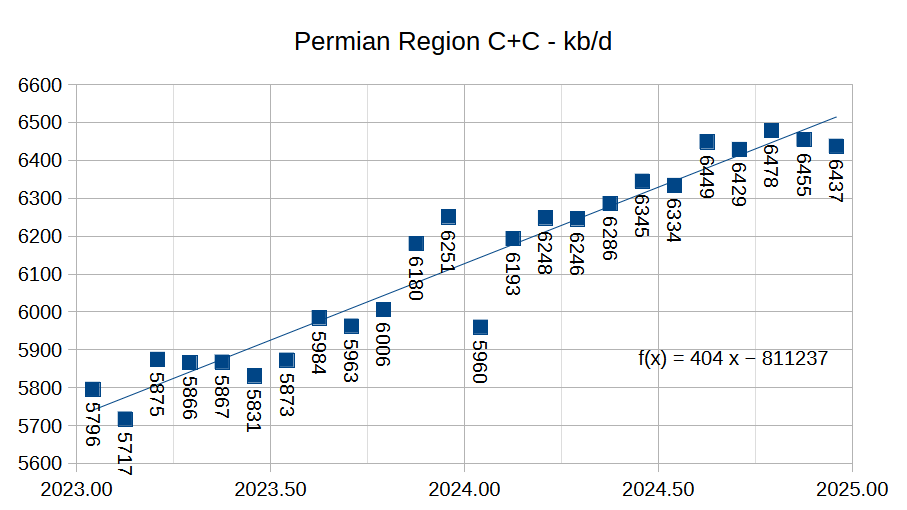
Permian region C+C output increases to 6.85 Mb/d in 2026 from 6.3 Mb/d in 2024 in the March 2025 STEO.
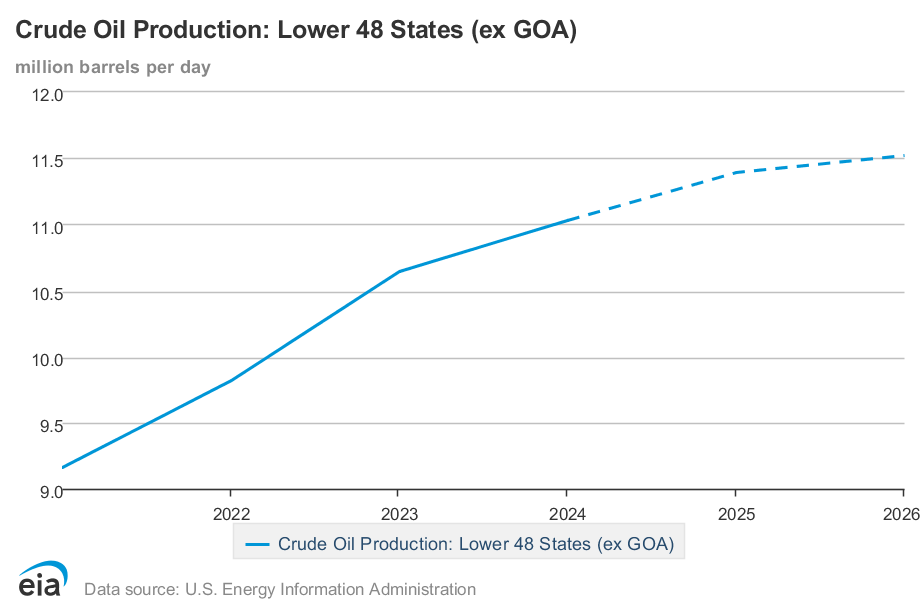
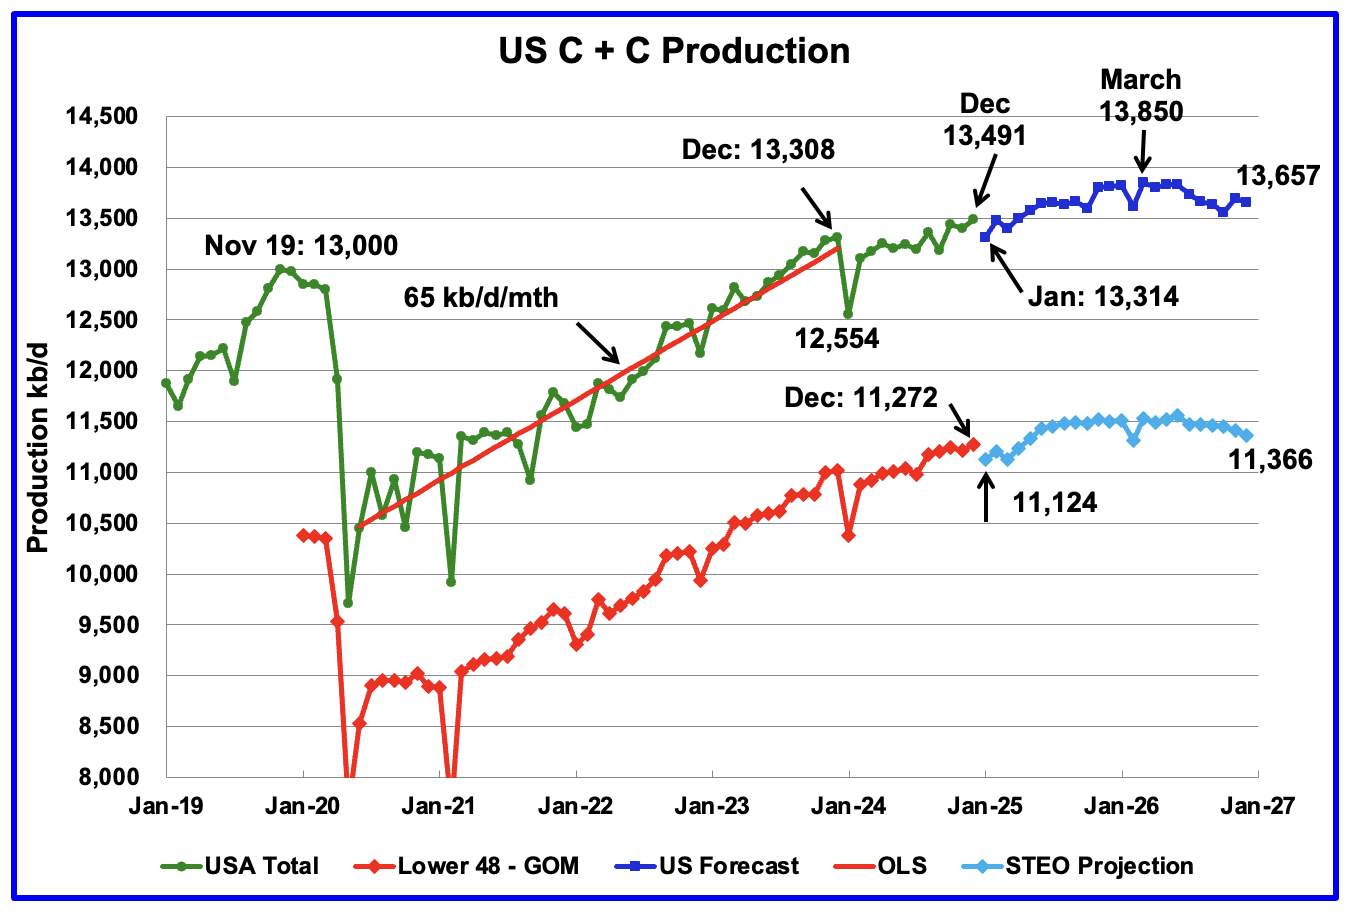
US L48 excluding GOM C+C output increases from 11.03 Mb/d in 2024 to 11.52 Mb/d in 2026. All of this increase comes from the Permian Basin.
Estimate of Permian region output using latest TX RRC and NM OCD and EIA data. Output has been pretty flat from August 2024 to December 2024.