


How to read Bitcoin candlestick charts (no experience needed)
Key takeawaysBitcoin candlesticks are a popular tool among Bitcoin traders because they’re simple to use and offer an intuitive way to understand market sentiment and trends.Bitcoin candlesticks are a rather old tool. Rice trader Honma Munehisa invented them in Japan as far back as the 18th century. They were introduced to Western financial markets in the late 1980s.They help you understand bullish and bearish patterns in technical analysis. This knowledge will get you started with Bitcoin trading.They should not be your only tool for making informed decisions. Combine them with other Bitcoin technical indicators, such as MAs (moving averages) or the RSI (relative strength index). If you’re new to Bitcoin (BTC) trading, you may wonder when to buy or sell. Candlestick charts, like bar or line graphs, have time on the horizontal axis, while the price data appears on the vertical axis. They provide a quick look at price movements when compared to other charts. You can quickly view the highest and lowest prices of an asset in a specific timeframe. It also shows the opening and closing prices. Here are a few Bitcoin trading tips to help you get started. No experience needed; this is your go-to crypto candlestick chart tutorial, perfectly suited for beginners.Why analyze Bitcoin price chartsTechnical analysis is an essential and consolidated strategy for trading markets. When Bitcoin (BTC) started picking up and prices fluctuated more, crypto investors began to use trading strategies from traditional markets, such as candlesticks. For Bitcoin technical analysis basics, platforms like TradingView offer many charts and technical indicators. These tools are easy to use, even for beginners. TradingView crypto charts can be candlestick, bar or line charts. Here’s an overview of candlestick charts to help you get started with Bitcoin trading.Beginner’s guide to Bitcoin candlestick chartsCandlestick charts are a milestone in technical analysis and the first step to understanding Bitcoin charts. They are an essential tool to quickly assess price movements and market trends in the short term. They represent Bitcoin’s price trends on a chart over a specific period, such as one hour, four hours or one day, to help traders make better decisions.Why use candlesticks? They help traders visualize price movements over time.They help identify bullish, bearish or consolidation sentiment.They help spot patterns like reversals or continuations to predict future price movements.A candlestick represents four key price points:The opening price at the start of the periodThe closing price at the end of the periodThe highest price reached during the periodThe lowest price reached during the period.A candlestick is formed of a body, the bulky part between the open and close prices. It is green when the price goes up in a bullish move, and the closing price is higher than the opening price. It is red when the closing price is lower than the opening price, so the price is in a bearish movement as it goes down.The body size shows strong buying and selling pressure when it’s long. It indicates uncertainty when it’s short. A candlestick also has wicks, or shadows. They are thin lines above and below the body that indicate the highest or lowest prices the asset hit during the relevant trading frame.Here’s a useful example that may help you understand it better. Suppose you’re analyzing the four-hour chart using candlesticks, and Bitcoin’s opening price is $90,000. The closing price is $93,500, with a high of $95,000 and a low of $88,700. In this instance, the candlestick will appear as a green body from $90,000 to $93,500. An upper wick hitting $95,000 and a lower wick dipping to $88,700.Advantages of Bitcoin candlestick chart Bitcoin candlestick charts offer several advantages, including:Candlestick charts offer you a quick view of market sentiment and price movement. They show if the market is positive or negative and how strong that feeling is. You can pick different timeframes based on your trading style, whether you’re a day trader, swing trader or long-term investor.For example, the one-minute chart works well for scalping, while the daily chart is better for long-term investors. As crypto markets are open 24 hours a day, the open and close prices reflect the start and end of the chosen timeframe.Introduction to advanced crypto charting techniques to trade BTCCandlesticks are a great way to start trading Bitcoin. They give you a quick look at market trends and help predict price movements. Once you know the basic charts and skills, you can explore advanced techniques. For example, using moving averages can help you make better investing decisions.Here are some of the best tools Bitcoin traders use to leverage technical analysis, volume and market psychology. These strategies give traders an edge in the ever-changing crypto market.1. Fibonacci retracement Fibonacci retracement is a technical analysis tool used to spot potential support and


Key takeawaysBitcoin candlesticks are a popular tool among Bitcoin traders because they’re simple to use and offer an intuitive way to understand market sentiment and trends.
Bitcoin candlesticks are a rather old tool. Rice trader Honma Munehisa invented them in Japan as far back as the 18th century. They were introduced to Western financial markets in the late 1980s.
They help you understand bullish and bearish patterns in technical analysis. This knowledge will get you started with Bitcoin trading.
They should not be your only tool for making informed decisions. Combine them with other Bitcoin technical indicators, such as MAs (moving averages) or the RSI (relative strength index).
Bitcoin candlesticks are a popular tool among Bitcoin traders because they’re simple to use and offer an intuitive way to understand market sentiment and trends.
Bitcoin candlesticks are a rather old tool. Rice trader Honma Munehisa invented them in Japan as far back as the 18th century. They were introduced to Western financial markets in the late 1980s.
They help you understand bullish and bearish patterns in technical analysis. This knowledge will get you started with Bitcoin trading.
They should not be your only tool for making informed decisions. Combine them with other Bitcoin technical indicators, such as MAs (moving averages) or the RSI (relative strength index).
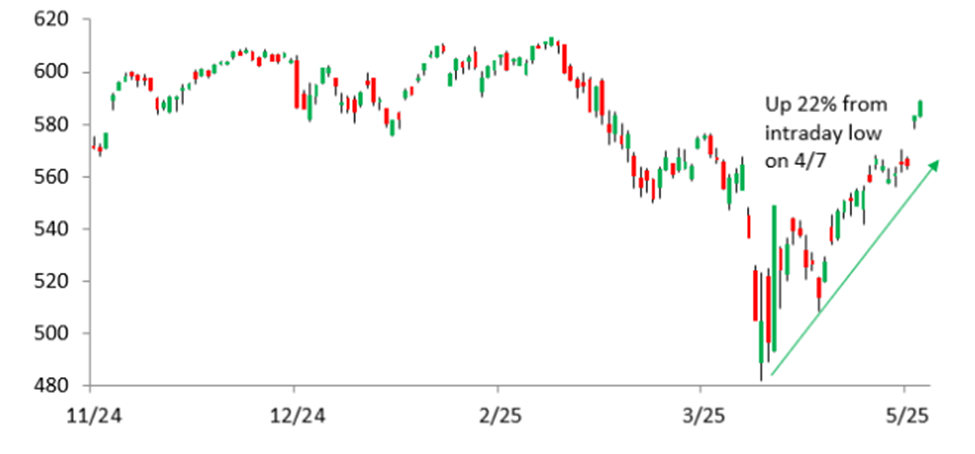
If you’re new to Bitcoin (BTC) trading, you may wonder when to buy or sell. Candlestick charts, like bar or line graphs, have time on the horizontal axis, while the price data appears on the vertical axis.
They provide a quick look at price movements when compared to other charts. You can quickly view the highest and lowest prices of an asset in a specific timeframe. It also shows the opening and closing prices.
Here are a few Bitcoin trading tips to help you get started. No experience needed; this is your go-to crypto candlestick chart tutorial, perfectly suited for beginners.
Why analyze Bitcoin price charts
Technical analysis is an essential and consolidated strategy for trading markets. When Bitcoin (BTC) started picking up and prices fluctuated more, crypto investors began to use trading strategies from traditional markets, such as candlesticks.
For Bitcoin technical analysis basics, platforms like TradingView offer many charts and technical indicators. These tools are easy to use, even for beginners. TradingView crypto charts can be candlestick, bar or line charts. Here’s an overview of candlestick charts to help you get started with Bitcoin trading.
Beginner’s guide to Bitcoin candlestick charts
Candlestick charts are a milestone in technical analysis and the first step to understanding Bitcoin charts. They are an essential tool to quickly assess price movements and market trends in the short term.
They represent Bitcoin’s price trends on a chart over a specific period, such as one hour, four hours or one day, to help traders make better decisions.
Why use candlesticks?
They help traders visualize price movements over time.
They help identify bullish, bearish or consolidation sentiment.
They help spot patterns like reversals or continuations to predict future price movements.

A candlestick represents four key price points:
The opening price at the start of the period
The closing price at the end of the period
The highest price reached during the period
The lowest price reached during the period.
A candlestick is formed of a body, the bulky part between the open and close prices.
It is green when the price goes up in a bullish move, and the closing price is higher than the opening price. It is red when the closing price is lower than the opening price, so the price is in a bearish movement as it goes down.
The body size shows strong buying and selling pressure when it’s long. It indicates uncertainty when it’s short.

A candlestick also has wicks, or shadows. They are thin lines above and below the body that indicate the highest or lowest prices the asset hit during the relevant trading frame.
Here’s a useful example that may help you understand it better. Suppose you’re analyzing the four-hour chart using candlesticks, and Bitcoin’s opening price is $90,000. The closing price is $93,500, with a high of $95,000 and a low of $88,700.
In this instance, the candlestick will appear as a green body from $90,000 to $93,500. An upper wick hitting $95,000 and a lower wick dipping to $88,700.
Advantages of Bitcoin candlestick chart
Bitcoin candlestick charts offer several advantages, including:
Candlestick charts offer you a quick view of market sentiment and price movement. They show if the market is positive or negative and how strong that feeling is.
You can pick different timeframes based on your trading style, whether you’re a day trader, swing trader or long-term investor.
For example, the one-minute chart works well for scalping, while the daily chart is better for long-term investors.
As crypto markets are open 24 hours a day, the open and close prices reflect the start and end of the chosen timeframe.
Introduction to advanced crypto charting techniques to trade BTC
Candlesticks are a great way to start trading Bitcoin. They give you a quick look at market trends and help predict price movements. Once you know the basic charts and skills, you can explore advanced techniques. For example, using moving averages can help you make better investing decisions.

Here are some of the best tools Bitcoin traders use to leverage technical analysis, volume and market psychology. These strategies give traders an edge in the ever-changing crypto market.
1. Fibonacci retracement
Fibonacci retracement is a technical analysis tool used to spot potential support and resistance levels, as well as price targets.

To use this method, draw lines connecting a major high and low on the chart. Then, calculate retracement levels using Fibonacci ratios like 23.6%, 38.2%, 50% and 61.8%. You can use the Fibonacci retracement for confirmation when paired with trendlines or moving averages.
2. Volume profile
Volume profile is another tool for technical analysis. It shows trading volume for price instead of time. Knowing where trading happens most helps traders spot key price levels. These levels often create strong support and resistance zones.
3. Elliot Wave Theory
The Elliott Wave theory is a prediction model of price movements based on market psychology and wave patterns. According to the theory, the market moves in trends of five waves, followed by three waves of correction, with each wave reflecting trader sentiment.
4. Other indicators
The relative strength index (RSI) is one of the most common charting indicators. It measures the strength of Bitcoin’s upward and downward price movements over time.
The simple moving average (SMA) indicates the average price of an asset over time, which can help you understand Bitcoin’s overall price movement.
The exponential moving average (EMA) is a better alternative to the SMA for identifying short-term trends. Like the SMA, the EMA shows you the average price of an asset over time, but the EMA focuses more on recent days.
Caution! Reading Bitcoin candlesticks or any other charts is a great first step toward understanding market behavior, but remember charts don’t guarantee outcomes. Always combine technical insights with risk management, and never trade more than you can afford to lose.
This article does not contain investment advice or recommendations. Every investment and trading move involves risk, and readers should conduct their own research when making a decision.