


Americans Are Buying Fewer Guns, and These States Show the Biggest Change
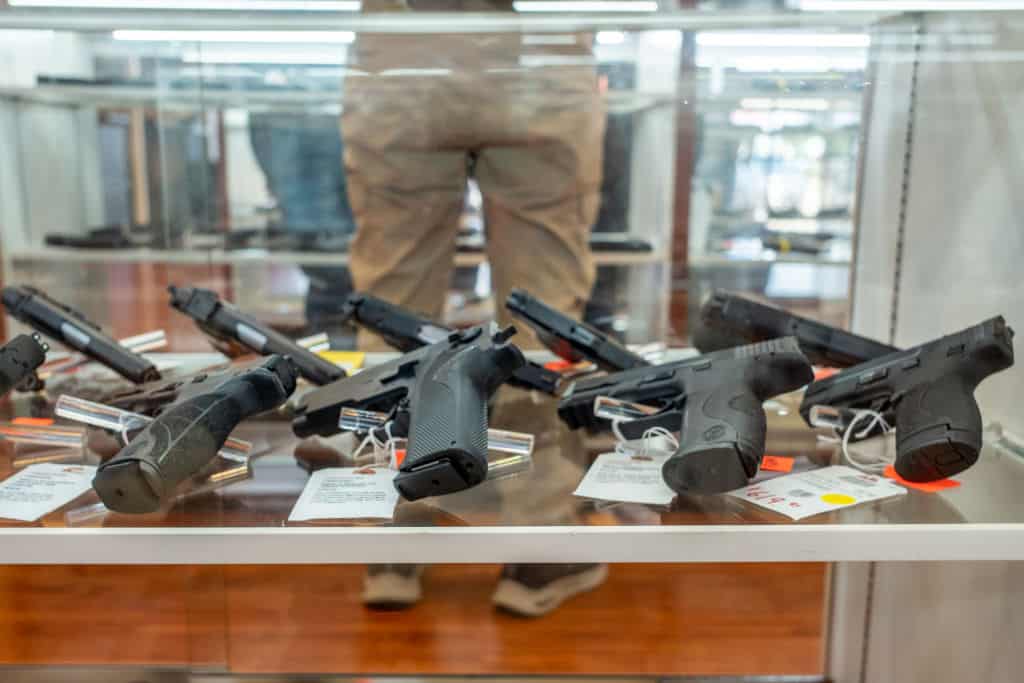
Gun sales are currently down in America. According to a recent report updated April 9, 2025, from The Trace’s gun sales tracker, Americans bought 15.3 million firearms last year, in 2024. Not only are gun sales declining, but manufacturers are producing less to meet the lower demand. There could be several reasons why gun sales […] The post Americans Are Buying Fewer Guns, and These States Show the Biggest Change appeared first on 24/7 Wall St..
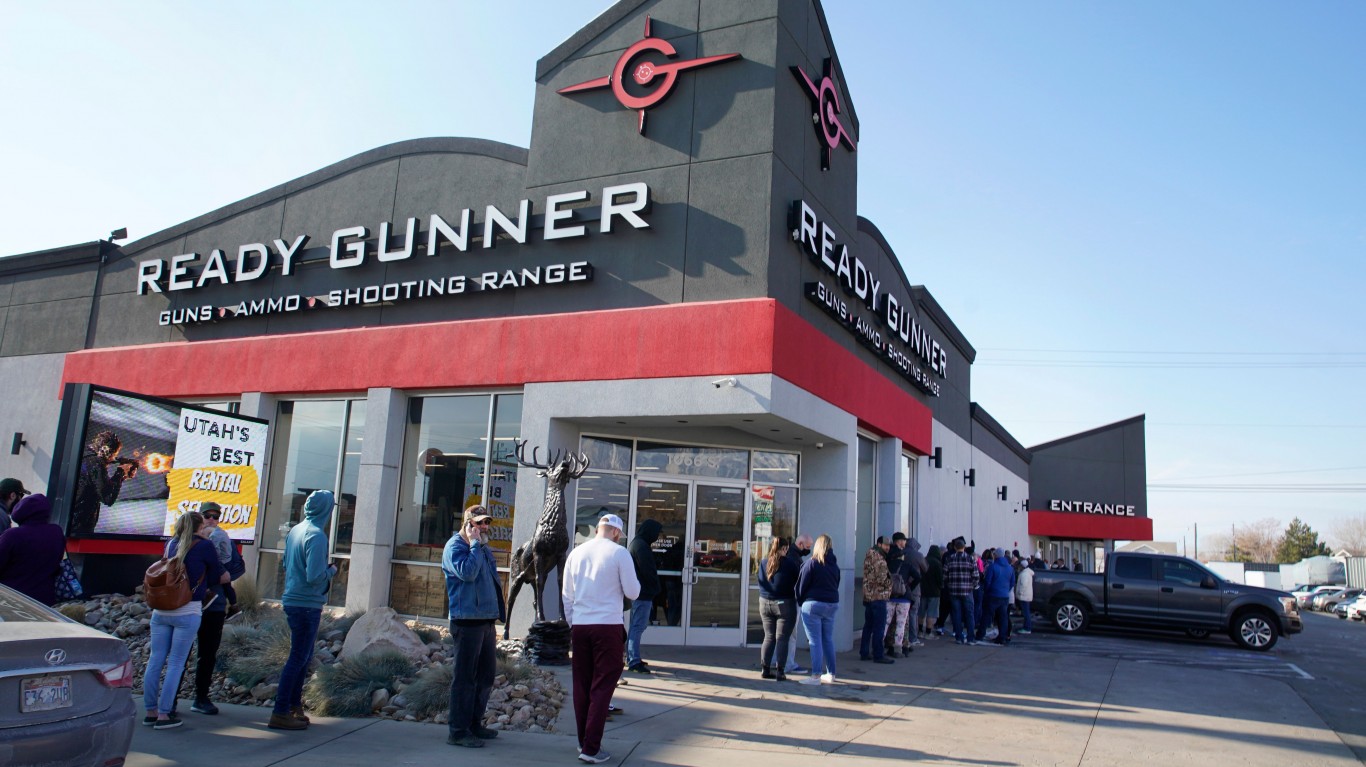
Gun sales are currently down in America. According to a recent report updated April 9, 2025, from The Trace’s gun sales tracker, Americans bought 15.3 million firearms last year, in 2024. Not only are gun sales declining, but manufacturers are producing less to meet the lower demand. There could be several reasons why gun sales are down. Traditionally, gun sales decline when a Republican is in office. President Trump campaigned on rolling back Biden-era gun regulations. The other reason is likely rising inflation. It’s not just firearms that are taking a hit. Americans are spending less in all areas.
While gun sales rose to record highs during the pandemic in America, they have since declined in most areas. In 2020, Americans bought an estimated 20 million firearms. This was a substantial increase from 12.4 million firearms in 2019. Despite the decline, the U.S. remains the only country in the world that has more guns than people. However, some states are seeing firearm sales drop more than others.
24/7 Wall St. identified the states where gun sales have plummeted in the past several years, using data from the ATF. We ranked states on the percent change in EMSV from 2021 to 2023. Only states where annual gun sales fell by over 10% are ranked on this list. Supplemental data on estimated gun sale rates by state were calculated using EMSV from the ATF, and population estimates from the U.S. Census Bureau’s 2023 and 2021 American Community Surveys. Due to data limitations, Hawaii was excluded from the analysis. It is important to note that even though annual gun sales have declined sharply in much of the country in recent years, they still remain well above pre-pandemic levels.
(This article was updated on May 9, 2025, to reflect recent news regarding sliding gun sales.)
Why It Matters Now
Gun sales are down in America. Since peaking at over 20 million in 2020, annual gun sales have fallen considerably in the United States. Nationwide, estimated gun sales fell by over 15% between 2021 and 2022, and in some states, the decline was much more pronounced.
These are the states where gun sales have fallen the most since 2021:
44. Montana

- Change in estimated minimum gun sales, 2021-2023: -10.8% (-14,569 firearms)
- Population change, 2021-2023: +2.6% (+28,541 people)
- Total population in 2023: 1,132,812
- Estimated minimum gun sales by year: 120,371 in 2023; 134,940 in 2021
- Estimated gun sales rate in 2023: 106.3 firearms per 1,000 people (the highest of 44 states on this list)
- Estimated gun sales rate in 2021: 122.2 firearms per 1,000 people (2nd highest of 44 states on this list)
43. Florida
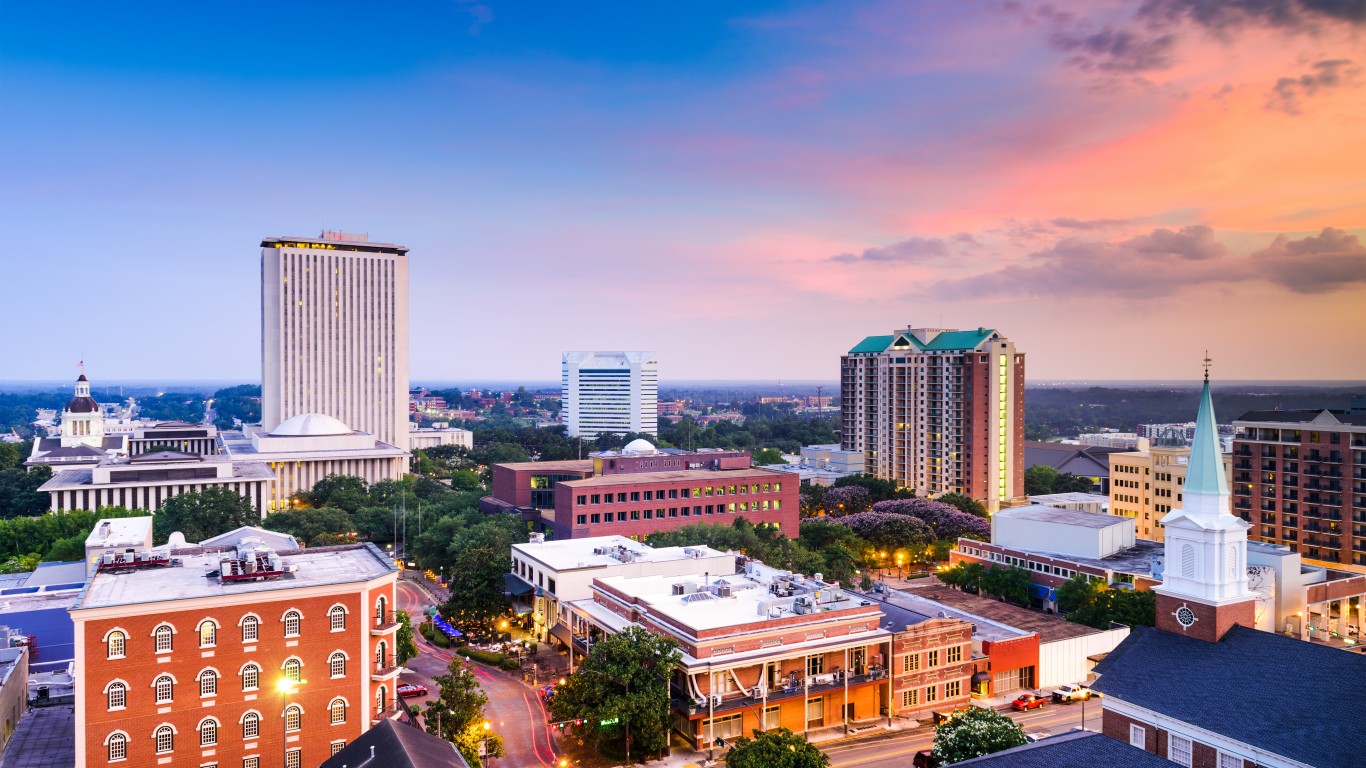
- Change in estimated minimum gun sales, 2021-2023: -12.1% (-146,564 firearms)
- Population change, 2021-2023: +3.8% (+829,598 people)
- Total Population in 2023: 22,610,726
- Estimated minimum gun sales by year: 1,069,531 in 2023; 1,216,095 in 2021
- Estimated gun sales rate in 2023: 47.3 firearms per 1,000 people (16th lowest of 44 states on this list)
- Estimated gun sales rate in 2021: 55.8 firearms per 1,000 people (14th lowest of 44 states on this list)
42. Maine
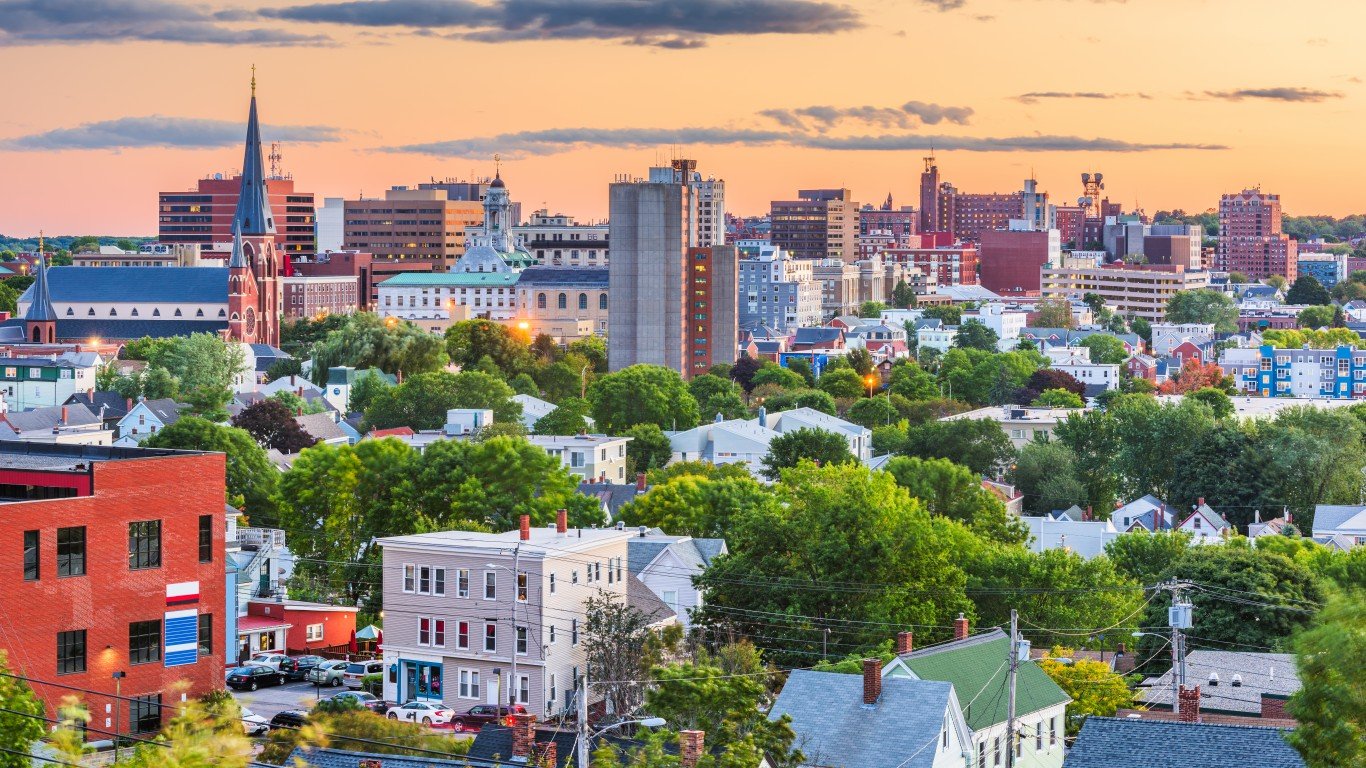
- Change in estimated minimum gun sales, 2021-2023: -12.3% (-15,097 firearms)
- Population change, 2021-2023: +1.7% (+23,475 people)
- Total Population in 2023: 1,395,722
- Estimated minimum gun sales by year: 107,658 in 2023; 122,755 in 2021
- Estimated gun sales rate in 2023: 77.1 firearms per 1,000 people (8th highest of 44 states on this list)
- Estimated gun sales rate in 2021: 89.5 firearms per 1,000 people (13th highest of 44 states on this list)
41. Washington

- Change in estimated minimum gun sales, 2021-2023: -12.6% (-64,233 firearms)
- Population change, 2021-2023: +1.0% (+74,188 people)
- Total Population in 2023: 7,812,880
- Estimated minimum gun sales by year: 444,965 in 2023; 509,198 in 2021
- Estimated gun sales rate in 2023: 57.0 firearms per 1,000 people (23rd highest of 44 states on this list)
- Estimated gun sales rate in 2021: 65.8 firearms per 1,000 people (25th highest of 44 states on this list)
40. California

- Change in estimated minimum gun sales, 2021-2023: -13.0% (-141,602 firearms)
- Population change, 2021-2023: -0.7% (-272,643 people)
- Total Population in 2023: 38,965,193
- Estimated minimum gun sales by year: 948,559 in 2023; 1,090,161 in 2021
- Estimated gun sales rate in 2023: 24.3 firearms per 1,000 people (6th lowest of 44 states on this list)
- Estimated gun sales rate in 2021: 27.8 firearms per 1,000 people (5th lowest of 44 states on this list)
39. Illinois

- Change in estimated minimum gun sales, 2021-2023: -13.2% (-69,945 firearms)
- Population change, 2021-2023: -1.0% (-121,780 people)
- Total Population in 2023: 12,549,689
- Estimated minimum gun sales by year: 458,593 in 2023; 528,538 in 2021
- Estimated gun sales rate in 2023: 36.5 firearms per 1,000 people (10th lowest of 44 states on this list)
- Estimated gun sales rate in 2021: 41.7 firearms per 1,000 people (8th lowest of 44 states on this list)
38. Utah

- Change in estimated minimum gun sales, 2021-2023: -13.8% (-20,798 firearms)
- Population change, 2021-2023: +2.4% (+79,759 people)
- Total Population in 2023: 3,417,734
- Estimated minimum gun sales by year: 130,391 in 2023; 151,189 in 2021
- Estimated gun sales rate in 2023: 38.2 firearms per 1,000 people (11th lowest of 44 states on this list)
- Estimated gun sales rate in 2021: 45.3 firearms per 1,000 people (11th lowest of 44 states on this list)
37. North Dakota
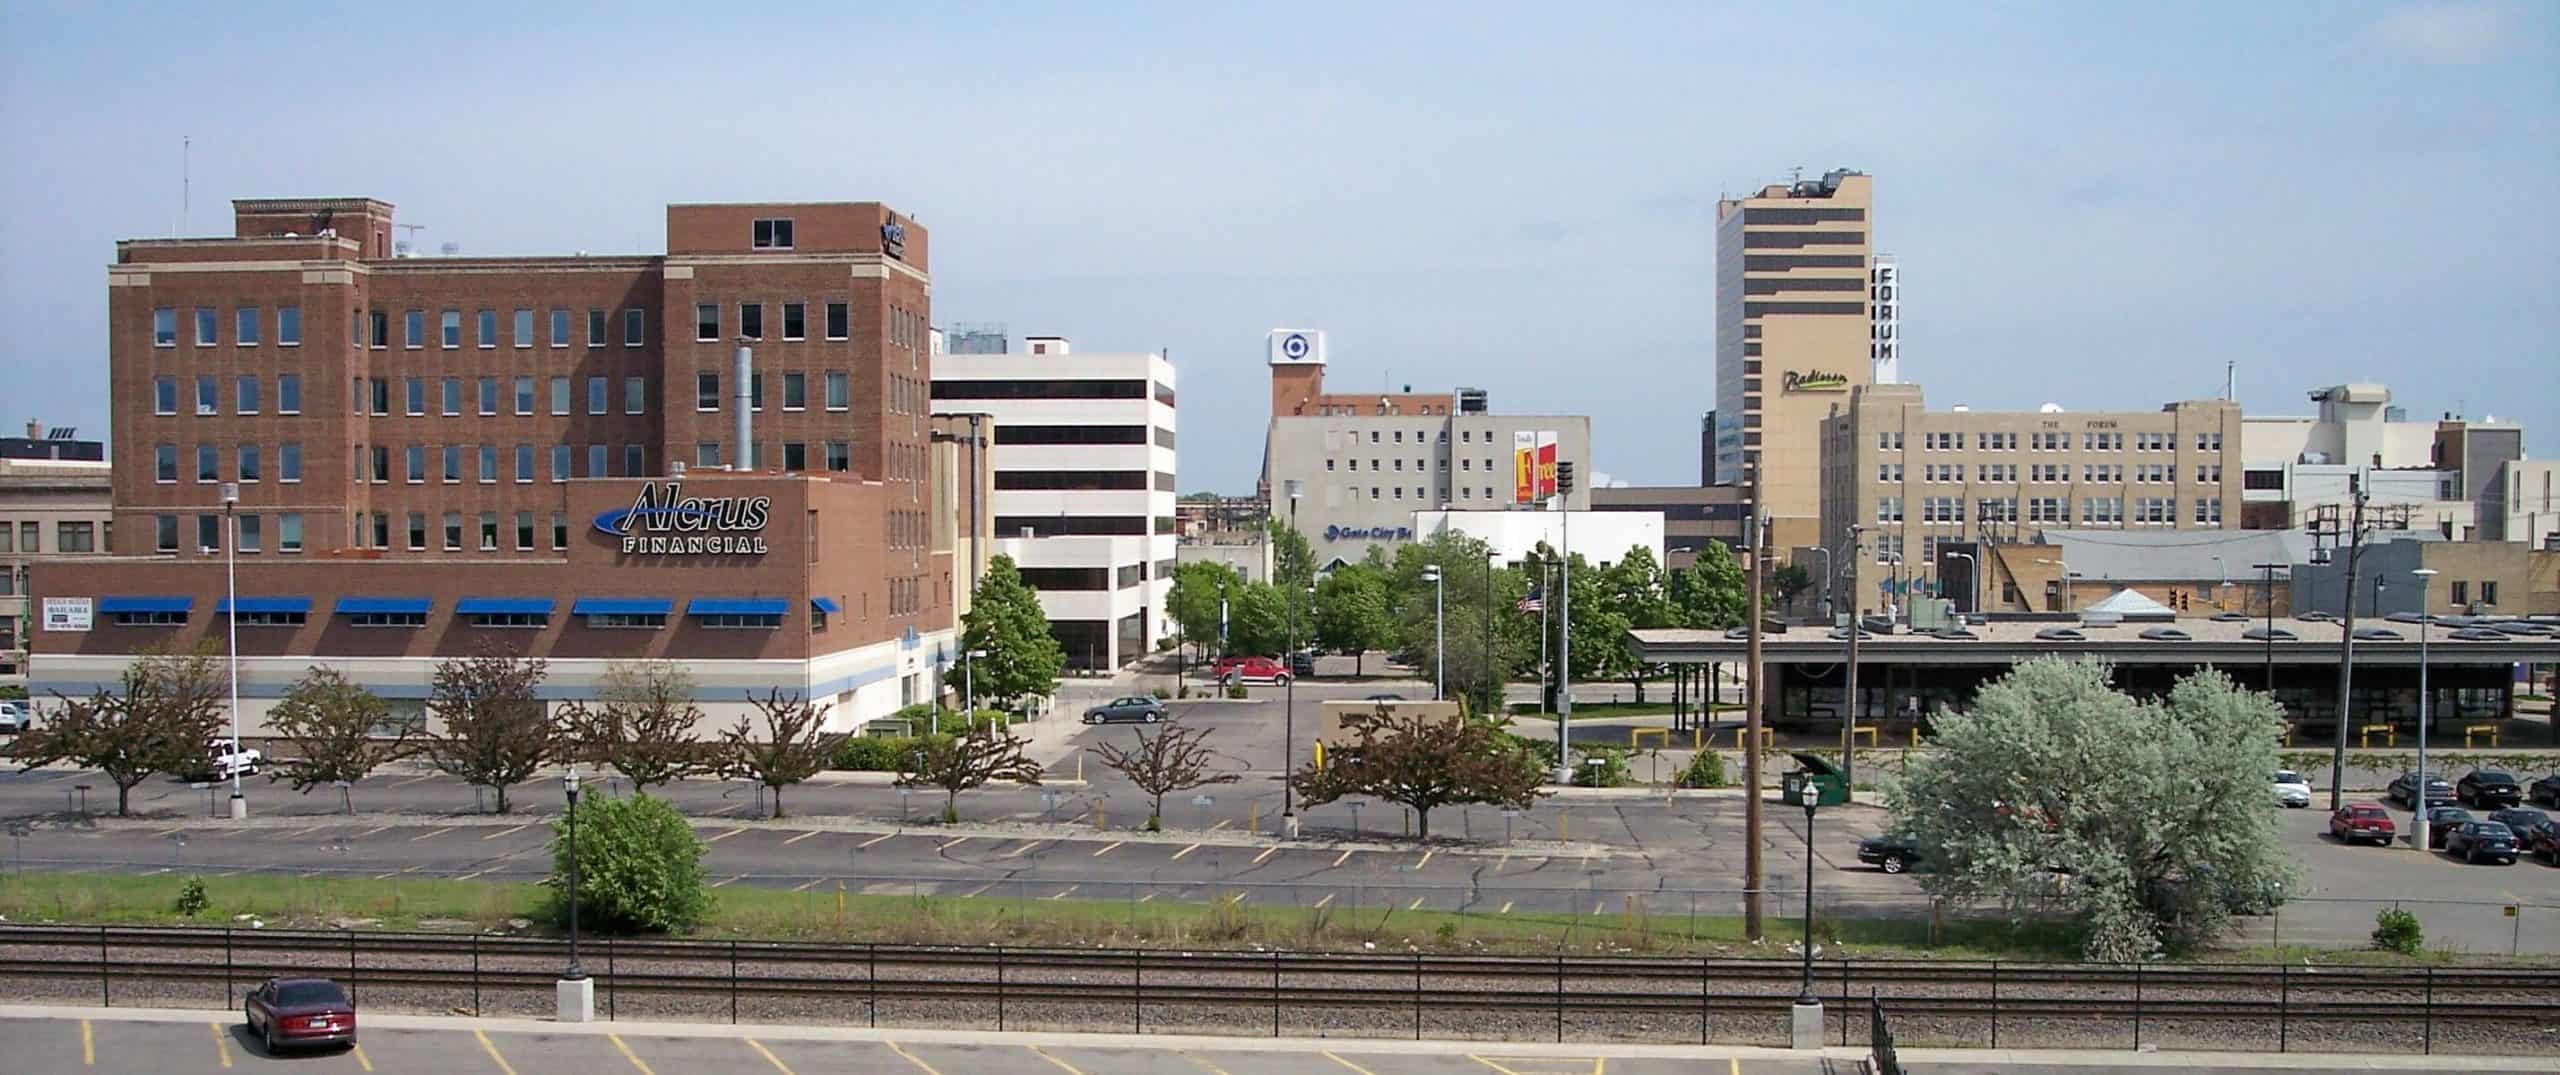
- Change in estimated minimum gun sales, 2021-2023: -14.6% (-10,407 firearms)
- Population change, 2021-2023: +1.2% (+8,978 people)
- Total Population in 2023: 783,926
- Estimated minimum gun sales by year: 60,873 in 2023; 71,280 in 2021
- Estimated gun sales rate in 2023: 77.7 firearms per 1,000 people (7th highest of 44 states on this list)
- Estimated gun sales rate in 2021: 92.0 firearms per 1,000 people (10th highest of 44 states on this list)
36. Ohio

- Change in estimated minimum gun sales, 2021-2023: -14.9% (-92,672 firearms)
- Population change, 2021-2023: +0.1% (+5,918 people)
- Total Population in 2023: 11,785,935
- Estimated minimum gun sales by year: 529,668 in 2023; 622,340 in 2021
- Estimated gun sales rate in 2023: 44.9 firearms per 1,000 people (15th lowest of 44 states on this list)
- Estimated gun sales rate in 2021: 52.8 firearms per 1,000 people (13th lowest of 44 states on this list)
35. Connecticut

- Change in estimated minimum gun sales, 2021-2023: -15.9% (-20,682 firearms)
- Population change, 2021-2023: +0.3% (+11,579 people)
- Total Population in 2023: 3,617,176
- Estimated minimum gun sales by year: 109,131 in 2023; 129,813 in 2021
- Estimated gun sales rate in 2023: 30.2 firearms per 1,000 people (7th lowest of 44 states on this list)
- Estimated gun sales rate in 2021: 36.0 firearms per 1,000 people (6th lowest of 44 states on this list)
34. Arkansas

- Change in estimated minimum gun sales, 2021-2023: -16.2% (-34,568 firearms)
- Population change, 2021-2023: +1.4% (+41,841 people)
- Total Population in 2023: 3,067,732
- Estimated minimum gun sales by year: 179,387 in 2023; 213,955 in 2021
- Estimated gun sales rate in 2023: 58.5 firearms per 1,000 people (21st highest of 44 states on this list)
- Estimated gun sales rate in 2021: 70.7 firearms per 1,000 people (23rd highest of 44 states on this list)
33. Georgia

- Change in estimated minimum gun sales, 2021-2023: -16.2% (-73,101 firearms)
- Population change, 2021-2023: +2.1% (+229,661 people)
- Total Population in 2023: 11,029,227
- Estimated minimum gun sales by year: 378,265 in 2023; 451,366 in 2021
- Estimated gun sales rate in 2023: 34.3 firearms per 1,000 people (9th lowest of 44 states on this list)
- Estimated gun sales rate in 2021: 41.8 firearms per 1,000 people (9th lowest of 44 states on this list)
32. Tennessee

- Change in estimated minimum gun sales, 2021-2023: -16.5% (-113,824 firearms)
- Population change, 2021-2023: +2.2% (+151,271 people)
- Total Population in 2023: 7,126,489
- Estimated minimum gun sales by year: 575,466 in 2023; 689,290 in 2021
- Estimated gun sales rate in 2023: 80.8 firearms per 1,000 people (6th highest of 44 states on this list)
- Estimated gun sales rate in 2021: 98.8 firearms per 1,000 people (7th highest of 44 states on this list)
31. Virginia

- Change in estimated minimum gun sales, 2021-2023: -16.5% (-104,706 firearms)
- Population change, 2021-2023: +0.8% (+73,424 people)
- Total Population in 2023: 8,715,698
- Estimated minimum gun sales by year: 528,816 in 2023; 633,522 in 2021
- Estimated gun sales rate in 2023: 60.7 firearms per 1,000 people (19th highest of 44 states on this list)
- Estimated gun sales rate in 2021: 73.3 firearms per 1,000 people (21st highest of 44 states on this list)
30. Massachusetts

- Change in estimated minimum gun sales, 2021-2023: -16.5% (-24,722 firearms)
- Population change, 2021-2023: +0.2% (+16,676 people)
- Total Population in 2023: 7,001,399
- Estimated minimum gun sales by year: 124,718 in 2023; 149,440 in 2021
- Estimated gun sales rate in 2023: 17.8 firearms per 1,000 people (4th lowest of 44 states on this list)
- Estimated gun sales rate in 2021: 21.4 firearms per 1,000 people (3rd lowest of 44 states on this list)
29. Alaska

- Change in estimated minimum gun sales, 2021-2023: -16.6% (-14,502 firearms)
- Population change, 2021-2023: +0.1% (+733 people)
- Total Population in 2023: 733,406
- Estimated minimum gun sales by year: 72,906 in 2023; 87,408 in 2021
- Estimated gun sales rate in 2023: 99.4 firearms per 1,000 people (3rd highest of 44 states on this list)
- Estimated gun sales rate in 2021: 119.3 firearms per 1,000 people (3rd highest of 44 states on this list)
28. Nebraska

- Change in estimated minimum gun sales, 2021-2023: -16.7% (-4,921 firearms)
- Population change, 2021-2023: +0.7% (+14,687 people)
- Total Population in 2023: 1,978,379
- Estimated minimum gun sales by year: 24,521 in 2023; 29,442 in 2021
- Estimated gun sales rate in 2023: 12.4 firearms per 1,000 people (the lowest of 44 states on this list)
- Estimated gun sales rate in 2021: 15.0 firearms per 1,000 people (the lowest of 44 states on this list)
27. Kansas

- Change in estimated minimum gun sales, 2021-2023: -17.1% (-33,394 firearms)
- Population change, 2021-2023: +0.2% (+5,965 people)
- Total Population in 2023: 2,940,546
- Estimated minimum gun sales by year: 162,362 in 2023; 195,756 in 2021
- Estimated gun sales rate in 2023: 55.2 firearms per 1,000 people (25th highest of 44 states on this list)
- Estimated gun sales rate in 2021: 66.7 firearms per 1,000 people (24th highest of 44 states on this list)
26. Missouri

- Change in estimated minimum gun sales, 2021-2023: -17.2% (-98,170 firearms)
- Population change, 2021-2023: +0.5% (+27,969 people)
- Total Population in 2023: 6,196,156
- Estimated minimum gun sales by year: 472,560 in 2023; 570,730 in 2021
- Estimated gun sales rate in 2023: 76.3 firearms per 1,000 people (9th highest of 44 states on this list)
- Estimated gun sales rate in 2021: 92.5 firearms per 1,000 people (9th highest of 44 states on this list)
25. Oklahoma

- Change in estimated minimum gun sales, 2021-2023: -17.7% (-62,879 firearms)
- Population change, 2021-2023: +1.7% (+67,185 people)
- Total Population in 2023: 4,053,824
- Estimated minimum gun sales by year: 291,723 in 2023; 354,602 in 2021
- Estimated gun sales rate in 2023: 72.0 firearms per 1,000 people (12th highest of 44 states on this list)
- Estimated gun sales rate in 2021: 88.9 firearms per 1,000 people (14th highest of 44 states on this list)
24. New Mexico

- Change in estimated minimum gun sales, 2021-2023: -17.9% (-32,292 firearms)
- Population change, 2021-2023: -0.1% (-1,506 people)
- Total Population in 2023: 2,114,371
- Estimated minimum gun sales by year: 148,129 in 2023; 180,421 in 2021
- Estimated gun sales rate in 2023: 70.1 firearms per 1,000 people (14th highest of 44 states on this list)
- Estimated gun sales rate in 2021: 85.3 firearms per 1,000 people (15th highest of 44 states on this list)
23. Texas

- Change in estimated minimum gun sales, 2021-2023: -17.9% (-265,756 firearms)
- Population change, 2021-2023: +3.3% (+975,360 people)
- Total Population in 2023: 30,503,301
- Estimated minimum gun sales by year: 1,217,269 in 2023; 1,483,025 in 2021
- Estimated gun sales rate in 2023: 39.9 firearms per 1,000 people (12th lowest of 44 states on this list)
- Estimated gun sales rate in 2021: 50.2 firearms per 1,000 people (12th lowest of 44 states on this list)
22. Indiana

- Change in estimated minimum gun sales, 2021-2023: -18.1% (-100,019 firearms)
- Population change, 2021-2023: +0.8% (+56,214 people)
- Total Population in 2023: 6,862,199
- Estimated minimum gun sales by year: 453,431 in 2023; 553,450 in 2021
- Estimated gun sales rate in 2023: 66.1 firearms per 1,000 people (16th highest of 44 states on this list)
- Estimated gun sales rate in 2021: 81.3 firearms per 1,000 people (17th highest of 44 states on this list)
21. West Virginia

- Change in estimated minimum gun sales, 2021-2023: -18.1% (-32,338 firearms)
- Population change, 2021-2023: -0.7% (-12,888 people)
- Total Population in 2023: 1,770,071
- Estimated minimum gun sales by year: 146,295 in 2023; 178,633 in 2021
- Estimated gun sales rate in 2023: 82.6 firearms per 1,000 people (5th highest of 44 states on this list)
- Estimated gun sales rate in 2021: 100.2 firearms per 1,000 people (6th highest of 44 states on this list)
20. Colorado

- Change in estimated minimum gun sales, 2021-2023: -18.6% (-97,895 firearms)
- Population change, 2021-2023: +1.1% (+65,541 people)
- Total Population in 2023: 5,877,610
- Estimated minimum gun sales by year: 428,472 in 2023; 526,367 in 2021
- Estimated gun sales rate in 2023: 72.9 firearms per 1,000 people (11th highest of 44 states on this list)
- Estimated gun sales rate in 2021: 90.6 firearms per 1,000 people (12th highest of 44 states on this list)
19. Alabama

- Change in estimated minimum gun sales, 2021-2023: -18.9% (-100,786 firearms)
- Population change, 2021-2023: +1.4% (+68,591 people)
- Total Population in 2023: 5,108,468
- Estimated minimum gun sales by year: 432,854 in 2023; 533,640 in 2021
- Estimated gun sales rate in 2023: 84.7 firearms per 1,000 people (4th highest of 44 states on this list)
- Estimated gun sales rate in 2021: 105.9 firearms per 1,000 people (4th highest of 44 states on this list)
18. Arizona

- Change in estimated minimum gun sales, 2021-2023: -19.3% (-88,122 firearms)
- Population change, 2021-2023: +2.1% (+155,028 people)
- Total Population in 2023: 7,431,344
- Estimated minimum gun sales by year: 368,807 in 2023; 456,929 in 2021
- Estimated gun sales rate in 2023: 49.6 firearms per 1,000 people (18th lowest of 44 states on this list)
- Estimated gun sales rate in 2021: 62.8 firearms per 1,000 people (16th lowest of 44 states on this list)
17. Vermont
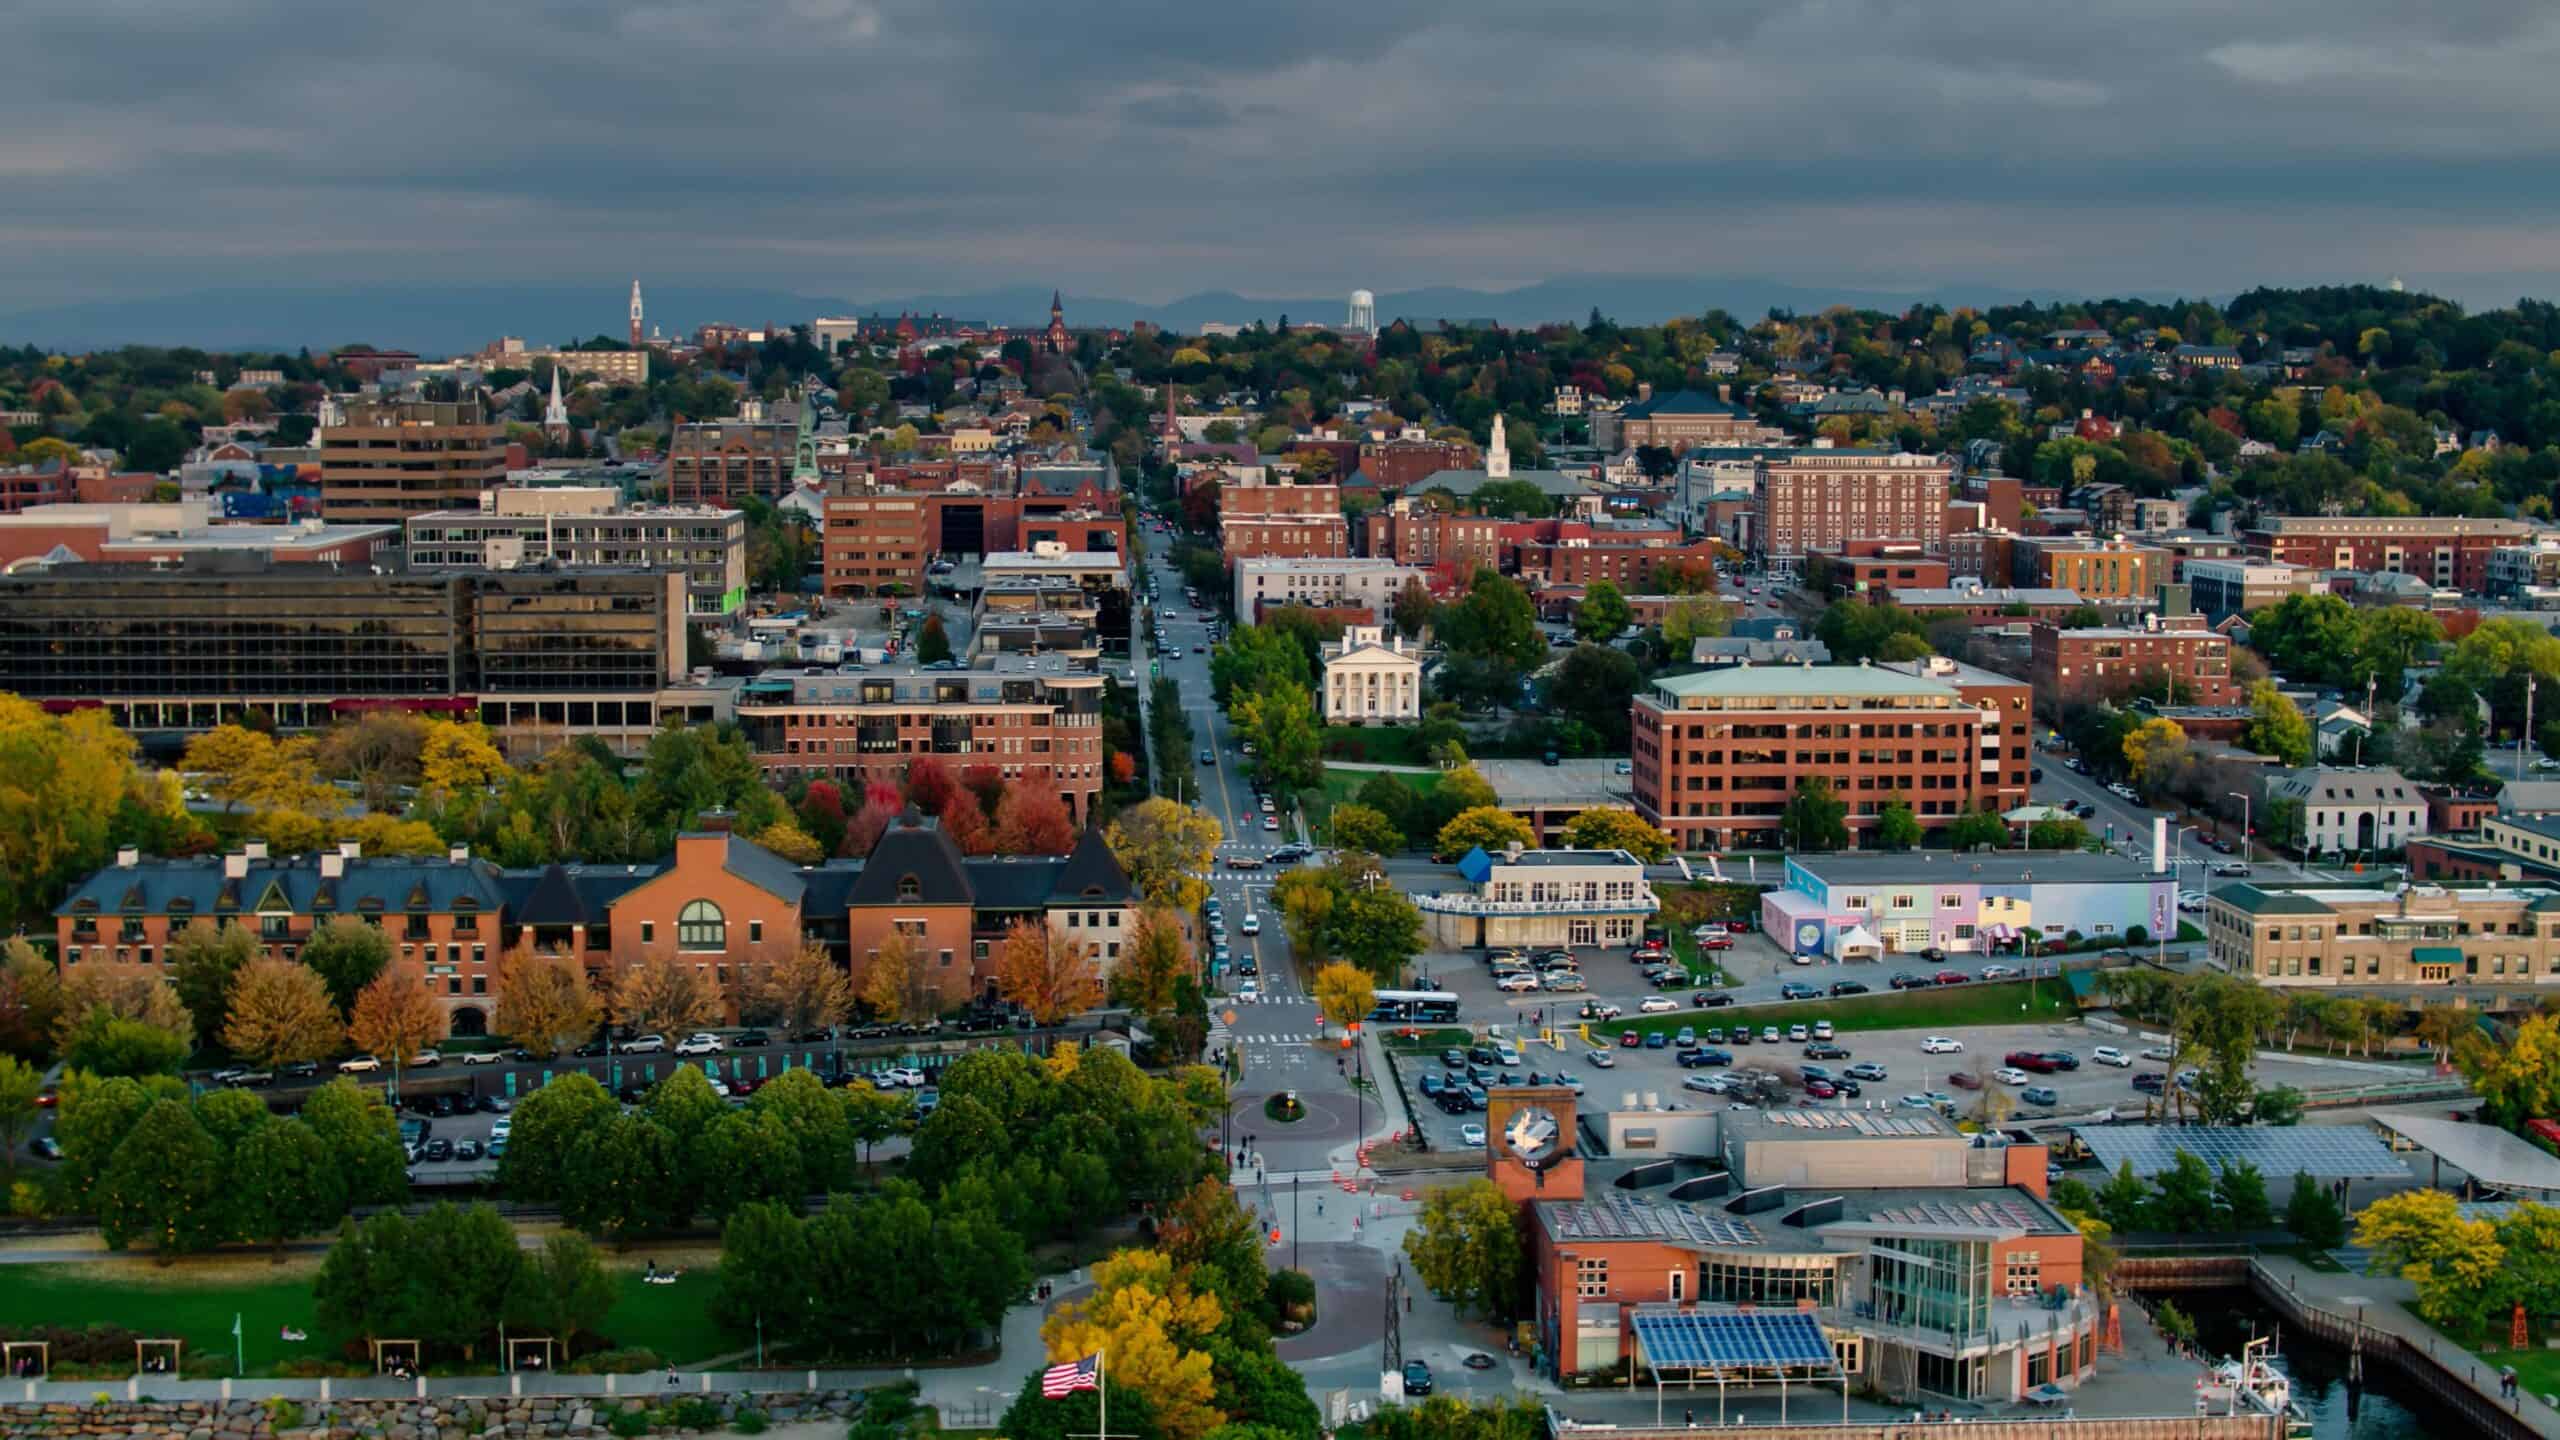
- Change in estimated minimum gun sales, 2021-2023: -19.3% (-10,164 firearms)
- Population change, 2021-2023: +0.3% (+1,894 people)
- Total Population in 2023: 647,464
- Estimated minimum gun sales by year: 42,523 in 2023; 52,687 in 2021
- Estimated gun sales rate in 2023: 65.7 firearms per 1,000 people (17th highest of 44 states on this list)
- Estimated gun sales rate in 2021: 81.6 firearms per 1,000 people (16th highest of 44 states on this list)
16. Wisconsin

- Change in estimated minimum gun sales, 2021-2023: -19.5% (-90,736 firearms)
- Population change, 2021-2023: +0.3% (+15,047 people)
- Total Population in 2023: 5,910,955
- Estimated minimum gun sales by year: 375,354 in 2023; 466,090 in 2021
- Estimated gun sales rate in 2023: 63.5 firearms per 1,000 people (18th highest of 44 states on this list)
- Estimated gun sales rate in 2021: 79.1 firearms per 1,000 people (18th highest of 44 states on this list)
15. Kentucky

- Change in estimated minimum gun sales, 2021-2023: -19.7% (-63,638 firearms)
- Population change, 2021-2023: +0.4% (+16,760 people)
- Total Population in 2023: 4,526,154
- Estimated minimum gun sales by year: 259,577 in 2023; 323,215 in 2021
- Estimated gun sales rate in 2023: 57.4 firearms per 1,000 people (22nd highest of 44 states on this list)
- Estimated gun sales rate in 2021: 71.7 firearms per 1,000 people (22nd highest of 44 states on this list)
14. Wyoming
- Change in estimated minimum gun sales, 2021-2023: -20.4% (-15,073 firearms)
- Population change, 2021-2023: +0.9% (+5,254 people)
- Total Population in 2023: 584,057
- Estimated minimum gun sales by year: 58,900 in 2023; 73,973 in 2021
- Estimated gun sales rate in 2023: 100.8 firearms per 1,000 people (2nd highest of 44 states on this list)
- Estimated gun sales rate in 2021: 127.8 firearms per 1,000 people (the highest of 44 states on this list)
13. Pennsylvania

- Change in estimated minimum gun sales, 2021-2023: -20.5% (-197,175 firearms)
- Population change, 2021-2023: -0.0% (-2,373 people)
- Total Population in 2023: 12,961,683
- Estimated minimum gun sales by year: 765,003 in 2023; 962,178 in 2021
- Estimated gun sales rate in 2023: 59.0 firearms per 1,000 people (20th highest of 44 states on this list)
- Estimated gun sales rate in 2021: 74.2 firearms per 1,000 people (20th highest of 44 states on this list)
12. Michigan

- Change in estimated minimum gun sales, 2021-2023: -21.3% (-137,104 firearms)
- Population change, 2021-2023: -0.1% (-13,550 people)
- Total Population in 2023: 10,037,261
- Estimated minimum gun sales by year: 506,811 in 2023; 643,915 in 2021
- Estimated gun sales rate in 2023: 50.5 firearms per 1,000 people (19th lowest of 44 states on this list)
- Estimated gun sales rate in 2021: 64.1 firearms per 1,000 people (17th lowest of 44 states on this list)
11. New York

- Change in estimated minimum gun sales, 2021-2023: -22.0% (-86,940 firearms)
- Population change, 2021-2023: -1.3% (-264,697 people)
- Total Population in 2023: 19,571,216
- Estimated minimum gun sales by year: 307,557 in 2023; 394,497 in 2021
- Estimated gun sales rate in 2023: 15.7 firearms per 1,000 people (2nd lowest of 44 states on this list)
- Estimated gun sales rate in 2021: 19.9 firearms per 1,000 people (2nd lowest of 44 states on this list)
10. South Carolina

- Change in estimated minimum gun sales, 2021-2023: -22.7% (-68,927 firearms)
- Population change, 2021-2023: +3.5% (+182,850 people)
- Total Population in 2023: 5,373,555
- Estimated minimum gun sales by year: 235,219 in 2023; 304,146 in 2021
- Estimated gun sales rate in 2023: 43.8 firearms per 1,000 people (14th lowest of 44 states on this list)
- Estimated gun sales rate in 2021: 58.6 firearms per 1,000 people (15th lowest of 44 states on this list)
9. Idaho

- Change in estimated minimum gun sales, 2021-2023: -22.7% (-42,629 firearms)
- Population change, 2021-2023: +3.4% (+63,803 people)
- Total Population in 2023: 1,964,726
- Estimated minimum gun sales by year: 144,964 in 2023; 187,593 in 2021
- Estimated gun sales rate in 2023: 73.8 firearms per 1,000 people (10th highest of 44 states on this list)
- Estimated gun sales rate in 2021: 98.7 firearms per 1,000 people (8th highest of 44 states on this list)
8. Minnesota

- Change in estimated minimum gun sales, 2021-2023: -23.1% (-84,858 firearms)
- Population change, 2021-2023: +0.5% (+30,525 people)
- Total Population in 2023: 5,737,915
- Estimated minimum gun sales by year: 282,112 in 2023; 366,970 in 2021
- Estimated gun sales rate in 2023: 49.2 firearms per 1,000 people (17th lowest of 44 states on this list)
- Estimated gun sales rate in 2021: 64.3 firearms per 1,000 people (19th lowest of 44 states on this list)
7. Nevada

- Change in estimated minimum gun sales, 2021-2023: -23.4% (-33,097 firearms)
- Population change, 2021-2023: +1.6% (+50,185 people)
- Total Population in 2023: 3,194,176
- Estimated minimum gun sales by year: 108,523 in 2023; 141,620 in 2021
- Estimated gun sales rate in 2023: 34.0 firearms per 1,000 people (8th lowest of 44 states on this list)
- Estimated gun sales rate in 2021: 45.0 firearms per 1,000 people (10th lowest of 44 states on this list)
6. Mississippi

- Change in estimated minimum gun sales, 2021-2023: -24.1% (-64,924 firearms)
- Population change, 2021-2023: -0.3% (-10,275 people)
- Total Population in 2023: 2,939,690
- Estimated minimum gun sales by year: 204,548 in 2023; 269,472 in 2021
- Estimated gun sales rate in 2023: 69.6 firearms per 1,000 people (15th highest of 44 states on this list)
- Estimated gun sales rate in 2021: 91.3 firearms per 1,000 people (11th highest of 44 states on this list)
5. Louisiana

- Change in estimated minimum gun sales, 2021-2023: -26.9% (-94,454 firearms)
- Population change, 2021-2023: -1.1% (-50,298 people)
- Total Population in 2023: 4,573,749
- Estimated minimum gun sales by year: 256,236 in 2023; 350,690 in 2021
- Estimated gun sales rate in 2023: 56.0 firearms per 1,000 people (24th highest of 44 states on this list)
- Estimated gun sales rate in 2021: 75.8 firearms per 1,000 people (19th highest of 44 states on this list)
4. New Jersey

- Change in estimated minimum gun sales, 2021-2023: -28.5% (-63,629 firearms)
- Population change, 2021-2023: +0.3% (+23,711 people)
- Total Population in 2023: 9,290,841
- Estimated minimum gun sales by year: 159,737 in 2023; 223,366 in 2021
- Estimated gun sales rate in 2023: 17.2 firearms per 1,000 people (3rd lowest of 44 states on this list)
- Estimated gun sales rate in 2021: 24.1 firearms per 1,000 people (4th lowest of 44 states on this list)
3. South Dakota

- Change in estimated minimum gun sales, 2021-2023: -30.1% (-28,206 firearms)
- Population change, 2021-2023: +2.7% (+23,942 people)
- Total Population in 2023: 919,318
- Estimated minimum gun sales by year: 65,639 in 2023; 93,845 in 2021
- Estimated gun sales rate in 2023: 71.4 firearms per 1,000 people (13th highest of 44 states on this list)
- Estimated gun sales rate in 2021: 104.8 firearms per 1,000 people (5th highest of 44 states on this list)
2. Delaware

- Change in estimated minimum gun sales, 2021-2023: -33.3% (-21,457 firearms)
- Population change, 2021-2023: +2.8% (+28,506 people)
- Total Population in 2023: 1,031,890
- Estimated minimum gun sales by year: 42,929 in 2023; 64,386 in 2021
- Estimated gun sales rate in 2023: 41.6 firearms per 1,000 people (13th lowest of 44 states on this list)
- Estimated gun sales rate in 2021: 64.2 firearms per 1,000 people (18th lowest of 44 states on this list)
1. Rhode Island

- Change in estimated minimum gun sales, 2021-2023: -34.9% (-14,161 firearms)
- Population change, 2021-2023: +0.0% (+352 people)
- Total Population in 2023: 1,095,962
- Estimated minimum gun sales by year: 26,384 in 2023; 40,545 in 2021
- Estimated gun sales rate in 2023: 24.1 firearms per 1,000 people (5th lowest of 44 states on this list)
- Estimated gun sales rate in 2021: 37.0 firearms per 1,000 people (7th lowest of 44 states on this list)
The post Americans Are Buying Fewer Guns, and These States Show the Biggest Change appeared first on 24/7 Wall St..