


This Is the Most Affordable Housing Market In Every State
Amid rising demand and ongoing supply shortages, home prices have surged in the United States in recent years. The typical home for sale in the U.S. is listed for $424,900, up over 40% from early 2020, before the onset of the COVID-19 pandemic and the resulting economic fallout. When compared against wage increases, rising home […] The post This Is the Most Affordable Housing Market In Every State appeared first on 24/7 Wall St..
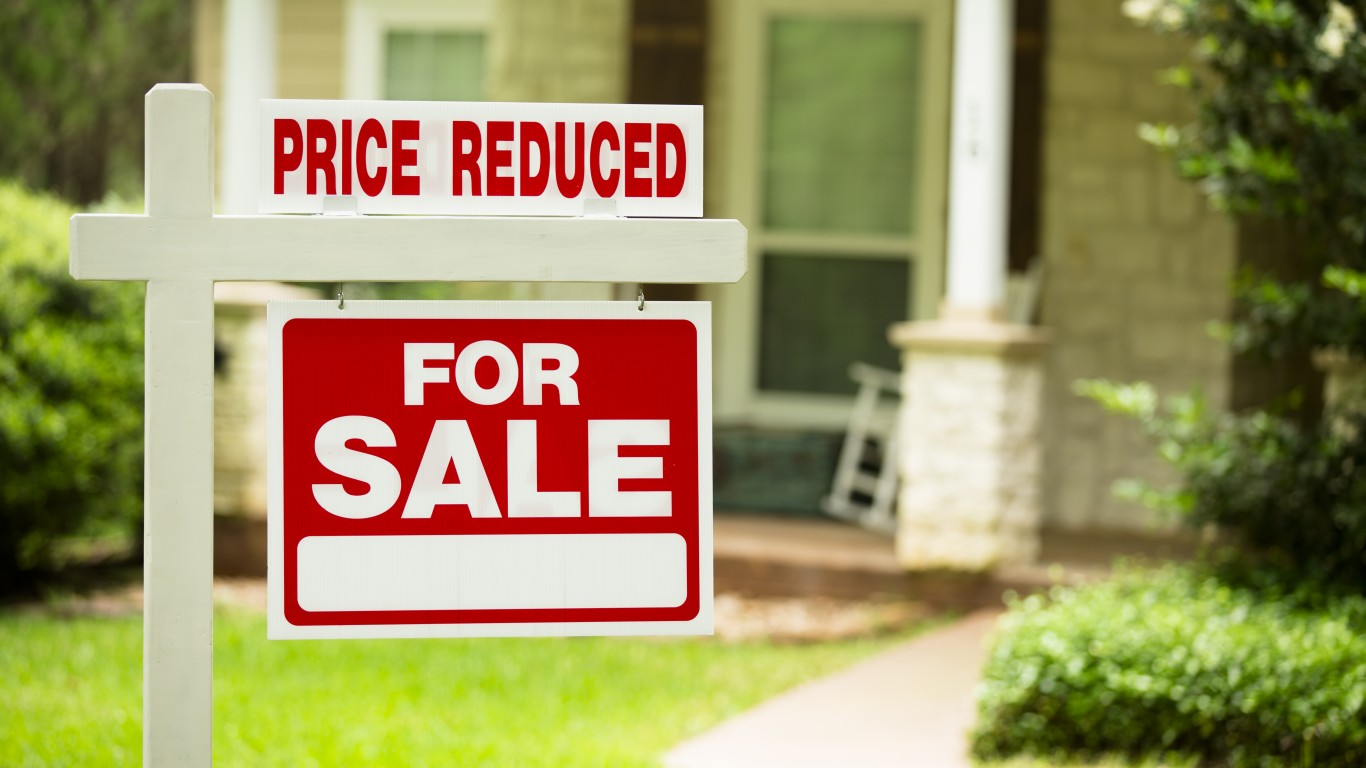
Amid rising demand and ongoing supply shortages, home prices have surged in the United States in recent years. The typical home for sale in the U.S. is listed for $424,900, up over 40% from early 2020, before the onset of the COVID-19 pandemic and the resulting economic fallout. When compared against wage increases, rising home prices are even more alarming.
24/7 Wall St. Key Points:
- America’s housing affordability crisis has continued into 2025, and according to a recent study, an estimated 75% of U.S. households are unable to afford a home in today’s market.
- Still, location matters when it comes to real estate, and in certain parts of the country, homeownership remains affordable for a relatively large share of the population.
- Also: Discover the next Nvidia
According to the Bureau of Labor Statistics, median inflation-adjusted earnings climbed by only 2% between the beginning of 2020 and late 2024 — while the Case-Shiller home price index rose by more than 50% over roughly the same period. This imbalance has only continued in 2025. According to data from Realtor.com, the typical home list price climbed 6% from January to March 2035. Meanwhile, real wages for American workers climbed by only 0.1% in February and 0.3% in March of this year.
These trends, spread out over the course of years, have given way to a housing affordability crisis. A recent study from the National Association of Home Builders found that, when factoring in mortgage rates and borrowing costs, nearly 75% of American households would be unable to afford a typical home in today’s market.
Notably, however, perhaps more so than in any other domestic industry, location matters when it comes to real estate. And in some parts of the country, the mismatch between incomes and home prices is far less pronounced than it is nationwide.
Using county-level data from Realtor.com, 24/7 Wall St. identified the most affordable housing market in each state. We reviewed the median list price in March 2025 for over 3,000 U.S. counties and county equivalents and calculated the local housing affordability ratio using five year estimates of median household income from the U.S. Census Bureau’s American Community Survey. To avoid statistical anomalies, only counties with at least 100 listed homes in March 2025 were considered.
Among the counties and county equivalents on this list, median list prices are anywhere from 1.6 to 6.5 times higher than the median household income. In every case, homes in these areas are more affordable than they are across the state as a whole — and in all but six counties on this list, the homeownership affordability ratio is more favorable than the 5.4-to-1 national average. (Here is a look at the states with the highest foreclosure rates.)
Housing affordability is the product of two factors: income and home prices. As a result, even in wealthy areas, housing can be unaffordable if home prices are high enough. Similarly, a county with below average home prices can also be unaffordable if incomes are low enough. Notably, in most counties on this list, not only are incomes higher than they are across the state as a whole, but home prices are also lower than they are statewide. (This is how Baby Boomers impacted the housing market for younger buyers.)
These are the most affordable housing markets in each state.
Why It Matters

Supply constraints and rising demand have given way to a housing affordability crisis in the United States. Not even considering historically high mortgage rates, the typical American home has a median list price that is over five times more than what the typical household earns in a year. Notably, however, some parts of the country appear to have been somewhat spared from the housing crisis. In these places, home prices are more closely tied to incomes than is common in much of the rest of the country.
Alabama: Dallas County

- Median home price to income ratio: 2.9 to 1 (5.2 to 1 statewide)
- Median home list price in March 2025: $108,000 ($325,000 statewide)
- Median home list price per square foot: $71 ($166 statewide)
- Median household income: $36,810 ($62,027 statewide)
- 1-year change in median list price: +35.5% (-1.4% statewide)
- Listed homes in county, March 2025: 137
- Counties considered in state: 39
Alaska: Fairbanks North Star Borough

- Median home price to income ratio: 4.0 to 1 (4.8 to 1 statewide)
- Median home list price in March 2025: $335,000 ($429,000 statewide)
- Median home list price per square foot: $197 ($249 statewide)
- Median household income: $84,722 ($89,336 statewide)
- 1-year change in median list price: +8.4% (+7.3% statewide)
- Listed homes in borough, March 2025: 144
- County equivalents considered in state: 4
Arizona: Pinal County
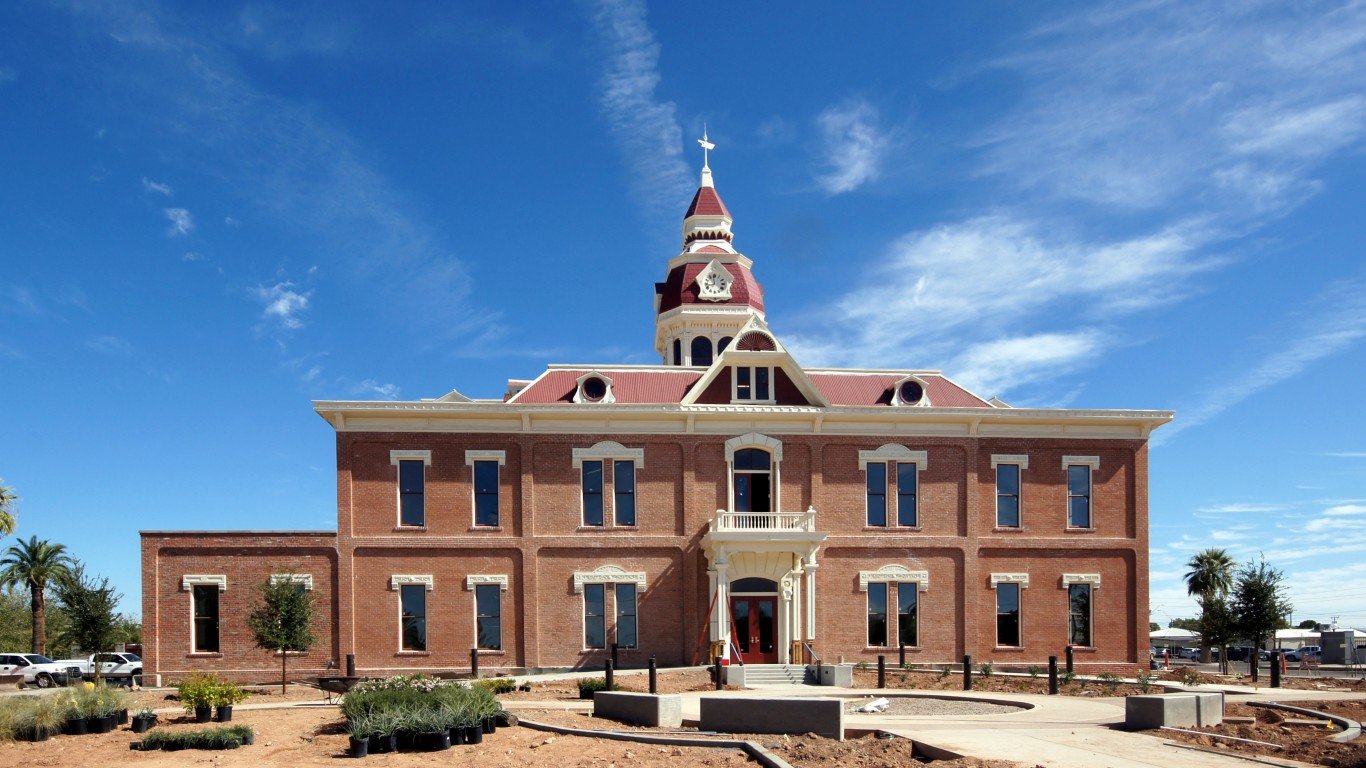
- Median home price to income ratio: 5.2 to 1 (6.4 to 1 statewide)
- Median home list price in March 2025: $407,000 ($495,000 statewide)
- Median home list price per square foot: $217 ($269 statewide)
- Median household income: $77,588 ($76,872 statewide)
- 1-year change in median list price: +0.4% (-1.0% statewide)
- Listed homes in county, March 2025: 3,992
- Counties considered in state: 13
Arkansas: Jefferson County

- Median home price to income ratio: 2.9 to 1 (5.0 to 1 statewide)
- Median home list price in March 2025: $140,500 ($295,000 statewide)
- Median home list price per square foot: $78 ($156 statewide)
- Median household income: $48,552 ($58,773 statewide)
- 1-year change in median list price: +12.4% (+0.0% statewide)
- Listed homes in county, March 2025: 247
- Counties considered in state: 33
California: Lassen County
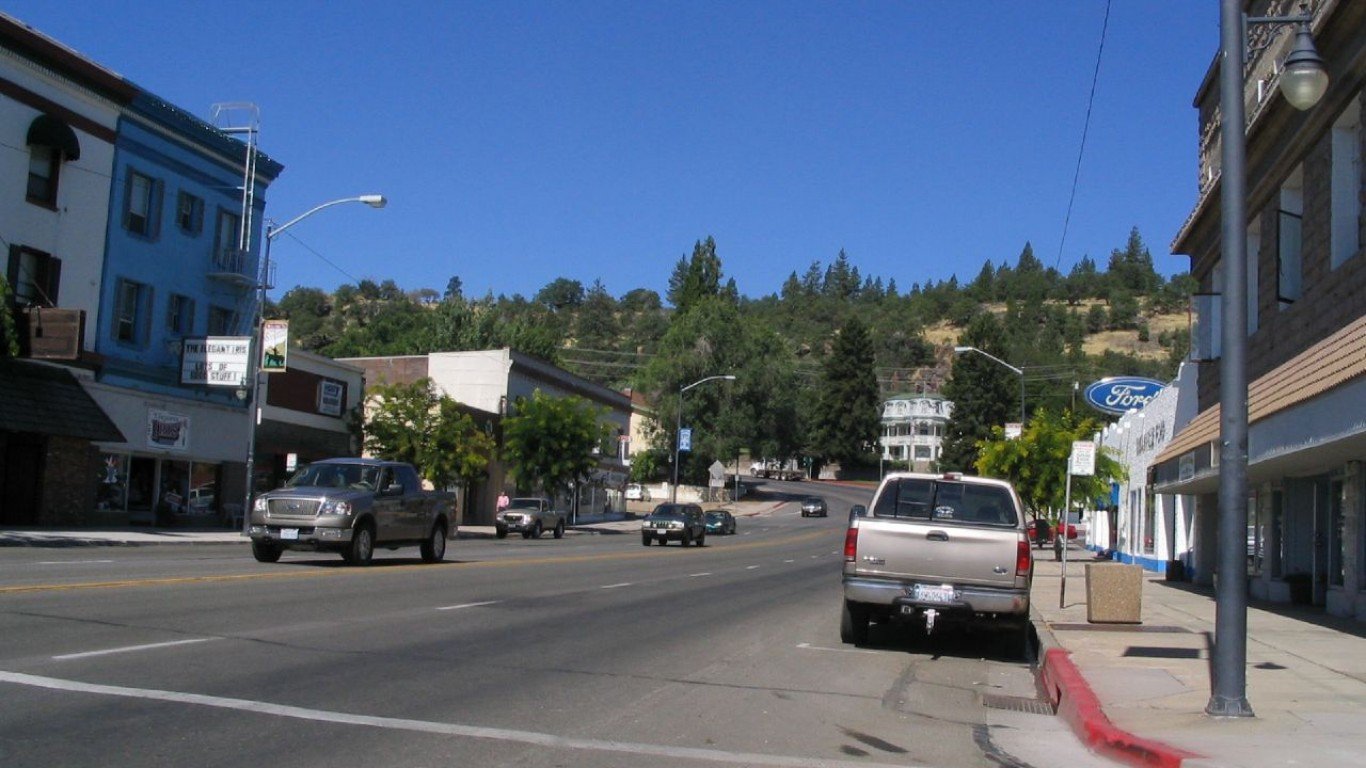
- Median home price to income ratio: 4.3 to 1 (7.8 to 1 statewide)
- Median home list price in March 2025: $279,000 ($749,900 statewide)
- Median home list price per square foot: $184 ($467 statewide)
- Median household income: $64,395 ($96,334 statewide)
- 1-year change in median list price: -10.0% (+0.0% statewide)
- Listed homes in county, March 2025: 134
- Counties considered in state: 52
Colorado: Moffat County
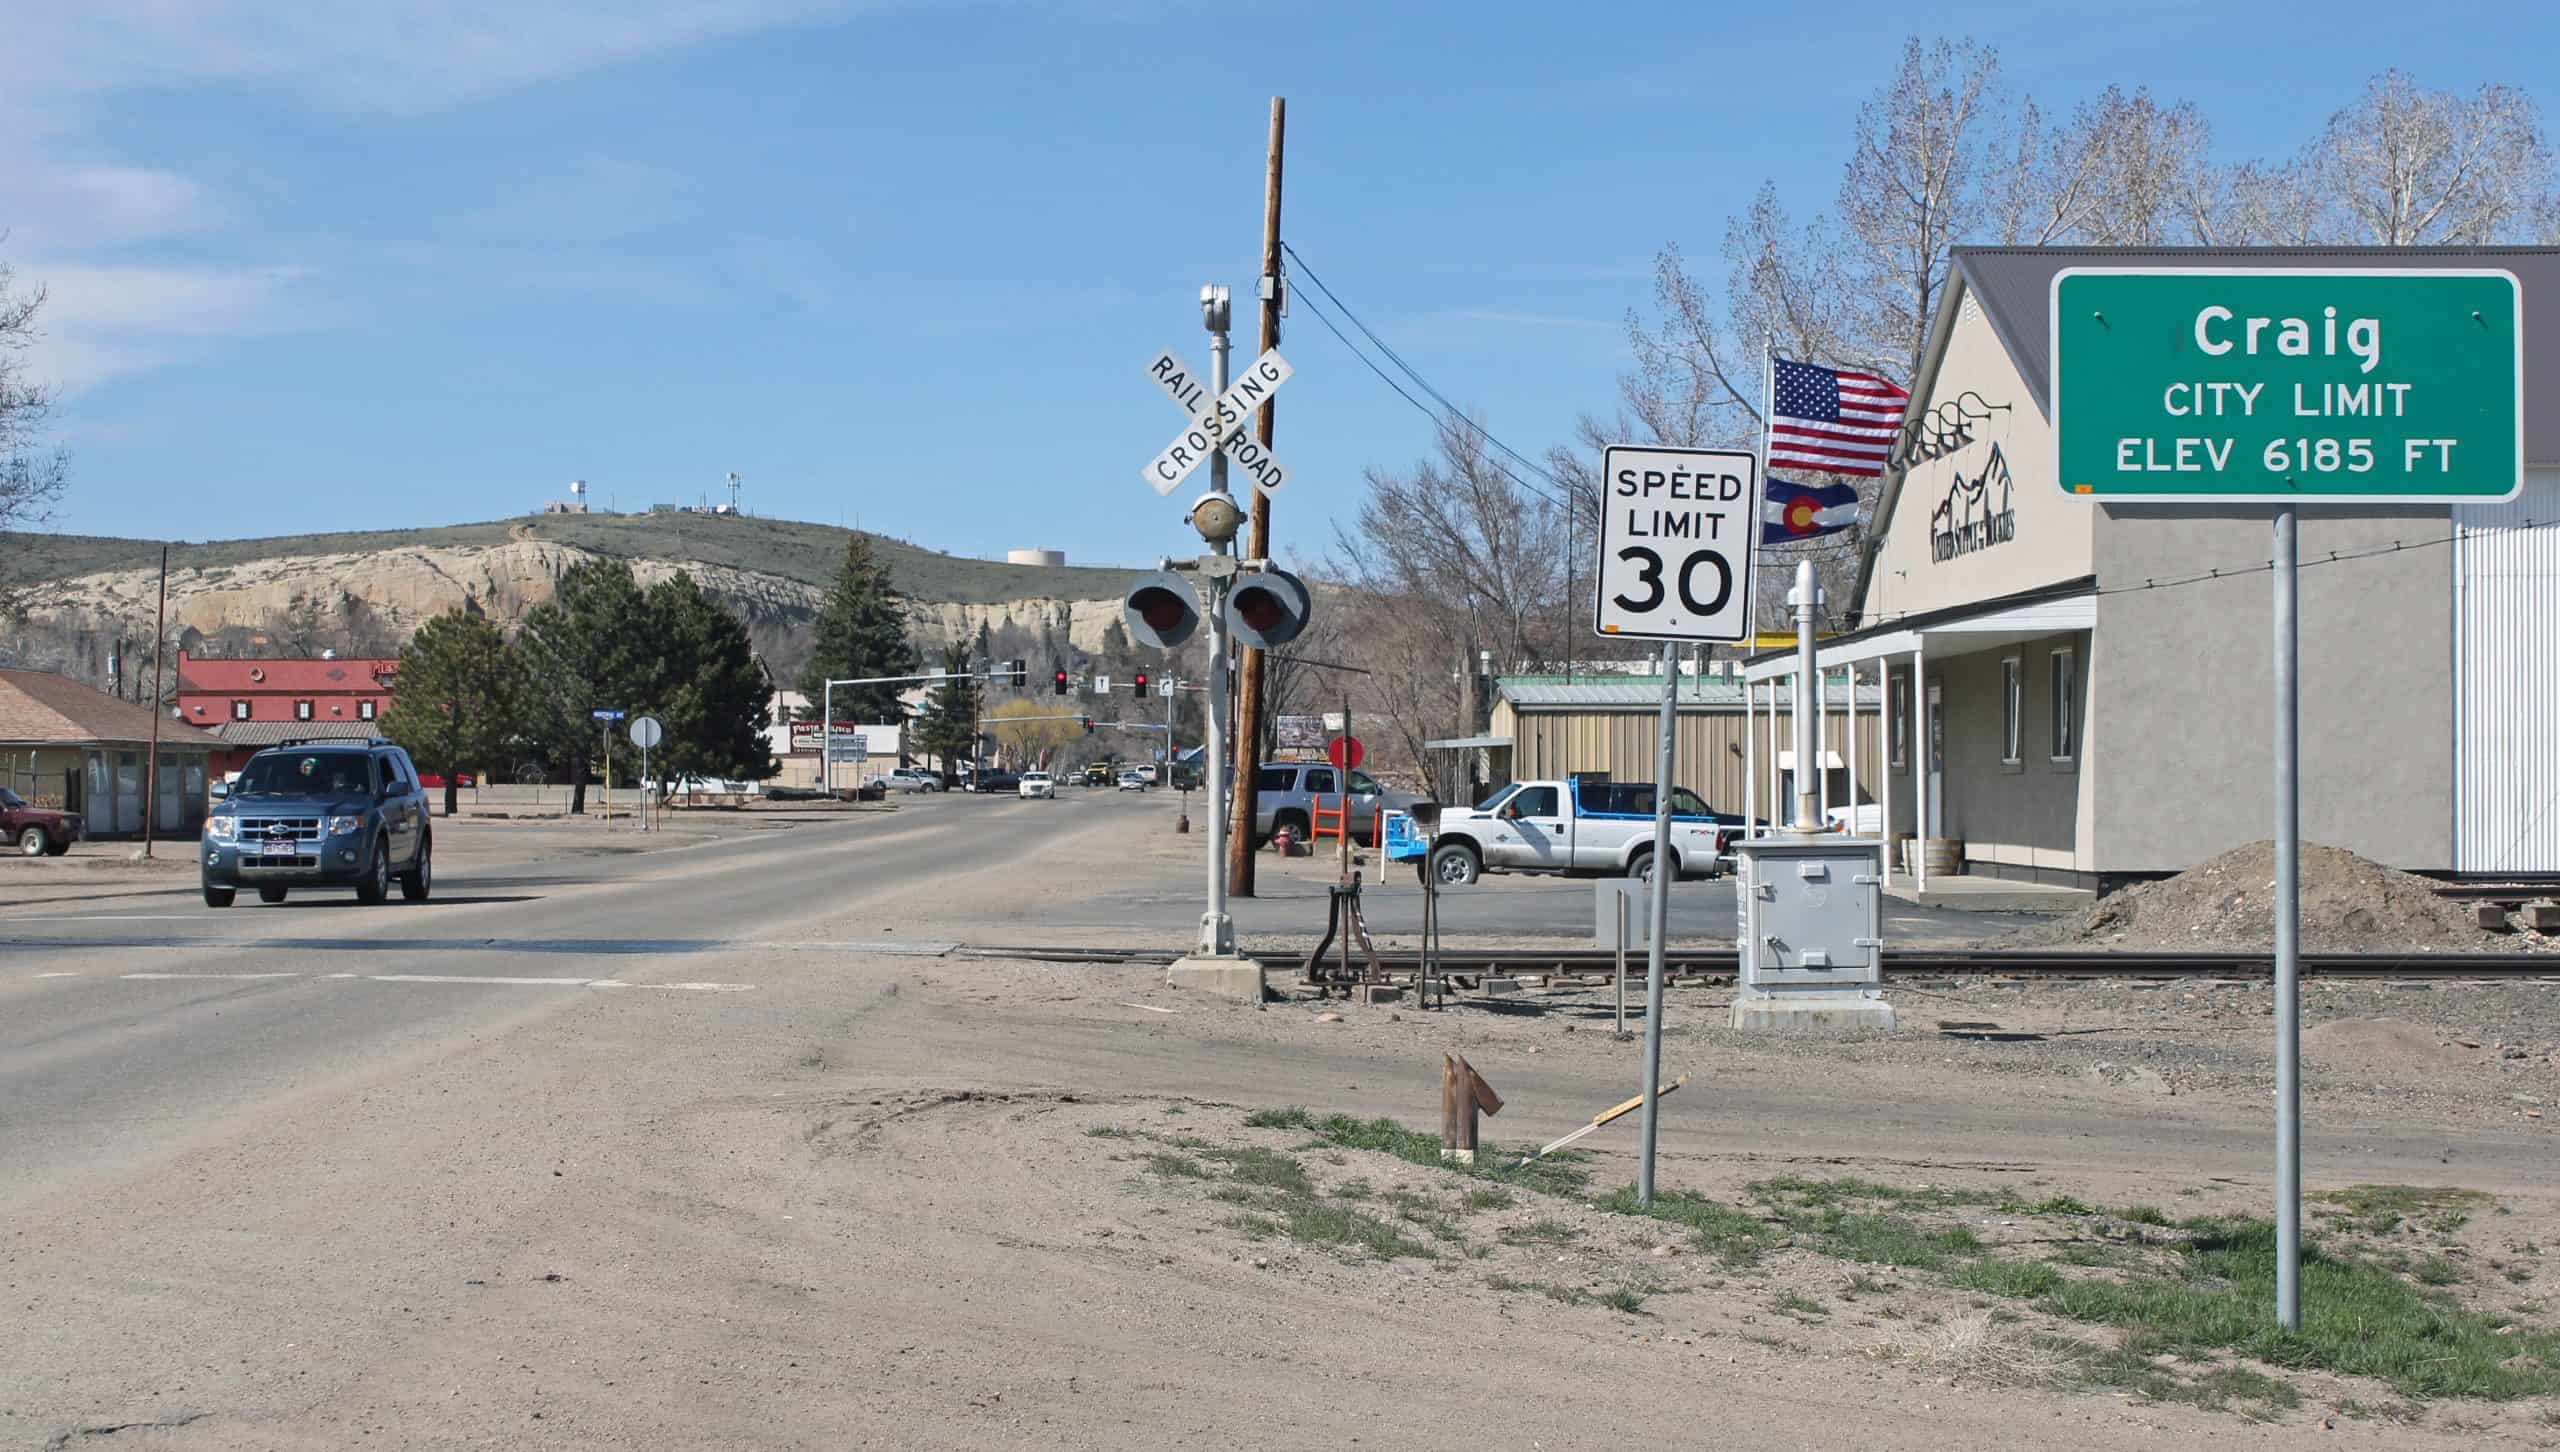
- Median home price to income ratio: 4.6 to 1 (6.2 to 1 statewide)
- Median home list price in March 2025: $329,000 ($575,000 statewide)
- Median home list price per square foot: $229 ($291 statewide)
- Median household income: $70,975 ($92,470 statewide)
- 1-year change in median list price: -14.0% (-4.2% statewide)
- Listed homes in county, March 2025: 104
- Counties considered in state: 35
Connecticut: Capitol Planning Region

- Median home price to income ratio: 4.4 to 1 (5.3 to 1 statewide)
- Median home list price in March 2025: $399,900 ($499,900 statewide)
- Median home list price per square foot: $243 ($291 statewide)
- Median household income: $91,541 ($93,760 statewide)
- 1-year change in median list price: +6.6% (-0.7% statewide)
- Listed homes in county, March 2025: 1,544
- Counties considered in state: 9
Delaware: New Castle County
- Median home price to income ratio: 4.3 to 1 (5.9 to 1 statewide)
- Median home list price in March 2025: $389,900 ($485,000 statewide)
- Median home list price per square foot: $217 ($238 statewide)
- Median household income: $89,901 ($82,855 statewide)
- 1-year change in median list price: -7.1% (-2.0% statewide)
- Listed homes in county, March 2025: 1,294
- Counties considered in state: 3
Florida: Clay County

- Median home price to income ratio: 4.4 to 1 (6.1 to 1 statewide)
- Median home list price in March 2025: $380,000 ($439,000 statewide)
- Median home list price per square foot: $196 ($269 statewide)
- Median household income: $86,094 ($71,711 statewide)
- 1-year change in median list price: +4.1% (-3.5% statewide)
- Listed homes in county, March 2025: 1,409
- Counties considered in state: 53
Georgia: Dougherty County
- Median home price to income ratio: 3.0 to 1 (5.2 to 1 statewide)
- Median home list price in March 2025: $139,667 ($389,000 statewide)
- Median home list price per square foot: $95 ($190 statewide)
- Median household income: $46,784 ($74,664 statewide)
- 1-year change in median list price: +21.5% (-0.2% statewide)
- Listed homes in county, March 2025: 337
- Counties considered in state: 79
Hawaii: Honolulu County

- Median home price to income ratio: 6.5 to 1 (8.0 to 1 statewide)
- Median home list price in March 2025: $675,000 ($785,000 statewide)
- Median home list price per square foot: $657 ($723 statewide)
- Median household income: $104,264 ($98,317 statewide)
- 1-year change in median list price: -10.0% (-7.1% statewide)
- Listed homes in county, March 2025: 4,171
- Counties considered in state: 4
Idaho: Bonneville County

- Median home price to income ratio: 5.5 to 1 (7.6 to 1 statewide)
- Median home list price in March 2025: $425,000 ($569,993 statewide)
- Median home list price per square foot: $175 ($281 statewide)
- Median household income: $76,646 ($74,636 statewide)
- 1-year change in median list price: -7.6% (+0.9% statewide)
- Listed homes in county, March 2025: 511
- Counties considered in state: 18
Illinois: Fulton County

- Median home price to income ratio: 1.6 to 1 (3.7 to 1 statewide)
- Median home list price in March 2025: $92,400 ($299,984 statewide)
- Median home list price per square foot: $73 ($183 statewide)
- Median household income: $58,617 ($81,702 statewide)
- 1-year change in median list price: +2.8% (-5.3% statewide)
- Listed homes in county, March 2025: 106
- Counties considered in state: 37
Indiana: Grant County

- Median home price to income ratio: 2.1 to 1 (4.1 to 1 statewide)
- Median home list price in March 2025: $116,000 ($289,900 statewide)
- Median home list price per square foot: $92 ($156 statewide)
- Median household income: $54,007 ($70,051 statewide)
- 1-year change in median list price: -19.7% (-0.6% statewide)
- Listed homes in county, March 2025: 175
- Counties considered in state: 39
Iowa: Lee County

- Median home price to income ratio: 2.1 to 1 (3.9 to 1 statewide)
- Median home list price in March 2025: $124,000 ($284,900 statewide)
- Median home list price per square foot: $80 ($174 statewide)
- Median household income: $59,803 ($73,147 statewide)
- 1-year change in median list price: -6.4% (-5.0% statewide)
- Listed homes in county, March 2025: 133
- Counties considered in state: 25
Kansas: Cowley County

- Median home price to income ratio: 2.6 to 1 (4.0 to 1 statewide)
- Median home list price in March 2025: $149,900 ($289,000 statewide)
- Median home list price per square foot: $91 ($152 statewide)
- Median household income: $58,263 ($72,639 statewide)
- 1-year change in median list price: +24.9% (-8.1% statewide)
- Listed homes in county, March 2025: 126
- Counties considered in state: 18
Kentucky: Boyd County

- Median home price to income ratio: 3.3 to 1 (4.8 to 1 statewide)
- Median home list price in March 2025: $199,500 ($300,000 statewide)
- Median home list price per square foot: $112 ($170 statewide)
- Median household income: $60,659 ($62,417 statewide)
- 1-year change in median list price: +33.9% (-1.3% statewide)
- Listed homes in county, March 2025: 146
- Counties considered in state: 36
Louisiana: Iberia Parish

- Median home price to income ratio: 2.9 to 1 (4.6 to 1 statewide)
- Median home list price in March 2025: $169,999 ($279,000 statewide)
- Median home list price per square foot: $97 ($153 statewide)
- Median household income: $57,811 ($60,023 statewide)
- 1-year change in median list price: -10.5% (+0.0% statewide)
- Listed homes in parish, March 2025: 210
- Parishes considered in state: 32
Maine: Aroostook County

- Median home price to income ratio: 4.2 to 1 (6.4 to 1 statewide)
- Median home list price in March 2025: $227,000 ($457,000 statewide)
- Median home list price per square foot: $138 ($289 statewide)
- Median household income: $54,254 ($71,773 statewide)
- 1-year change in median list price: +13.6% (+5.1% statewide)
- Listed homes in county, March 2025: 272
- Counties considered in state: 14
Maryland: Allegany County

- Median home price to income ratio: 2.7 to 1 (4.2 to 1 statewide)
- Median home list price in March 2025: $155,000 ($429,000 statewide)
- Median home list price per square foot: $105 ($236 statewide)
- Median household income: $57,393 ($101,652 statewide)
- 1-year change in median list price: +3.3% (+7.3% statewide)
- Listed homes in county, March 2025: 236
- Counties considered in state: 23
Massachusetts: Hampden County

- Median home price to income ratio: 4.7 to 1 (7.9 to 1 statewide)
- Median home list price in March 2025: $329,900 ($798,000 statewide)
- Median home list price per square foot: $228 ($446 statewide)
- Median household income: $70,535 ($101,341 statewide)
- 1-year change in median list price: +1.5% (-0.2% statewide)
- Listed homes in county, March 2025: 413
- Counties considered in state: 13
Michigan: Wayne County

- Median home price to income ratio: 2.4 to 1 (3.9 to 1 statewide)
- Median home list price in March 2025: $145,000 ($275,000 statewide)
- Median home list price per square foot: $120 ($174 statewide)
- Median household income: $59,521 ($71,149 statewide)
- 1-year change in median list price: +15.2% (+0.0% statewide)
- Listed homes in county, March 2025: 5,214
- Counties considered in state: 52
Minnesota: Ramsey County

- Median home price to income ratio: 4.0 to 1 (4.6 to 1 statewide)
- Median home list price in March 2025: $325,000 ($399,000 statewide)
- Median home list price per square foot: $212 ($205 statewide)
- Median household income: $81,004 ($87,556 statewide)
- 1-year change in median list price: +0.0% (-0.2% statewide)
- Listed homes in county, March 2025: 1,029
- Counties considered in state: 29
Mississippi: Washington County

- Median home price to income ratio: 3.2 to 1 (5.3 to 1 statewide)
- Median home list price in March 2025: $127,000 ($291,650 statewide)
- Median home list price per square foot: $74 ($147 statewide)
- Median household income: $40,117 ($54,915 statewide)
- 1-year change in median list price: -5.9% (+2.3% statewide)
- Listed homes in county, March 2025: 110
- Counties considered in state: 24
Missouri: Dunklin County

- Median home price to income ratio: 2.1 to 1 (4.3 to 1 statewide)
- Median home list price in March 2025: $99,950 ($299,500 statewide)
- Median home list price per square foot: $70 ($172 statewide)
- Median household income: $47,368 ($68,920 statewide)
- 1-year change in median list price: -11.9% (+0.2% statewide)
- Listed homes in county, March 2025: 101
- Counties considered in state: 46
Montana: Yellowstone County

- Median home price to income ratio: 6.0 to 1 (8.9 to 1 statewide)
- Median home list price in March 2025: $449,900 ($624,000 statewide)
- Median home list price per square foot: $211 ($318 statewide)
- Median household income: $74,400 ($69,922 statewide)
- 1-year change in median list price: -5.3% (-0.2% statewide)
- Listed homes in county, March 2025: 648
- Counties considered in state: 12
Nebraska: Dodge County

- Median home price to income ratio: 3.3 to 1 (4.7 to 1 statewide)
- Median home list price in March 2025: $234,900 ($350,000 statewide)
- Median home list price per square foot: $159 ($174 statewide)
- Median household income: $71,294 ($74,985 statewide)
- 1-year change in median list price: -10.5% (-2.2% statewide)
- Listed homes in county, March 2025: 131
- Counties considered in state: 9
Nevada: Elko County

- Median home price to income ratio: 5.9 to 1 (6.4 to 1 statewide)
- Median home list price in March 2025: $491,450 ($485,000 statewide)
- Median home list price per square foot: $239 ($276 statewide)
- Median household income: $83,427 ($75,561 statewide)
- 1-year change in median list price: +21.1% (-0.4% statewide)
- Listed homes in county, March 2025: 208
- Counties considered in state: 7
New Hampshire: Sullivan County

- Median home price to income ratio: 5.6 to 1 (6.1 to 1 statewide)
- Median home list price in March 2025: $422,000 ($585,000 statewide)
- Median home list price per square foot: $224 ($314 statewide)
- Median household income: $75,929 ($95,628 statewide)
- 1-year change in median list price: -0.5% (+2.0% statewide)
- Listed homes in county, March 2025: 115
- Counties considered in state: 10
New Jersey: Sussex County

- Median home price to income ratio: 3.5 to 1 (5.4 to 1 statewide)
- Median home list price in March 2025: $399,950 ($550,000 statewide)
- Median home list price per square foot: $261 ($308 statewide)
- Median household income: $114,316 ($101,050 statewide)
- 1-year change in median list price: +0.0% (+0.2% statewide)
- Listed homes in county, March 2025: 509
- Counties considered in state: 21
New Mexico: Lea County

- Median home price to income ratio: 3.7 to 1 (6.3 to 1 statewide)
- Median home list price in March 2025: $257,500 ($390,410 statewide)
- Median home list price per square foot: $144 ($206 statewide)
- Median household income: $68,750 ($62,125 statewide)
- 1-year change in median list price: +30.9% (+1.4% statewide)
- Listed homes in county, March 2025: 162
- Counties considered in state: 16
New York: Chemung County

- Median home price to income ratio: 2.6 to 1 (8.3 to 1 statewide)
- Median home list price in March 2025: $164,900 ($699,000 statewide)
- Median home list price per square foot: $106 ($437 statewide)
- Median household income: $63,469 ($84,578 statewide)
- 1-year change in median list price: -5.7% (+2.0% statewide)
- Listed homes in county, March 2025: 304
- Counties considered in state: 52
North Carolina: Edgecombe County

- Median home price to income ratio: 3.6 to 1 (5.7 to 1 statewide)
- Median home list price in March 2025: $174,963 ($400,000 statewide)
- Median home list price per square foot: $124 ($220 statewide)
- Median household income: $48,480 ($69,904 statewide)
- 1-year change in median list price: -5.9% (+0.0% statewide)
- Listed homes in county, March 2025: 163
- Counties considered in state: 77
North Dakota: Ward County
- Median home price to income ratio: 4.1 to 1 (4.9 to 1 statewide)
- Median home list price in March 2025: $324,900 ($369,900 statewide)
- Median home list price per square foot: $141 ($170 statewide)
- Median household income: $79,273 ($75,949 statewide)
- 1-year change in median list price: +3.3% (+5.7% statewide)
- Listed homes in county, March 2025: 190
- Counties considered in state: 6
Ohio: Summit County

- Median home price to income ratio: 2.8 to 1 (3.9 to 1 statewide)
- Median home list price in March 2025: $199,900 ($269,000 statewide)
- Median home list price per square foot: $139 ($162 statewide)
- Median household income: $71,016 ($69,680 statewide)
- 1-year change in median list price: +0.5% (+3.5% statewide)
- Listed homes in county, March 2025: 1,258
- Counties considered in state: 54
Oklahoma: Okmulgee County

- Median home price to income ratio: 2.5 to 1 (4.7 to 1 statewide)
- Median home list price in March 2025: $132,950 ($299,900 statewide)
- Median home list price per square foot: $101 ($164 statewide)
- Median household income: $53,123 ($63,603 statewide)
- 1-year change in median list price: -21.8% (+0.6% statewide)
- Listed homes in county, March 2025: 154
- Counties considered in state: 40
Oregon: Umatilla County

- Median home price to income ratio: 5.1 to 1 (7.0 to 1 statewide)
- Median home list price in March 2025: $349,900 ($564,000 statewide)
- Median home list price per square foot: $219 ($309 statewide)
- Median household income: $68,958 ($80,426 statewide)
- 1-year change in median list price: +1.1% (+2.6% statewide)
- Listed homes in county, March 2025: 228
- Counties considered in state: 25
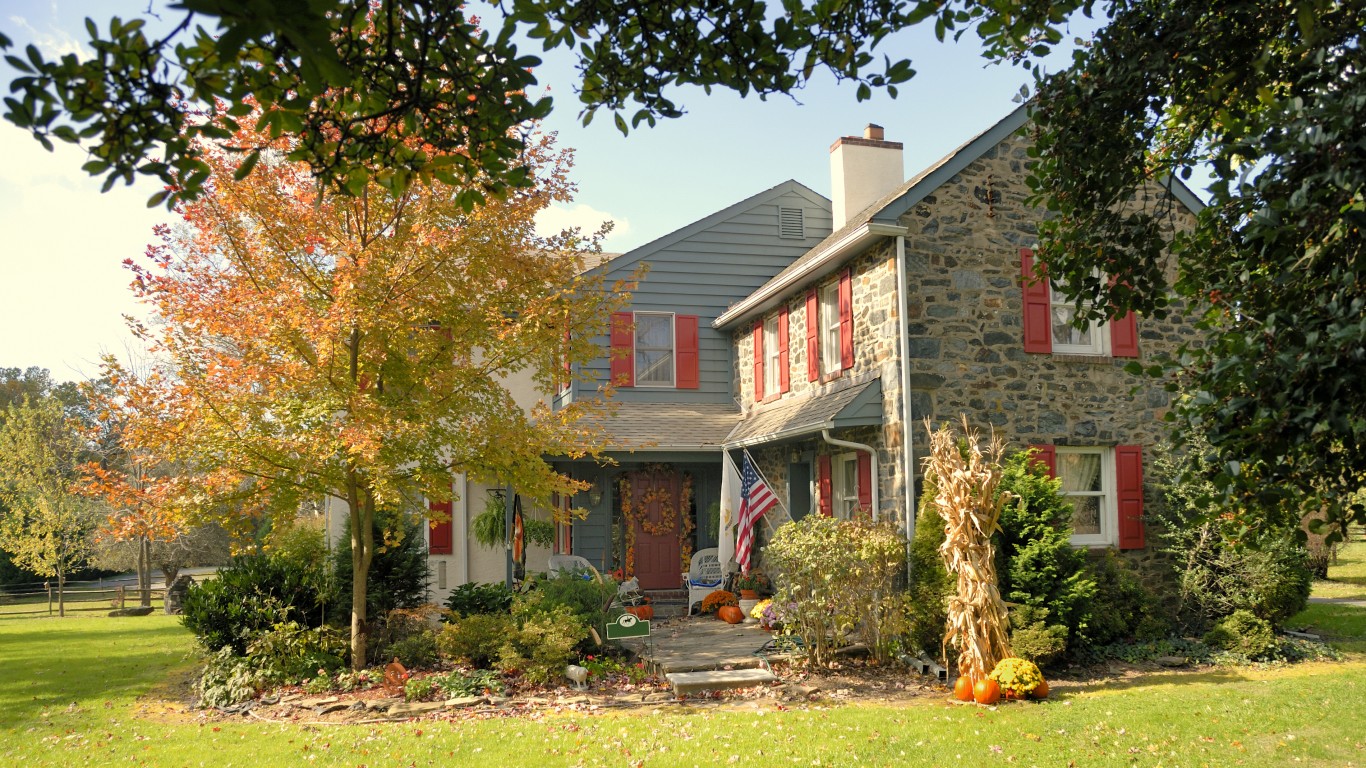
Pennsylvania: Lawrence County

- Median home price to income ratio: 1.9 to 1 (3.9 to 1 statewide)
- Median home list price in March 2025: $115,900 ($299,999 statewide)
- Median home list price per square foot: $69 ($189 statewide)
- Median household income: $60,779 ($76,081 statewide)
- 1-year change in median list price: -14.2% (+0.3% statewide)
- Listed homes in county, March 2025: 298
- Counties considered in state: 47
Rhode Island: Kent County

- Median home price to income ratio: 5.1 to 1 (6.3 to 1 statewide)
- Median home list price in March 2025: $470,000 ($539,900 statewide)
- Median home list price per square foot: $297 ($324 statewide)
- Median household income: $91,278 ($86,372 statewide)
- 1-year change in median list price: +4.4% (+10.4% statewide)
- Listed homes in county, March 2025: 426
- Counties considered in state: 4
South Carolina: Lexington County
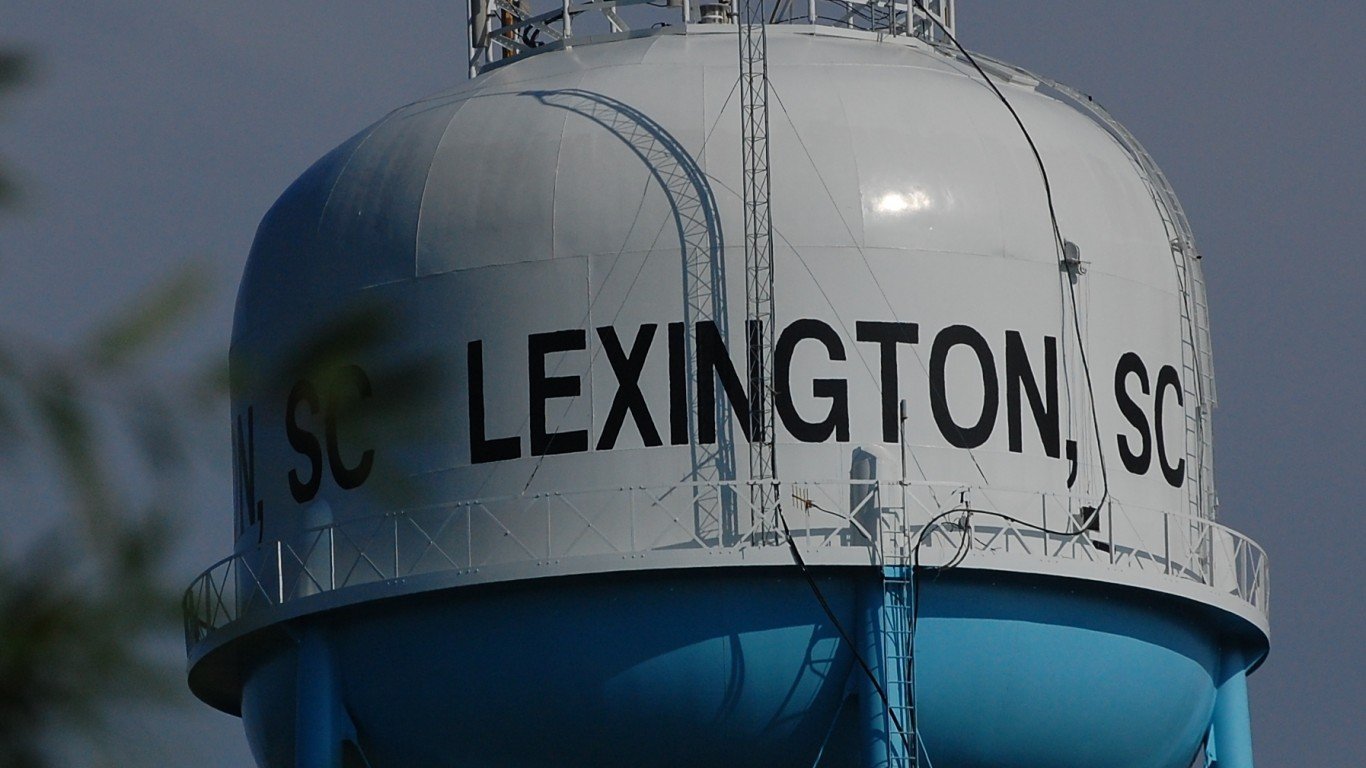
- Median home price to income ratio: 4.4 to 1 (5.4 to 1 statewide)
- Median home list price in March 2025: $329,900 ($360,000 statewide)
- Median home list price per square foot: $159 ($204 statewide)
- Median household income: $75,014 ($66,818 statewide)
- 1-year change in median list price: +4.4% (+2.9% statewide)
- Listed homes in county, March 2025: 1,451
- Counties considered in state: 32
South Dakota: Lincoln County

- Median home price to income ratio: 4.0 to 1 (5.3 to 1 statewide)
- Median home list price in March 2025: $389,800 ($382,128 statewide)
- Median home list price per square foot: $212 ($212 statewide)
- Median household income: $96,552 ($72,421 statewide)
- 1-year change in median list price: +3.7% (+0.8% statewide)
- Listed homes in county, March 2025: 445
- Counties considered in state: 6
Tennessee: Gibson County

- Median home price to income ratio: 4.2 to 1 (6.4 to 1 statewide)
- Median home list price in March 2025: $245,000 ($427,400 statewide)
- Median home list price per square foot: $150 ($231 statewide)
- Median household income: $59,009 ($67,097 statewide)
- 1-year change in median list price: +6.5% (-1.8% statewide)
- Listed homes in county, March 2025: 220
- Counties considered in state: 63
Texas: Hutchinson County
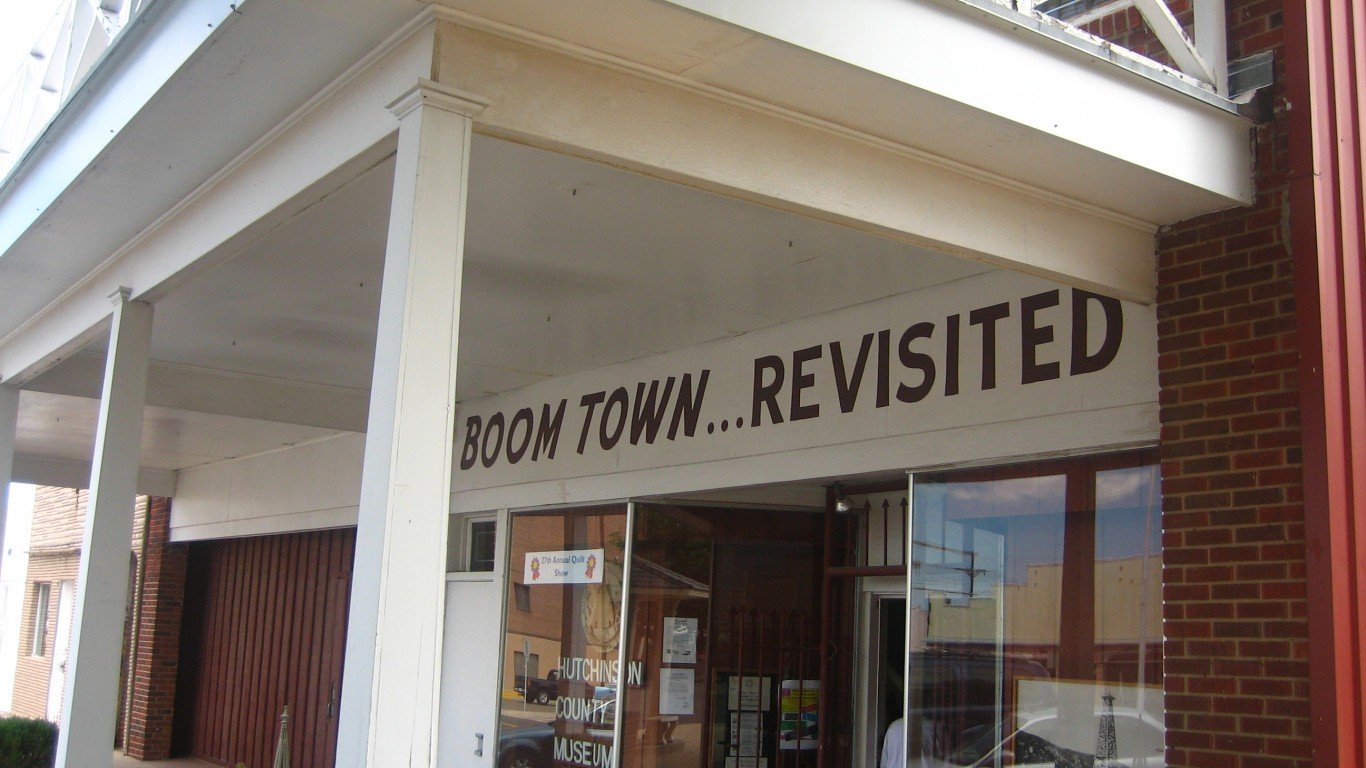
- Median home price to income ratio: 2.6 to 1 (4.8 to 1 statewide)
- Median home list price in March 2025: $169,250 ($364,900 statewide)
- Median home list price per square foot: $93 ($186 statewide)
- Median household income: $65,470 ($76,292 statewide)
- 1-year change in median list price: +35.4% (-0.0% statewide)
- Listed homes in county, March 2025: 115
- Counties considered in state: 124
Utah: Davis County
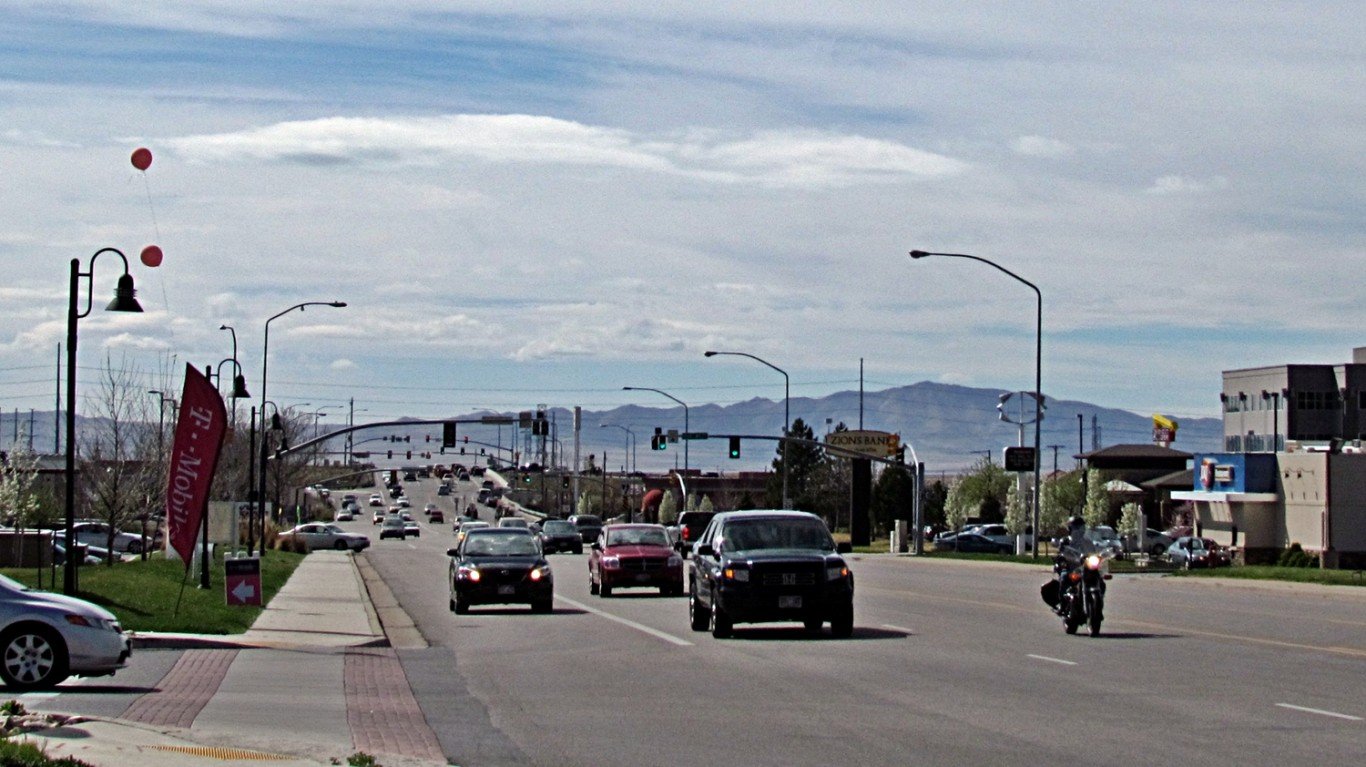
- Median home price to income ratio: 5.1 to 1 (6.4 to 1 statewide)
- Median home list price in March 2025: $549,999 ($589,990 statewide)
- Median home list price per square foot: $240 ($259 statewide)
- Median household income: $108,058 ($91,750 statewide)
- 1-year change in median list price: -2.1% (-1.7% statewide)
- Listed homes in county, March 2025: 888
- Counties considered in state: 17
Vermont: Franklin County

- Median home price to income ratio: 5.2 to 1 (6.4 to 1 statewide)
- Median home list price in March 2025: $412,000 ($499,900 statewide)
- Median home list price per square foot: $223 ($266 statewide)
- Median household income: $79,078 ($78,024 statewide)
- 1-year change in median list price: -4.2% (+4.4% statewide)
- Listed homes in county, March 2025: 141
- Counties considered in state: 9
Virginia: Tazewell County

- Median home price to income ratio: 4.1 to 1 (4.9 to 1 statewide)
- Median home list price in March 2025: $189,000 ($449,000 statewide)
- Median home list price per square foot: $102 ($231 statewide)
- Median household income: $45,788 ($90,974 statewide)
- 1-year change in median list price: -0.5% (+4.3% statewide)
- Listed homes in county, March 2025: 119
- Counties considered in state: 63
Washington: Grant County

- Median home price to income ratio: 5.7 to 1 (6.6 to 1 statewide)
- Median home list price in March 2025: $406,490 ($629,997 statewide)
- Median home list price per square foot: $256 ($343 statewide)
- Median household income: $71,115 ($94,952 statewide)
- 1-year change in median list price: +1.9% (+0.0% statewide)
- Listed homes in county, March 2025: 466
- Counties considered in state: 29
West Virginia: Marion County

- Median home price to income ratio: 2.4 to 1 (4.5 to 1 statewide)
- Median home list price in March 2025: $165,000 ($259,000 statewide)
- Median home list price per square foot: $121 ($144 statewide)
- Median household income: $67,537 ($57,917 statewide)
- 1-year change in median list price: -24.1% (+8.4% statewide)
- Listed homes in county, March 2025: 140
- Counties considered in state: 15
Wisconsin: Manitowoc County

- Median home price to income ratio: 3.6 to 1 (5.1 to 1 statewide)
- Median home list price in March 2025: $249,900 ($385,450 statewide)
- Median home list price per square foot: $159 ($214 statewide)
- Median household income: $68,611 ($75,670 statewide)
- 1-year change in median list price: -2.0% (+1.5% statewide)
- Listed homes in county, March 2025: 167
- Counties considered in state: 36
Wyoming: Campbell County
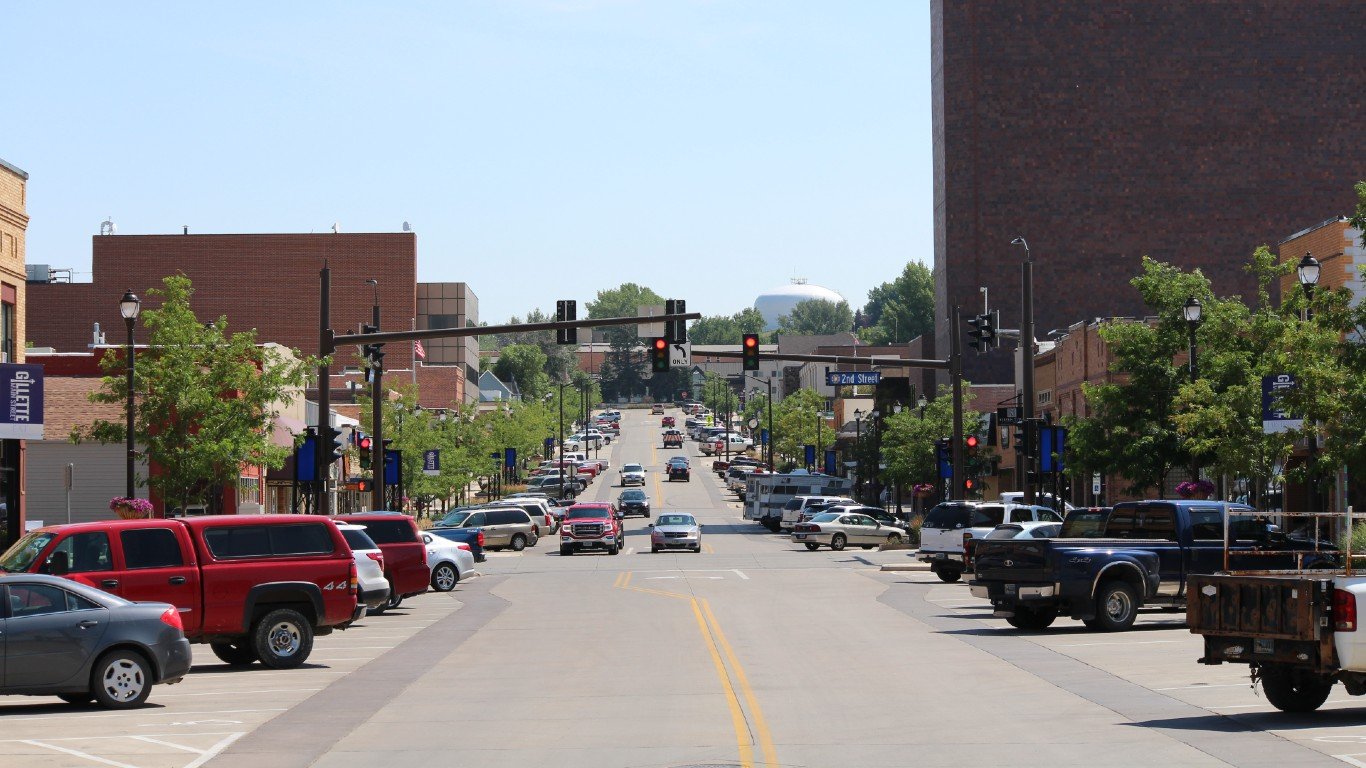
- Median home price to income ratio: 4.0 to 1 (6.1 to 1 statewide)
- Median home list price in March 2025: $379,000 ($459,900 statewide)
- Median home list price per square foot: $154 ($208 statewide)
- Median household income: $95,253 ($74,815 statewide)
- 1-year change in median list price: -9.7% (+2.4% statewide)
- Listed homes in county, March 2025: 141
- Counties considered in state: 9
The post This Is the Most Affordable Housing Market In Every State appeared first on 24/7 Wall St..