


December Non-OPEC and World Oil Production Rose
By Ovi The focus of this post is an overview of World oil production along with a more detailed review of the top 11 Non-OPEC oil producing countries. OPEC production is covered in a separate post. Below are a number of Crude plus Condensate (C + C) production charts, usually shortened to “oil”, for oil […]

By Ovi
The focus of this post is an overview of World oil production along with a more detailed review of the top 11 Non-OPEC oil producing countries. OPEC production is covered in a separate post.
Below are a number of Crude plus Condensate (C + C) production charts, usually shortened to “oil”, for oil producing countries. The charts are created from data provided by the EIA’s International Energy Statistics and are updated to December 2024. This is the latest and most detailed/complete World oil production information available. Information from other sources such as OPEC, the STEO and country specific sites such as Brazil, Norway, Mexico, Argentina and China is used to provide a short term outlook.
World oil production increased by 383 kb/d in December to 82,386 kb/d, green graph. The largest increases came from Brazil, 109 kb/d and US, 95 kb/d. January’s World oil production is projected to decrease by 165 kb/d to 82,121 kb/d.
This chart also projects World C + C production out to December 2026. It uses the April 2025 STEO report along with the International Energy Statistics to make the projection.
For December 2026, production is projected to be 83,936 kb/d. The December 2026 oil production is lower than the November 2018 peak by 656 kb/d. December 2026 production has been revised down by 187 kb/d from the previous report. December 2026 crude has been downwardly revised by 289 kb/d.
From December 2023 to December 2026, World oil production is estimated to increase by 920 kb/d.
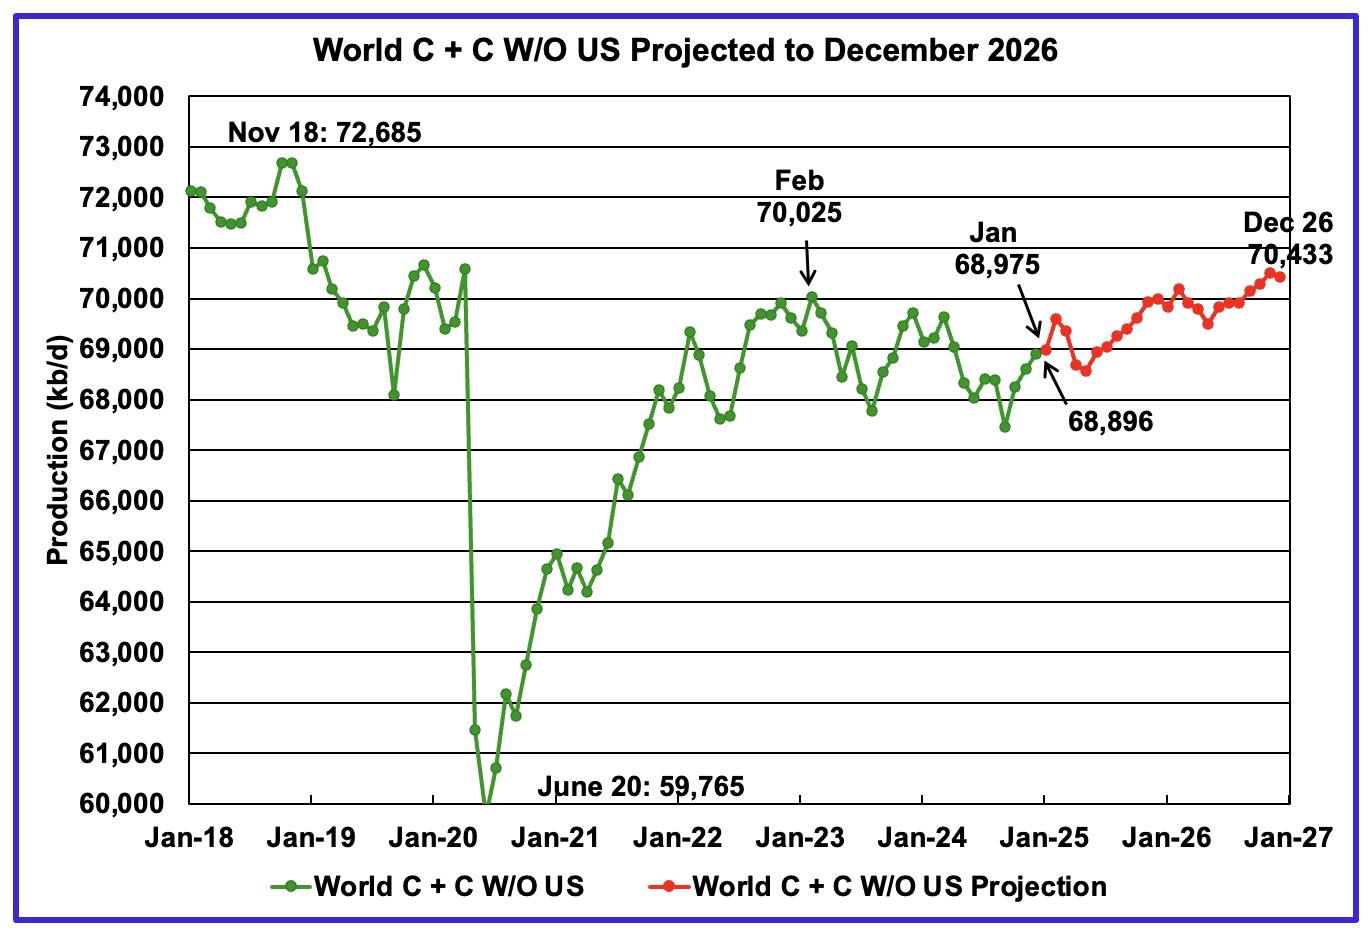
December’s World oil output without the US increased by 288 kb/d to 68,896 kb/d. January’s production is expected to increase by 79 kb/d to 68,975 kb/d.
The projection is forecasting that December 2026 crude output will be 70,433 kb/d. Note that the December 2026 output is 2,252 kb/d lower than the November 2018 peak of 72,685 kb/d.
World oil production W/O the U.S. from December 2024 to December 2026 is forecast to increase by a total of 1,537 kb/d.
A Different Perspective on World Oil Production
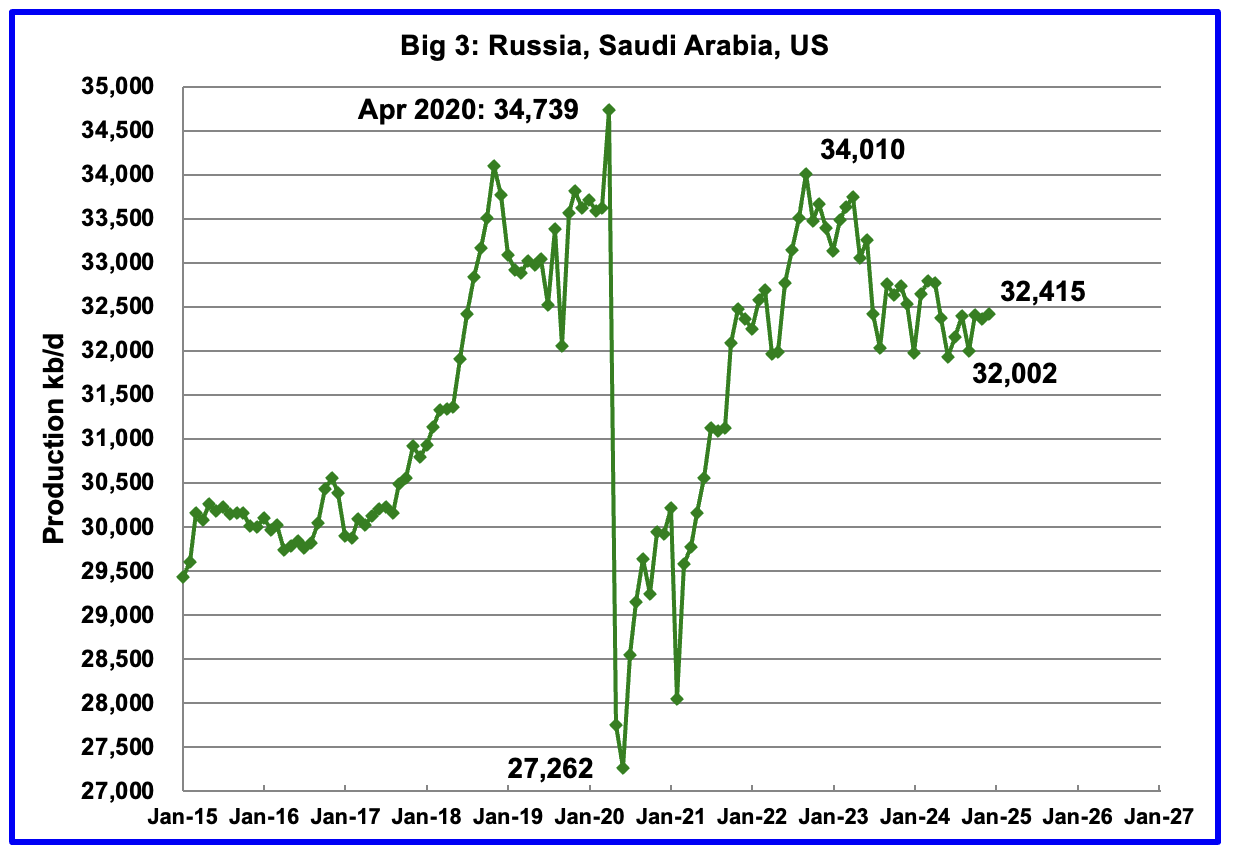
Peak production in the Big 3 occurred in April 2020 at a rate of 34,739 kb/d. The peak was associated with a large production increase from Saudi Arabia. Post covid, production peaked at 34,010 kb/d in September 2022. The production decline since then is primarily due to cutbacks by Saudi Arabia and Russia.
December’s Big 3 oil production increased by 55 kb/d to 32,415 kb/d. Production in December was 1,595 kb/d lower than the September 2022 post pandemic high of 34,010 kb/d.
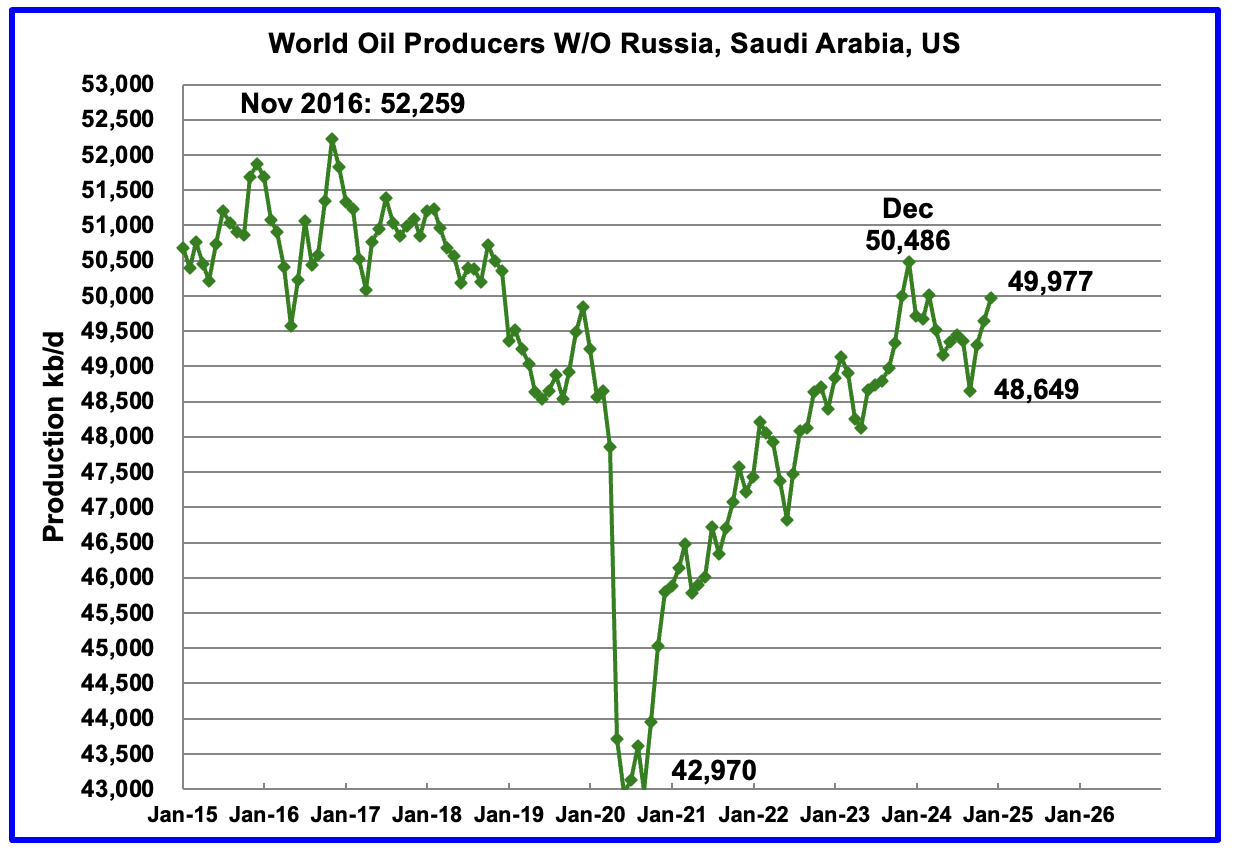
Production in the Remaining countries had been slowly increasing since the September 2020 low of 42,970 kb/d to December 2023. Production has been rising for the last three months and output in December increased by 334 kb/d to 49,977 kb/d and is now 509 kb/d lower than December 2023.
Countries Expected to Grow Oil Production
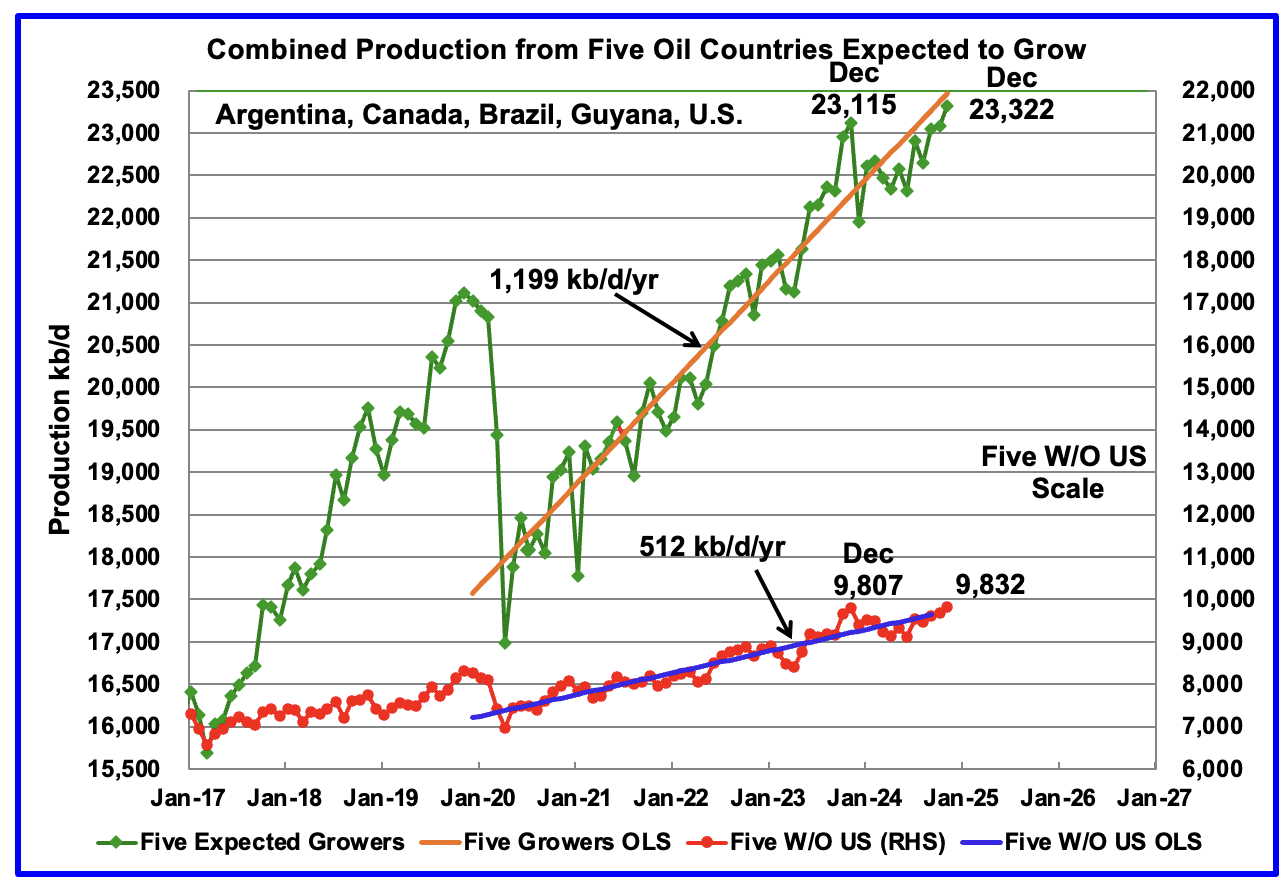
This chart was first posted a few of months back and shows the combined oil production from five Non-OPEC countries, Argentina, Brazil, Canada, Guyana and the U.S., whose oil production is expected to grow. These five countries are often cited by OPEC and the IEA for being capable of meeting the increasing World oil demand for next year. For these five countries, production from April 2020 to August 2024 rose at an average rate of 1,199 kb/d/year as shown by the orange OLS line.
To show the impact of US growth over the past 5 years, U.S. production was removed from the five countries and that graph is shown in red. The production growth slope for the remaining four countries has been reduced by 687 kb/d/yr to 512 kb/d/yr.
December production has been added to the five growers chart, up 236 kb/d to 23,322 kb/d. For the Five growers W/O U.S., December production rose by 141 kb/d to 9,832 kb/d, up 25 kb/d from December 2023.
The OLS lines have not been updated and will not be updated going forward unless additional production data provides a strong indication that production is rising.
Production up to December 2023 may be a situation where the past is not a good indicator of the future. In this case it may be more important to focus on what has happened to production after December 2023 rather than before.
Countries Ranked by Oil Production
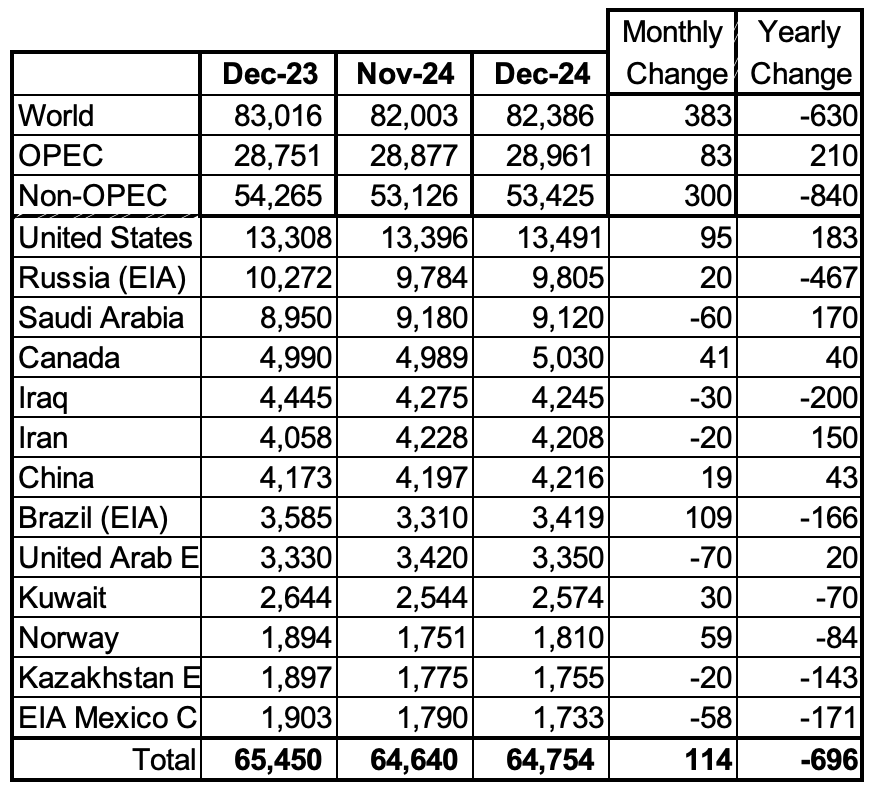
Above are listed the World’s 13th largest oil producing countries. In December 2024, these 13 countries produced 78.6% of the World’s oil. On a MoM basis, production increased by 114 kb/d in these 13 countries while on a YOY basis, production dropped by 696 kb/d.
December Non-OPEC Oil Production Charts
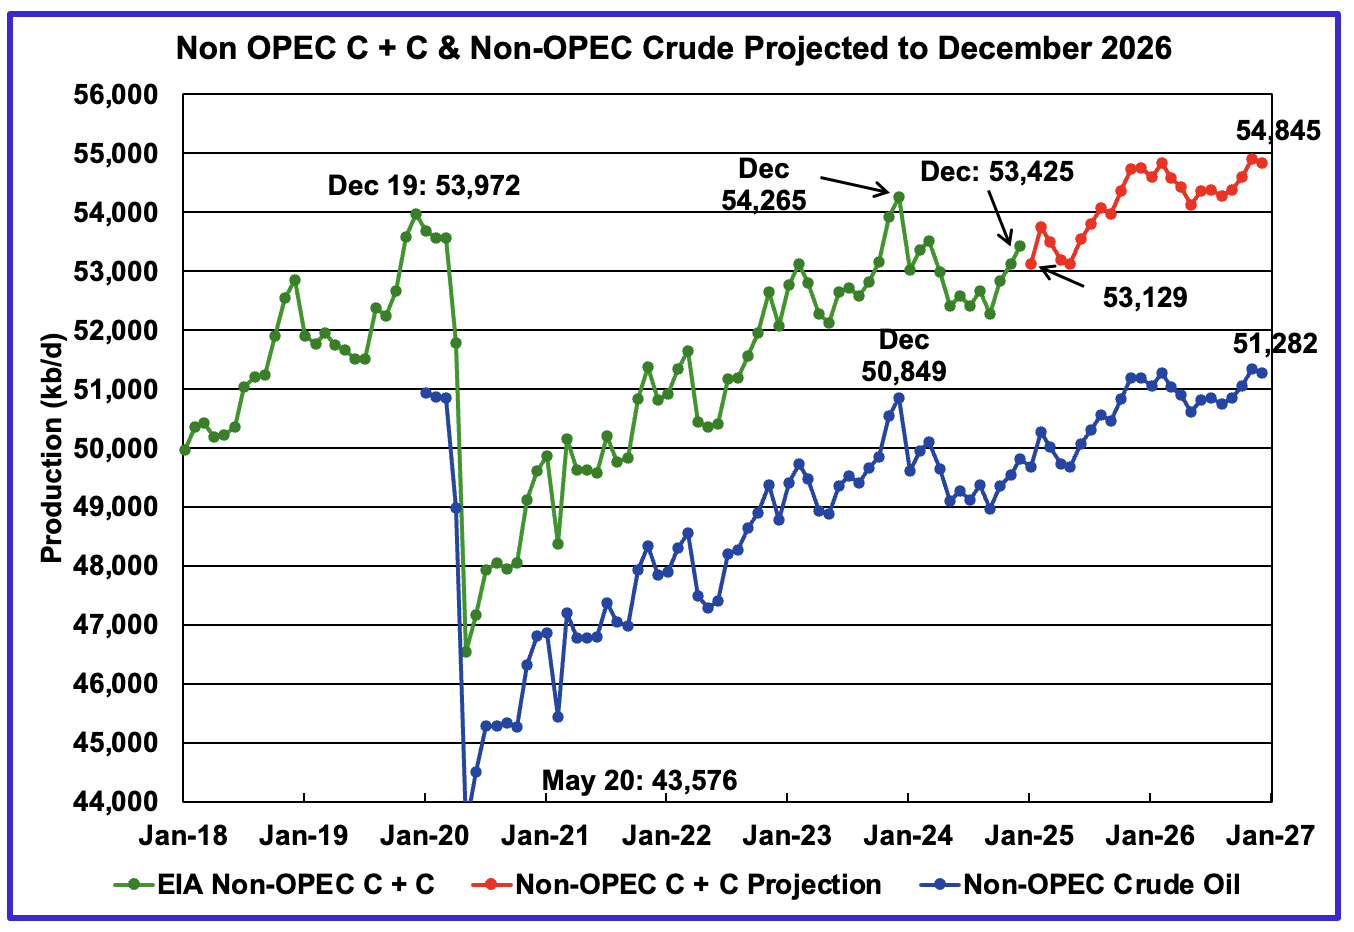
December’s Non-OPEC oil production increased by 300 kb/d to 53,425 kb/d.
Using data from the April 2025 STEO, a projection for Non-OPEC oil output was made for the period January 2025 to December 2026. (Red graph). Output is expected to reach 54,845 kb/d in December 2026. December 2026 was revised down by 70 kb/d from the previous report.
From December 2024 to December 2026, oil production in Non-OPEC countries is expected to increase by 1,420 kb/d.
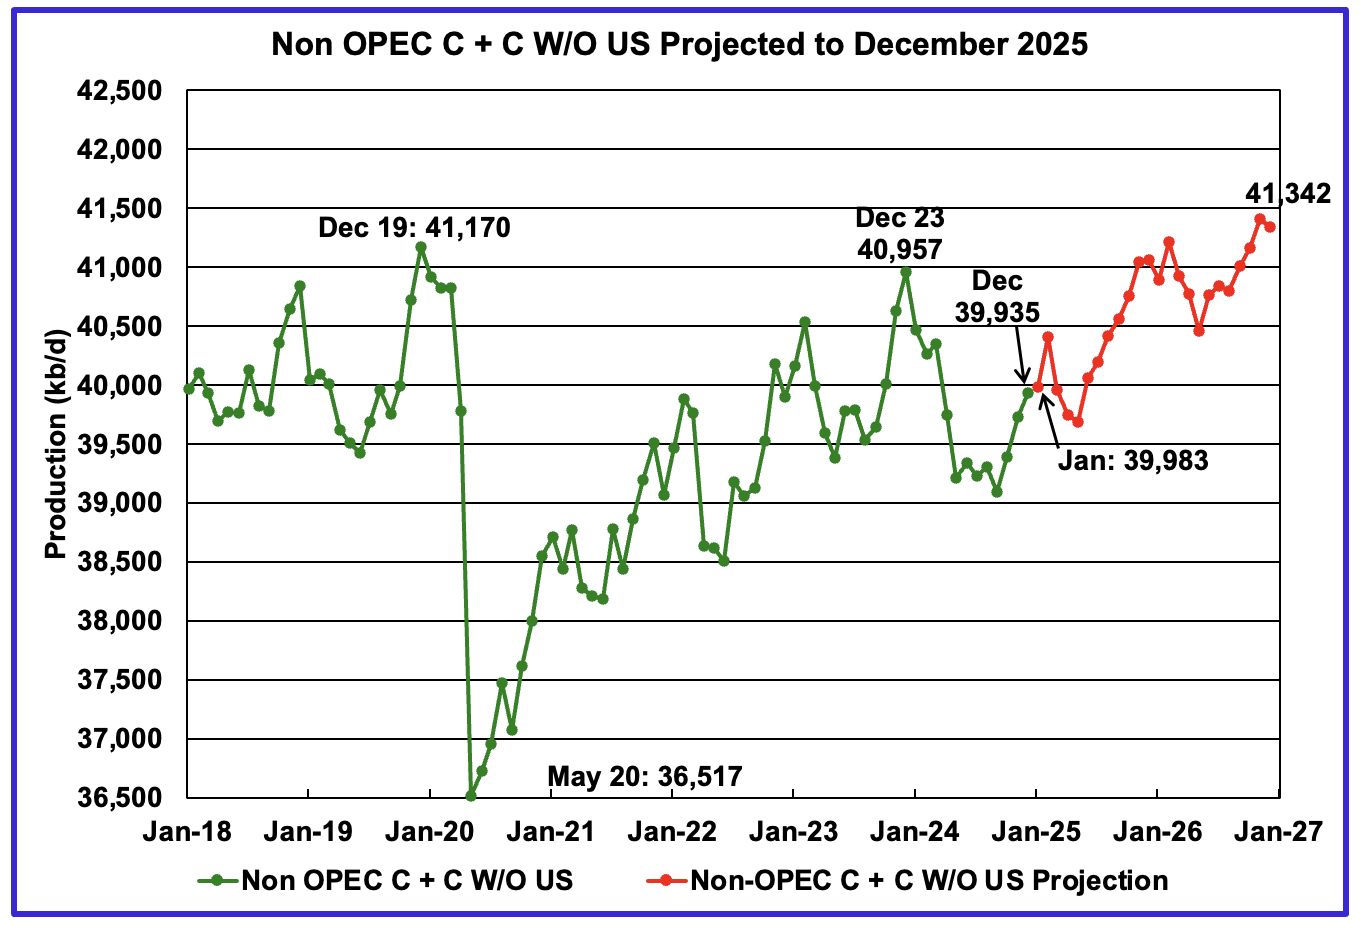
December’s Non-OPEC W/O US oil production rose by 205 kb/d to 39,935 kb/d. January’s production is projected to rise by 48 kb/d to 39,983 kb/d.
From December 2024 to December 2026, production in Non-OPEC countries W/O the U.S. is expected to increase by 1,407 kb/d. December 2026 production is projected to be 172 kb/d higher than December 2019, essentially no growth over seven years. December 2026 production was revised up 125 kb/d from the last report to 41,342 kb/d
Non-OPEC Oil Countries Ranked by Production
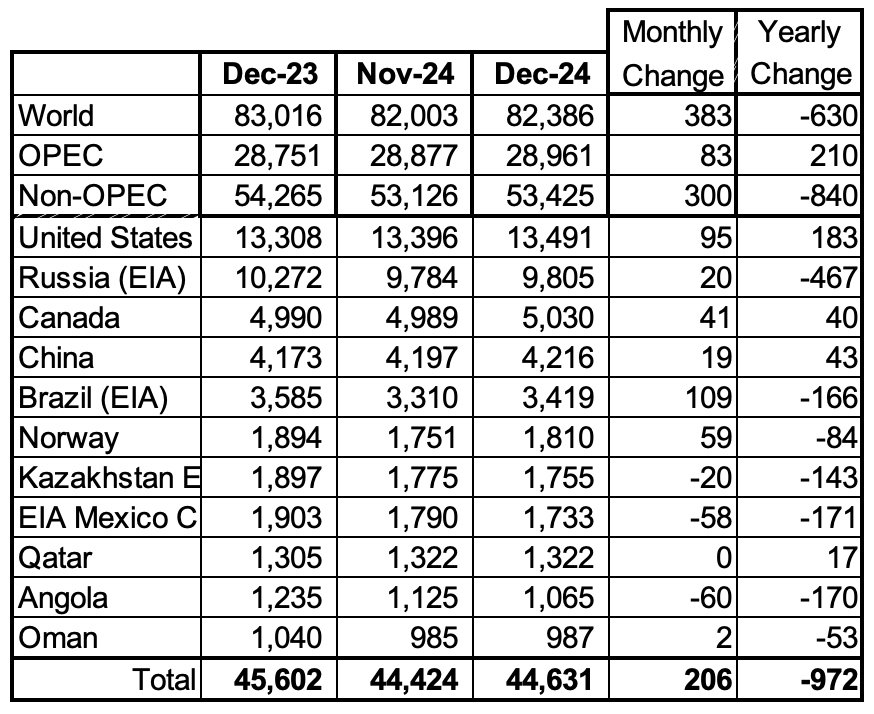
Listed above are the World’s 11 largest Non-OPEC producers. The original criteria for inclusion in the table was that all of the countries produced more than 1,000 kb/d. Oman has recently fallen below 1,000 kb/d.
December’s production increased by 206 kb/d to 44,631kb/d for these eleven Non-OPEC countries while as a whole the Non-OPEC countries saw a yearly production loss of 840 kb/d to 53,425 kb/d.
In December 2024, these 11 countries produced 83.6% of all Non-OPEC oil.
Non-OPEC Country’s Oil Production Charts
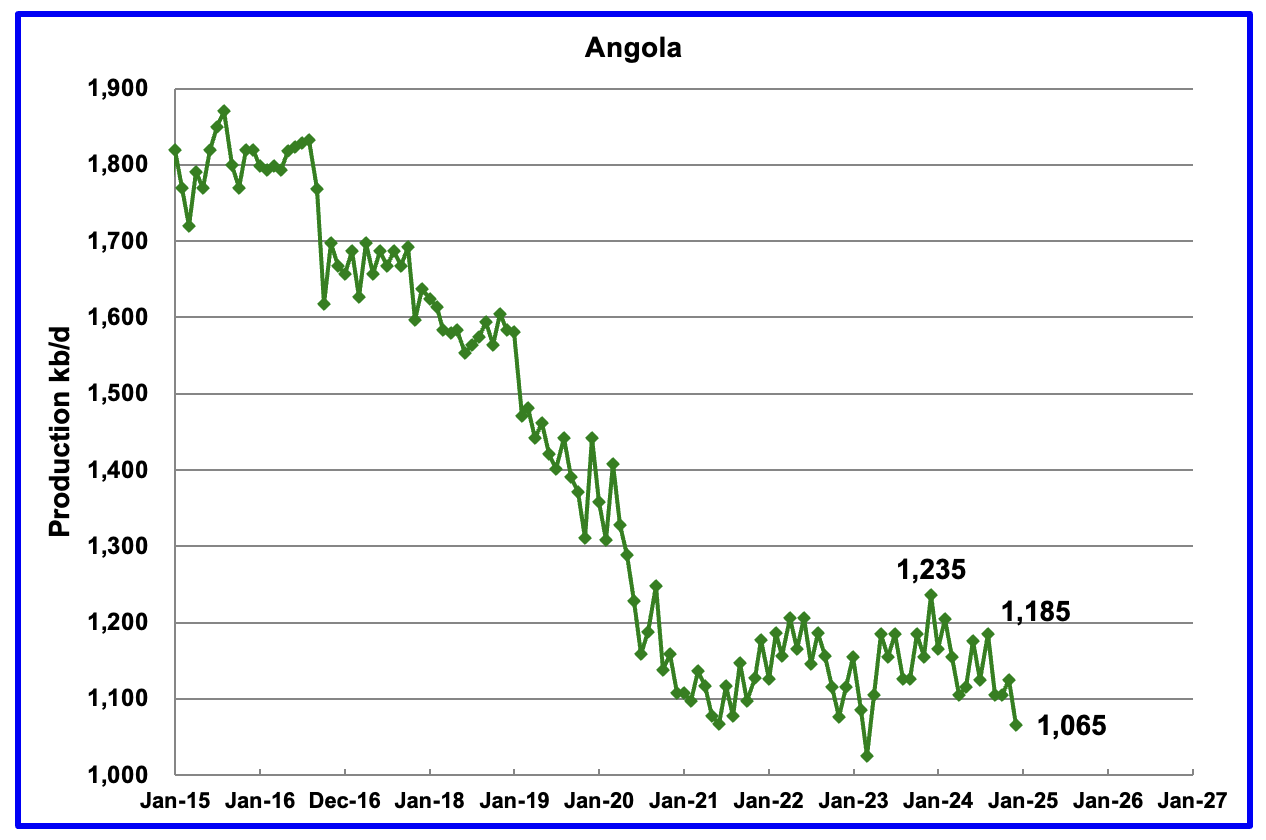
Angola’s December production dropped by 60 kb/d to 1,065 kb/d. Since early 2022 Angola’s production appears to have settled into a plateau phase between 1,100 kb/d and 1,200 kb/d. However December brought a drop below that plateau.
According to the March OPEC MOMR: “Growth is set to be driven by the US, Brazil, Canada and Norway, with the main decline anticipated in Angola. Is the December drop the beginning of the forecast decline for Angola?
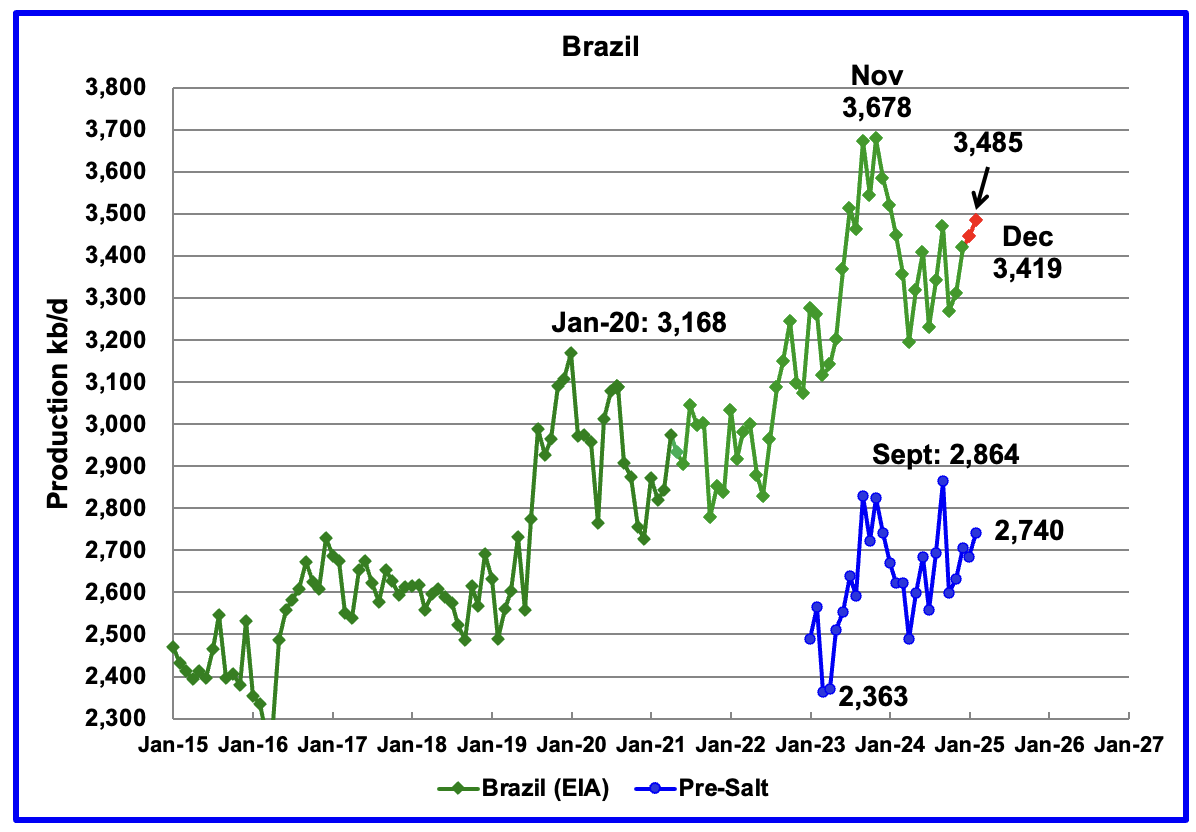
The EIA reported that Brazil’s December production increased by 109 kb/d to 3,419 kb/d.
Brazil’s National Petroleum Association (BNPA) reported that production increased in January and February to 3,485 kb/d. The pre-salt graph tracks Brazil’s trend in the crude oil graph. For February, pre-salt production increased by 55 kb/d to 2,740 kb/d.
The December to February increase could be related to the addition of the two new floating platforms. The December OPEC report states that two new floating production storage and offloading (FPSO) platforms came online in November. It also mentions operational issues and slow ramp-ups in several offshore platforms continue to be an issue.
The March OPEC report states “Petrobras initiated production from the FPSO Almirante Tamandaré (Buzios 7) in mid-February at the Buzios field, located in the pre-salt layer of the Santos Basin, as the sixth production system in this field.” It also states that scheduled startup of planned new platforms could be delayed, “Nevertheless, operational issues and unplanned disruptions could potentially delay some scheduled start-ups from the platforms.”
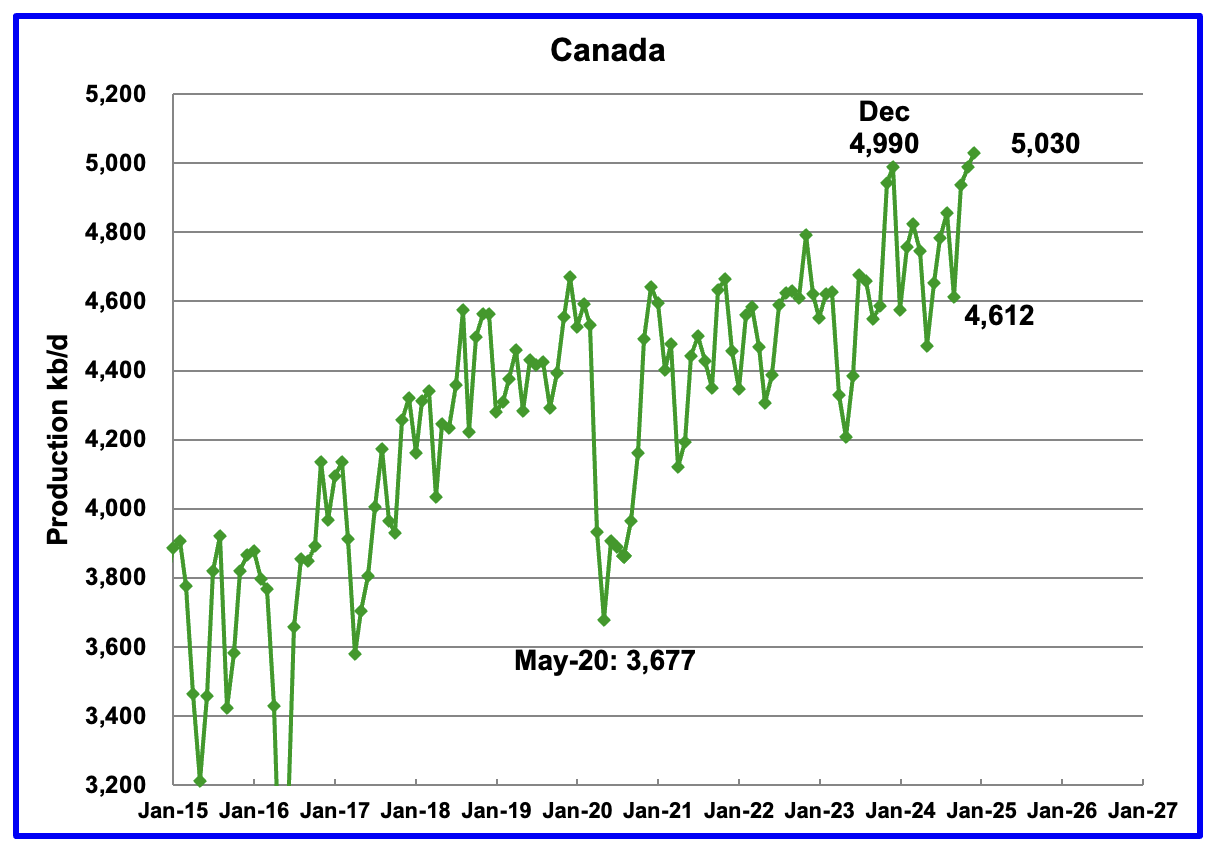
Canada’s production increased by 41 kb/d in December to 5,030 kb/d a new record high. The increase is primarily due to site restarts related to wild fires in the oil sands area around Fort McMurray, the completion of maintenance and enhancements to oil sands cokers and bringing new SAGD sites online.
Canada has escaped US tariffs on its crude oil, natural gas and refined products according to this Article. Regardless it is not clear how the $10/b drop in WTI will affect production going forward.
“His administration’s latest sweeping tariffs on global trading partners exclude crude oil, natural gas and refined products, and Canadian goods, including energy, that are compliant with the Canada-United States-Mexico Agreement (CUSMA) will continue to move free of tariffs across the border.”
While no tariffs have been levied, Canada has woken up to the risks associated with becoming too close/dependant to a very close trading neighbour. There is much talk of building new pipelines to tidewater.
An election is scheduled in Canada for April 28. Both major parties are indicating a friendlier approach to oil sands production than the previous government.
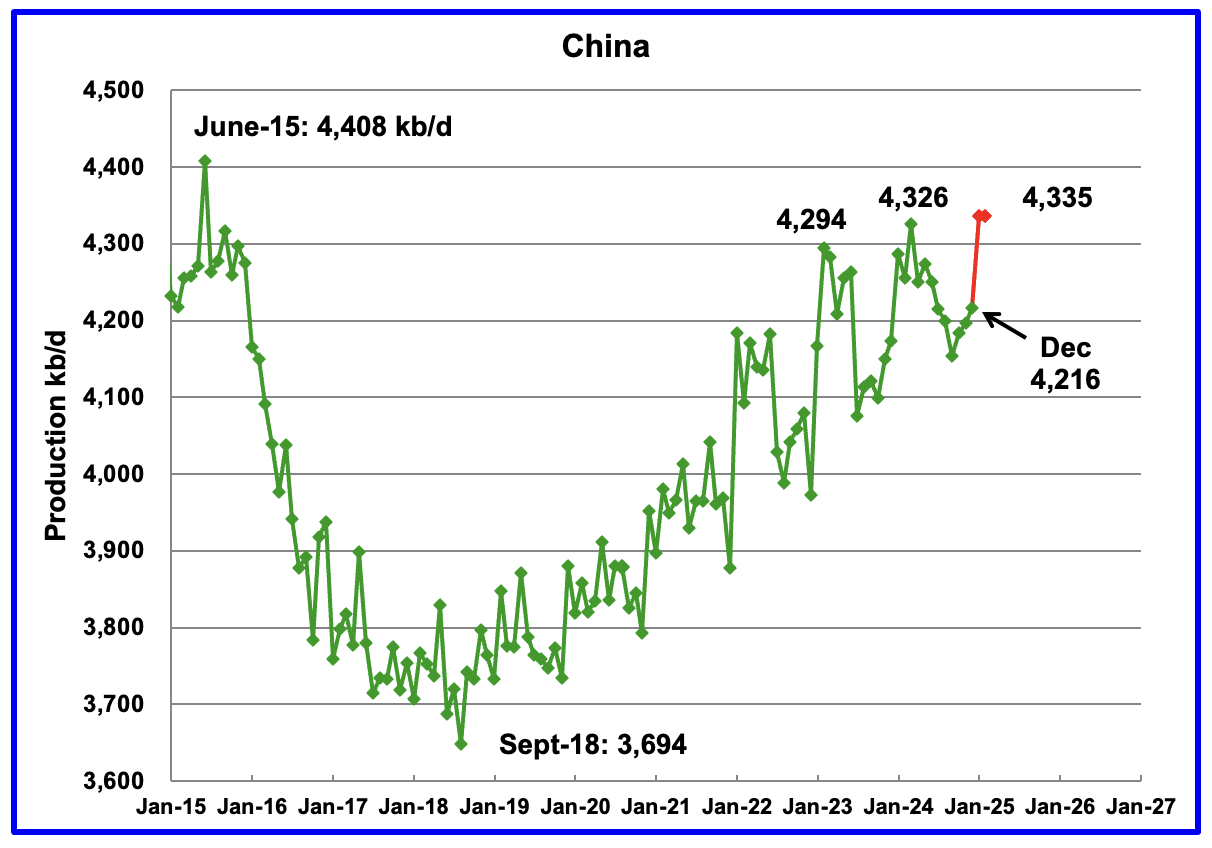
The EIA reported China’s December oil output increased by 19 kb/d to 4,216 kb/d.
The China National Bureau of Statistics reported average production for January and February. The average came in at 4,335 kb/d. January/February production added 119 kb/d to 4,335 kb/d, red markers. This is a new high for China’s oil production. However note the slowing growth trend associated with the last three peaks. Has China reached peak production?
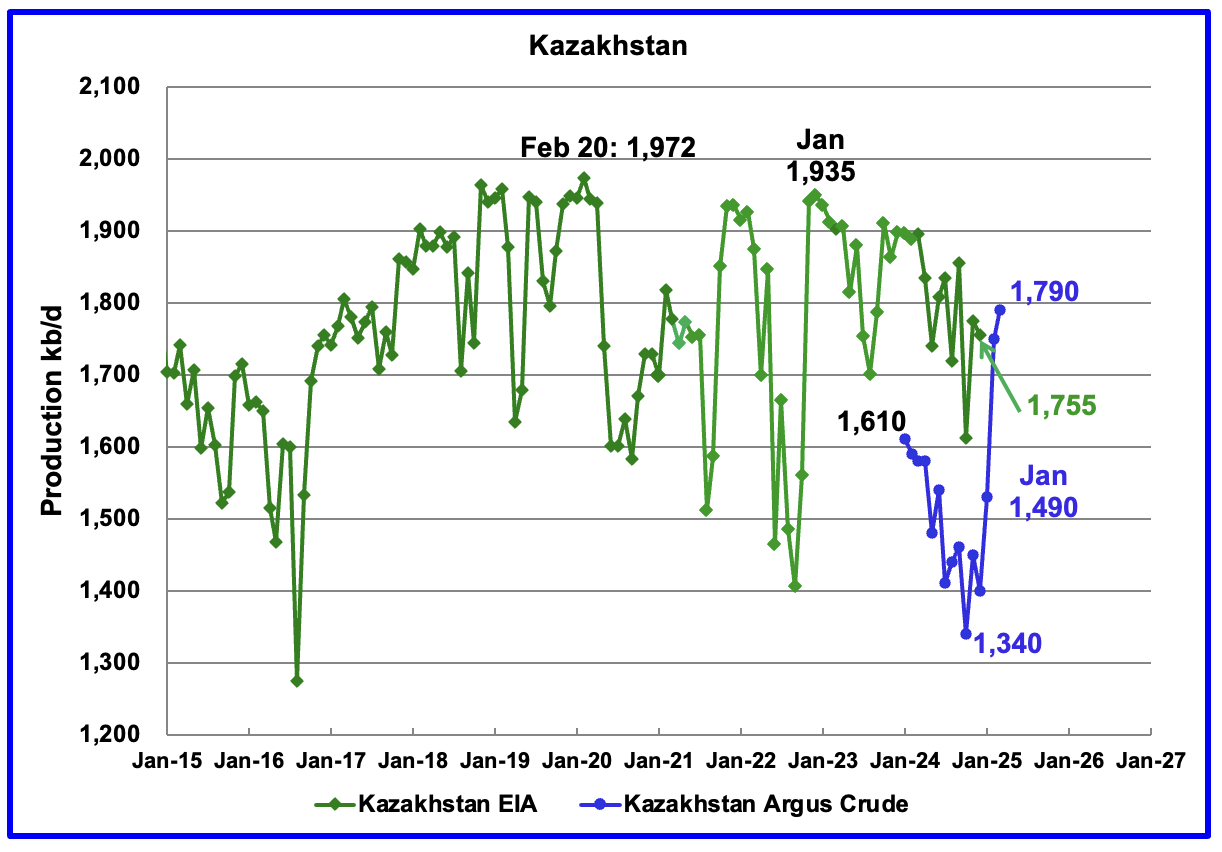
According to the EIA, Kazakhstan’s oil output decreased by 20 kb/d in December to 1,755 kb/d.
Kazakhstan’s recent pre-salt crude oil production, as reported by Argus, has been added to the chart. In October pre-salt crude production dropped by 120 kb/d to a low 1,340 kb/d. Since then production has risen by 450 kb/d. February production came in at 1,790 kb/d due to a New Field coming online. Note this is Crude whereas the EIA numbers are C + C.
Kazakhstan’s OPEC crude production target is 1,468 kb/d. At 1,790 kb/d, Kazakhstan is 322 kb/d over their target. According to this Article, Kazakhstan does not expect any major reduction in crude output in April after massively exceeding its Opec+ target in March.
Since Kazakhstan’s reduction promises have not materialized, OPEC announced it would “accelerate plans to revive halted supplies next month, with an increase triple the size originally scheduled”, according to this Article. The May production increase will be 411 kb/d.
Combined with the Trump tariffs the increase dropped the price of WTI/Brent by close to $10/b over two days. OPEC is trying to send a message to comply to Kazakhstan.
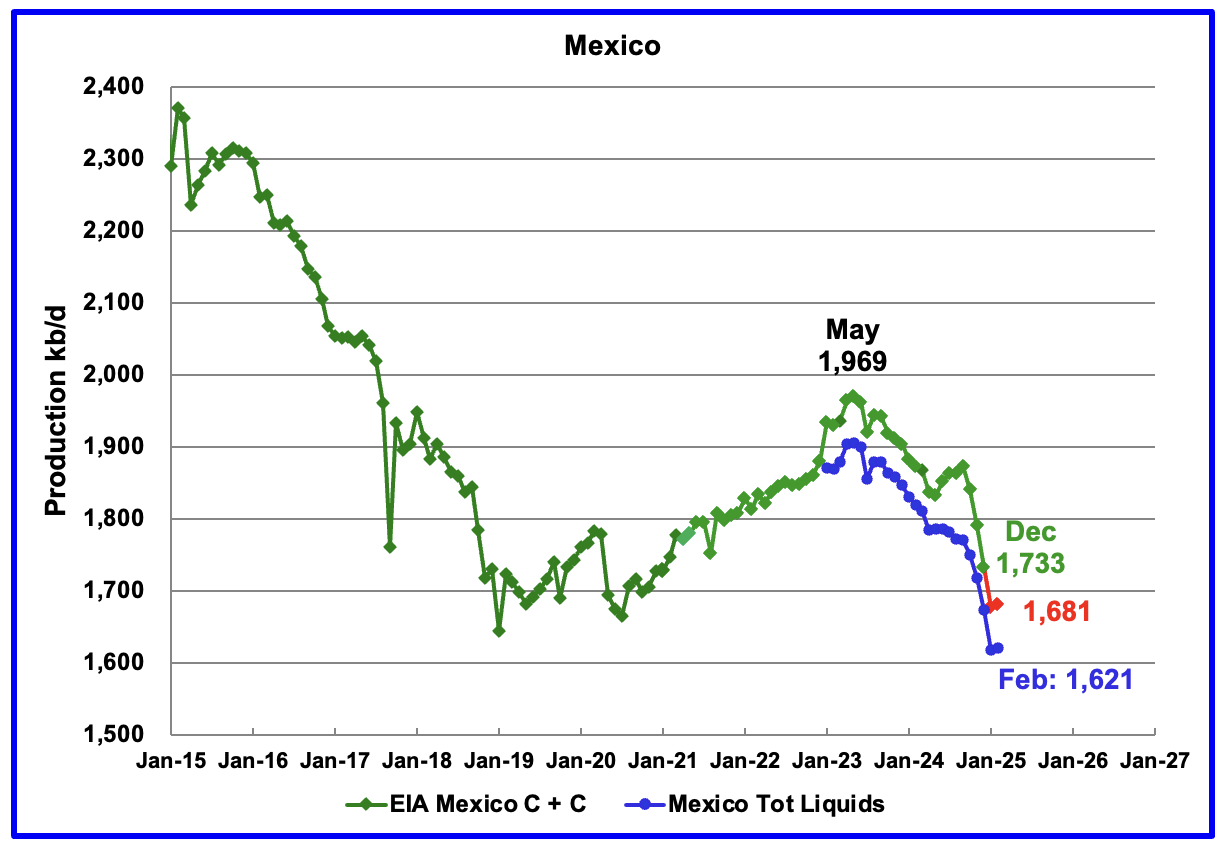
According to the EIA, Mexico’s December output dropped by 58 kb/d to 1,733 kb/d.
In June 2024, Pemex issued a new and modified oil production report for Heavy, Light and Extra Light oil. It is shown in blue in the chart and it appears that Mexico is not reporting condensate production when compared to the EIA report.
In earlier reports, the EIA would add close to 55 kb/d of condensate to the Pemex report. However for October and November it was increased to 122 kb/d and 117 kb/d respectively. For December, the condensate addition has returned close to its original increase of 55 kb/d. The December addition was 60 kb/d.
For January and February production, 60 kb/d have been added to the Pemex production to estimate Mexico’s January and February C + C production, red markers. Note that Mexico’s production, according to Pemex, has continued to fall every month since May 2023, except for one month. However February’s oil production is little changed from January.
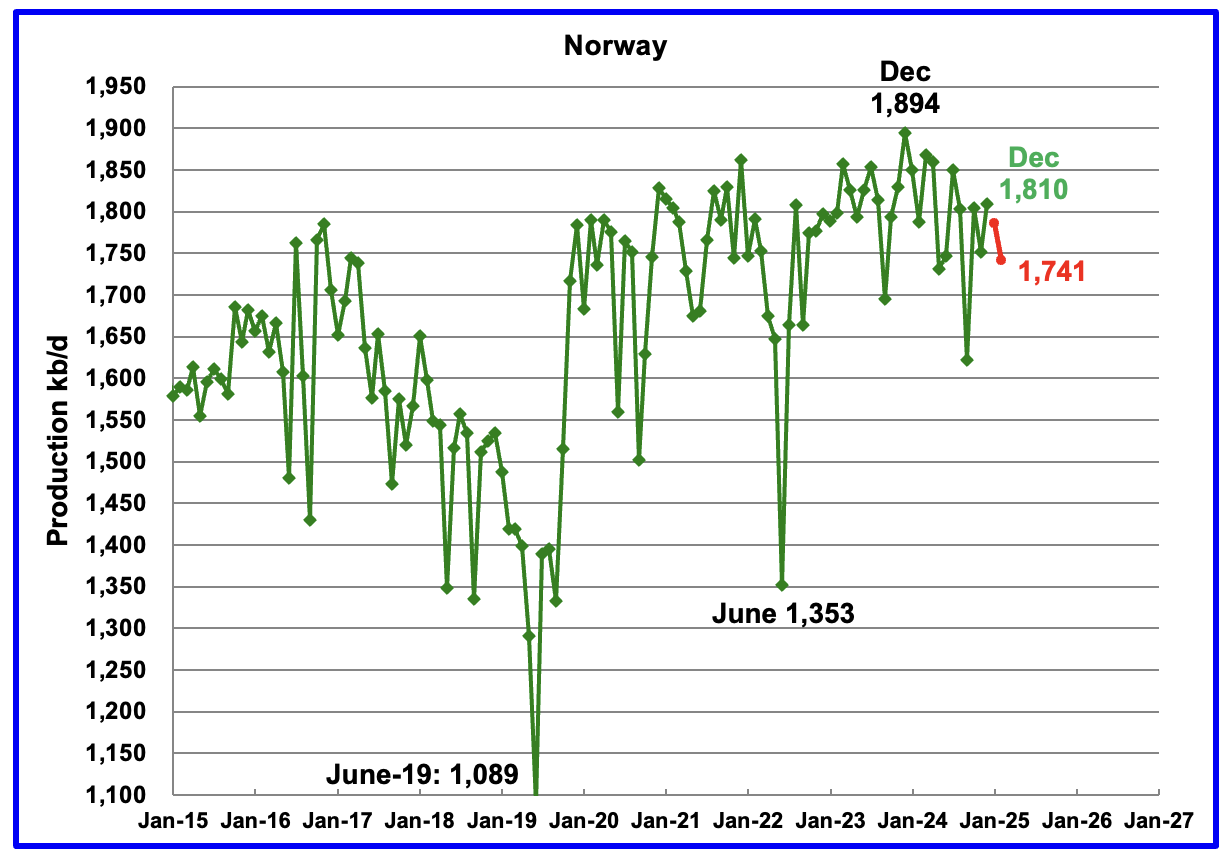
The EIA reported Norway’s December production rose by 59 kb/d to 1,810 kb/d.
Separately, the Norway Petroleum Directorate (NPD) reported that January production decreased by 24 kb/d to 1,786 kb/d and February dropped to 1,741 kb/d, red markers.
The Norway Petroleum Directorship reported that February’s oil production was 1.3% above forecast.
Last month S & P Global reported that the Johan Sverdrup oil field is expected to start declining from late-2024/early-2025.
“Europe’s highest producing oil field, Johan Sverdrup, is expected to start declining in late-2024 or early-2025 — earlier than expected — amid increased signs of water production at some wells”.
Are the January and February drops the beginnings of Norway’s steady oil production decline?
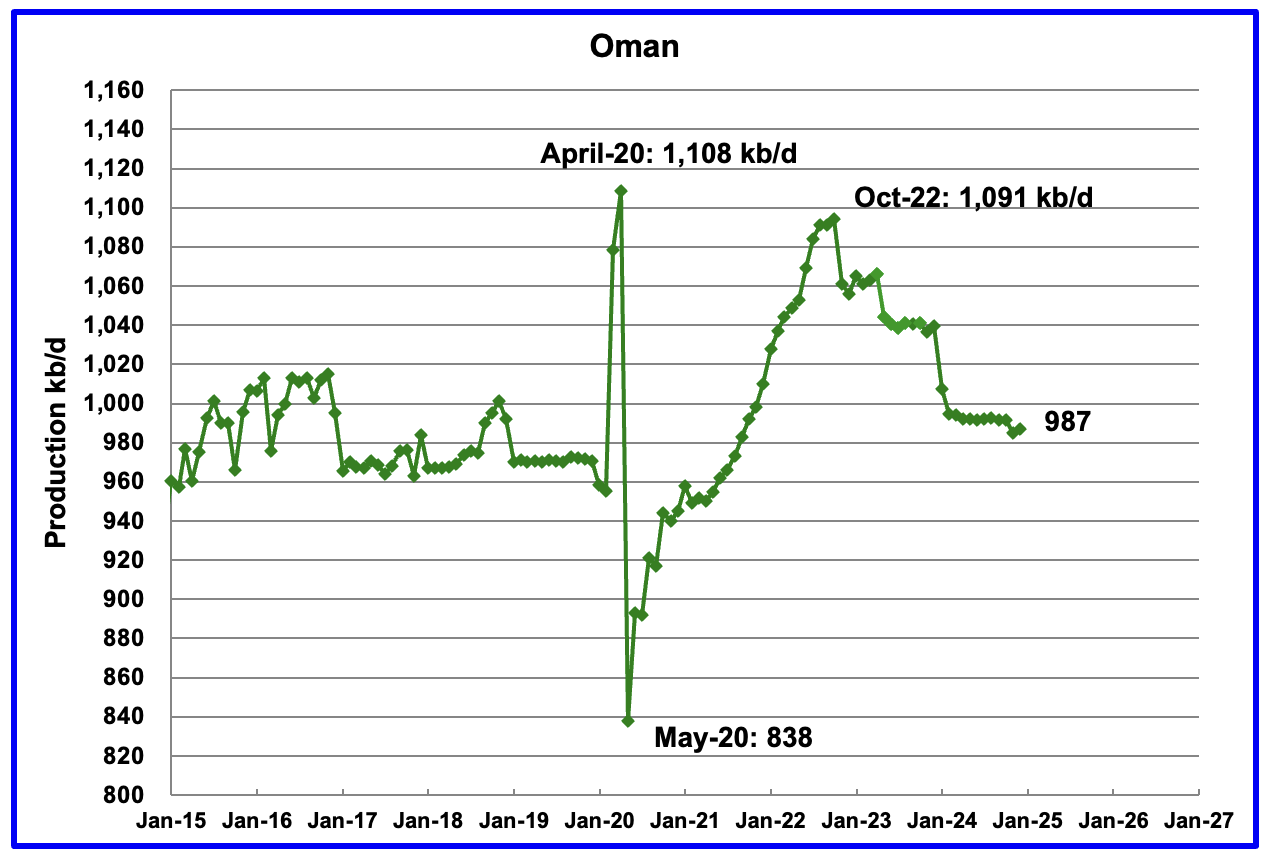
Oman’s production had risen very consistently since the low of May 2020. However production began to drop in November 2022. According to the EIA, December’s output rose by 2 kb/d to 987 kb/d.
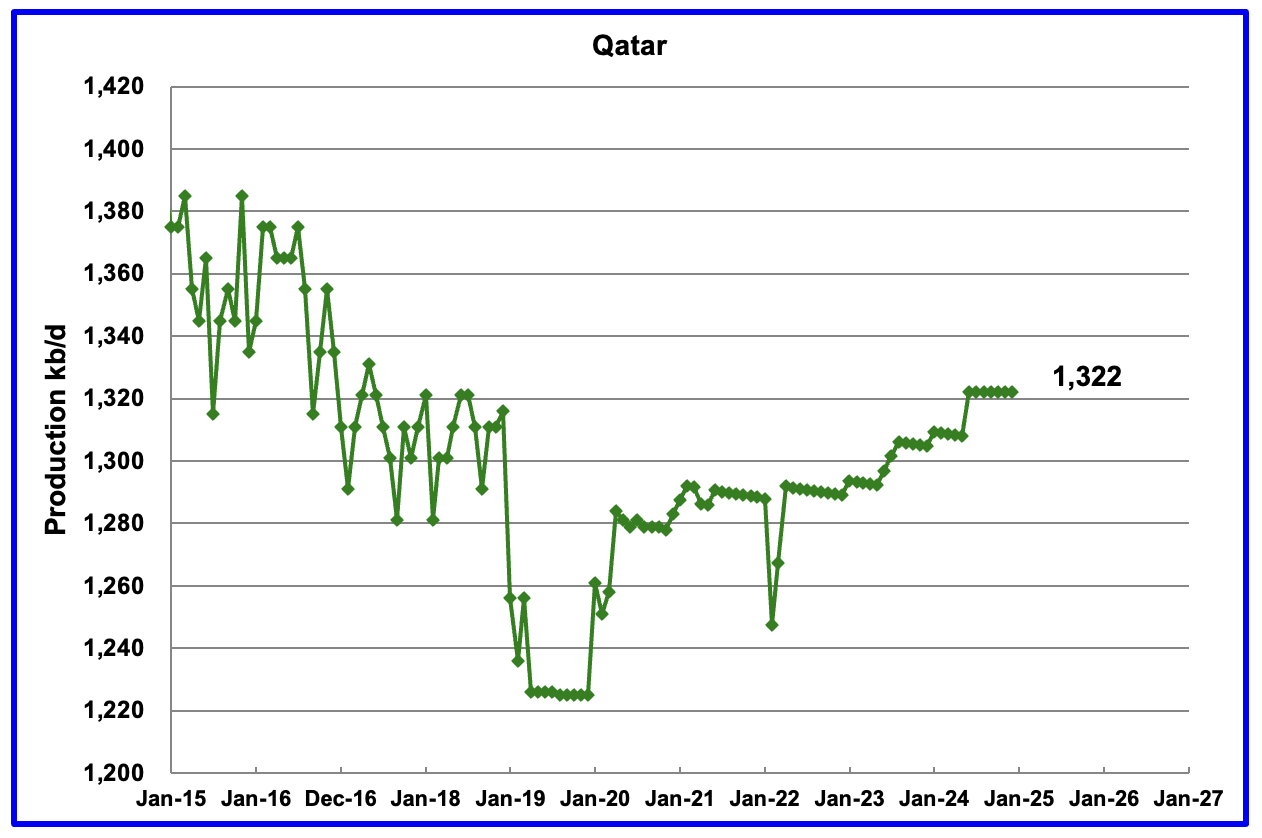
The EIA had been reporting flat output of 1,322 kb/d for Qatar since early 2022. However the EIA has revised down all of the previous production data. Qatar’s December output was reported again to be 1,322 kb/d.
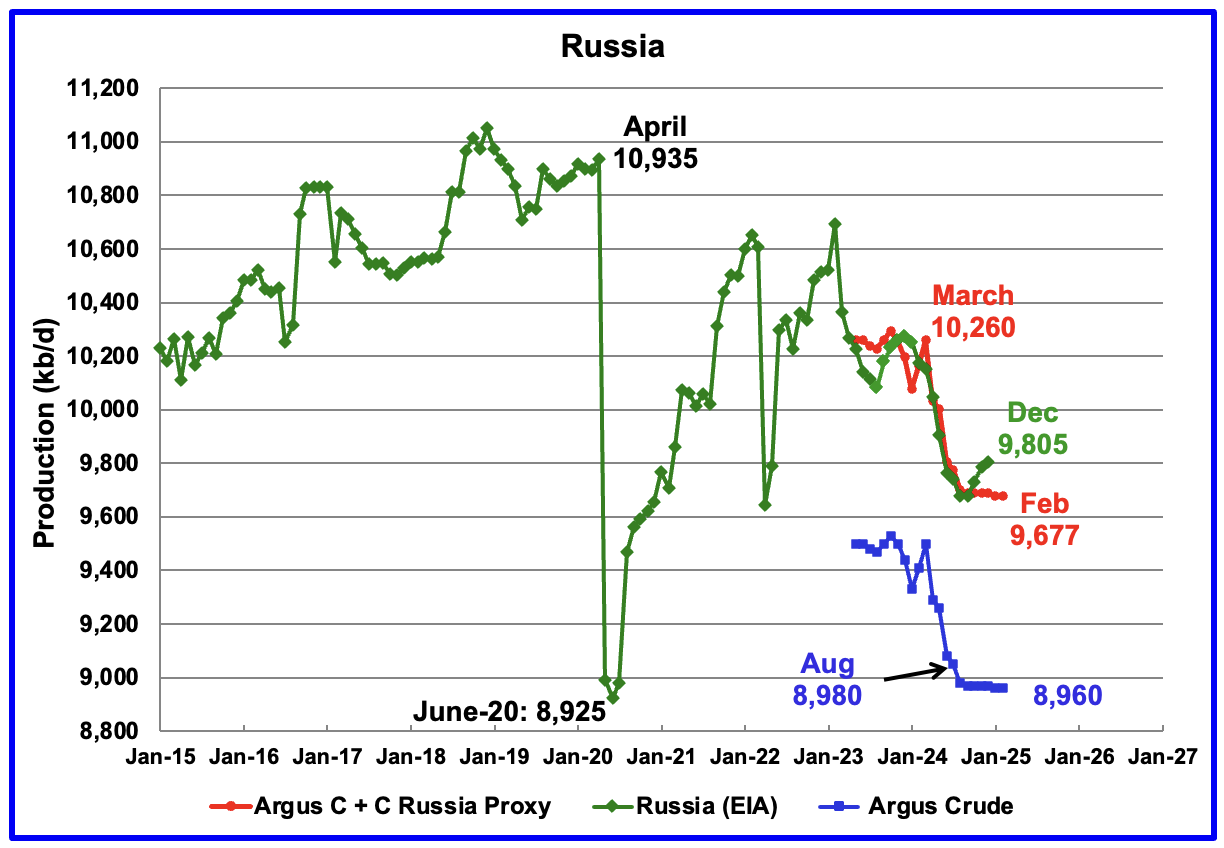
The EIA reported Russia’s December C + C production rose by 20 kb/d to 9,805 kb/d and was down 455 kb/d from March 2024. It is also 117 kb/d higher than the Argus Russia proxy estimate of 9,688 kb/d for December.
Unfortunately S & P Global and Argus are not providing oil production information for the OPEC + countries as of March 2025.
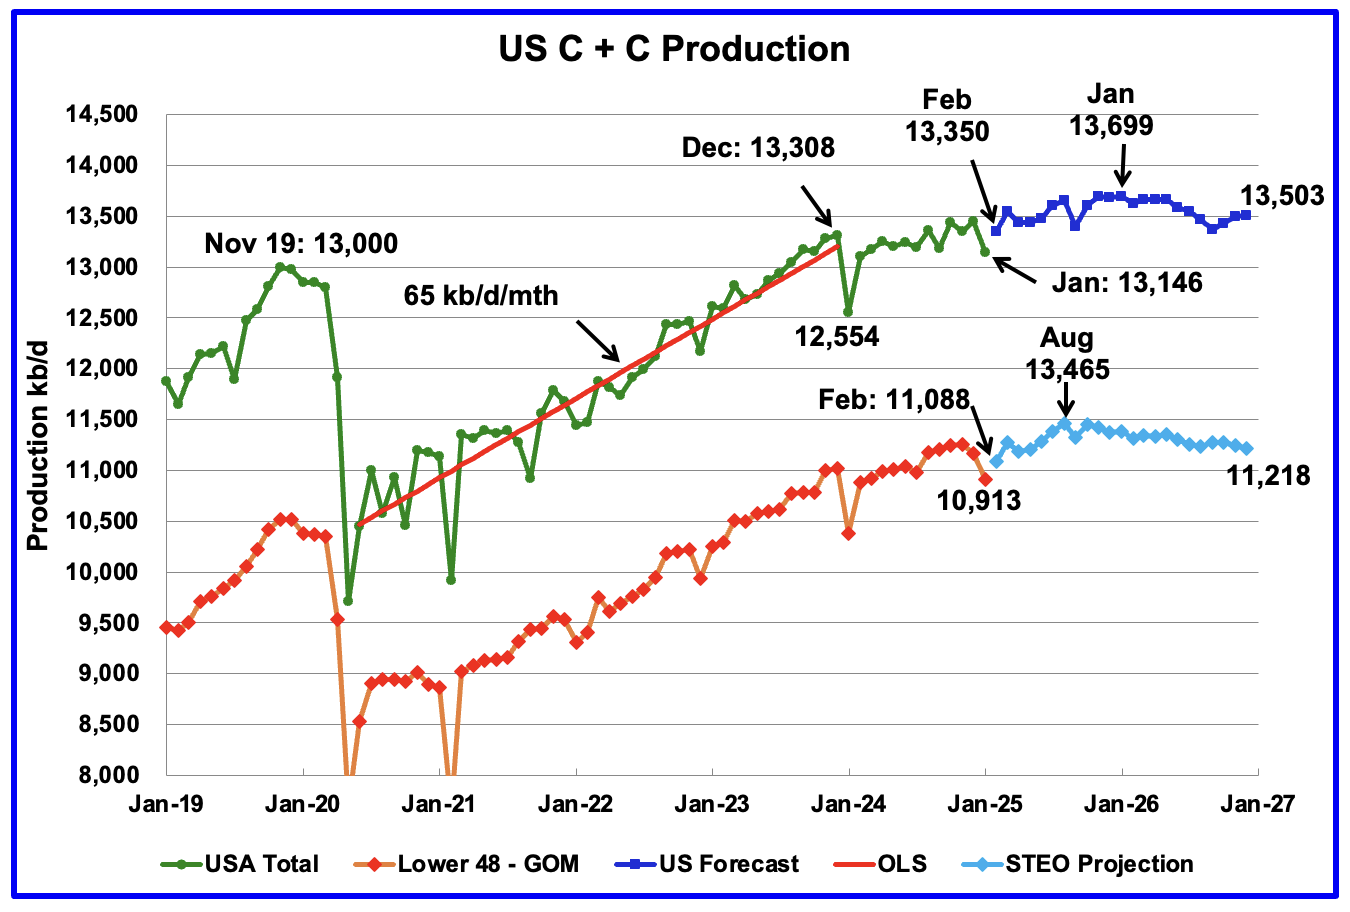
This US production chart is very similar to the one published last week in the US update post. However the STEO portions of the two graphs have been updated using the April 2025 STEO.
Production in December 2026 at 13,503 kb/d is 195 kb/d lower than reported in the previous post. For the onshore L48, oil production starts to fall after August 2025 and production is anticipated to be 11,218 kb/d, revised down from 11,440 kb/d in the previous post.
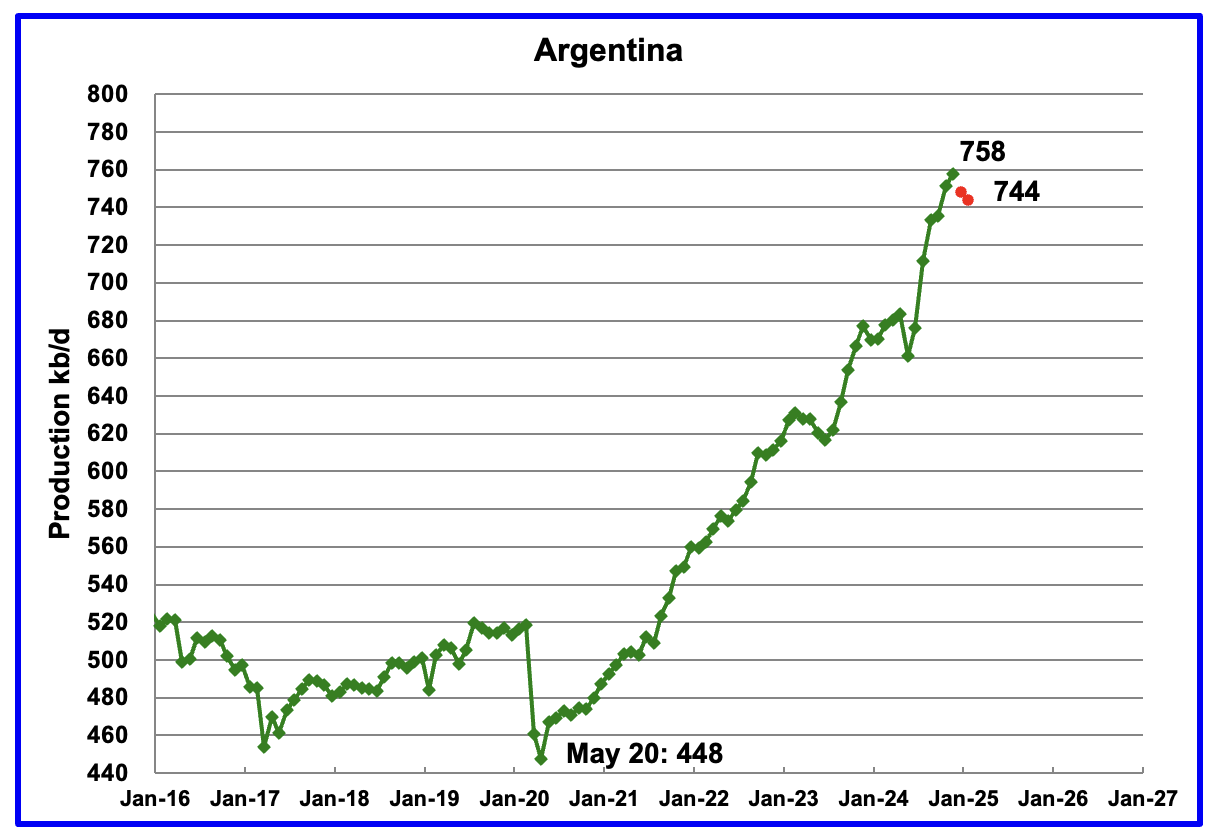
Normally, Argentina oil production is not reported because its production is lower than 1,000 kb/d. However production has been steadily rising over the last five years due to the startup of shale oil and gas production in the Vaca Muerta basin.
According to this Article, “Vaca Muerta production could hit the 1Mb/d mark by the end of the decade, up from around 420,000b/d at the end of 2024. YPF and Vista Energy account for around 70% of production.”
In December, the EIA reported Argentina’a production rose 7 kb/d to 758 kb/d.
The Argentinian Energy Secretariat reported oil production in February dropped to 744 kb/d.

