


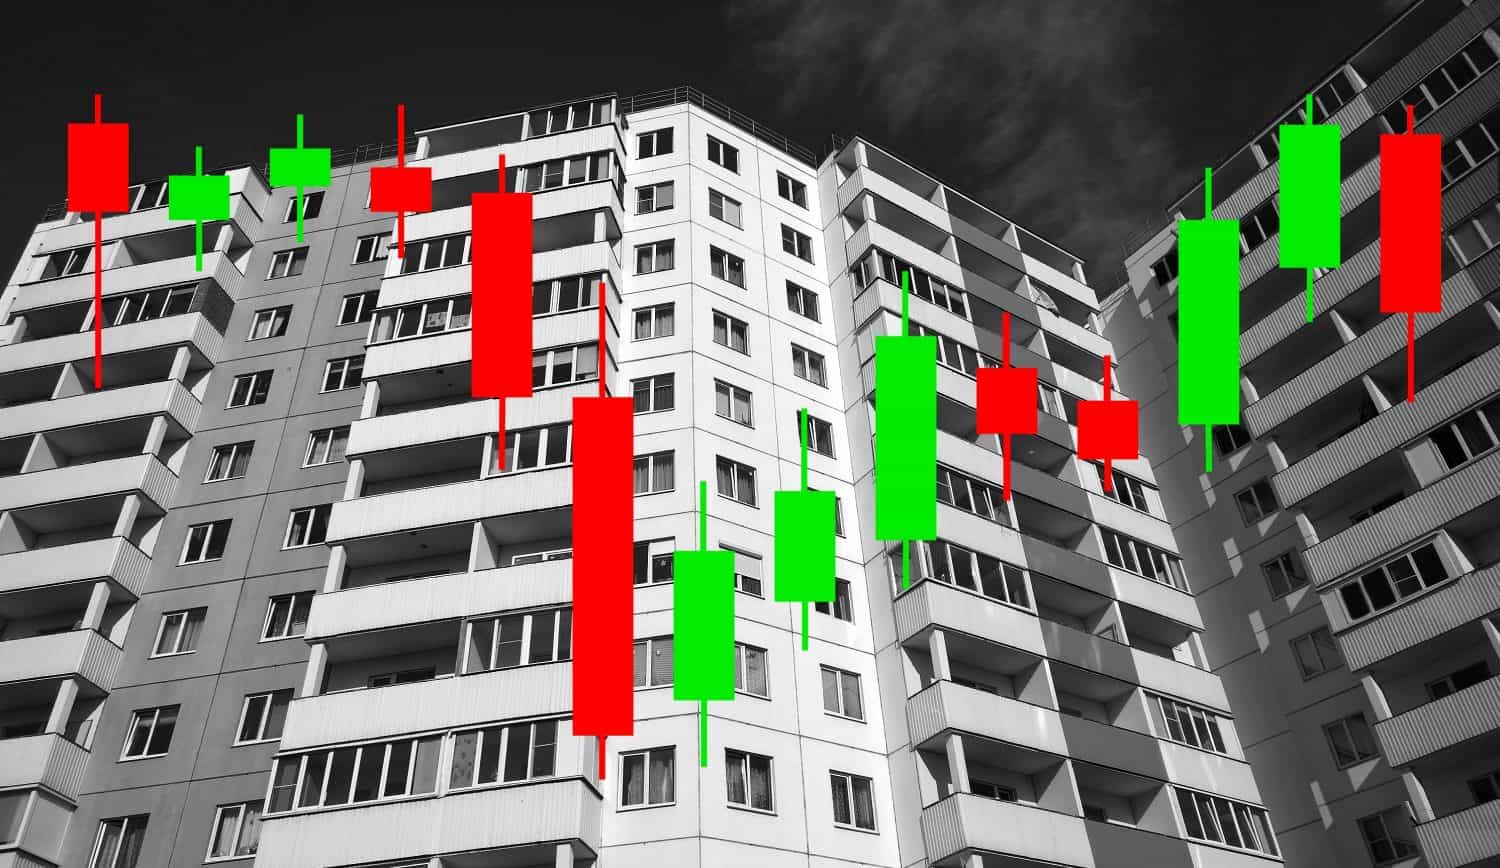


These Unaffordable Cities Are Gobbling Up Renters’ Income Like No Other
When it comes to personal finances, experts recommend Americans pay no more than 30% of their income on housing. Current market conditions, however, have made these guidelines unrealistic for a growing share of the population. 24/7 Wall St. : With home prices hovering near record highs, homeownership has become prohibitively expensive for millions of […] The post These Unaffordable Cities Are Gobbling Up Renters’ Income Like No Other appeared first on 24/7 Wall St..

When it comes to personal finances, experts recommend Americans pay no more than 30% of their income on housing. Current market conditions, however, have made these guidelines unrealistic for a growing share of the population.
24/7 Wall St. Key Points:
- With home prices hovering near record highs, homeownership has become prohibitively expensive for millions of Americans.
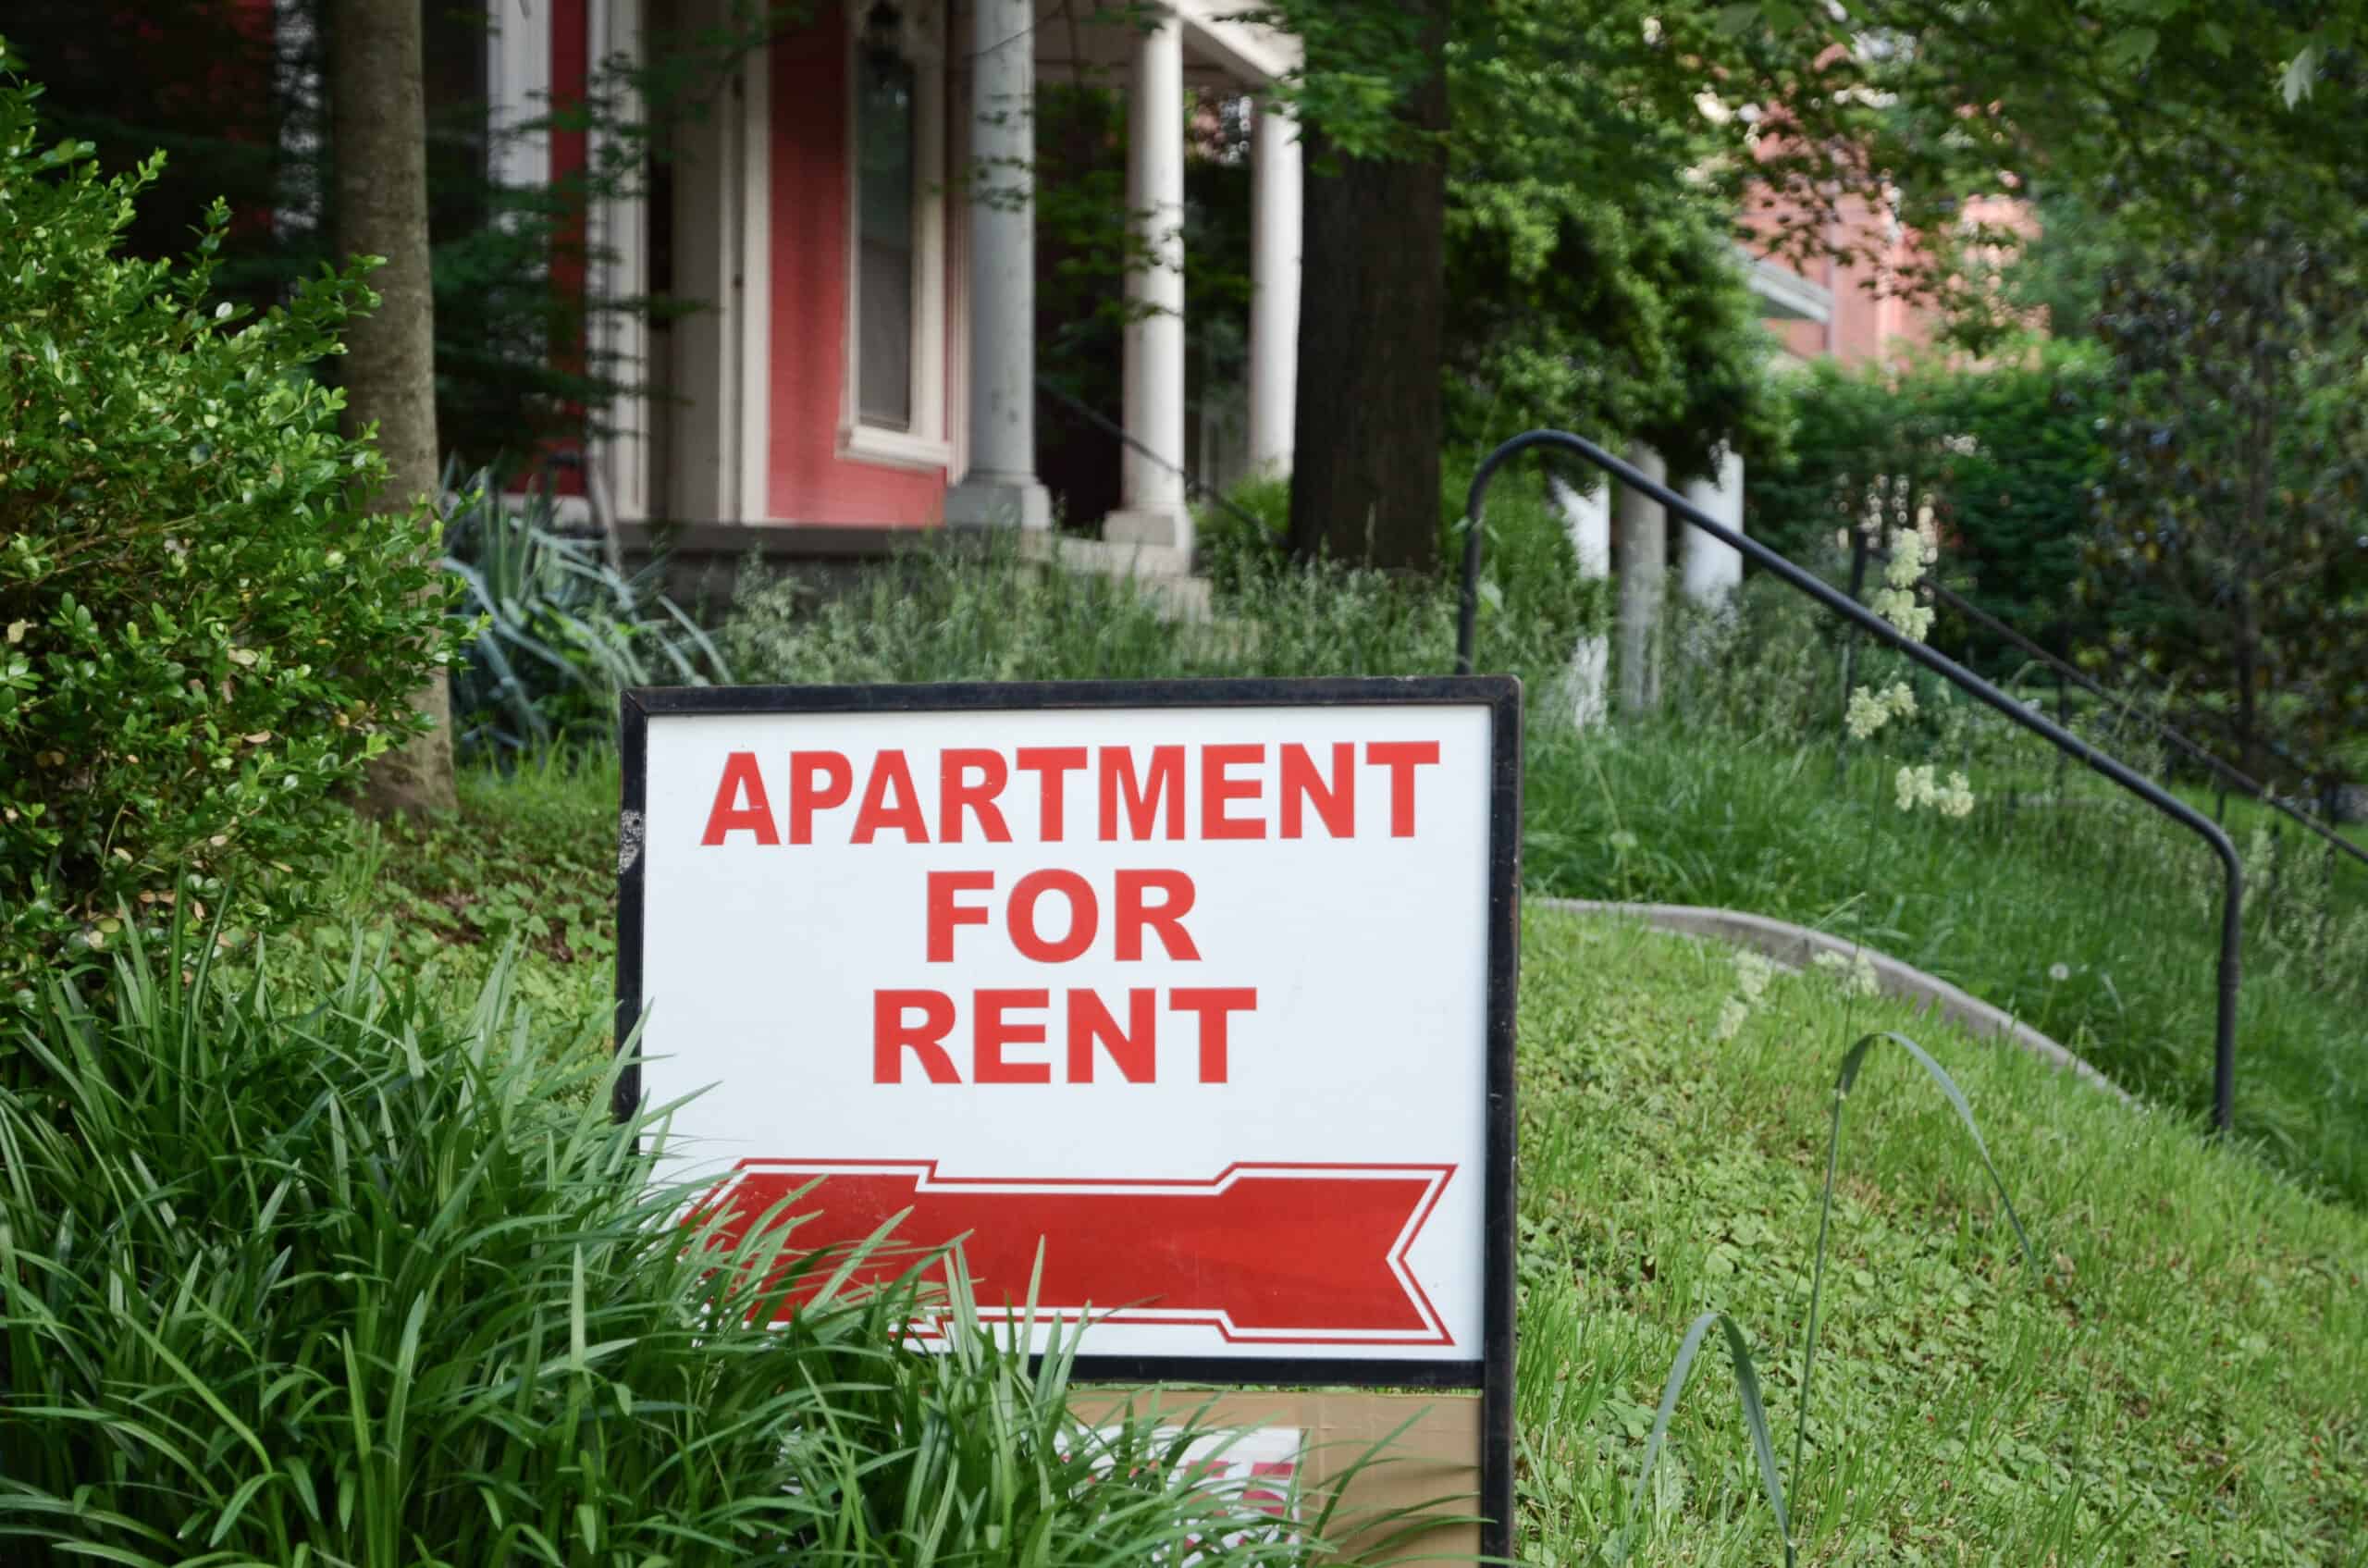
- For many, renting has now become the only option — but in certain markets, even renting has become unaffordable for most residents.
- Also: 2 Dividend Legends To Hold Forever
According to data from Realtor.com, the typical American home was listed on the market for $424,900 in March 2023, about 6% more than in the beginning of 2025, and up over 40% from early 2020, before the economic shocks of the COVID-19 pandemic. The rapid increase in home values has priced millions of Americans out of the housing market, and for many of them, renting is the only practicable option.
While lower upfront costs makes renting more affordable than homeownership in many cases, the market for renters has also been impacted by broader real estate trends. The consumer price index for rent surged by nearly 10% over the last two years, while the CPI across all consumer items climbed by less than 6%. (Here is a look at the benefits and downsides of investing in a duplex.)
The latest available data from the U.S. Census Bureau’s American Community Survey shows that the median rental costs nationwide are equivalent to about 20.6% of median household earnings, which is well below the recommended 30% threshold. Still, in certain U.S. cities, rental costs are squeezing household budgets far more than average.
Using data from the 2023 ACS, 24/7 Wall St. identified the least affordable city for renters in every state. Cities are ranked by the median annual rental payment as a percentage of median household income. All places — including cities, towns, villages, and unincorporated communities — with populations of at least 50,000 were considered. All data in this story are five-year average ACS estimates.
It is important to note that in three states — Alaska, Delaware, and Maine — there is only one community home to 50,000 people or more. As a result, the city listed in these places ranks on this list by default only. Additionally, because there are no cities in Vermont or West Virginia with populations of at least 50,000, these states were excluded from analysis.
In all but a handful of the places on this list, typical rental costs are equal to more than 20% of the local median income, including eight cities where rent accounts for over 30% of income — and in nearly every city on this list, renting is less affordable than it is across the state as a whole.
Rental affordability is the product of two factors: income and rental prices — and in any given market, low rental affordability ratios can be the product of disproportionately high prices, or disproportionately low incomes. In most cities on this list, incomes lower than they are across the state and rental prices are higher. (This is how Baby Boomers impacted the housing market for younger buyers.)
This is the least affordable city for renters in each state.
Why It Matters
With home prices hovering near all-time highs, and mortgage rates at their highest level in over a decade, the United States is in the midst of a housing affordability crisis. In these conditions, many Americans who would otherwise be looking to buy a home are renting. But in many parts of the country, renting is no longer the affordable alternative to homeownership it is often perceived to be.
Alabama: Birmingham

- Median annual rent as a share of household income: 28.3% (18.6% statewide)
- Gross median monthly rent: $1,047 ($963 statewide)
- Median household income: $44,376 ($62,027 statewide)
- Renters paying $3,000 or more per month: 0.2% (0.7% statewide)
- Renters paying less than $1,000 per month: 45.7% (53.5% statewide)
- Rental vacancy rate: 7.2% (7.5% statewide)
- Cities considered in state: 10
Alaska: Anchorage
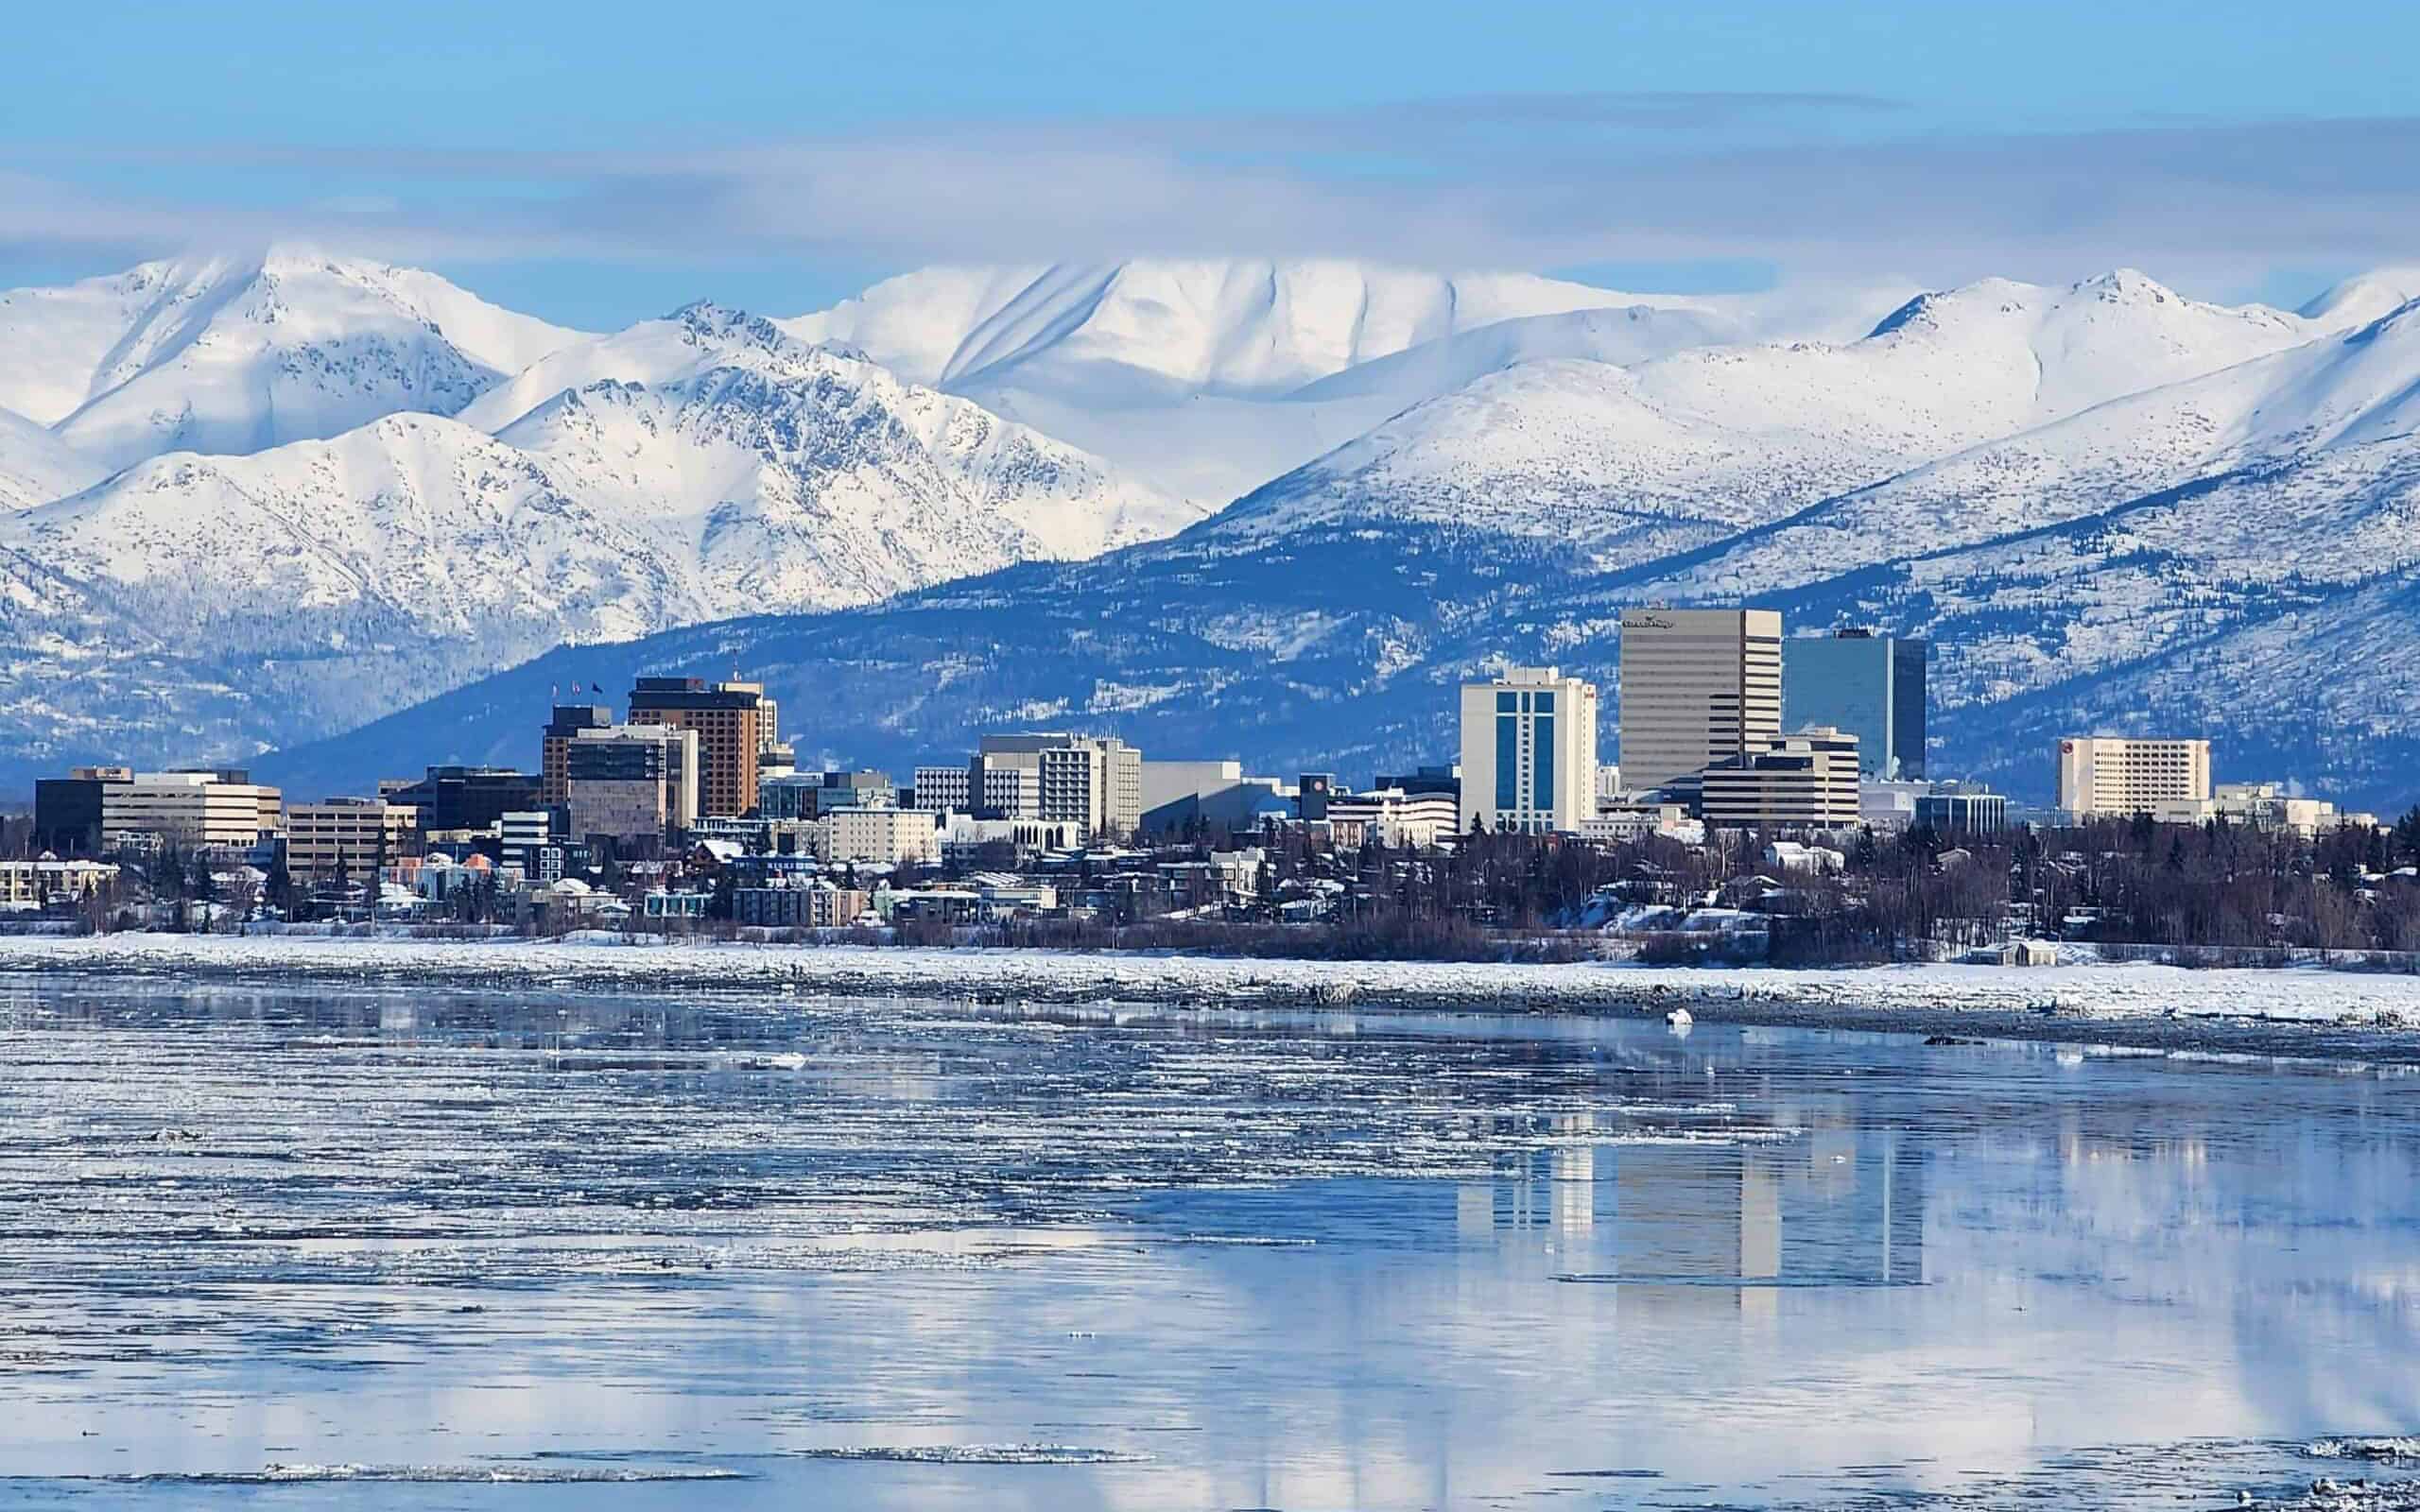
- Median annual rent as a share of household income: 17.8% (18.6% statewide)
- Gross median monthly rent: $1,453 ($1,388 statewide)
- Median household income: $98,152 ($89,336 statewide)
- Renters paying $3,000 or more per month: 3% (2.1% statewide)
- Renters paying less than $1,000 per month: 17.5% (22.7% statewide)
- Rental vacancy rate: 8.5% (7.3% statewide)
- Cities considered in state: 1
Arizona: Flagstaff
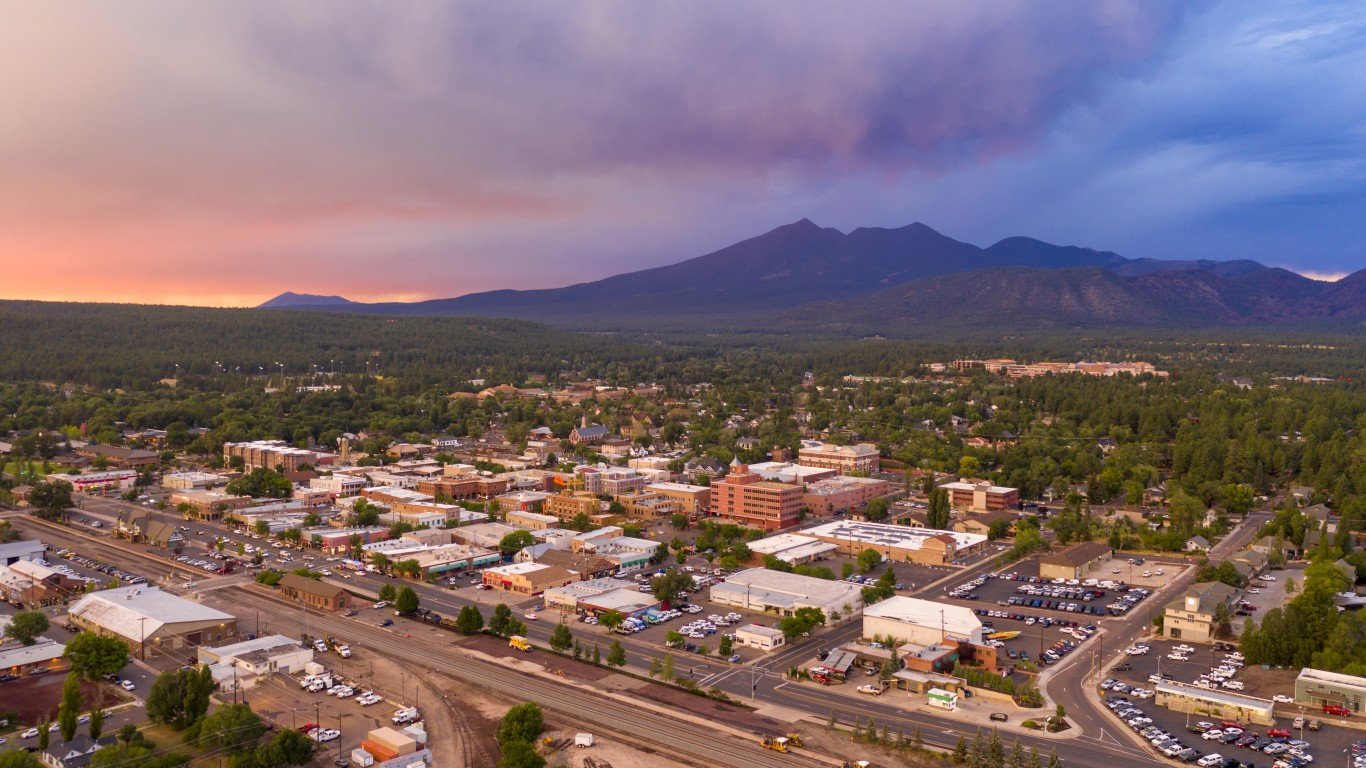
- Median annual rent as a share of household income: 27.4% (22.3% statewide)
- Gross median monthly rent: $1,555 ($1,431 statewide)
- Median household income: $68,041 ($76,872 statewide)
- Renters paying $3,000 or more per month: 2.5% (3.0% statewide)
- Renters paying less than $1,000 per month: 17.6% (22.4% statewide)
- Rental vacancy rate: 5.6% (5.3% statewide)
- Cities considered in state: 23
Arkansas: North Little Rock

- Median annual rent as a share of household income: 24.1% (18.7% statewide)
- Gross median monthly rent: $1,028 ($914 statewide)
- Median household income: $51,236 ($58,773 statewide)
- Renters paying $3,000 or more per month: 0.1% (0.7% statewide)
- Renters paying less than $1,000 per month: 46.3% (60.4% statewide)
- Rental vacancy rate: 7% (6.5% statewide)
- Cities considered in state: 9
California: El Cajon

- Median annual rent as a share of household income: 32.3% (24.4% statewide)
- Gross median monthly rent: $1,790 ($1,956 statewide)
- Median household income: $66,478 ($96,334 statewide)
- Renters paying $3,000 or more per month: 4.2% (17.1% statewide)
- Renters paying less than $1,000 per month: 7.2% (11.7% statewide)
- Rental vacancy rate: 2.9% (4.1% statewide)
- Cities considered in state: 187
Colorado: Boulder
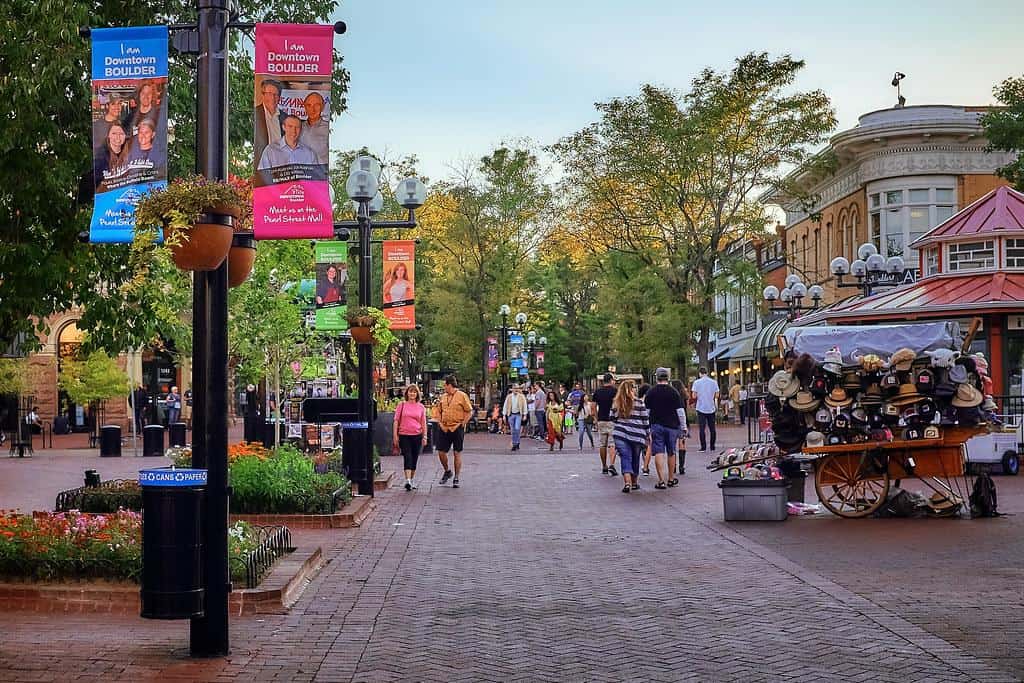
- Median annual rent as a share of household income: 27.0% (22.0% statewide)
- Gross median monthly rent: $1,924 ($1,693 statewide)
- Median household income: $85,364 ($92,470 statewide)
- Renters paying $3,000 or more per month: 16.5% (5.8% statewide)
- Renters paying less than $1,000 per month: 7.2% (14.5% statewide)
- Rental vacancy rate: 3.8% (5.1% statewide)
- Cities considered in state: 20
Connecticut: Hartford

- Median annual rent as a share of household income: 32.3% (18.3% statewide)
- Gross median monthly rent: $1,221 ($1,431 statewide)
- Median household income: $45,300 ($93,760 statewide)
- Renters paying $3,000 or more per month: 0.5% (5.3% statewide)
- Renters paying less than $1,000 per month: 28.8% (21.8% statewide)
- Rental vacancy rate: 6.9% (4.6% statewide)
- Cities considered in state: 14
Delaware: Wilmington

- Median annual rent as a share of household income: 25.8% (19.4% statewide)
- Gross median monthly rent: $1,187 ($1,341 statewide)
- Median household income: $55,269 ($82,855 statewide)
- Renters paying $3,000 or more per month: 0.3% (1.4% statewide)
- Renters paying less than $1,000 per month: 34% (21.8% statewide)
- Rental vacancy rate: 4.4% (4.8% statewide)
- Cities considered in state: 1
Florida: Lauderhill

- Median annual rent as a share of household income: 39.1% (26.2% statewide)
- Gross median monthly rent: $1,620 ($1,564 statewide)
- Median household income: $49,685 ($71,711 statewide)
- Renters paying $3,000 or more per month: 1.6% (4.9% statewide)
- Renters paying less than $1,000 per month: 6.5% (16.3% statewide)
- Rental vacancy rate: 4.9% (7.6% statewide)
- Cities considered in state: 80
Georgia: Stonecrest
- Median annual rent as a share of household income: 28.4% (21.0% statewide)
- Gross median monthly rent: $1,490 ($1,306 statewide)
- Median household income: $62,939 ($74,664 statewide)
- Renters paying $3,000 or more per month: 0.5% (1.9% statewide)
- Renters paying less than $1,000 per month: 11% (29.5% statewide)
- Rental vacancy rate: 6.2% (6.7% statewide)
- Cities considered in state: 19
Hawaii: Urban Honolulu

- Median annual rent as a share of household income: 25.0% (23.7% statewide)
- Gross median monthly rent: $1,783 ($1,938 statewide)
- Median household income: $85,428 ($98,317 statewide)
- Renters paying $3,000 or more per month: 14.5% (21.2% statewide)
- Renters paying less than $1,000 per month: 13.3% (13.4% statewide)
- Rental vacancy rate: 6.5% (7.8% statewide)
- Cities considered in state: 2
Idaho: Coeur d’Alene

- Median annual rent as a share of household income: 22.5% (18.5% statewide)
- Gross median monthly rent: $1,328 ($1,150 statewide)
- Median household income: $70,845 ($74,636 statewide)
- Renters paying $3,000 or more per month: 1.8% (1.6% statewide)
- Renters paying less than $1,000 per month: 28.8% (38.3% statewide)
- Rental vacancy rate: 5.7% (3.5% statewide)
- Cities considered in state: 8
Illinois: Champaign
- Median annual rent as a share of household income: 23.0% (18.0% statewide)
- Gross median monthly rent: $1,103 ($1,227 statewide)
- Median household income: $57,544 ($81,702 statewide)
- Renters paying $3,000 or more per month: 0.8% (3.8% statewide)
- Renters paying less than $1,000 per month: 40.1% (32.9% statewide)
- Rental vacancy rate: 9.3% (5.2% statewide)
- Cities considered in state: 29
Indiana: Gary
- Median annual rent as a share of household income: 31.3% (17.5% statewide)
- Gross median monthly rent: $975 ($1,020 statewide)
- Median household income: $37,380 ($70,051 statewide)
- Renters paying $3,000 or more per month: 0.2% (0.8% statewide)
- Renters paying less than $1,000 per month: 53.1% (48.1% statewide)
- Rental vacancy rate: 6.2% (5.8% statewide)
- Cities considered in state: 21
Iowa: Iowa City
- Median annual rent as a share of household income: 22.8% (15.6% statewide)
- Gross median monthly rent: $1,094 ($949 statewide)
- Median household income: $57,533 ($73,147 statewide)
- Renters paying $3,000 or more per month: 1.9% (1.3% statewide)
- Renters paying less than $1,000 per month: 42.1% (56.0% statewide)
- Rental vacancy rate: 7.3% (5.7% statewide)
- Cities considered in state: 11
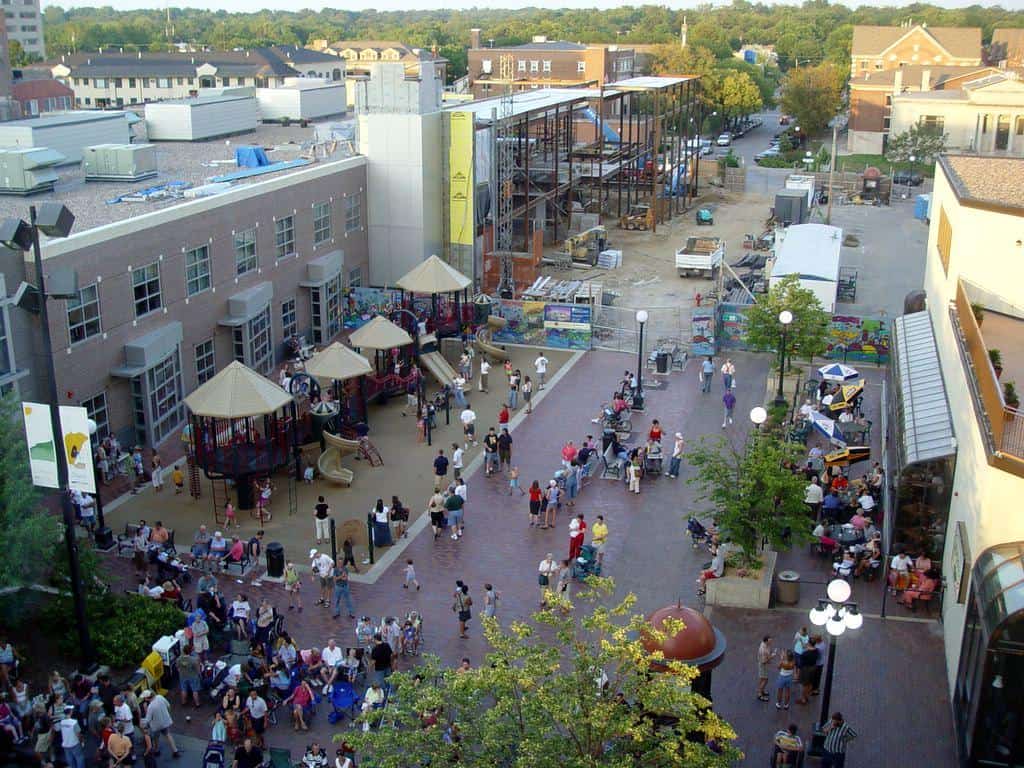
Kansas: Kansas City
- Median annual rent as a share of household income: 21.8% (17.0% statewide)
- Gross median monthly rent: $1,073 ($1,029 statewide)
- Median household income: $59,183 ($72,639 statewide)
- Renters paying $3,000 or more per month: 0.5% (1.3% statewide)
- Renters paying less than $1,000 per month: 42.8% (47.5% statewide)
- Rental vacancy rate: 5.5% (6.5% statewide)
- Cities considered in state: 9
Kentucky: Bowling Green
- Median annual rent as a share of household income: 23.5% (17.9% statewide)
- Gross median monthly rent: $948 ($933 statewide)
- Median household income: $48,419 ($62,417 statewide)
- Renters paying $3,000 or more per month: 0.8% (0.5% statewide)
- Renters paying less than $1,000 per month: 57.8% (57.5% statewide)
- Rental vacancy rate: 6.6% (5.0% statewide)
- Cities considered in state: 4
Louisiana: New Orleans

- Median annual rent as a share of household income: 26.3% (20.8% statewide)
- Gross median monthly rent: $1,211 ($1,038 statewide)
- Median household income: $55,339 ($60,023 statewide)
- Renters paying $3,000 or more per month: 1.7% (0.8% statewide)
- Renters paying less than $1,000 per month: 31.7% (46.6% statewide)
- Rental vacancy rate: 8.2% (7.8% statewide)
- Cities considered in state: 8
Maine: Portland
- Median annual rent as a share of household income: 23.4% (18.1% statewide)
- Gross median monthly rent: $1,487 ($1,084 statewide)
- Median household income: $76,174 ($71,773 statewide)
- Renters paying $3,000 or more per month: 2.5% (1.6% statewide)
- Renters paying less than $1,000 per month: 20.7% (43.4% statewide)
- Rental vacancy rate: 4.2% (4.3% statewide)
- Cities considered in state: 1
Maryland: Dundalk

- Median annual rent as a share of household income: 27.2% (19.6% statewide)
- Gross median monthly rent: $1,412 ($1,662 statewide)
- Median household income: $62,349 ($101,652 statewide)
- Renters paying $3,000 or more per month: 0.4% (5.4% statewide)
- Renters paying less than $1,000 per month: 17.2% (15.5% statewide)
- Rental vacancy rate: 4.3% (4.9% statewide)
- Cities considered in state: 18
Massachusetts: Lawrence

- Median annual rent as a share of household income: 32.5% (20.0% statewide)
- Gross median monthly rent: $1,569 ($1,687 statewide)
- Median household income: $57,903 ($101,341 statewide)
- Renters paying $3,000 or more per month: 0.9% (11.7% statewide)
- Renters paying less than $1,000 per month: 22.2% (23.0% statewide)
- Rental vacancy rate: 2.1% (3.4% statewide)
- Cities considered in state: 25
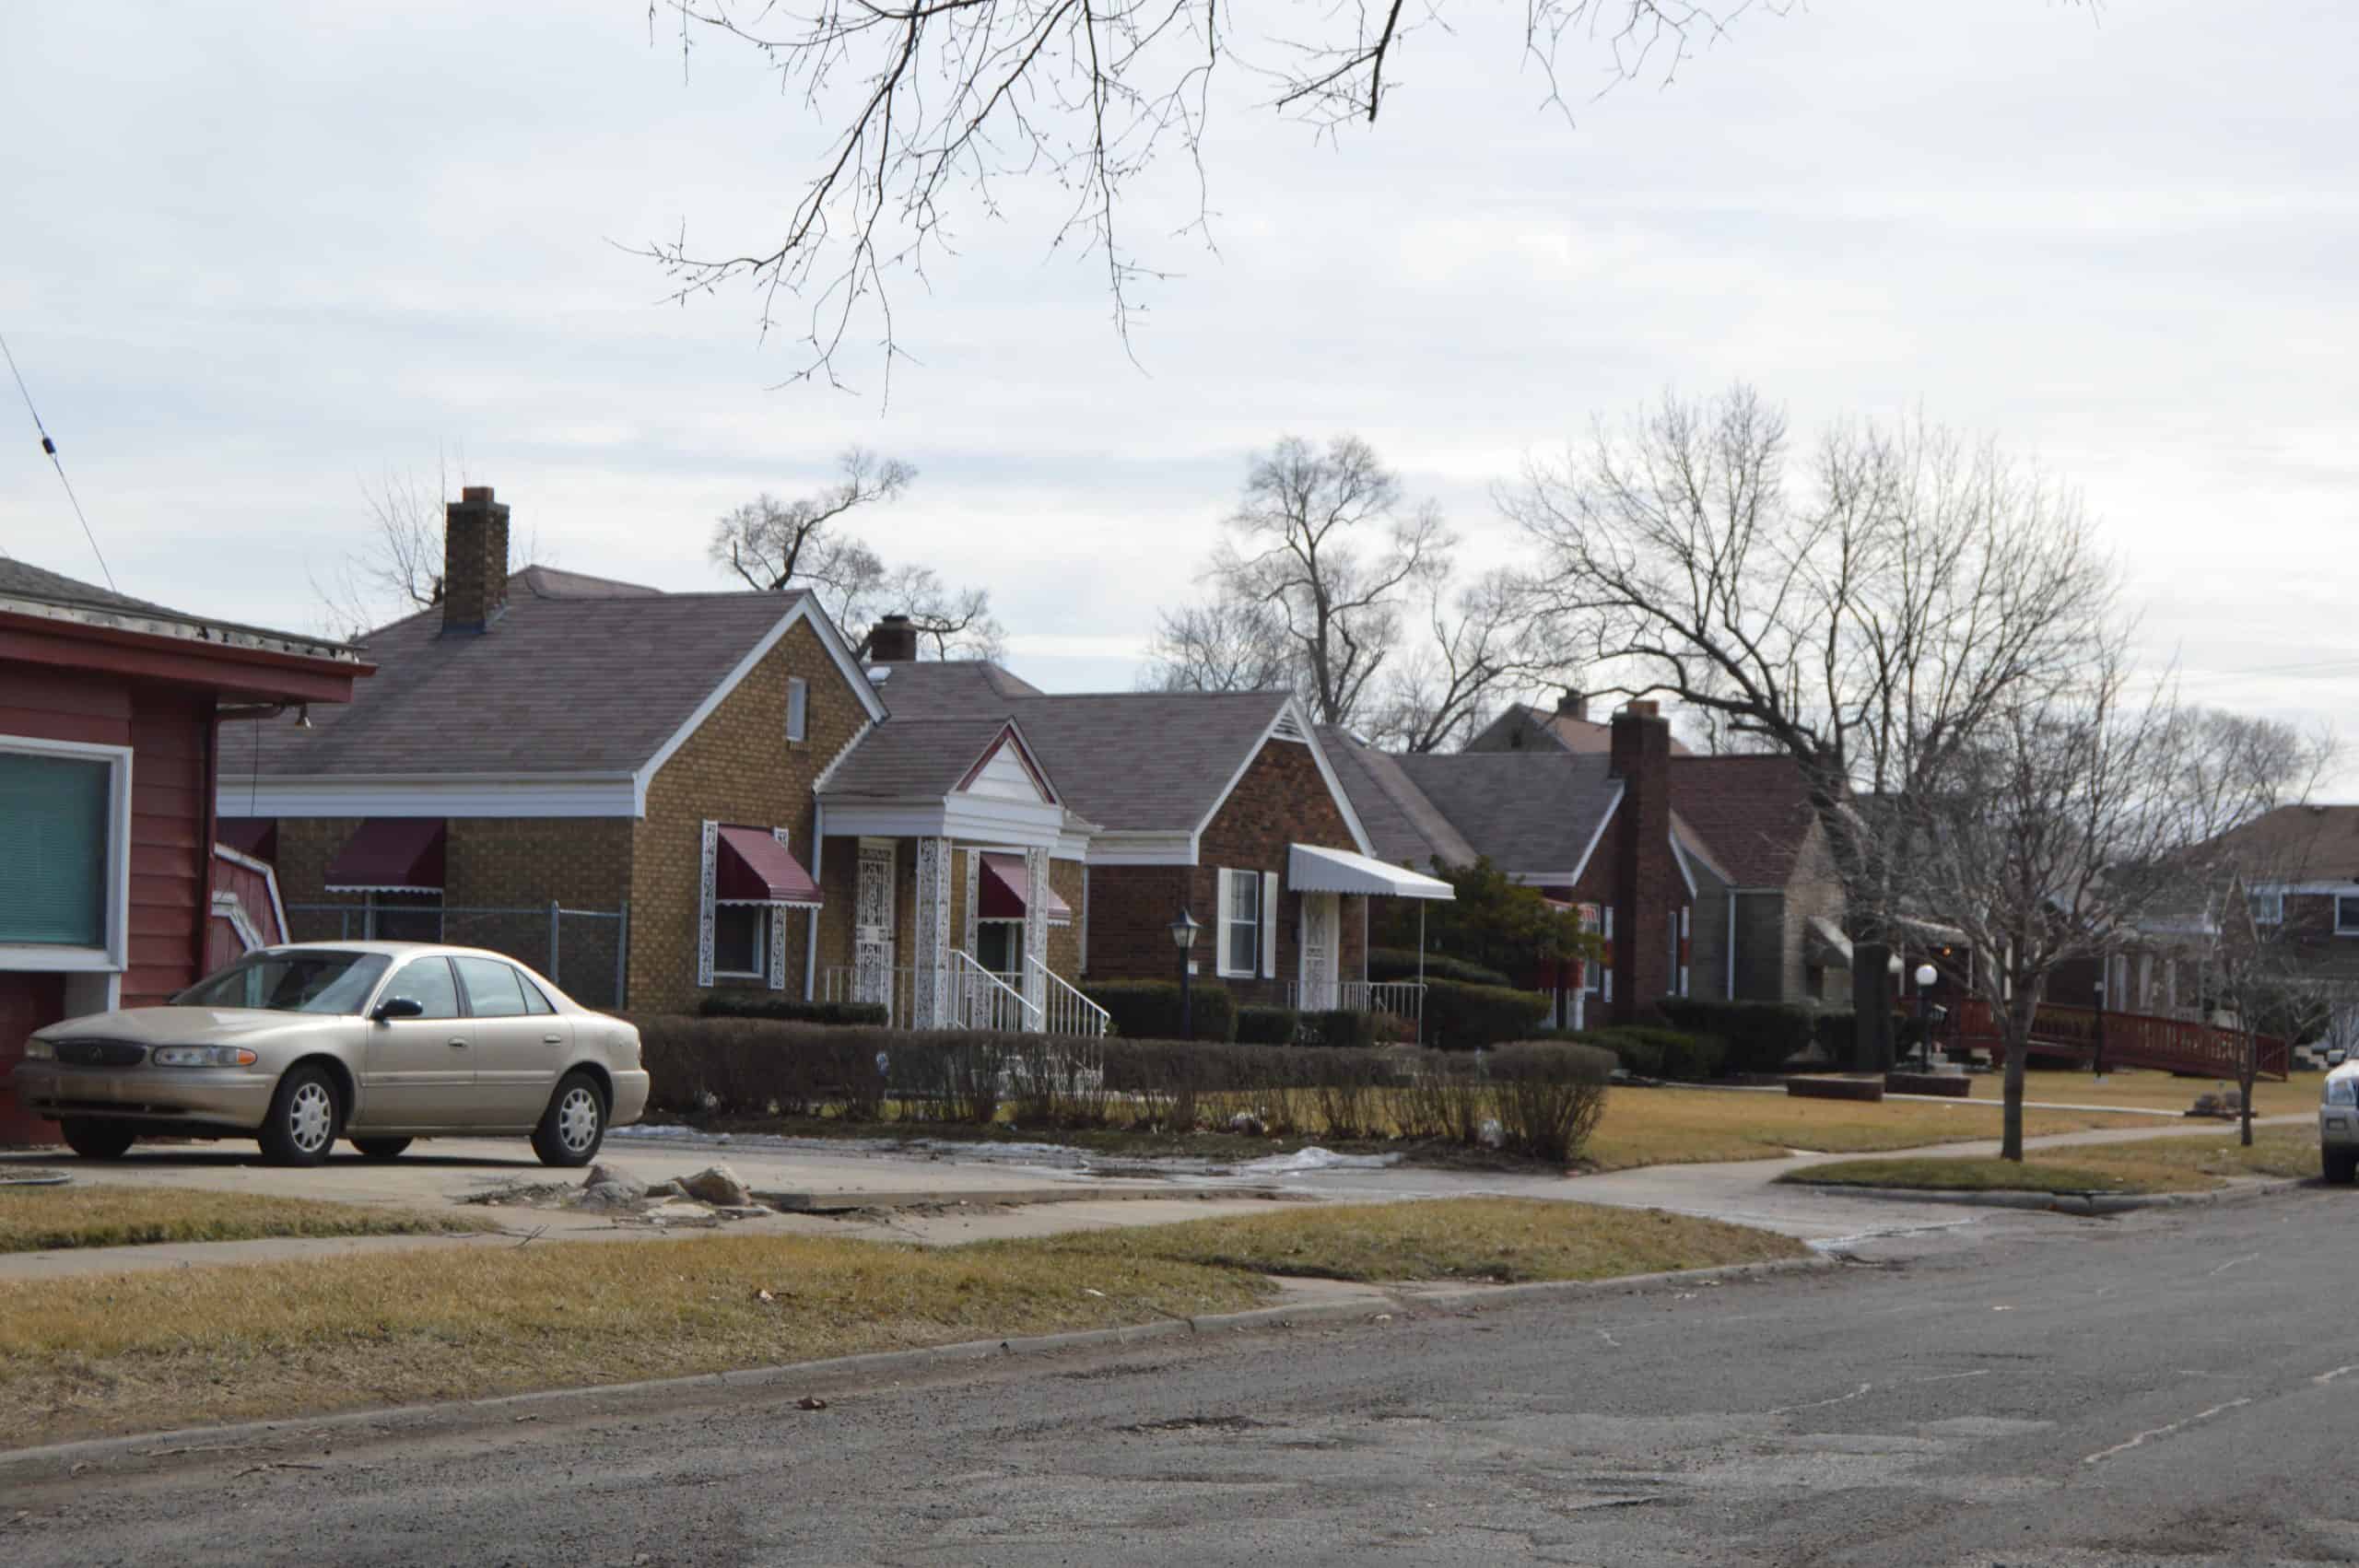
Michigan: Detroit

- Median annual rent as a share of household income: 31.4% (18.3% statewide)
- Gross median monthly rent: $1,034 ($1,084 statewide)
- Median household income: $39,575 ($71,149 statewide)
- Renters paying $3,000 or more per month: 0.4% (1.6% statewide)
- Renters paying less than $1,000 per month: 46.8% (42.3% statewide)
- Rental vacancy rate: 3.7% (5.0% statewide)
- Cities considered in state: 24
Minnesota: Burnsville
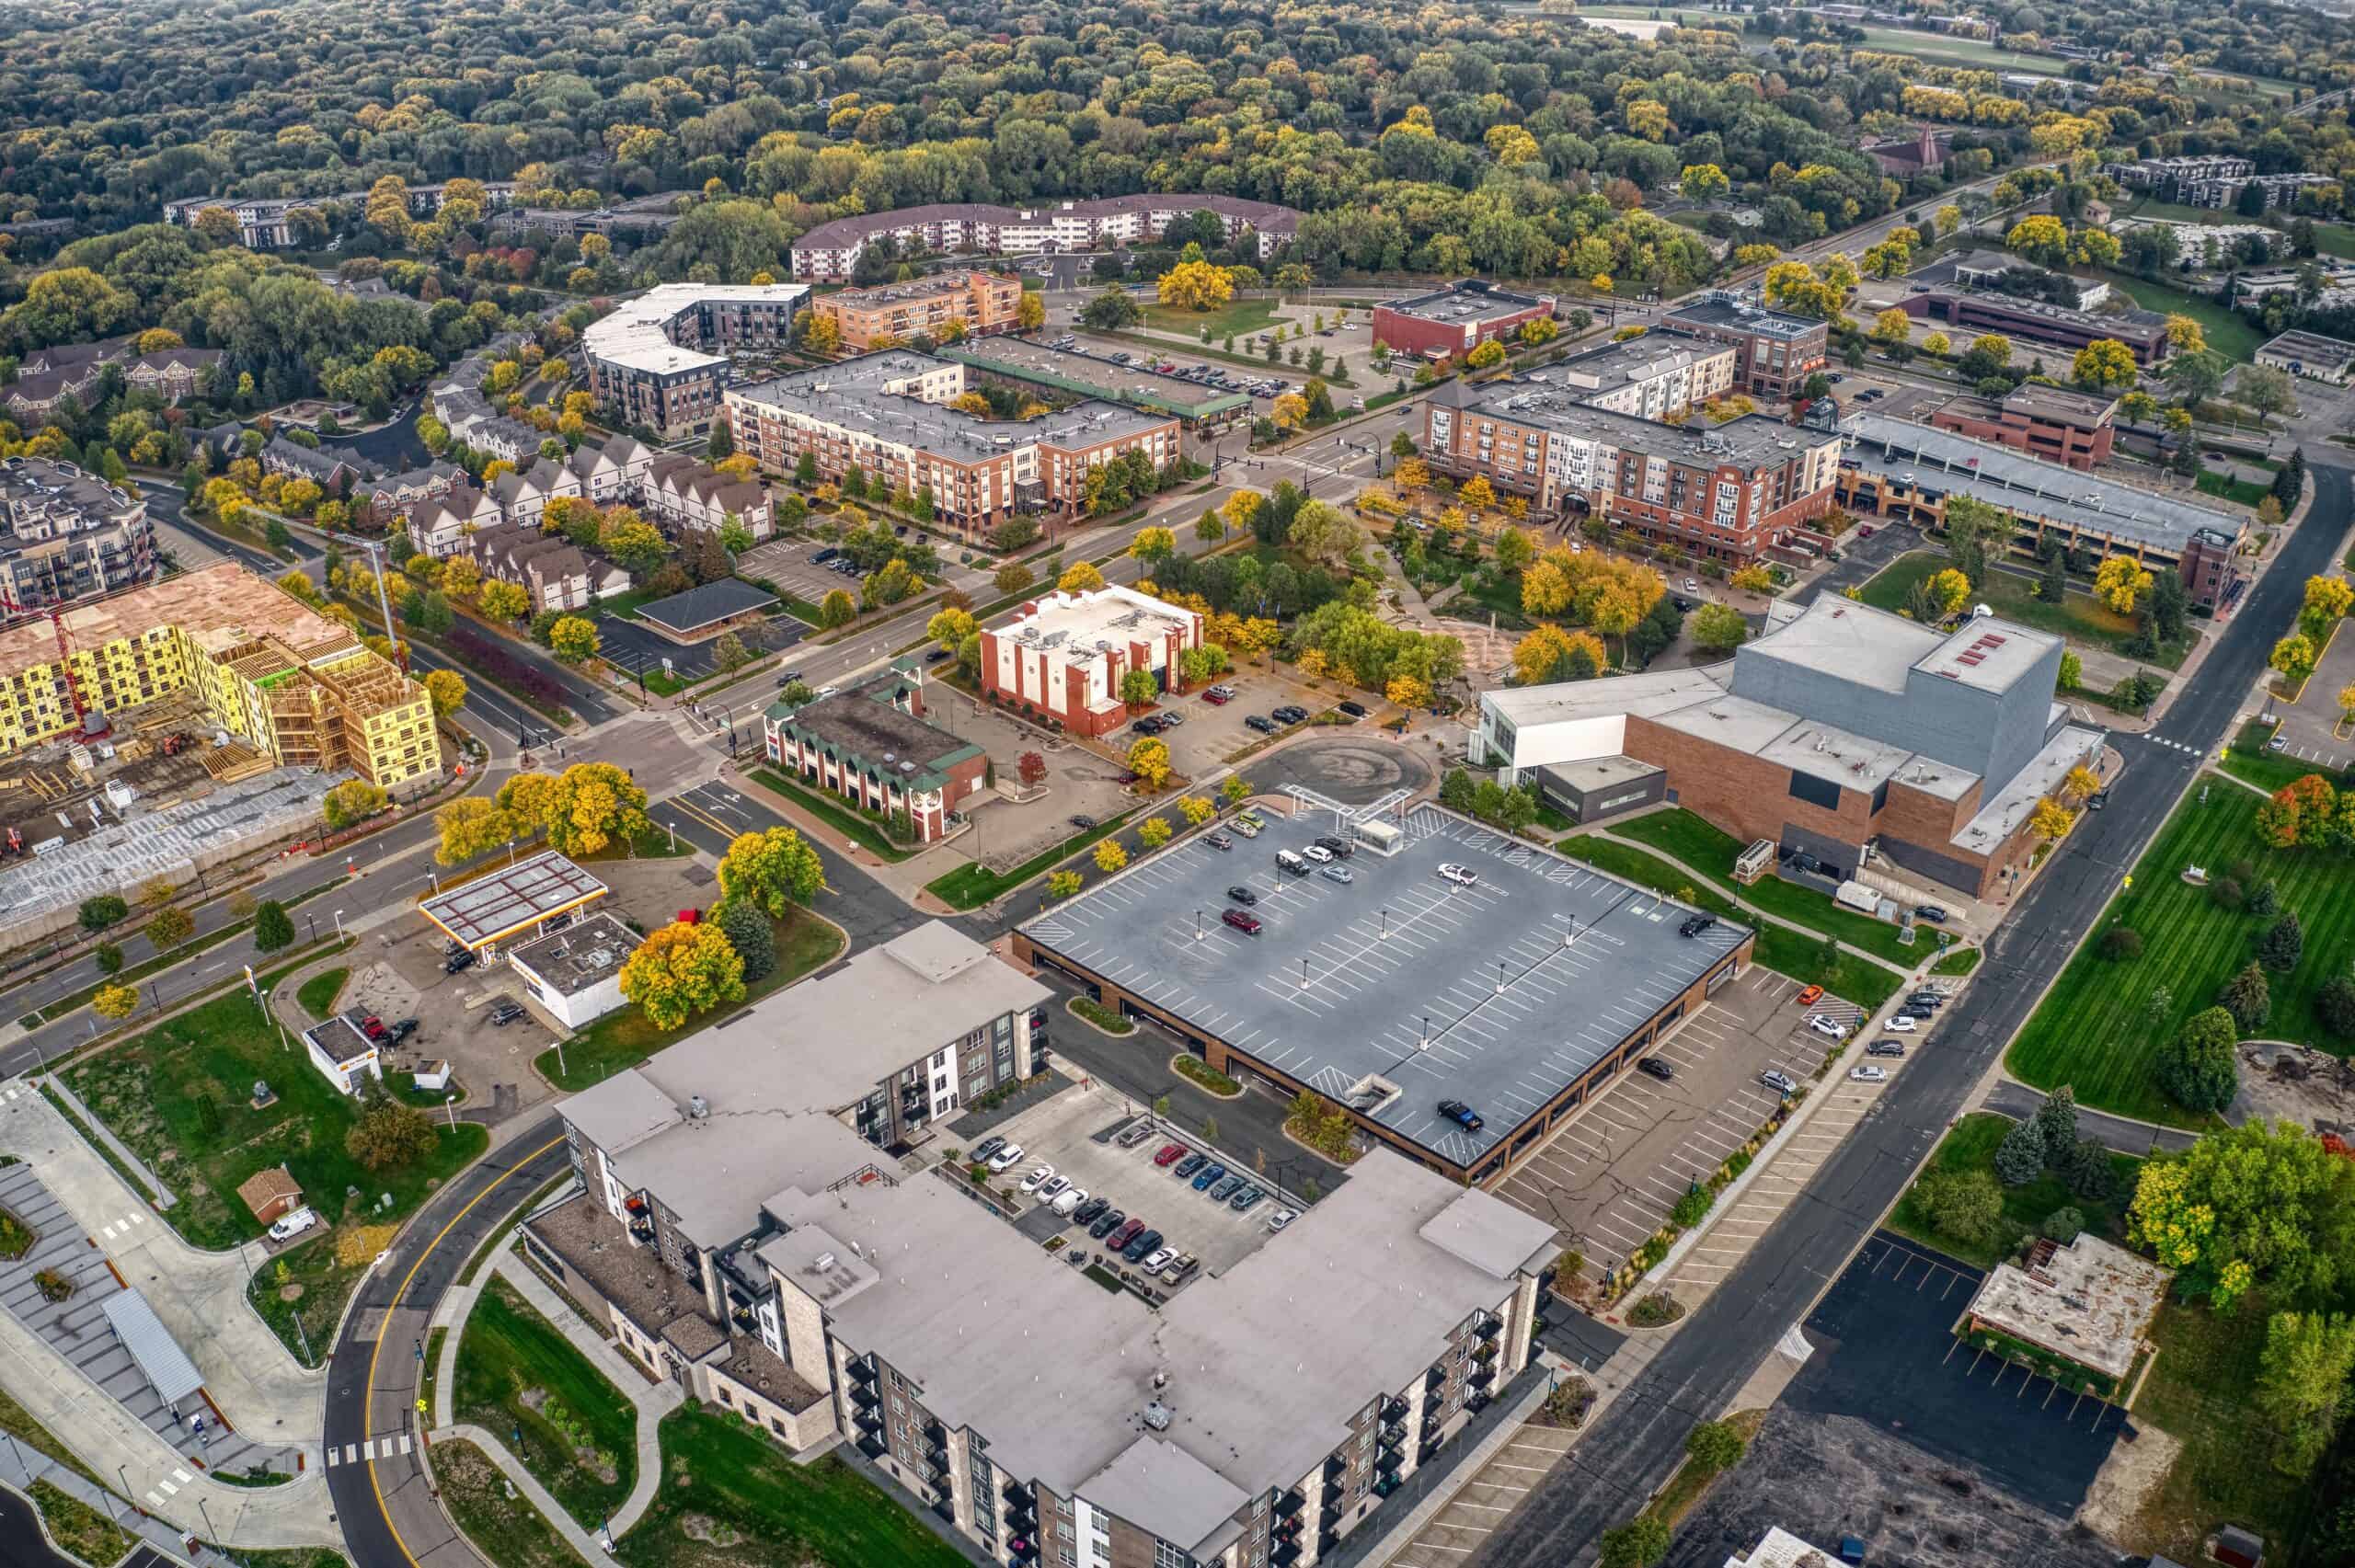
- Median annual rent as a share of household income: 21.5% (16.9% statewide)
- Gross median monthly rent: $1,501 ($1,235 statewide)
- Median household income: $83,953 ($87,556 statewide)
- Renters paying $3,000 or more per month: 1.2% (2.6% statewide)
- Renters paying less than $1,000 per month: 12.1% (31.9% statewide)
- Rental vacancy rate: 4.5% (5.1% statewide)
- Cities considered in state: 19
Mississippi: Jackson

- Median annual rent as a share of household income: 28.3% (20.2% statewide)
- Gross median monthly rent: $1,018 ($923 statewide)
- Median household income: $43,238 ($54,915 statewide)
- Renters paying $3,000 or more per month: 0.1% (0.5% statewide)
- Renters paying less than $1,000 per month: 48% (58.1% statewide)
- Rental vacancy rate: 7.7% (8.6% statewide)
- Cities considered in state: 3
Missouri: Springfield

- Median annual rent as a share of household income: 24.0% (17.3% statewide)
- Gross median monthly rent: $920 ($996 statewide)
- Median household income: $45,984 ($68,920 statewide)
- Renters paying $3,000 or more per month: 0.9% (1.1% statewide)
- Renters paying less than $1,000 per month: 60.7% (50.4% statewide)
- Rental vacancy rate: 3% (5.0% statewide)
- Cities considered in state: 13
Montana: Bozeman
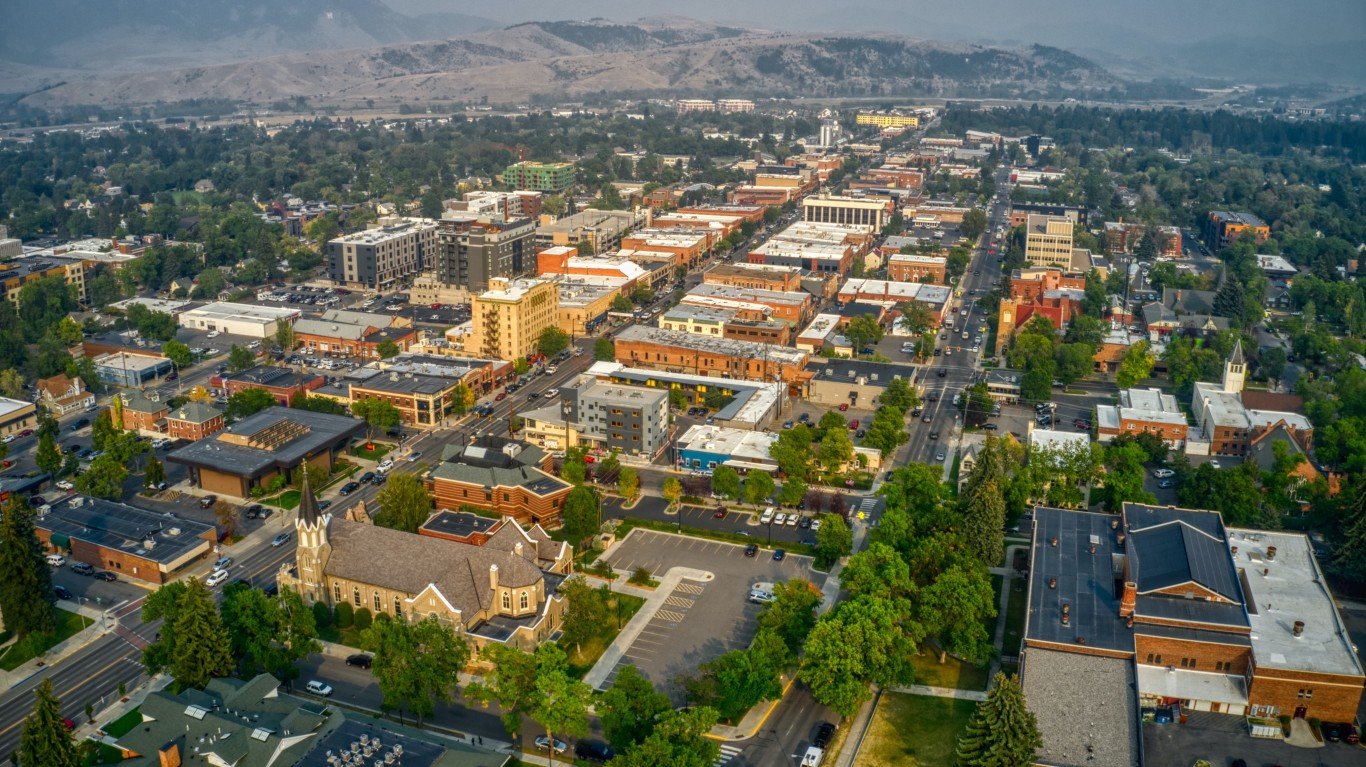
- Median annual rent as a share of household income: 24.2% (17.7% statewide)
- Gross median monthly rent: $1,611 ($1,031 statewide)
- Median household income: $79,903 ($69,922 statewide)
- Renters paying $3,000 or more per month: 4.7% (1.7% statewide)
- Renters paying less than $1,000 per month: 18.2% (47.6% statewide)
- Rental vacancy rate: 4.2% (5.6% statewide)
- Cities considered in state: 4
Nebraska: Omaha

- Median annual rent as a share of household income: 19.0% (16.6% statewide)
- Gross median monthly rent: $1,150 ($1,035 statewide)
- Median household income: $72,708 ($74,985 statewide)
- Renters paying $3,000 or more per month: 1.3% (1.4% statewide)
- Renters paying less than $1,000 per month: 34.1% (46.9% statewide)
- Rental vacancy rate: 5.9% (4.7% statewide)
- Cities considered in state: 4
Nevada: Sunrise Manor
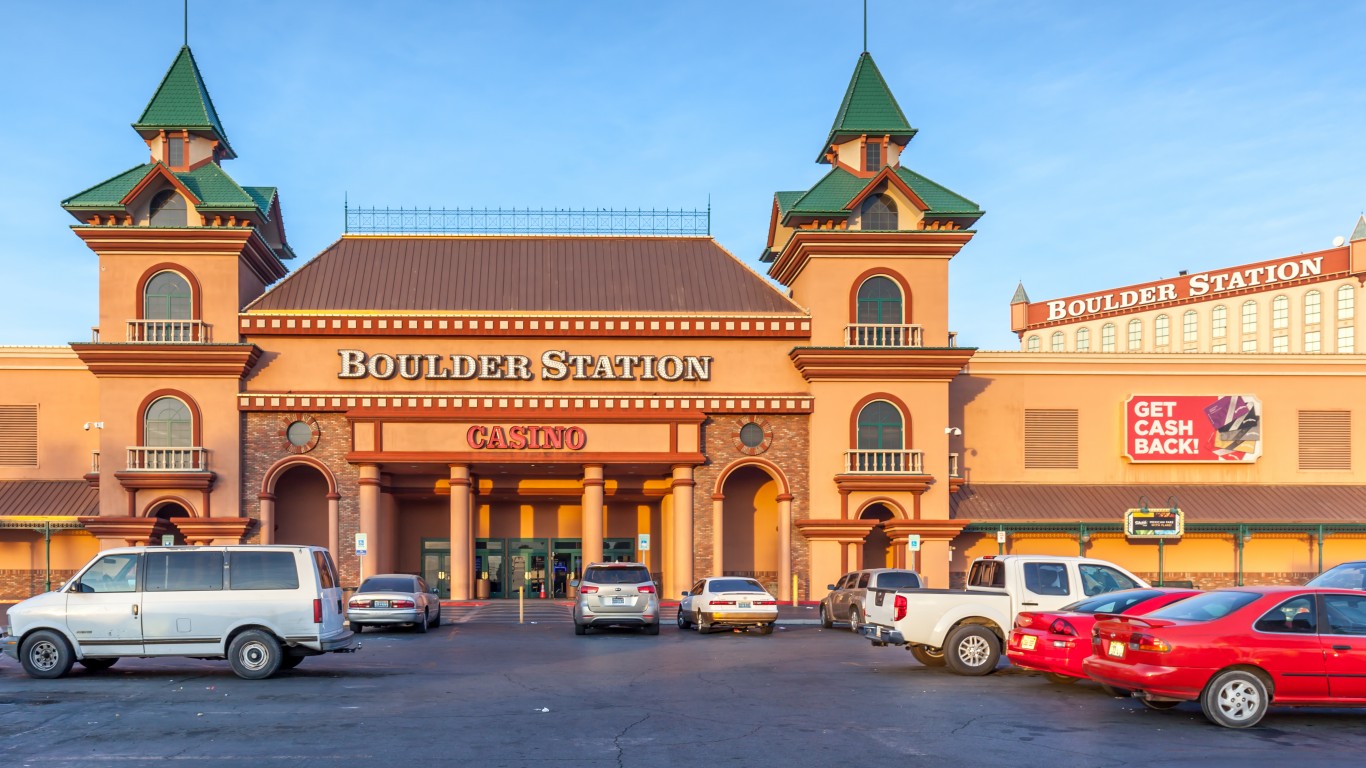
- Median annual rent as a share of household income: 28.0% (23.6% statewide)
- Gross median monthly rent: $1,284 ($1,489 statewide)
- Median household income: $55,034 ($75,561 statewide)
- Renters paying $3,000 or more per month: 0.4% (2.3% statewide)
- Renters paying less than $1,000 per month: 18.8% (16.3% statewide)
- Rental vacancy rate: 6% (6.7% statewide)
- Cities considered in state: 10
New Hampshire: Manchester

- Median annual rent as a share of household income: 22.7% (17.9% statewide)
- Gross median monthly rent: $1,465 ($1,423 statewide)
- Median household income: $77,415 ($95,628 statewide)
- Renters paying $3,000 or more per month: 1.3% (2.5% statewide)
- Renters paying less than $1,000 per month: 18.3% (22.0% statewide)
- Rental vacancy rate: 4.2% (3.9% statewide)
- Cities considered in state: 2
New Jersey: New Brunswick

- Median annual rent as a share of household income: 35.7% (19.6% statewide)
- Gross median monthly rent: $1,790 ($1,653 statewide)
- Median household income: $60,248 ($101,050 statewide)
- Renters paying $3,000 or more per month: 10.6% (7.6% statewide)
- Renters paying less than $1,000 per month: 15.2% (15.0% statewide)
- Rental vacancy rate: 4.2% (3.6% statewide)
- Cities considered in state: 19
New Mexico: Santa Fe
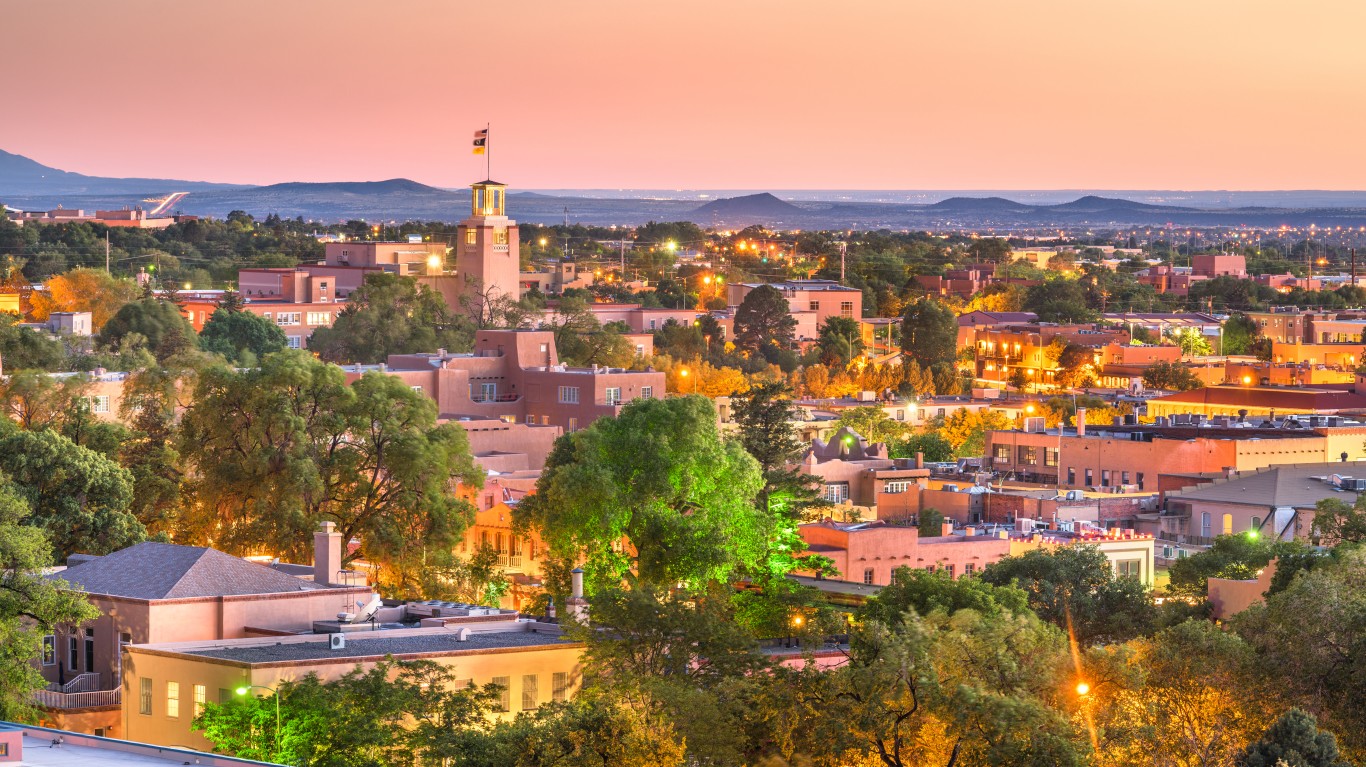
- Median annual rent as a share of household income: 23.6% (19.7% statewide)
- Gross median monthly rent: $1,380 ($1,021 statewide)
- Median household income: $70,110 ($62,125 statewide)
- Renters paying $3,000 or more per month: 4% (1.0% statewide)
- Renters paying less than $1,000 per month: 25.1% (48.5% statewide)
- Rental vacancy rate: 4.4% (6.1% statewide)
- Cities considered in state: 4
New York: New York

- Median annual rent as a share of household income: 26.8% (22.4% statewide)
- Gross median monthly rent: $1,779 ($1,576 statewide)
- Median household income: $79,713 ($84,578 statewide)
- Renters paying $3,000 or more per month: 15.4% (12.0% statewide)
- Renters paying less than $1,000 per month: 18.3% (24.2% statewide)
- Rental vacancy rate: 3.5% (3.8% statewide)
- Cities considered in state: 17
North Carolina: Jacksonville

- Median annual rent as a share of household income: 28.1% (19.9% statewide)
- Gross median monthly rent: $1,268 ($1,162 statewide)
- Median household income: $54,069 ($69,904 statewide)
- Renters paying $3,000 or more per month: 0.2% (1.4% statewide)
- Renters paying less than $1,000 per month: 27.8% (37.6% statewide)
- Rental vacancy rate: 6.6% (6.9% statewide)
- Cities considered in state: 22
North Dakota: Grand Forks
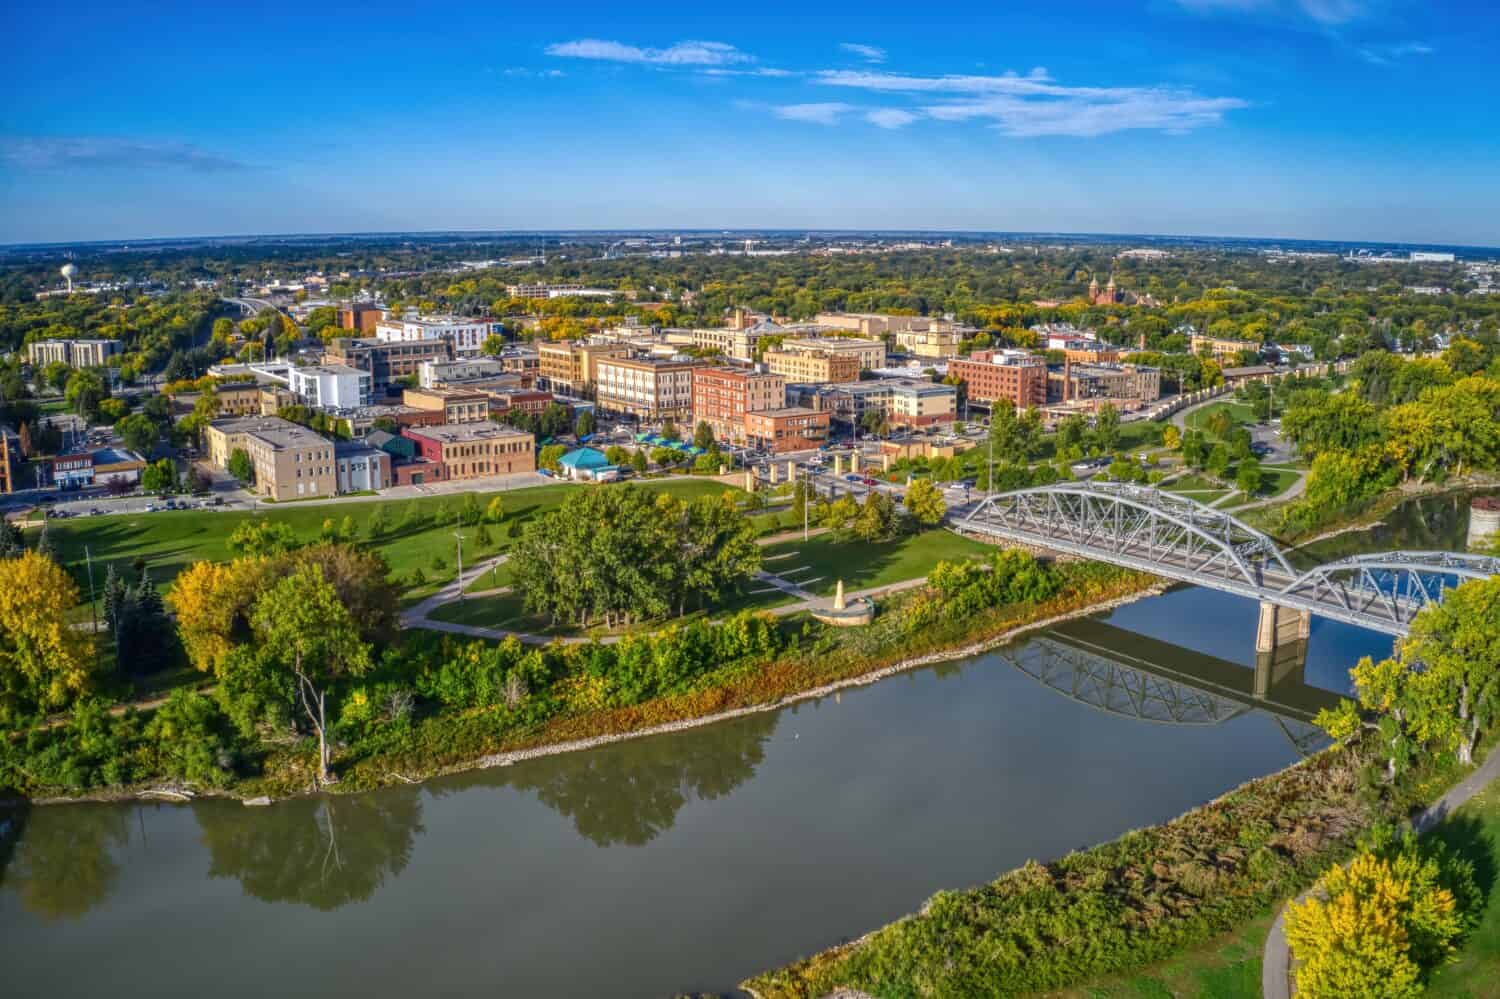
- Median annual rent as a share of household income: 18.0% (14.8% statewide)
- Gross median monthly rent: $958 ($934 statewide)
- Median household income: $63,838 ($75,949 statewide)
- Renters paying $3,000 or more per month: 1.2% (0.9% statewide)
- Renters paying less than $1,000 per month: 54.5% (56.9% statewide)
- Rental vacancy rate: 6.5% (9.3% statewide)
- Cities considered in state: 3
Ohio: Cleveland
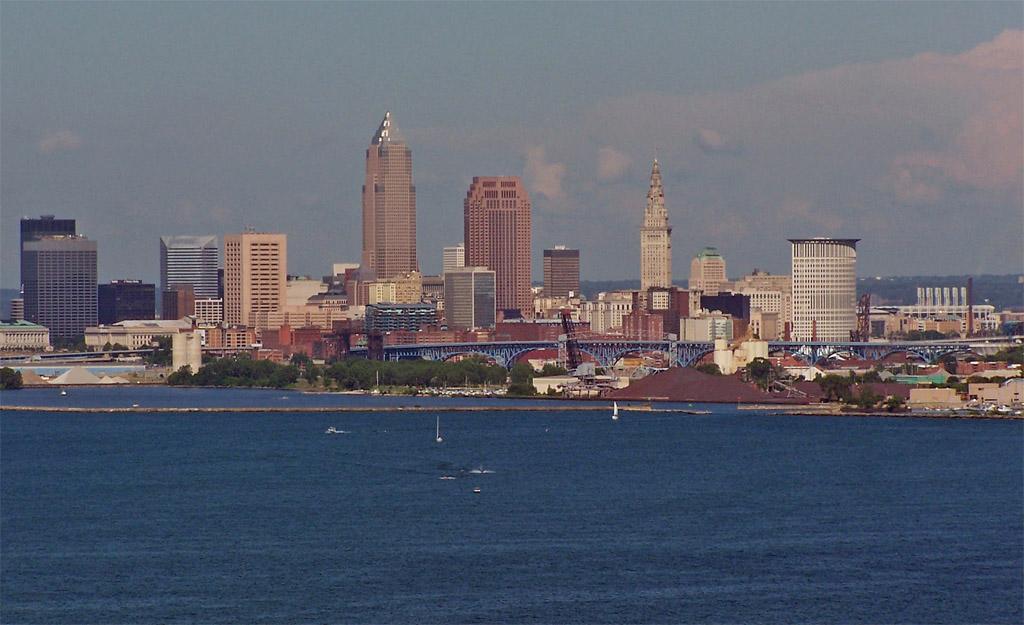
- Median annual rent as a share of household income: 27.4% (17.0% statewide)
- Gross median monthly rent: $894 ($988 statewide)
- Median household income: $39,187 ($69,680 statewide)
- Renters paying $3,000 or more per month: 0.8% (1.0% statewide)
- Renters paying less than $1,000 per month: 60.2% (51.3% statewide)
- Rental vacancy rate: 5% (4.3% statewide)
- Cities considered in state: 18
Oklahoma: Midwest City

- Median annual rent as a share of household income: 21.7% (18.5% statewide)
- Gross median monthly rent: $1,046 ($980 statewide)
- Median household income: $57,739 ($63,603 statewide)
- Renters paying $3,000 or more per month: 0.3% (0.9% statewide)
- Renters paying less than $1,000 per month: 45% (52.3% statewide)
- Rental vacancy rate: 5.6% (6.8% statewide)
- Cities considered in state: 9
Oregon: Eugene

- Median annual rent as a share of household income: 25.3% (21.6% statewide)
- Gross median monthly rent: $1,347 ($1,450 statewide)
- Median household income: $63,836 ($80,426 statewide)
- Renters paying $3,000 or more per month: 2.6% (3.2% statewide)
- Renters paying less than $1,000 per month: 26.5% (20.8% statewide)
- Rental vacancy rate: 3.3% (3.8% statewide)
- Cities considered in state: 13
Pennsylvania: Allentown

- Median annual rent as a share of household income: 28.5% (18.3% statewide)
- Gross median monthly rent: $1,269 ($1,162 statewide)
- Median household income: $53,403 ($76,081 statewide)
- Renters paying $3,000 or more per month: 0.7% (2.4% statewide)
- Renters paying less than $1,000 per month: 24.3% (37.7% statewide)
- Rental vacancy rate: 3.6% (4.9% statewide)
- Cities considered in state: 10
Rhode Island: Providence

- Median annual rent as a share of household income: 24.0% (17.7% statewide)
- Gross median monthly rent: $1,333 ($1,273 statewide)
- Median household income: $66,772 ($86,372 statewide)
- Renters paying $3,000 or more per month: 2.4% (2.2% statewide)
- Renters paying less than $1,000 per month: 28.2% (30.2% statewide)
- Rental vacancy rate: 6.6% (4.5% statewide)
- Cities considered in state: 4
South Carolina: North Charleston

- Median annual rent as a share of household income: 26.1% (20.2% statewide)
- Gross median monthly rent: $1,364 ($1,126 statewide)
- Median household income: $62,789 ($66,818 statewide)
- Renters paying $3,000 or more per month: 0.8% (1.5% statewide)
- Renters paying less than $1,000 per month: 14.8% (39.3% statewide)
- Rental vacancy rate: 9.9% (8.3% statewide)
- Cities considered in state: 7
South Dakota: Rapid City
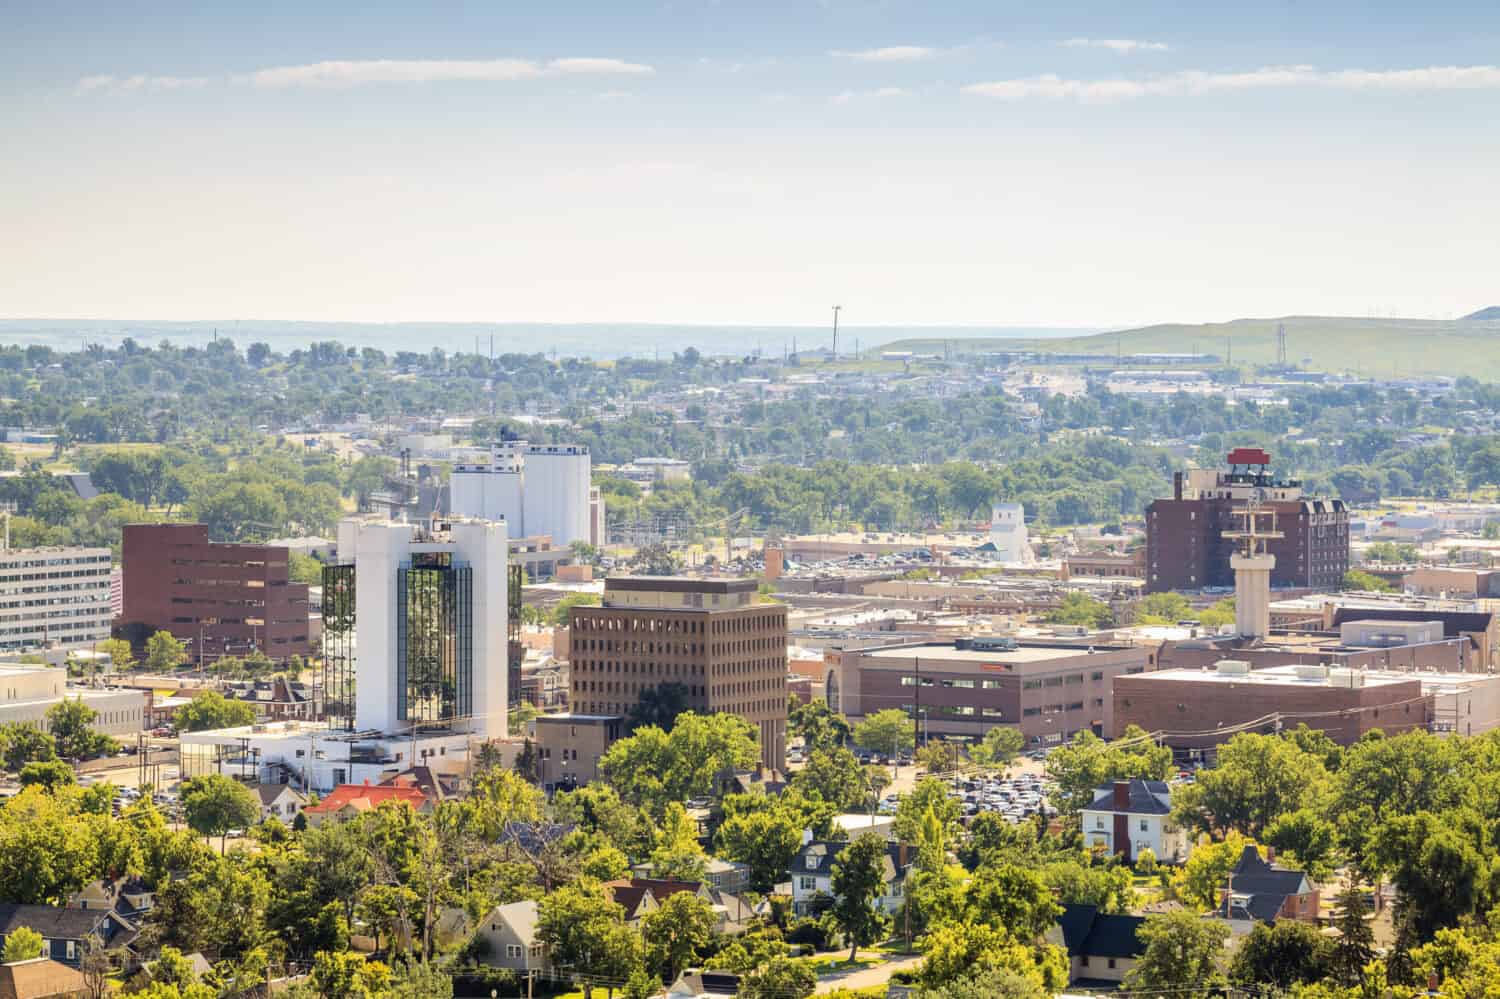
- Median annual rent as a share of household income: 19.2% (15.1% statewide)
- Gross median monthly rent: $1,053 ($912 statewide)
- Median household income: $65,712 ($72,421 statewide)
- Renters paying $3,000 or more per month: 1.1% (0.9% statewide)
- Renters paying less than $1,000 per month: 45.8% (59.3% statewide)
- Rental vacancy rate: 4.5% (6.1% statewide)
- Cities considered in state: 2
Tennessee: Memphis
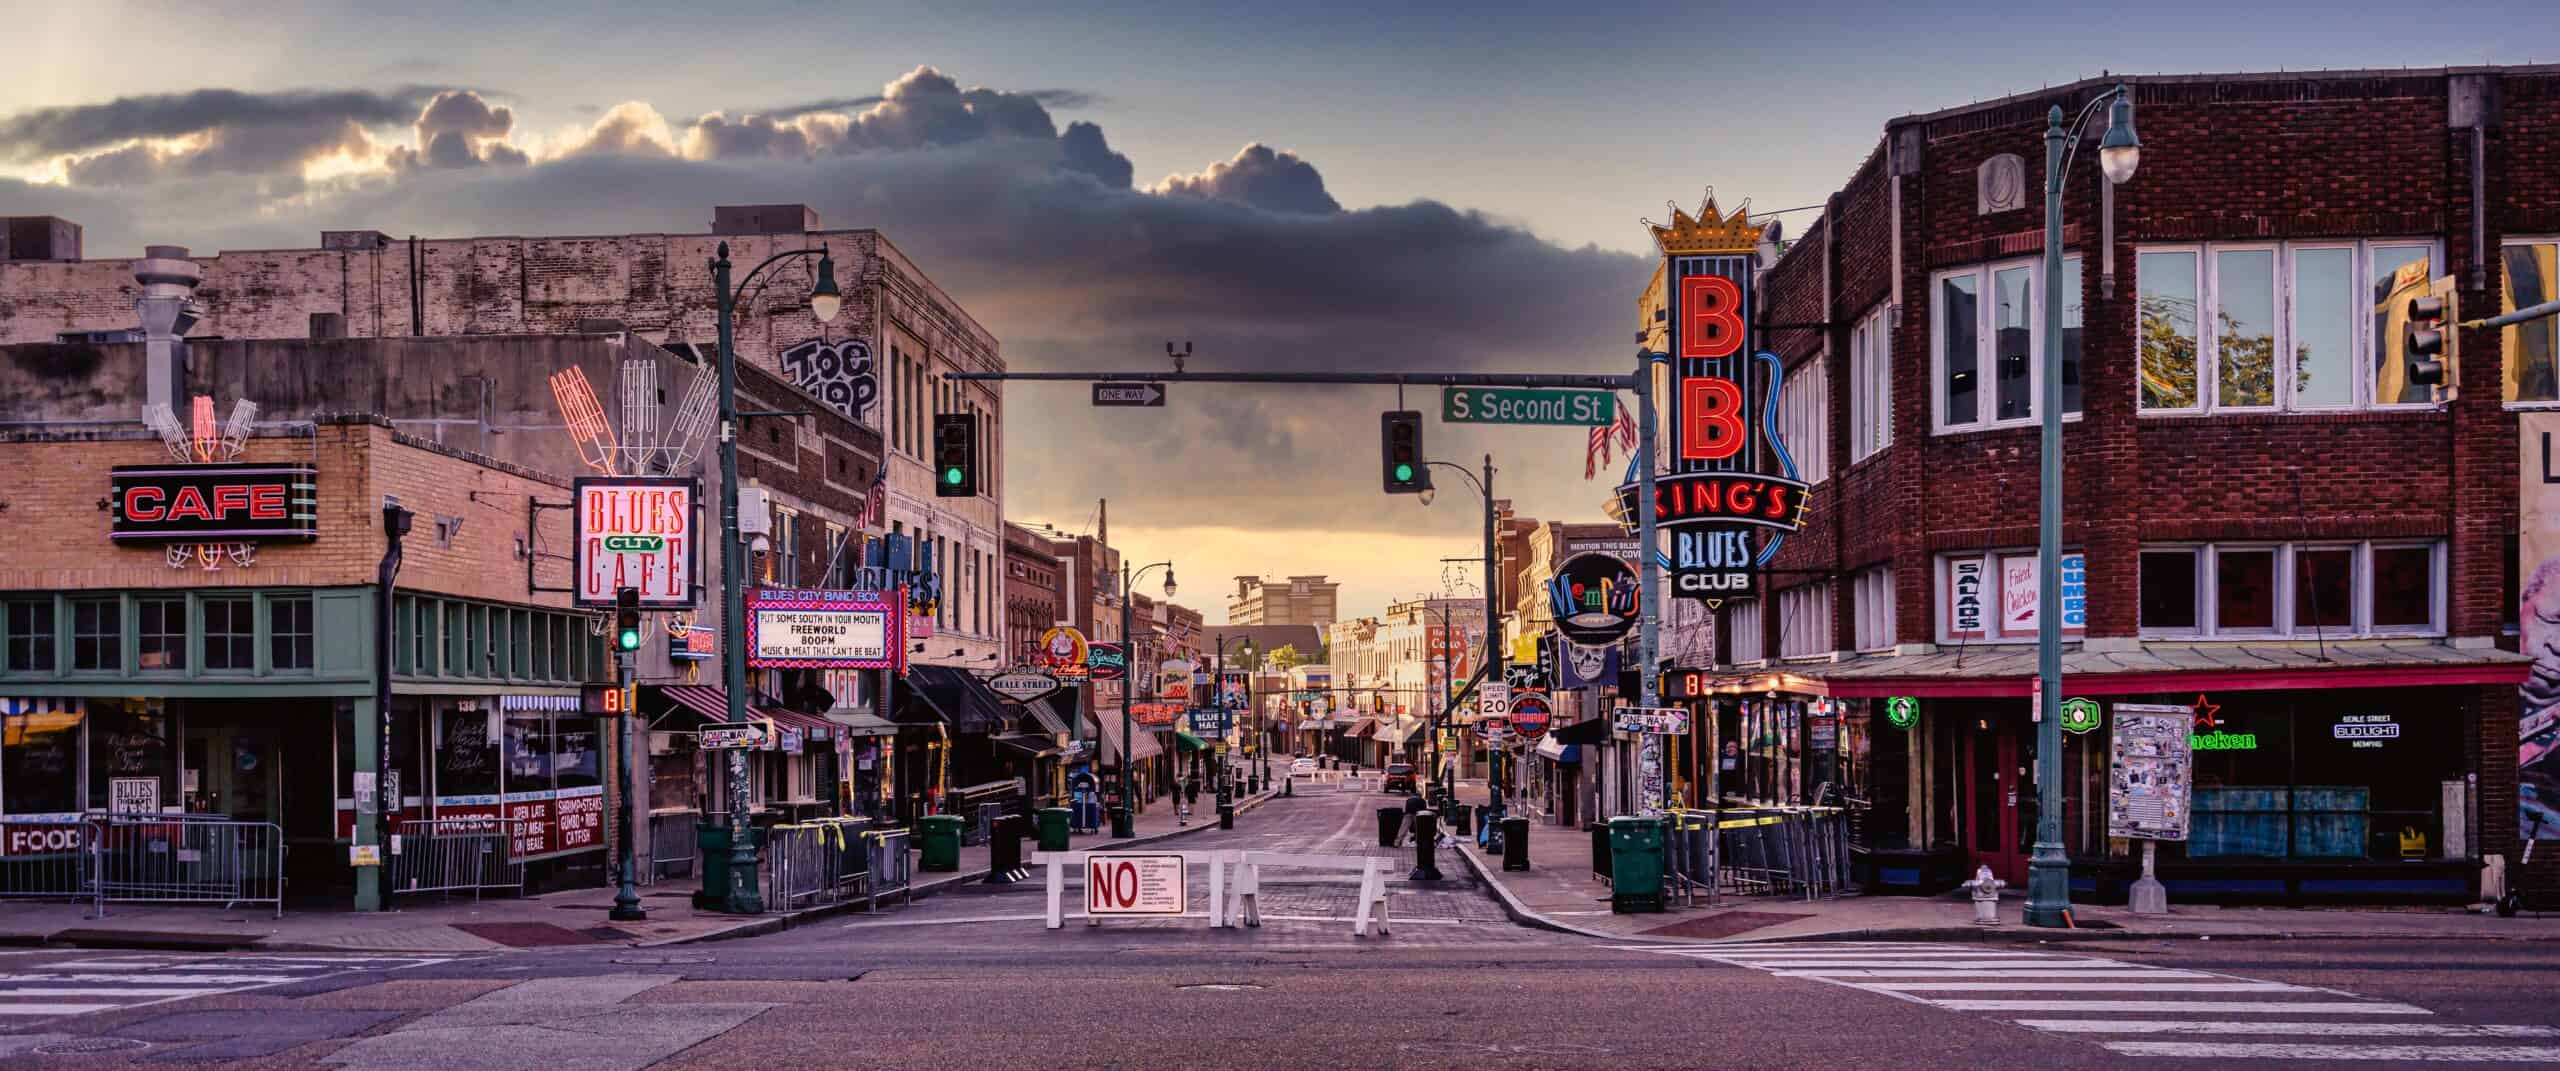
- Median annual rent as a share of household income: 26.3% (20.1% statewide)
- Gross median monthly rent: $1,123 ($1,122 statewide)
- Median household income: $51,211 ($67,097 statewide)
- Renters paying $3,000 or more per month: 0.6% (1.4% statewide)
- Renters paying less than $1,000 per month: 37.4% (40.7% statewide)
- Rental vacancy rate: 7.9% (6.1% statewide)
- Cities considered in state: 15
Texas: San Marcos
- Median annual rent as a share of household income: 30.5% (21.1% statewide)
- Gross median monthly rent: $1,299 ($1,339 statewide)
- Median household income: $51,030 ($76,292 statewide)
- Renters paying $3,000 or more per month: 0.4% (2.4% statewide)
- Renters paying less than $1,000 per month: 24.6% (24.1% statewide)
- Rental vacancy rate: 3.9% (7.4% statewide)
- Cities considered in state: 74
Utah: St. George

- Median annual rent as a share of household income: 23.5% (18.4% statewide)
- Gross median monthly rent: $1,429 ($1,405 statewide)
- Median household income: $72,870 ($91,750 statewide)
- Renters paying $3,000 or more per month: 3.7% (2.2% statewide)
- Renters paying less than $1,000 per month: 20.1% (22.0% statewide)
- Rental vacancy rate: 7.6% (5.6% statewide)
- Cities considered in state: 16
Virginia: Portsmouth

- Median annual rent as a share of household income: 25.8% (20.0% statewide)
- Gross median monthly rent: $1,266 ($1,514 statewide)
- Median household income: $58,972 ($90,974 statewide)
- Renters paying $3,000 or more per month: 0.2% (6.2% statewide)
- Renters paying less than $1,000 per month: 24.8% (22.8% statewide)
- Rental vacancy rate: 3.6% (4.9% statewide)
- Cities considered in state: 16
Washington: Bellingham
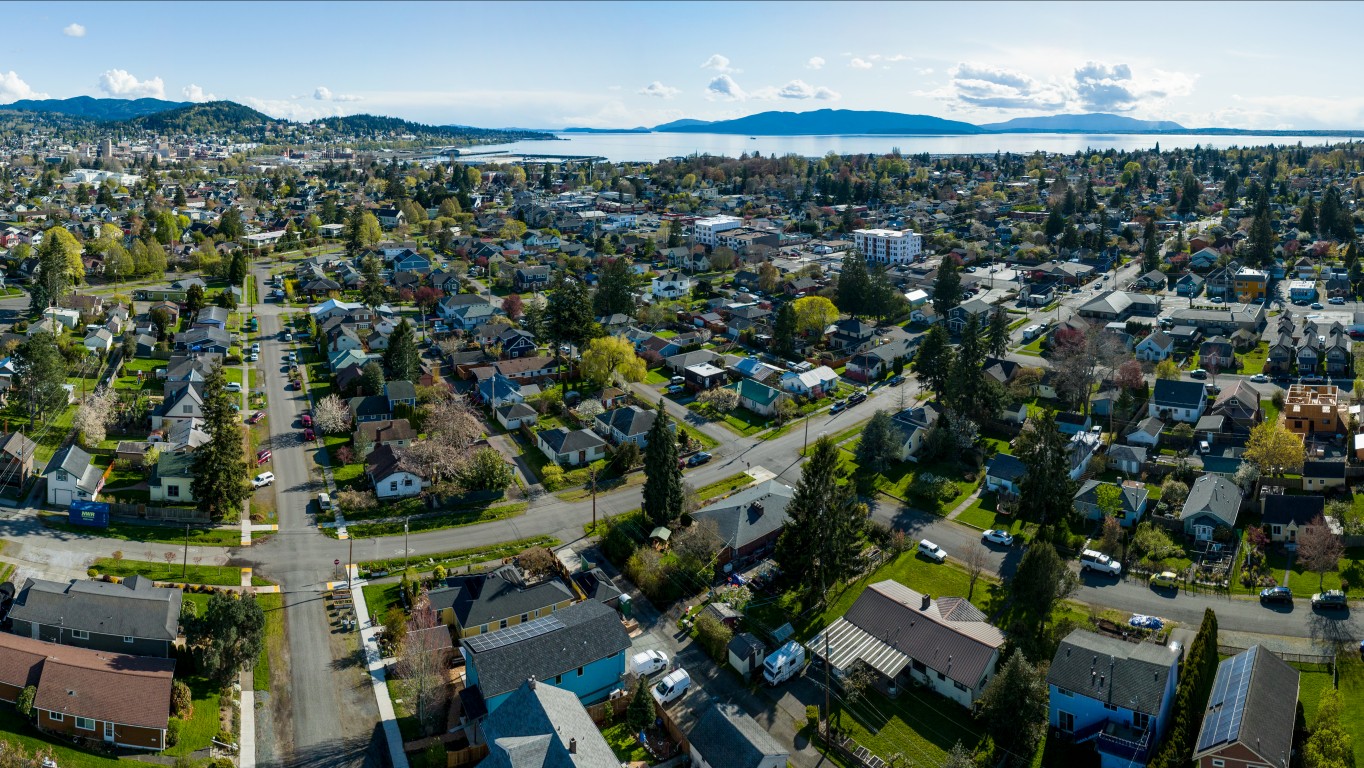
- Median annual rent as a share of household income: 26.9% (21.3% statewide)
- Gross median monthly rent: $1,478 ($1,682 statewide)
- Median household income: $65,821 ($94,952 statewide)
- Renters paying $3,000 or more per month: 4.6% (8.1% statewide)
- Renters paying less than $1,000 per month: 15.2% (16.8% statewide)
- Rental vacancy rate: 3.7% (4.3% statewide)
- Cities considered in state: 26
Wisconsin: Milwaukee

- Median annual rent as a share of household income: 23.9% (16.6% statewide)
- Gross median monthly rent: $1,033 ($1,045 statewide)
- Median household income: $51,888 ($75,670 statewide)
- Renters paying $3,000 or more per month: 1.1% (1.2% statewide)
- Renters paying less than $1,000 per month: 46.6% (45.8% statewide)
- Rental vacancy rate: 6.6% (4.7% statewide)
- Cities considered in state: 12
Wyoming: Casper
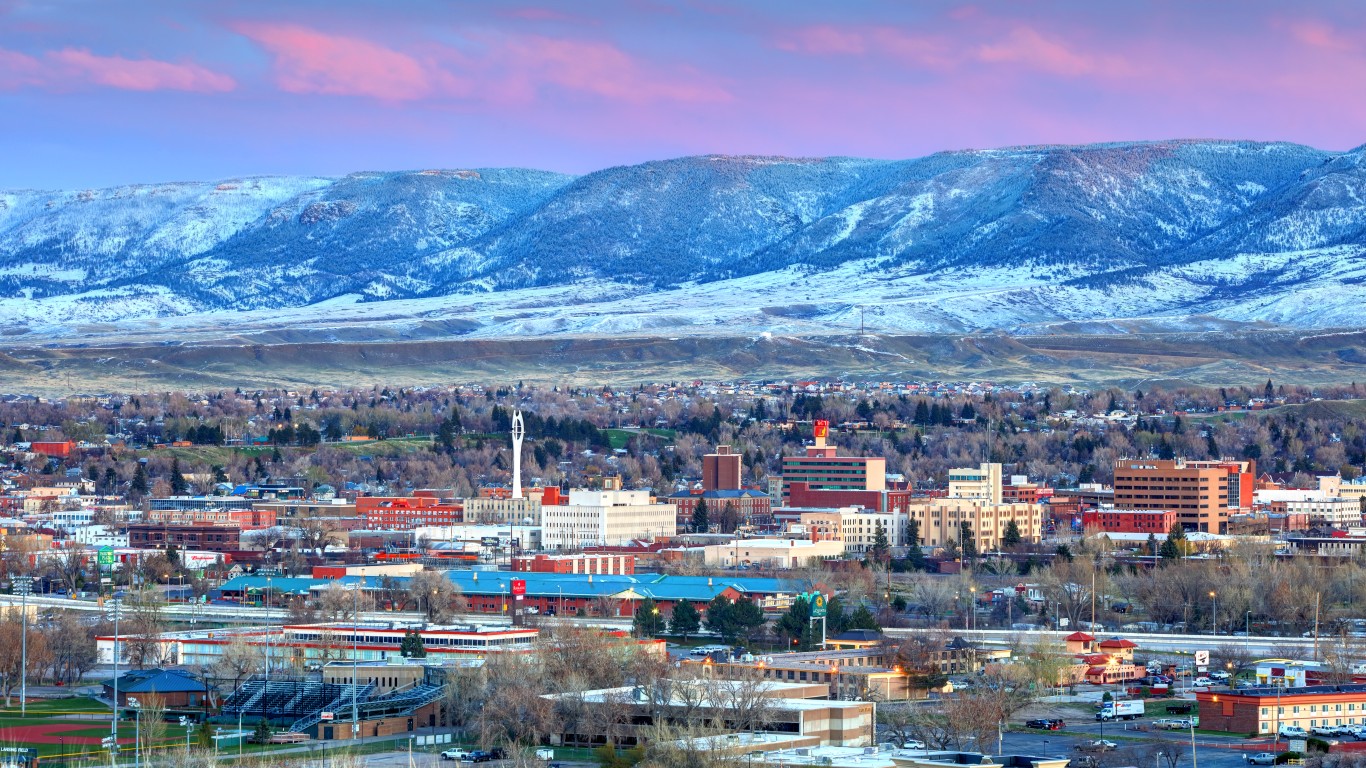
- Median annual rent as a share of household income: 16.7% (15.5% statewide)
- Gross median monthly rent: $964 ($968 statewide)
- Median household income: $69,171 ($74,815 statewide)
- Renters paying $3,000 or more per month: 1.2% (1.5% statewide)
- Renters paying less than $1,000 per month: 53.9% (53.2% statewide)
- Rental vacancy rate: 7.2% (7.9% statewide)
- Cities considered in state: 2
The post These Unaffordable Cities Are Gobbling Up Renters’ Income Like No Other appeared first on 24/7 Wall St..