These States Consistently Fail Black Communities
Diversity, equity, and inclusion (DEI) initiatives have played an important role in combating racial and gendered inequities across the United States. As reported by the Milwaukee Independent, DEI measures helped Black Americans by addressing disparities in the workplace, such as underrepresentation in hiring or promotion. However, DEI is under attack under the Trump administration. Trump […] The post These States Consistently Fail Black Communities appeared first on 24/7 Wall St..

Diversity, equity, and inclusion (DEI) initiatives have played an important role in combating racial and gendered inequities across the United States. As reported by the Milwaukee Independent, DEI measures helped Black Americans by addressing disparities in the workplace, such as underrepresentation in hiring or promotion. However, DEI is under attack under the Trump administration. Trump and his allies have referred to DEI as reverse racism, arguing that it discounts White applicants or employees and their needs. DEI rollbacks have been in effect, with Trump’s team saying that hiring should be on merit — missing the fact that DEI initiatives were made, in the first place, to ensure candidates were hired on merit rather than being racially discriminated against. Unfortunately, this embodies the historical conflict that has defined America for ages: unfair standards and prejudice that prevent Black people from achieving the same rights and opportunities as White individuals. This begins in education and expands outward, into healthcare, employment, and even homeownership. Some states in America are trying to overcome these gaps. Others? Not so much. (Black Americans should avoid moving to this city.)
To determine the worst states for Black Americans, 24/7 Wall St. created an index consisting of eight measures to assess race-based gaps in socioeconomic outcomes. Six measures – median household income, poverty, adult high school and bachelor’s degree attainment, homeownership, and unemployment rates – are based on five-year estimates from the U.S. Census Bureau’s 2022 American Community. The seventh measure, prisoners under the jurisdiction of state or federal correctional authorities by race per 100,000 residents, is based on 2021 Bureau of Justice Statistics data. The eighth measure, age-adjusted mortality rate by race, is based on data from 2018 to 2020 from the Centers for Disease Control and Prevention. The index does not rank conditions of Black Americans alone by state, but rather the gaps compared to white state residents. The index was standardized using min-max normalization. Data on population by race came from the ACS. The findings are stark. Nationwide, Black households earn just 63.6% of white households. Black Americans are more than twice as likely to live below the poverty line or be unemployed as white Americans and are nearly five times as likely to be incarcerated. Many of the lowest ranking states on the list are in the Midwest, where millions of Black Americans moved during the Great Migration of the early 20th century. But redlining — a discriminatory practice of designating neighborhoods as high risk because of race, thus denying residents loans — created segregated neighborhoods, enforcing racial disparity.
Why This Matters

Despite significant strides and continued efforts to address racial inequality, disparities remain pervasive across the United States. Unfortunately, this may not improve with the onset of Donald Trump’s presidency. Improving racial inequities and creating a more equal playing field requires changing deeply rooted views and practices. Increased awareness of the issues and knowledge of the data can serve individuals and decision makers alike.
Here are the worst states for Black Americans, ranked:
50. Hawaii

- Median household income: $80,207 (Black); $93,896 (white)
- Homeownership rate: 28.2% (Black); 57.7% (white)
- Unemployment rate: 12.2% (Black); 5.6% (white)
- Black population: 26,664 (1.8% of total)
49. New Mexico

- Median household income: $48,987 (Black); $63,910 (white)
- Homeownership rate: 37.8% (Black); 70.3% (white)
- Unemployment rate: 9.0% (Black); 6.0% (white)
- Black population: 37,996 (1.8% of total)
48. Texas

- Median household income: $55,459 (Black); $80,134 (white)
- Homeownership rate: 41.3% (Black); 67.7% (white)
- Unemployment rate: 8.4% (Black); 4.6% (white)
- Black population: 3,449,557 (11.8% of total)
47. Alaska
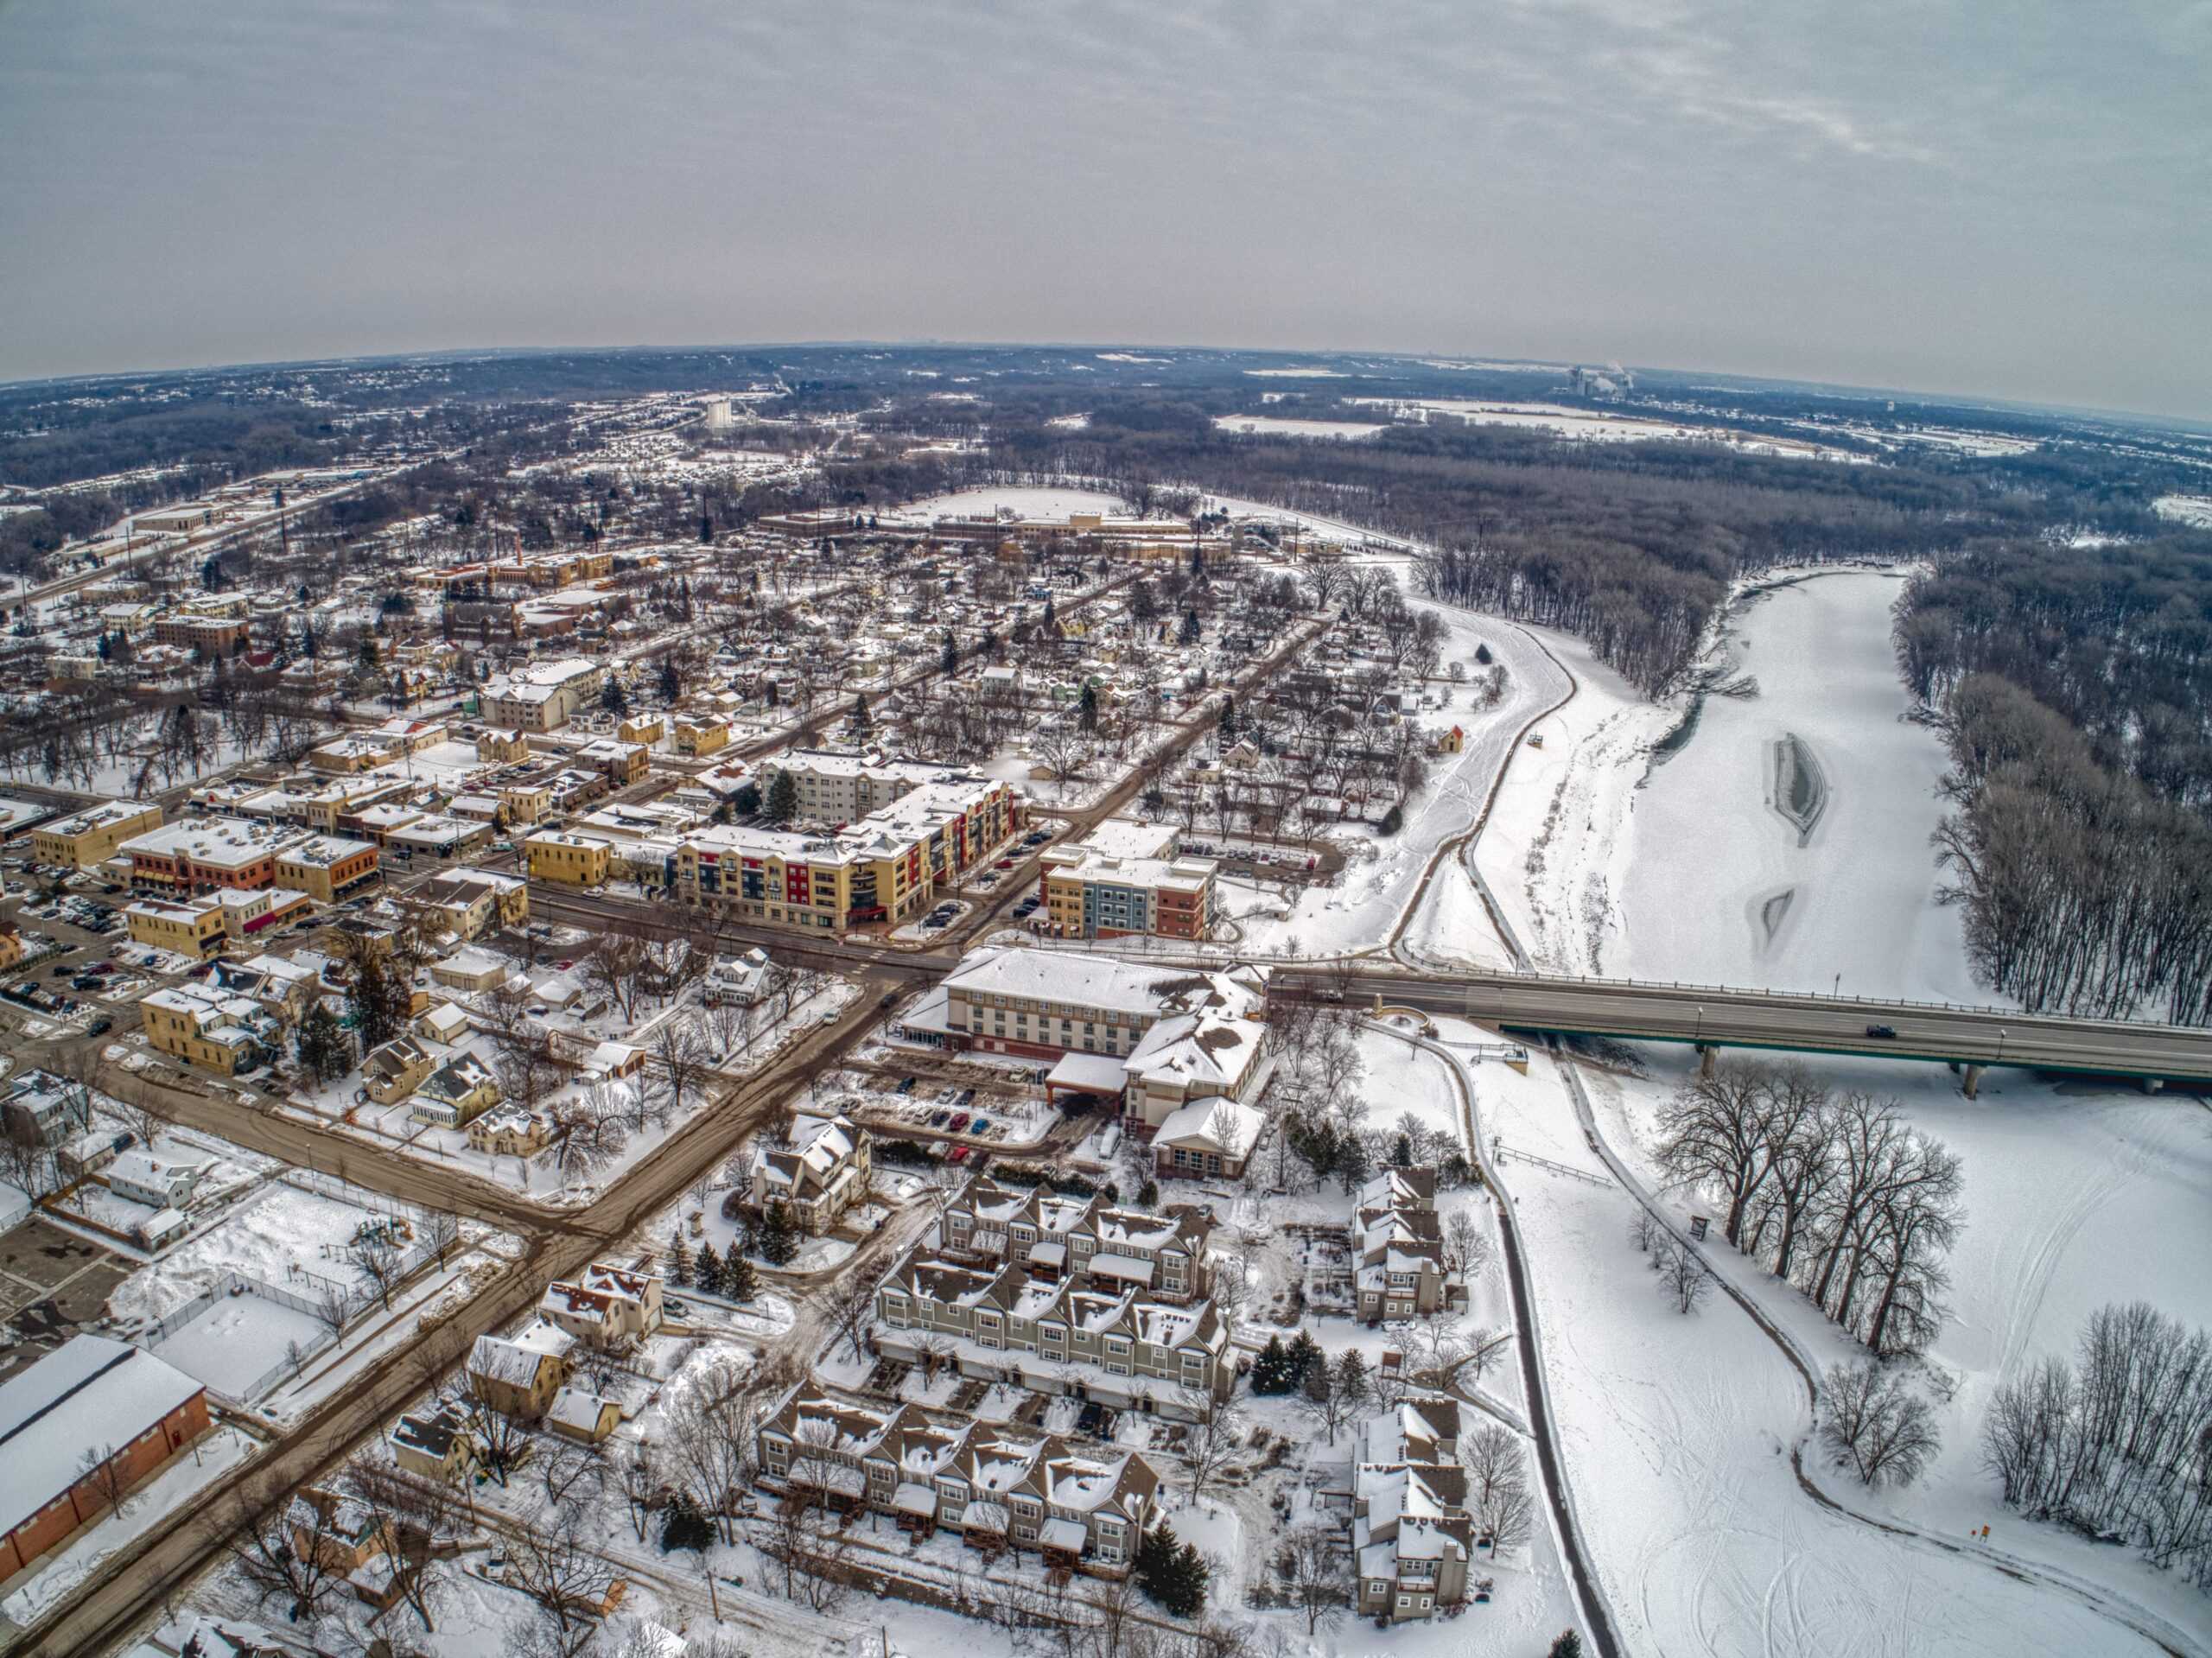
- Median household income: $71,857 (Black); $94,315 (white)
- Homeownership rate: 40.9% (Black); 70.7% (white)
- Unemployment rate: 4.6% (Black); 5.1% (white)
- Black population: 22,400 (3.0% of total)
46. Arizona

- Median household income: $58,184 (Black); $75,939 (white)
- Homeownership rate: 38.4% (Black); 70.3% (white)
- Unemployment rate: 8.3% (Black); 5.0% (white)
- Black population: 307,726 (4.3% of total)
45. West Virginia

- Median household income: $38,004 (Black); $55,826 (white)
- Homeownership rate: 44.5% (Black); 75.8% (white)
- Unemployment rate: 9.8% (Black); 6.2% (white)
- Black population: 60,237 (3.4% of total)
44. Kentucky

- Median household income: $44,196 (Black); $62,242 (white)
- Homeownership rate: 37.9% (Black); 72.1% (white)
- Unemployment rate: 8.6% (Black); 4.9% (white)
- Black population: 355,368 (7.9% of total)
43. Georgia

- Median household income: $55,010 (Black); $81,445 (white)
- Homeownership rate: 49.0% (Black); 74.7% (white)
- Unemployment rate: 8.2% (Black); 4.1% (white)
- Black population: 3,334,095 (31.1% of total)
42. Idaho

- Median household income: $54,727 (Black); $71,661 (white)
- Homeownership rate: 36.9% (Black); 73.7% (white)
- Unemployment rate: 6.7% (Black); 3.9% (white)
- Black population: 11,919 (0.6% of total)
41. Oregon

- Median household income: $56,124 (Black); $77,627 (white)
- Homeownership rate: 33.9% (Black); 65.8% (white)
- Unemployment rate: 6.7% (Black); 5.5% (white)
- Black population: 75,790 (1.8% of total)
40. Maryland
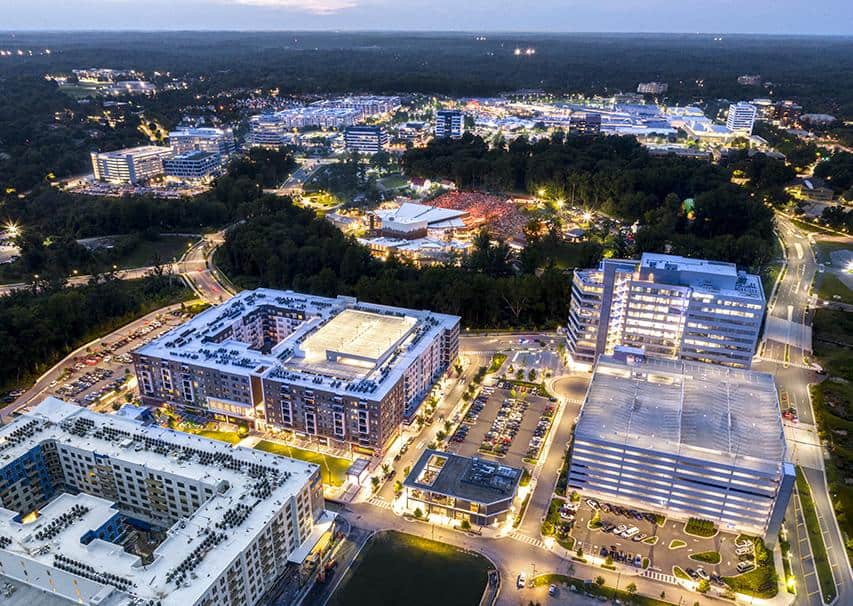
- Median household income: $79,161 (Black); $109,387 (white)
- Homeownership rate: 52.5% (Black); 76.9% (white)
- Unemployment rate: 7.8% (Black); 4.0% (white)
- Black population: 1,815,877 (29.5% of total)
39. Delaware

- Median household income: $58,385 (Black); $86,094 (white)
- Homeownership rate: 51.5% (Black); 80.1% (white)
- Unemployment rate: 8.0% (Black); 4.9% (white)
- Black population: 213,516 (21.5% of total)
38. Wyoming

- Median household income: $56,046 (Black); $73,542 (white)
- Homeownership rate: 38.2% (Black); 73.0% (white)
- Unemployment rate: 11.0% (Black); 3.8% (white)
- Black population: 4,488 (0.8% of total)
37. Tennessee

- Median household income: $46,708 (Black); $68,515 (white)
- Homeownership rate: 43.6% (Black); 73.1% (white)
- Unemployment rate: 9.4% (Black); 4.4% (white)
- Black population: 1,116,871 (16.1% of total)
36. Florida
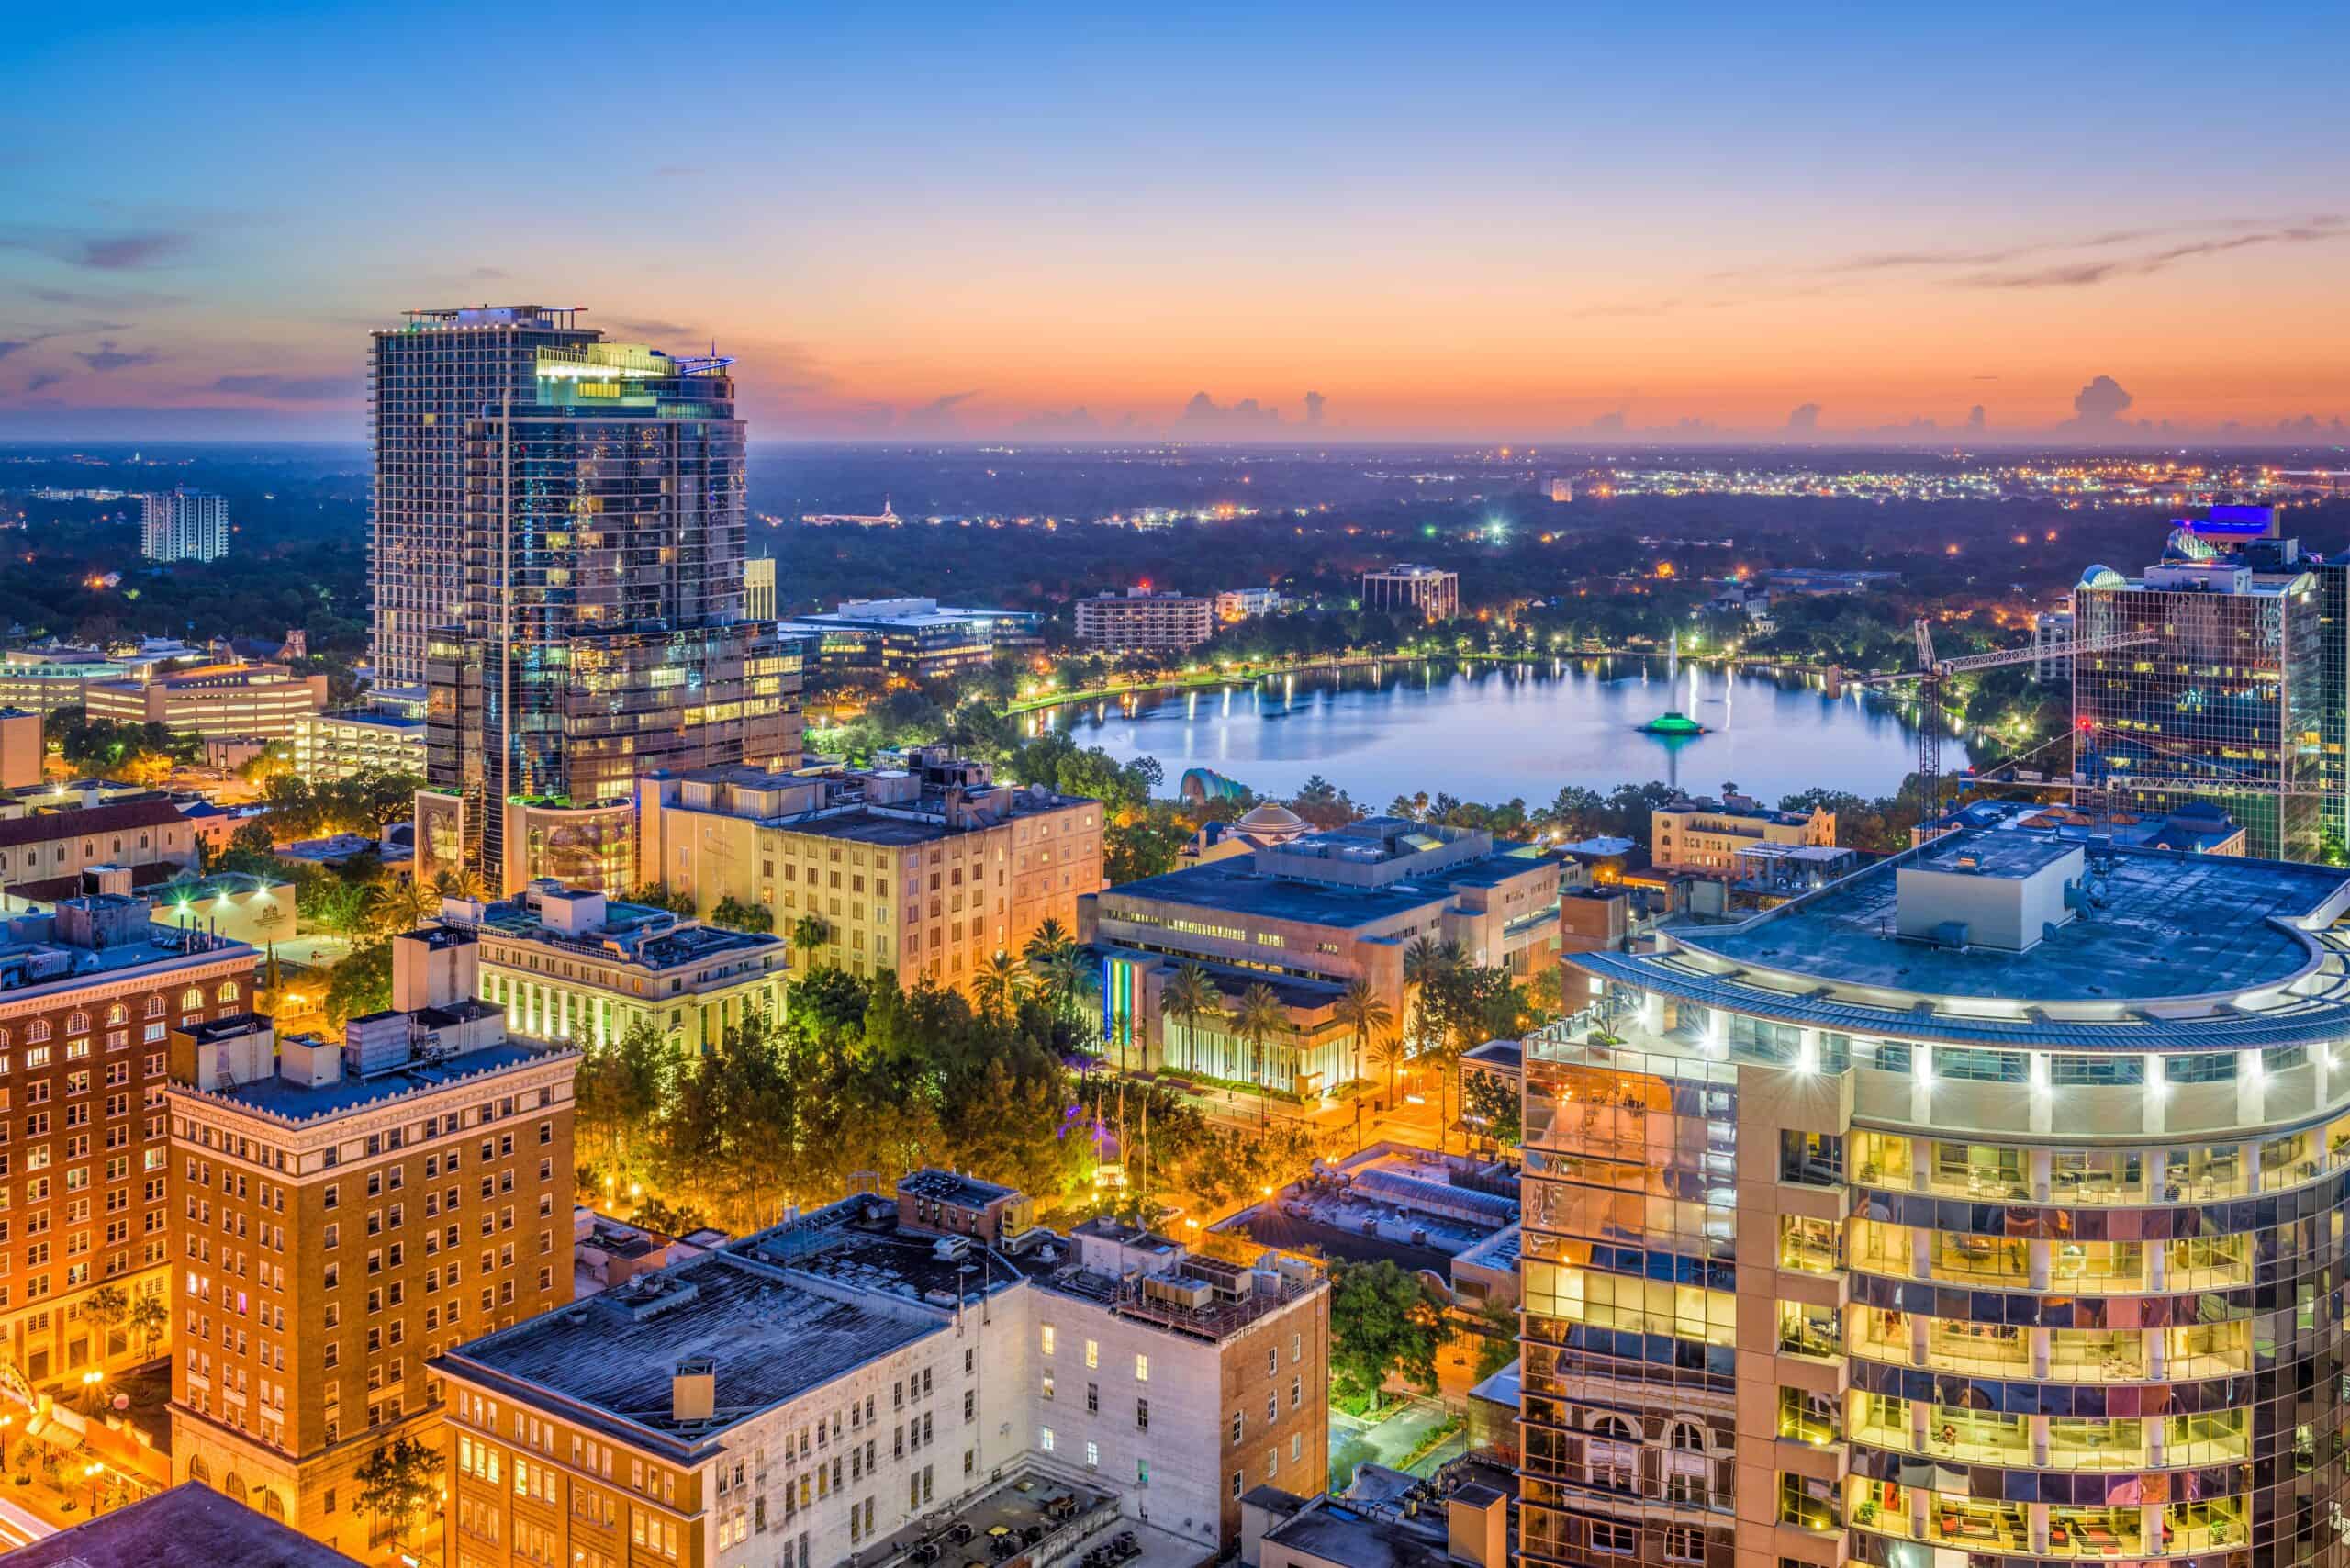
- Median household income: $51,249 (Black); $72,212 (white)
- Homeownership rate: 47.6% (Black); 72.9% (white)
- Unemployment rate: 8.1% (Black); 4.6% (white)
- Black population: 3,232,871 (14.9% of total)
35. New Hampshire

- Median household income: $72,946 (Black); $91,394 (white)
- Homeownership rate: 36.2% (Black); 74.0% (white)
- Unemployment rate: 7.6% (Black); 3.7% (white)
- Black population: 18,477 (1.3% of total)
34. Washington

- Median household income: $65,817 (Black); $91,601 (white)
- Homeownership rate: 34.0% (Black); 67.6% (white)
- Unemployment rate: 8.1% (Black); 4.8% (white)
- Black population: 290,907 (3.8% of total)
33. Rhode Island
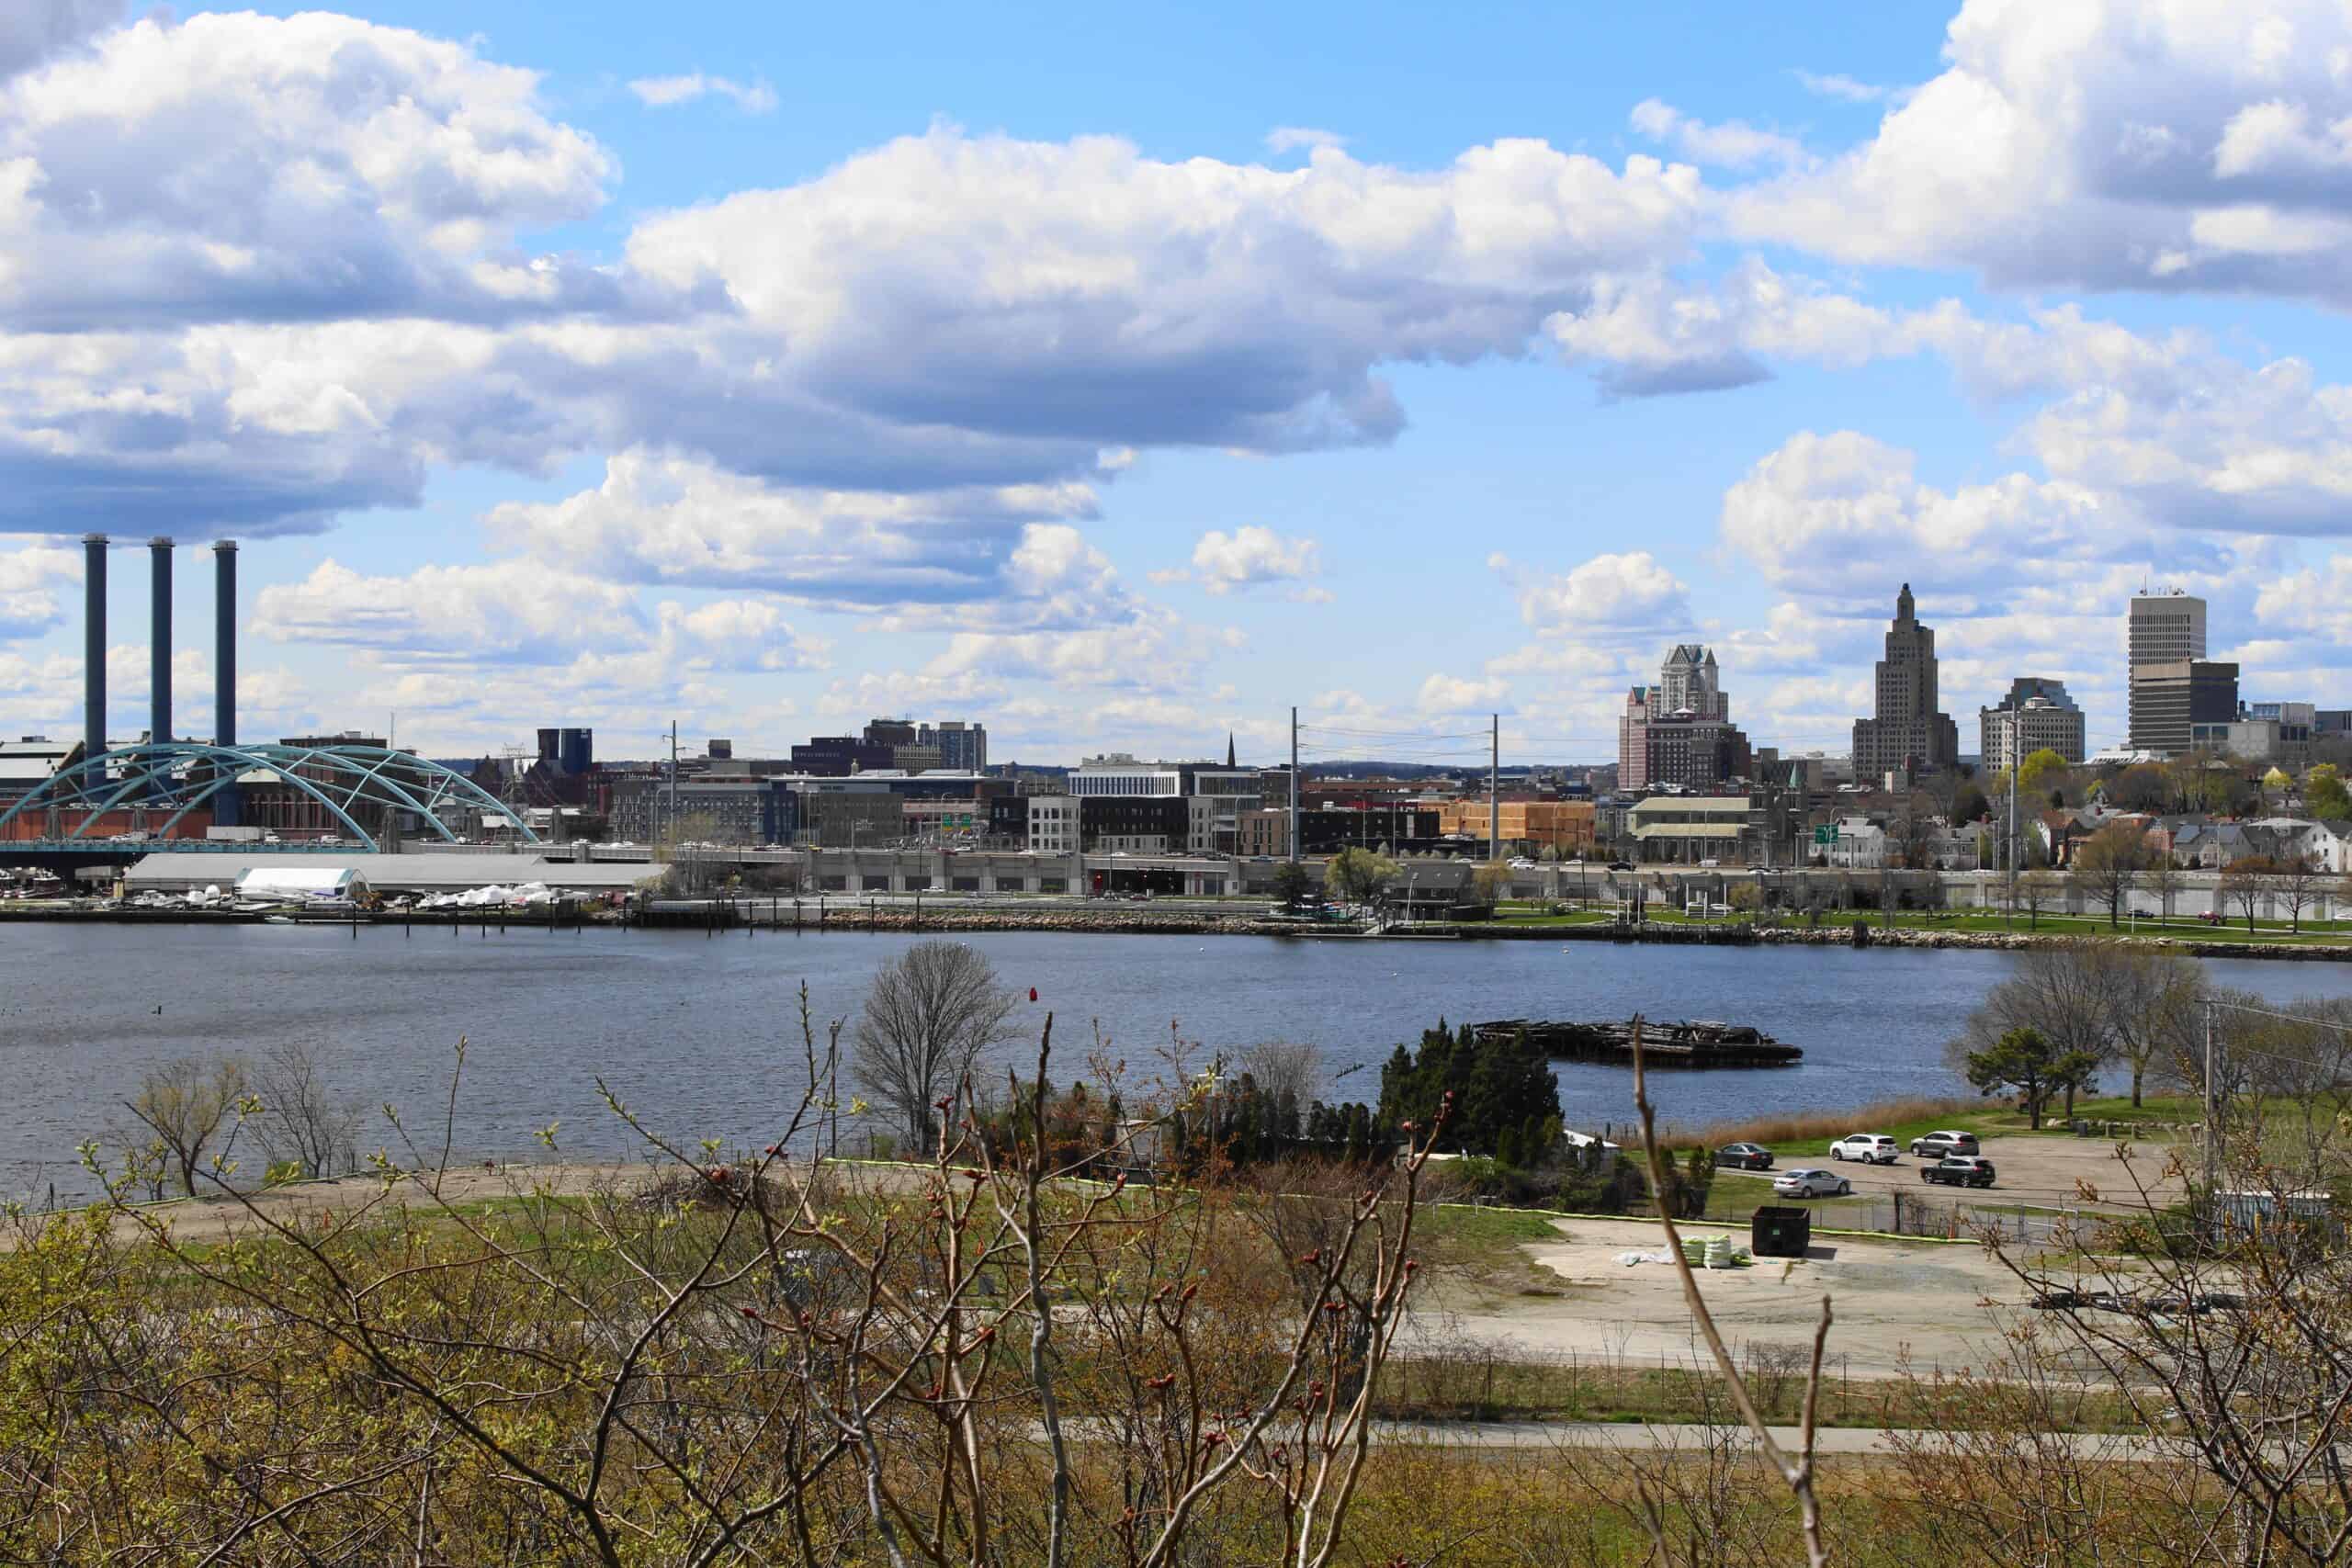
- Median household income: $61,614 (Black); $86,467 (white)
- Homeownership rate: 35.1% (Black); 68.3% (white)
- Unemployment rate: 8.2% (Black); 5.3% (white)
- Black population: 58,304 (5.3% of total)
32. Oklahoma

- Median household income: $42,145 (Black); $65,469 (white)
- Homeownership rate: 39.8% (Black); 70.1% (white)
- Unemployment rate: 8.9% (Black); 4.4% (white)
- Black population: 277,702 (7.0% of total)
31. North Carolina

- Median household income: $47,088 (Black); $73,675 (white)
- Homeownership rate: 46.3% (Black); 73.7% (white)
- Unemployment rate: 8.3% (Black); 4.3% (white)
- Black population: 2,161,841 (20.6% of total)
30. Virginia

- Median household income: $60,201 (Black); $93,691 (white)
- Homeownership rate: 48.6% (Black); 73.1% (white)
- Unemployment rate: 7.2% (Black); 3.8% (white)
- Black population: 1,601,668 (18.6% of total)
29. South Dakota
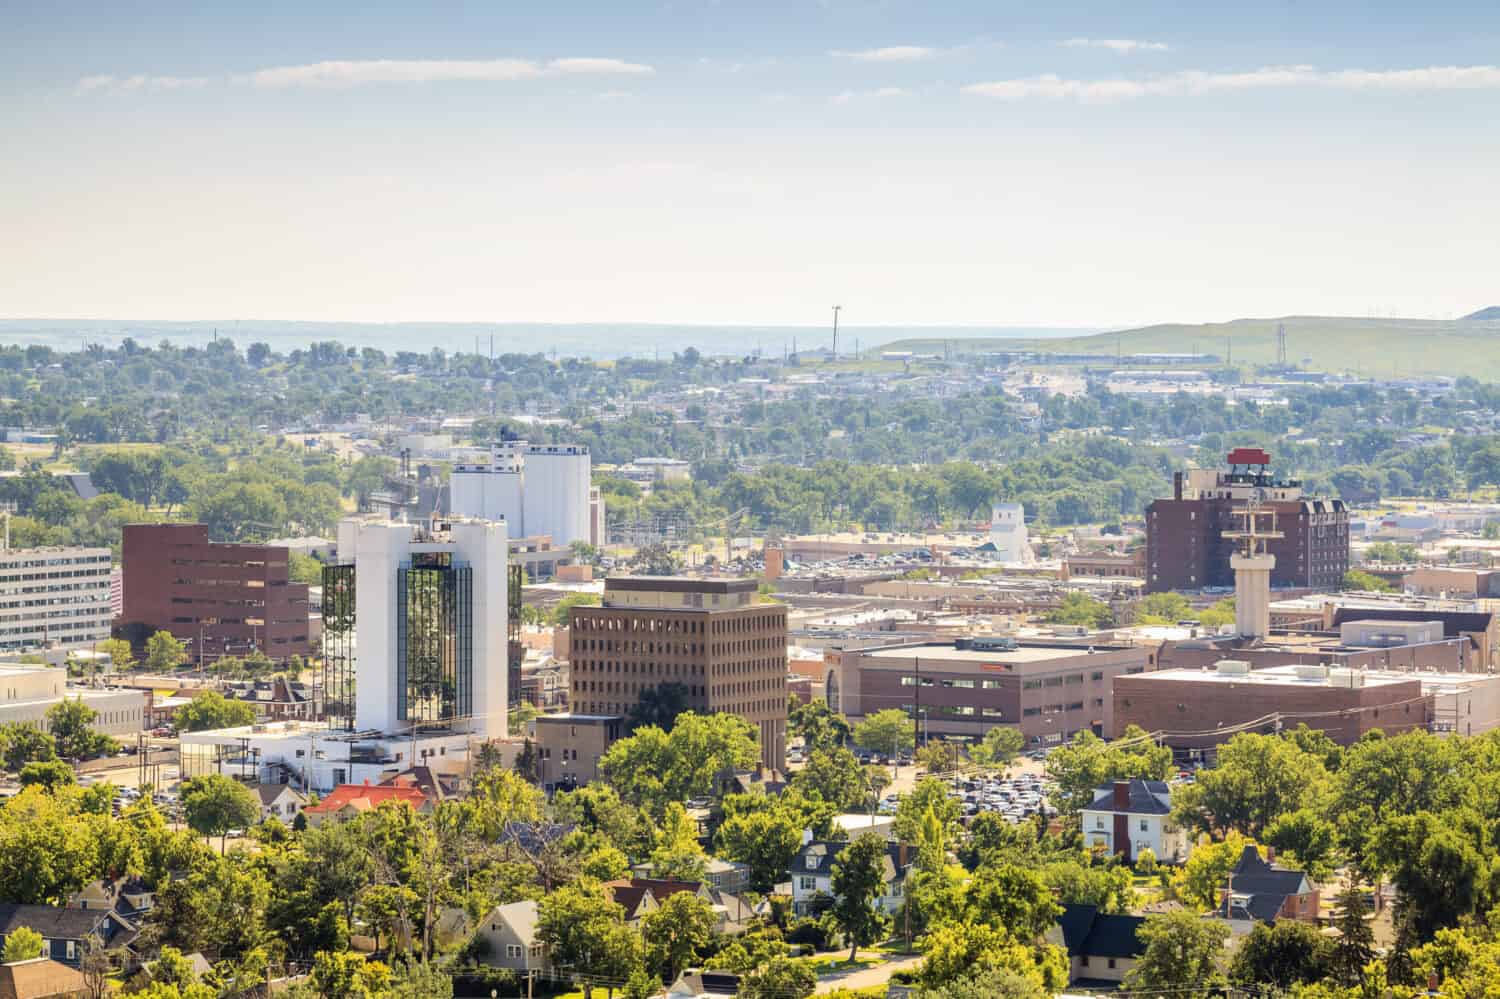
- Median household income: $56,399 (Black); $72,498 (white)
- Homeownership rate: 25.6% (Black); 72.2% (white)
- Unemployment rate: 3.4% (Black); 2.3% (white)
- Black population: 19,172 (2.2% of total)
28. Alabama
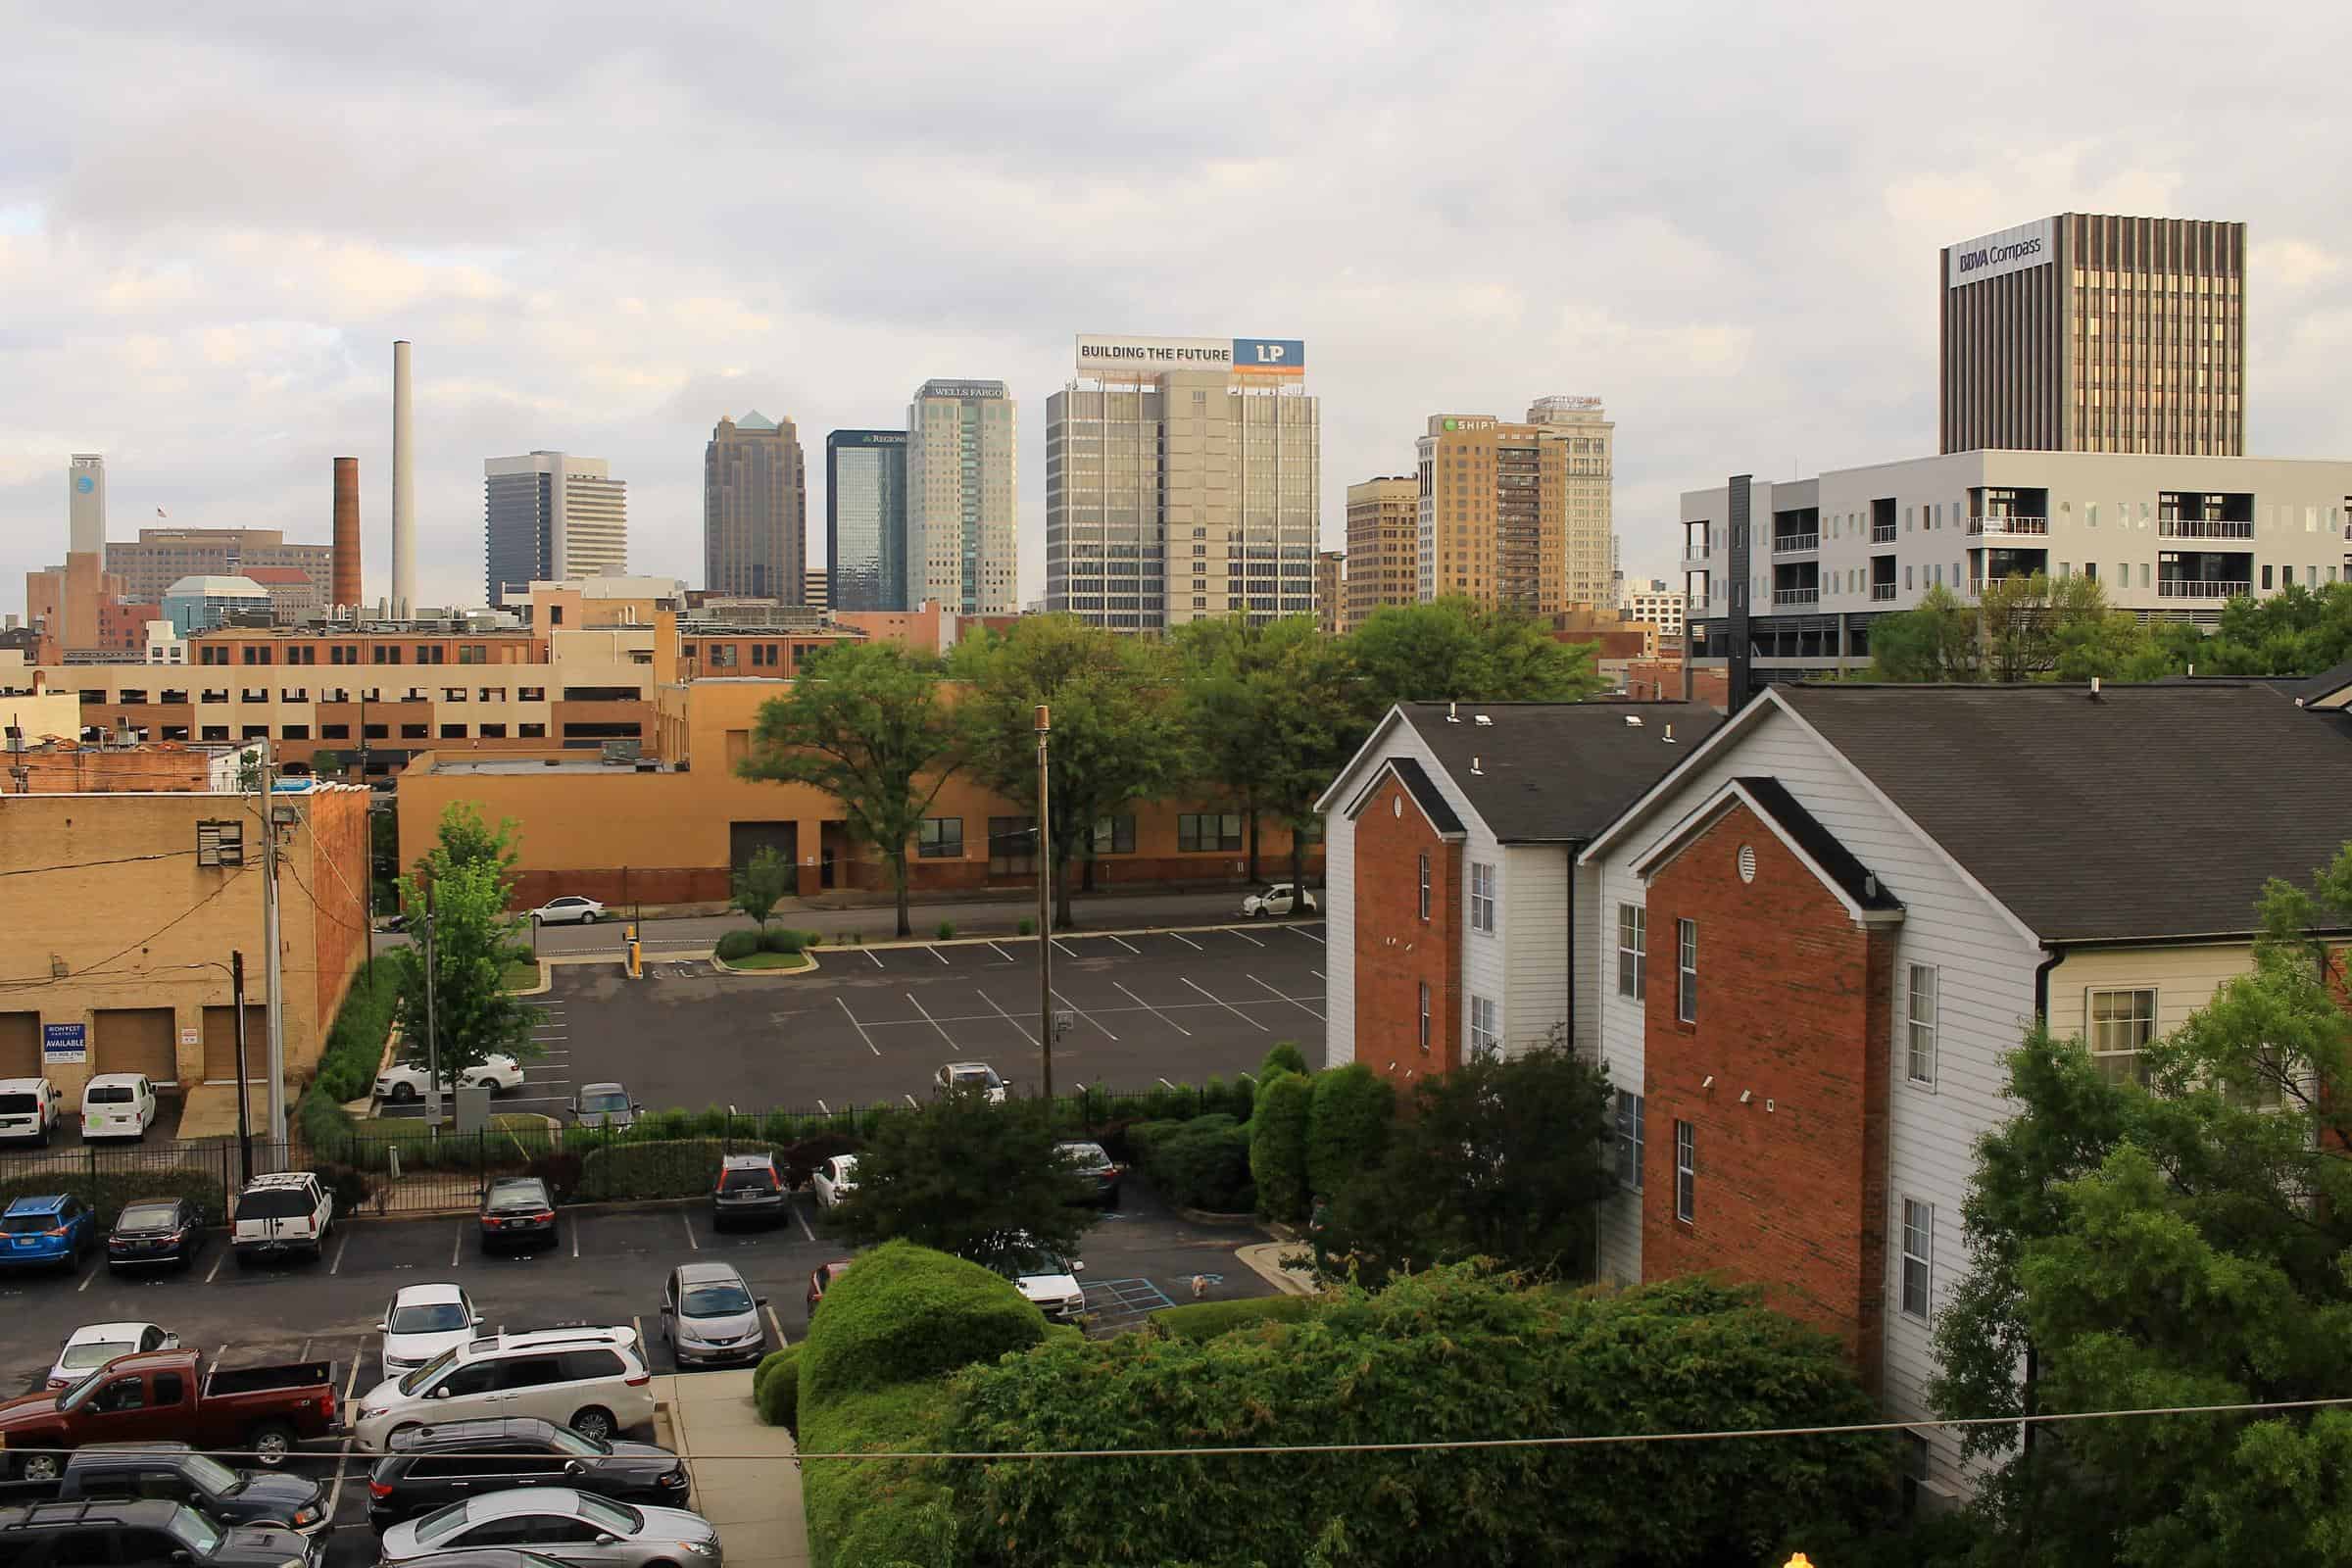
- Median household income: $40,661 (Black); $69,042 (white)
- Homeownership rate: 51.3% (Black); 77.4% (white)
- Unemployment rate: 8.9% (Black); 4.1% (white)
- Black population: 1,318,388 (26.2% of total)
27. California
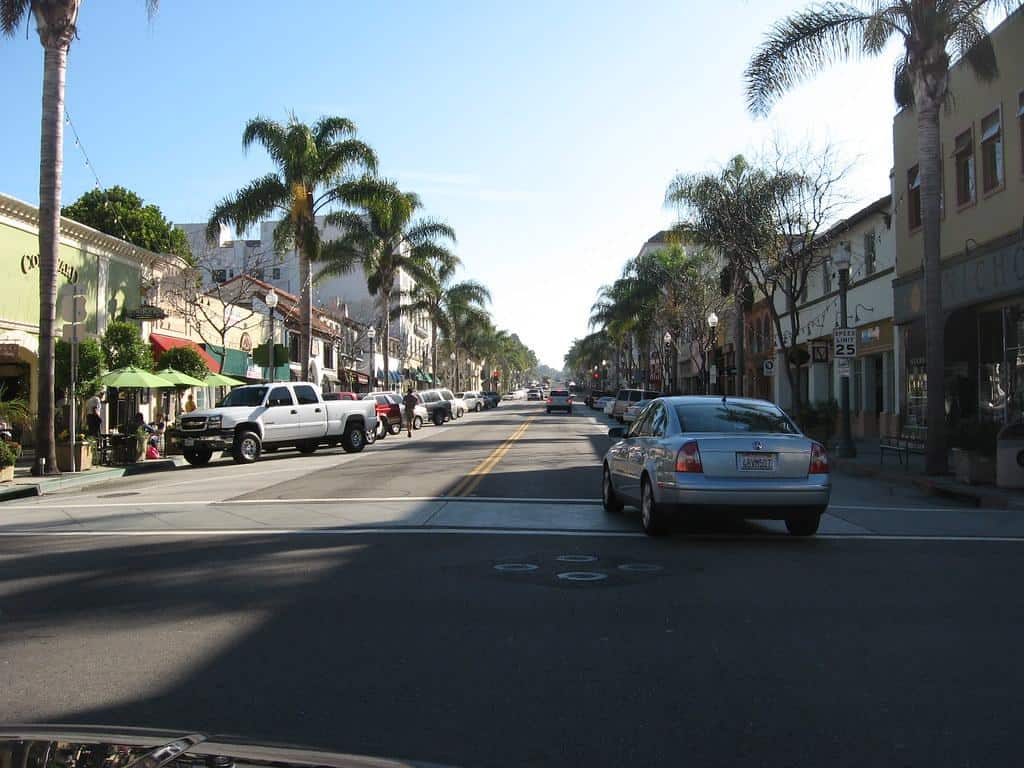
- Median household income: $64,513 (Black); $97,859 (white)
- Homeownership rate: 35.6% (Black); 60.7% (white)
- Unemployment rate: 10.5% (Black); 6.0% (white)
- Black population: 2,102,510 (5.3% of total)
26. Arkansas

- Median household income: $37,395 (Black); $60,756 (white)
- Homeownership rate: 44.2% (Black); 71.9% (white)
- Unemployment rate: 9.4% (Black); 4.5% (white)
- Black population: 454,728 (15.1% of total)
25. Nevada

- Median household income: $48,022 (Black); $77,786 (white)
- Homeownership rate: 31.6% (Black); 64.4% (white)
- Unemployment rate: 12.5% (Black); 6.2% (white)
- Black population: 278,689 (9.0% of total)
24. Vermont

- Median household income: $52,736 (Black); $74,499 (white)
- Homeownership rate: 27.7% (Black); 74.0% (white)
- Unemployment rate: 6.4% (Black); 3.8% (white)
- Black population: 7,548 (1.2% of total)
23. Maine

- Median household income: $53,407 (Black); $68,783 (white)
- Homeownership rate: 25.9% (Black); 74.4% (white)
- Unemployment rate: 5.6% (Black); 4.2% (white)
- Black population: 21,093 (1.5% of total)
22. Colorado

- Median household income: $61,343 (Black); $91,475 (white)
- Homeownership rate: 41.8% (Black); 69.1% (white)
- Unemployment rate: 7.8% (Black); 4.2% (white)
- Black population: 221,211 (3.8% of total)
21. Missouri

- Median household income: $44,293 (Black); $69,547 (white)
- Homeownership rate: 39.3% (Black); 72.4% (white)
- Unemployment rate: 8.2% (Black); 3.9% (white)
- Black population: 688,219 (11.2% of total)
20. Mississippi

- Median household income: $36,263 (Black); $65,518 (white)
- Homeownership rate: 54.4% (Black); 78.7% (white)
- Unemployment rate: 10.0% (Black); 4.9% (white)
- Black population: 1,098,675 (37.1% of total)
19. South Carolina

- Median household income: $42,672 (Black); $73,204 (white)
- Homeownership rate: 53.5% (Black); 78.4% (white)
- Unemployment rate: 7.9% (Black); 4.3% (white)
- Black population: 1,316,074 (25.6% of total)
18. Massachusetts
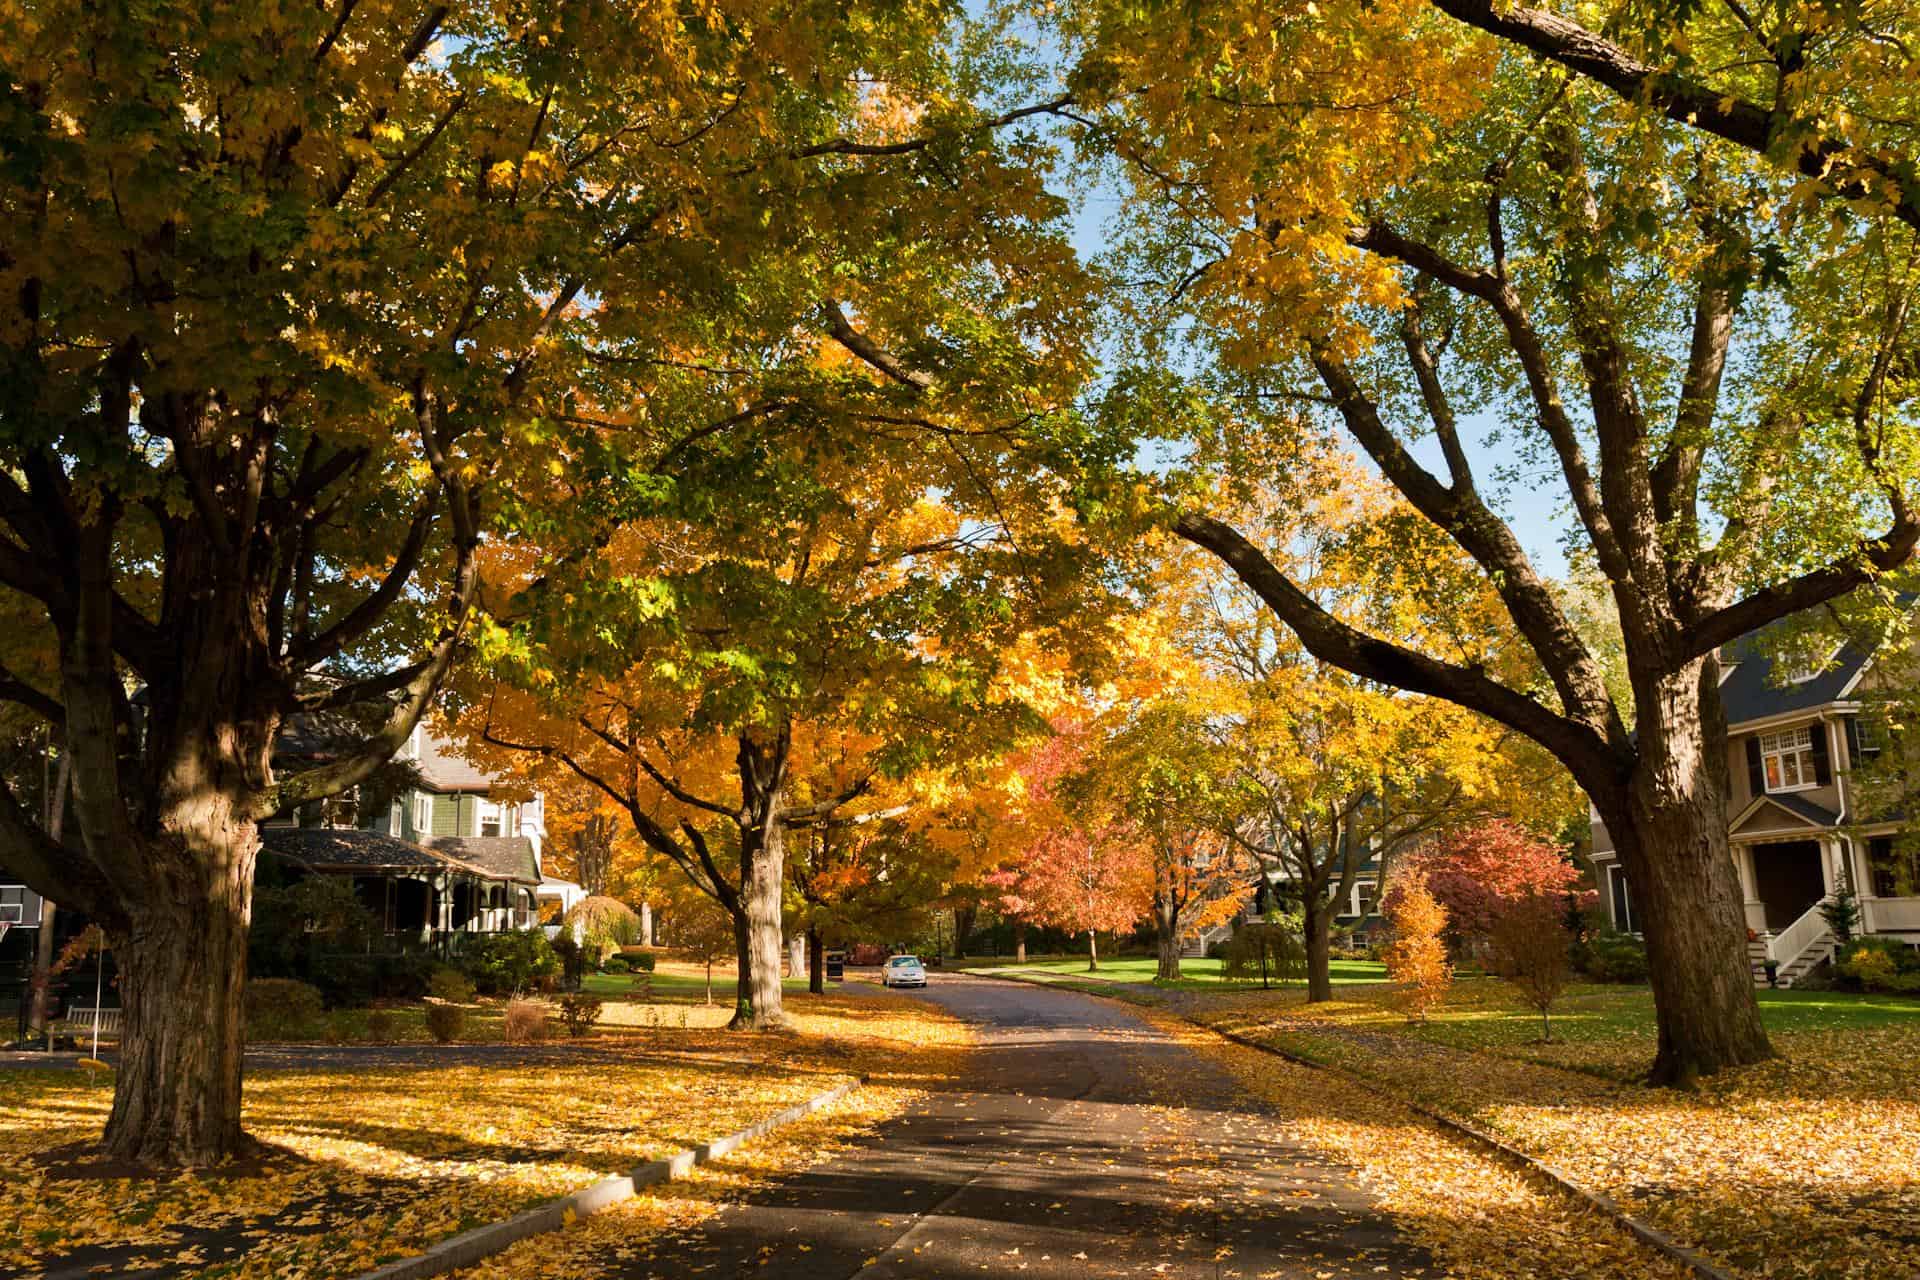
- Median household income: $67,044 (Black); $102,701 (white)
- Homeownership rate: 36.4% (Black); 68.5% (white)
- Unemployment rate: 8.4% (Black); 4.7% (white)
- Black population: 459,848 (6.6% of total)
17. Indiana

- Median household income: $42,067 (Black); $70,740 (white)
- Homeownership rate: 38.0% (Black); 74.9% (white)
- Unemployment rate: 9.9% (Black); 4.1% (white)
- Black population: 631,919 (9.3% of total)
16. Montana

- Median household income: $50,676 (Black); $68,005 (white)
- Homeownership rate: 27.4% (Black); 70.7% (white)
- Unemployment rate: 11.7% (Black); 3.3% (white)
- Black population: 5,248 (0.5% of total)
15. New York

- Median household income: $58,805 (Black); $90,866 (white)
- Homeownership rate: 32.7% (Black); 64.7% (white)
- Unemployment rate: 9.2% (Black); 5.0% (white)
- Black population: 2,767,223 (13.8% of total)
14. Louisiana
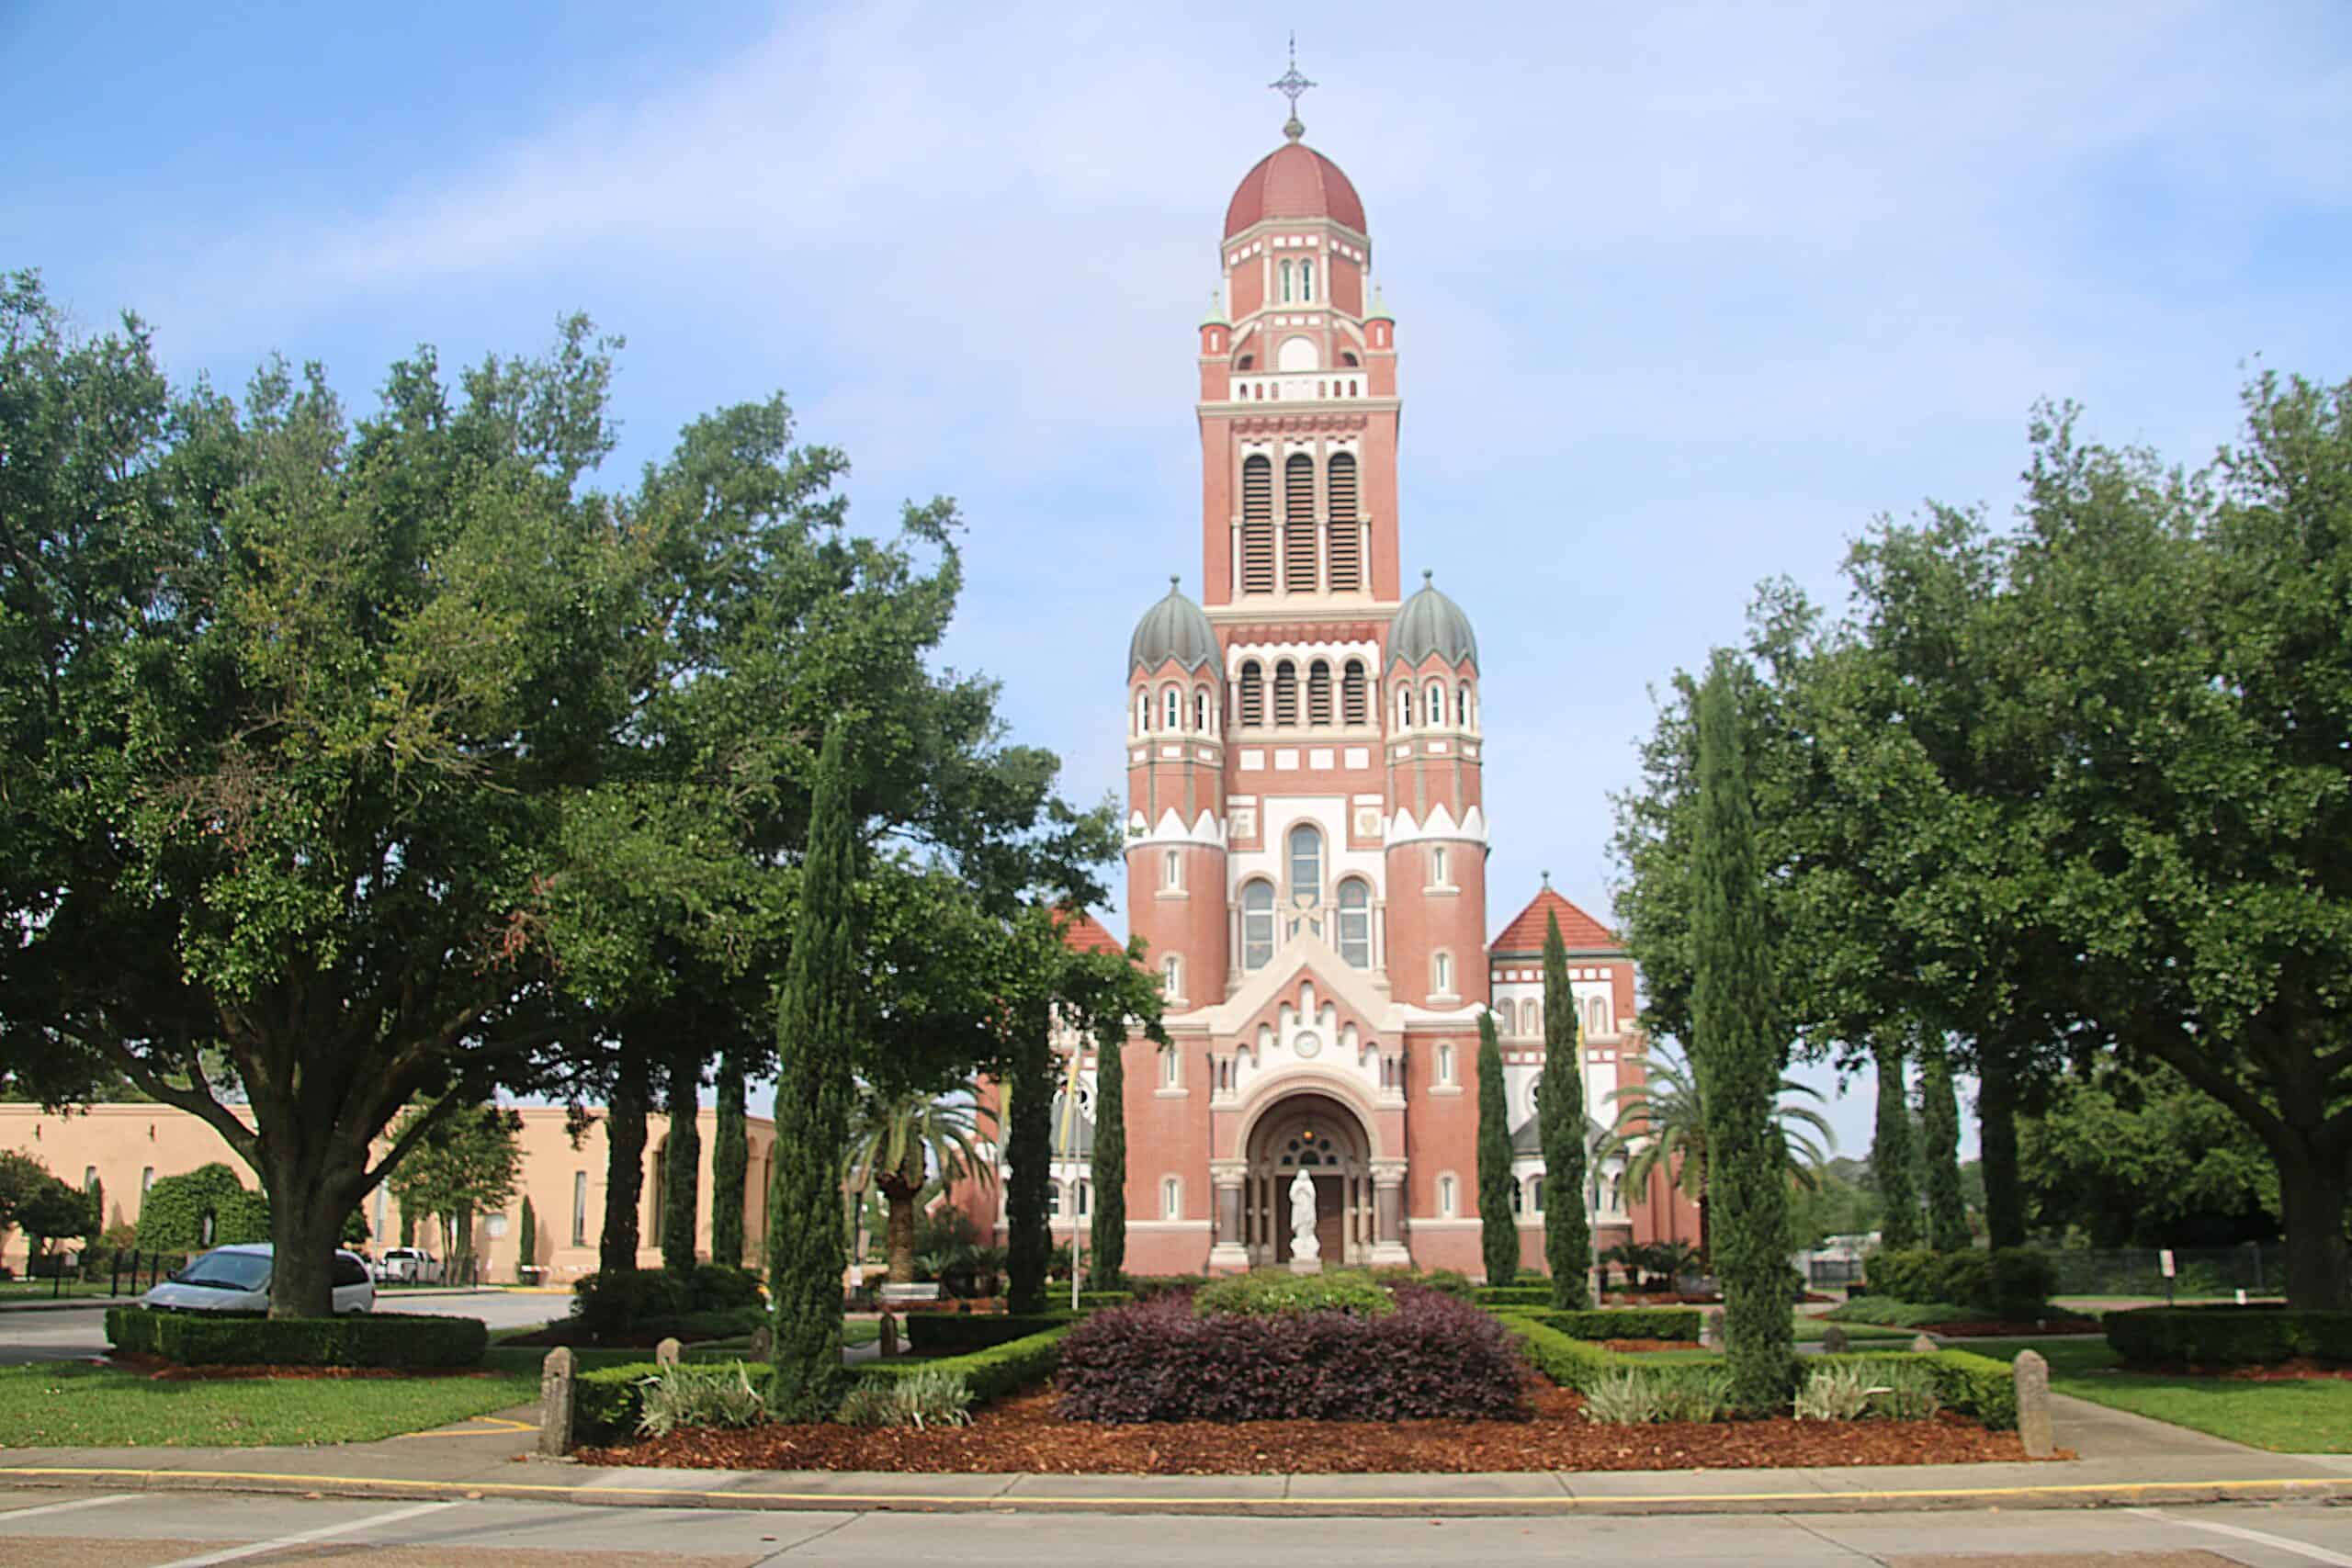
- Median household income: $37,015 (Black); $70,270 (white)
- Homeownership rate: 48.9% (Black); 76.9% (white)
- Unemployment rate: 10.4% (Black); 4.9% (white)
- Black population: 1,456,107 (31.4% of total)
13. North Dakota

- Median household income: $49,369 (Black); $77,950 (white)
- Homeownership rate: 11.7% (Black); 67.3% (white)
- Unemployment rate: 7.9% (Black); 2.6% (white)
- Black population: 24,882 (3.2% of total)
12. Utah

- Median household income: $57,433 (Black); $89,462 (white)
- Homeownership rate: 27.4% (Black); 73.2% (white)
- Unemployment rate: 5.8% (Black); 3.2% (white)
- Black population: 34,485 (1.1% of total)
11. Kansas

- Median household income: $46,145 (Black); $72,357 (white)
- Homeownership rate: 36.5% (Black); 70.2% (white)
- Unemployment rate: 9.1% (Black); 3.6% (white)
- Black population: 157,768 (5.4% of total)
10. Connecticut

- Median household income: $59,728 (Black); $98,855 (white)
- Homeownership rate: 40.7% (Black); 73.5% (white)
- Unemployment rate: 8.8% (Black); 5.2% (white)
- Black population: 355,970 (9.9% of total)
9. New Jersey

- Median household income: $65,351 (Black); $105,392 (white)
- Homeownership rate: 39.7% (Black); 73.3% (white)
- Unemployment rate: 9.2% (Black); 5.3% (white)
- Black population: 1,147,770 (12.4% of total)
8. Ohio

- Median household income: $40,499 (Black); $71,843 (white)
- Homeownership rate: 36.1% (Black); 72.7% (white)
- Unemployment rate: 10.6% (Black); 4.3% (white)
- Black population: 1,431,238 (12.2% of total)
7. Pennsylvania

- Median household income: $45,944 (Black); $77,962 (white)
- Homeownership rate: 43.4% (Black); 74.3% (white)
- Unemployment rate: 11.1% (Black); 4.6% (white)
- Black population: 1,347,784 (10.4% of total)
6. Michigan
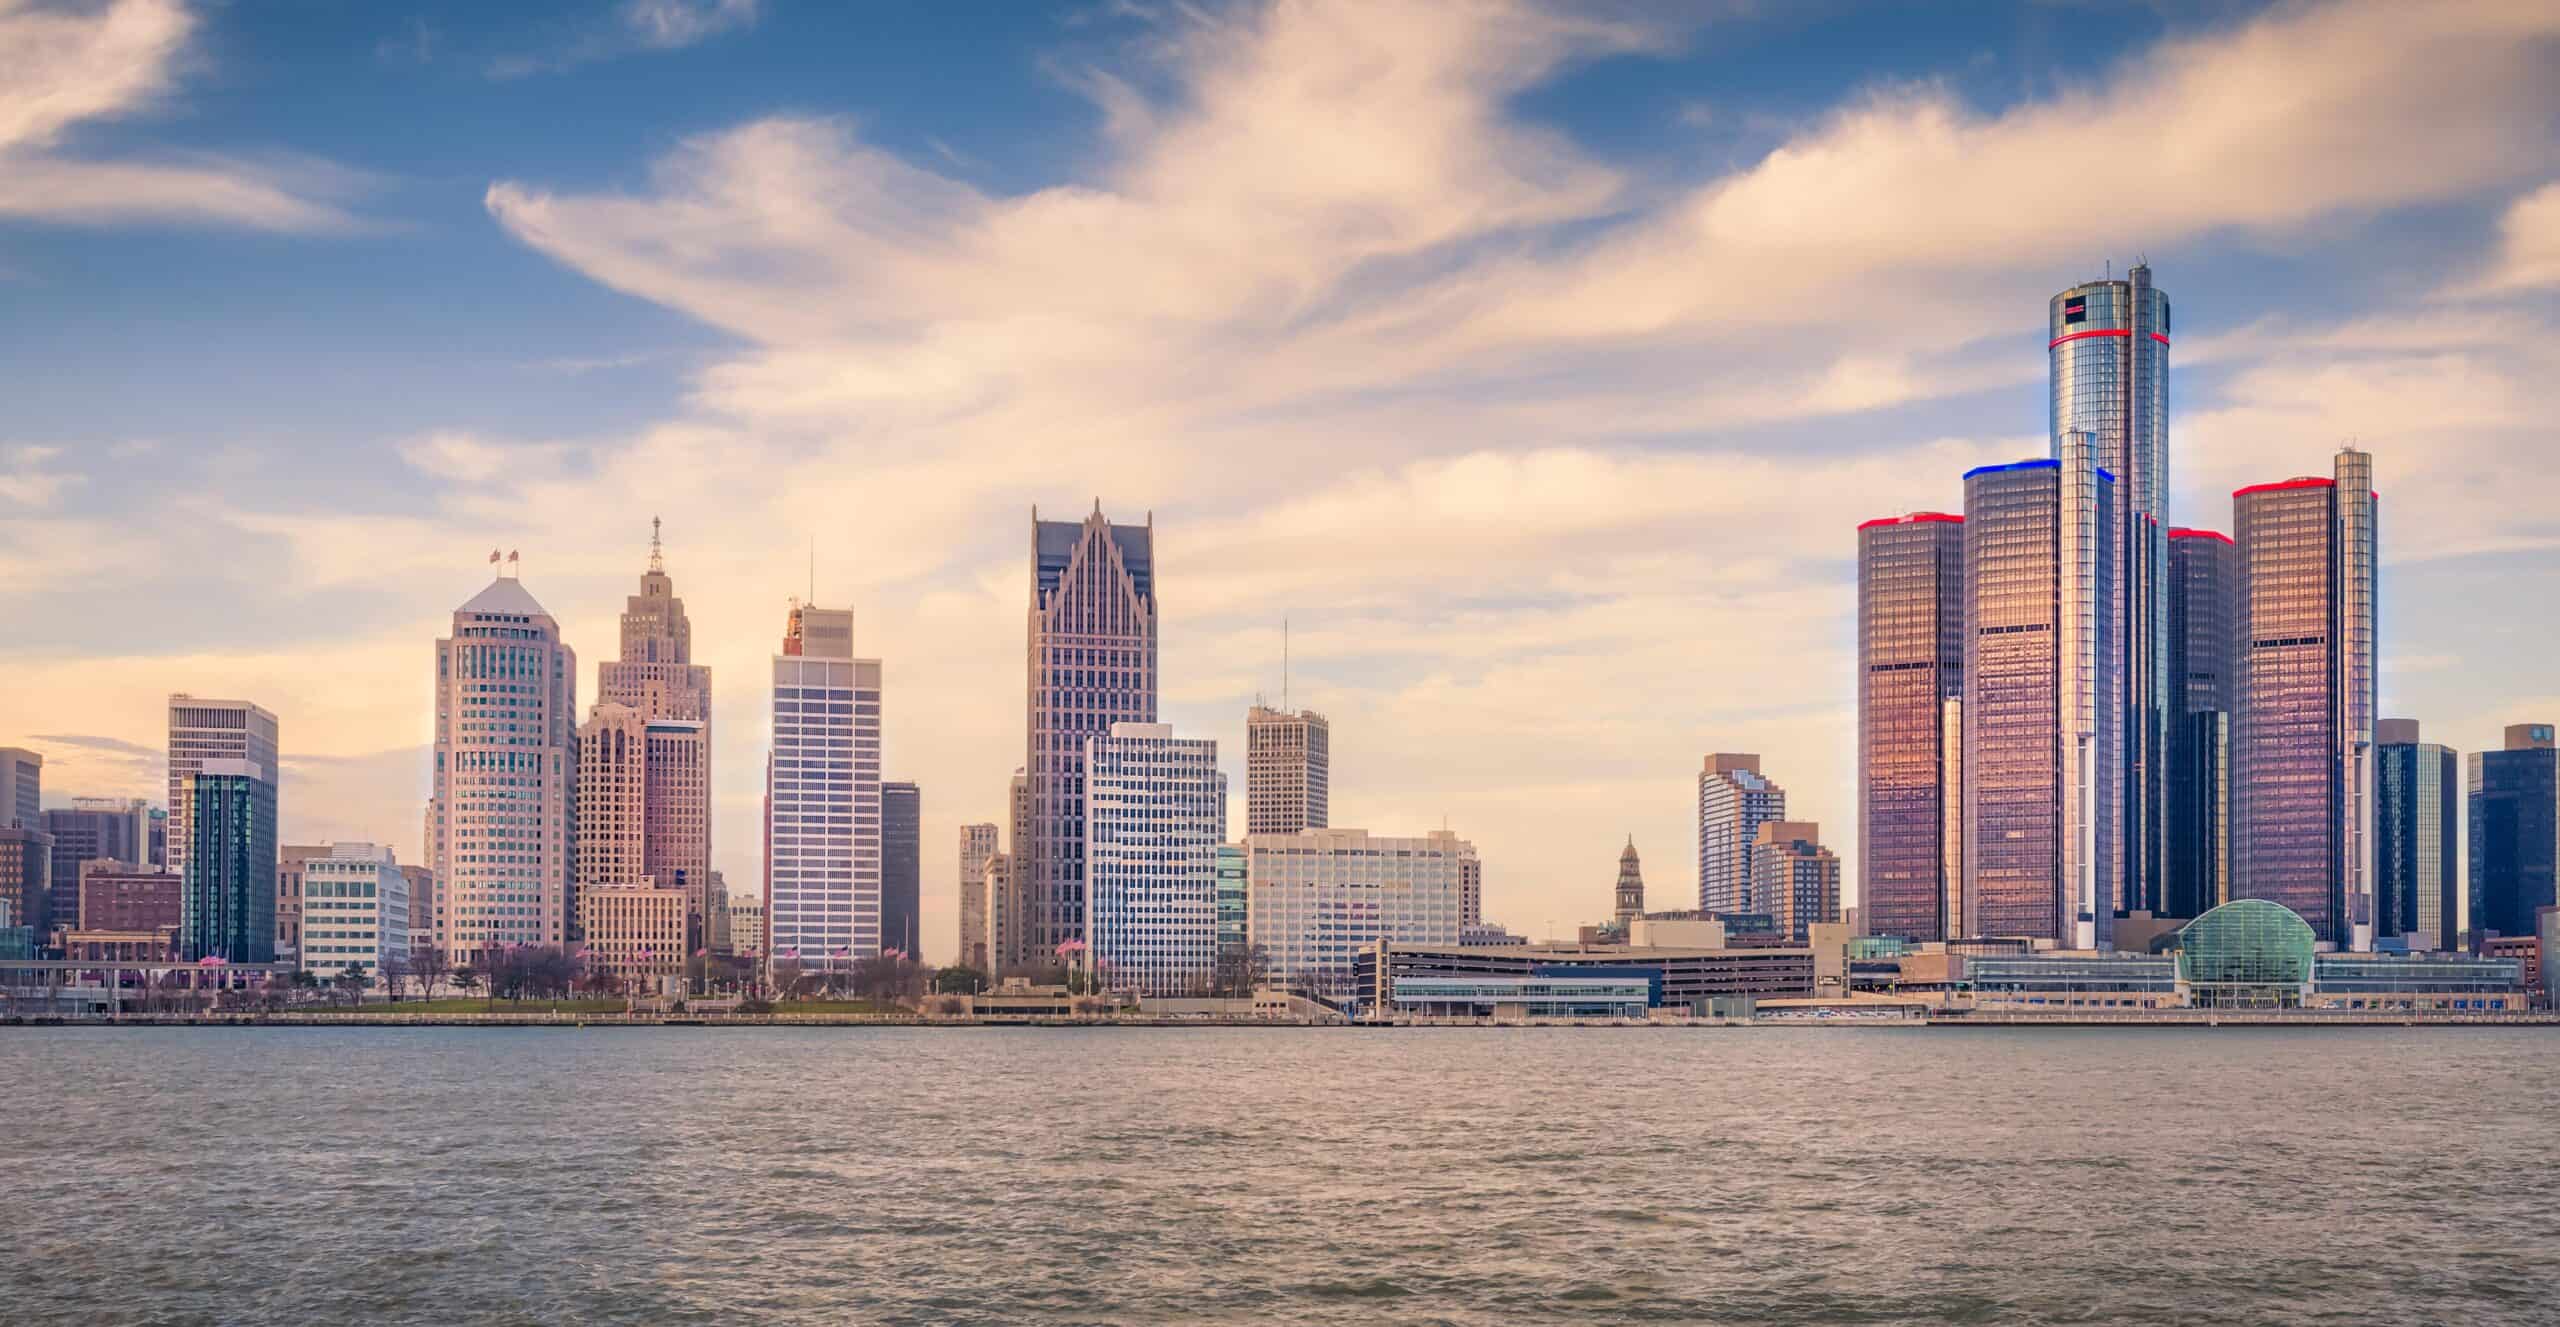
- Median household income: $42,171 (Black); $73,039 (white)
- Homeownership rate: 43.3% (Black); 78.4% (white)
- Unemployment rate: 13.1% (Black); 5.0% (white)
- Black population: 1,346,918 (13.4% of total)
5. Nebraska
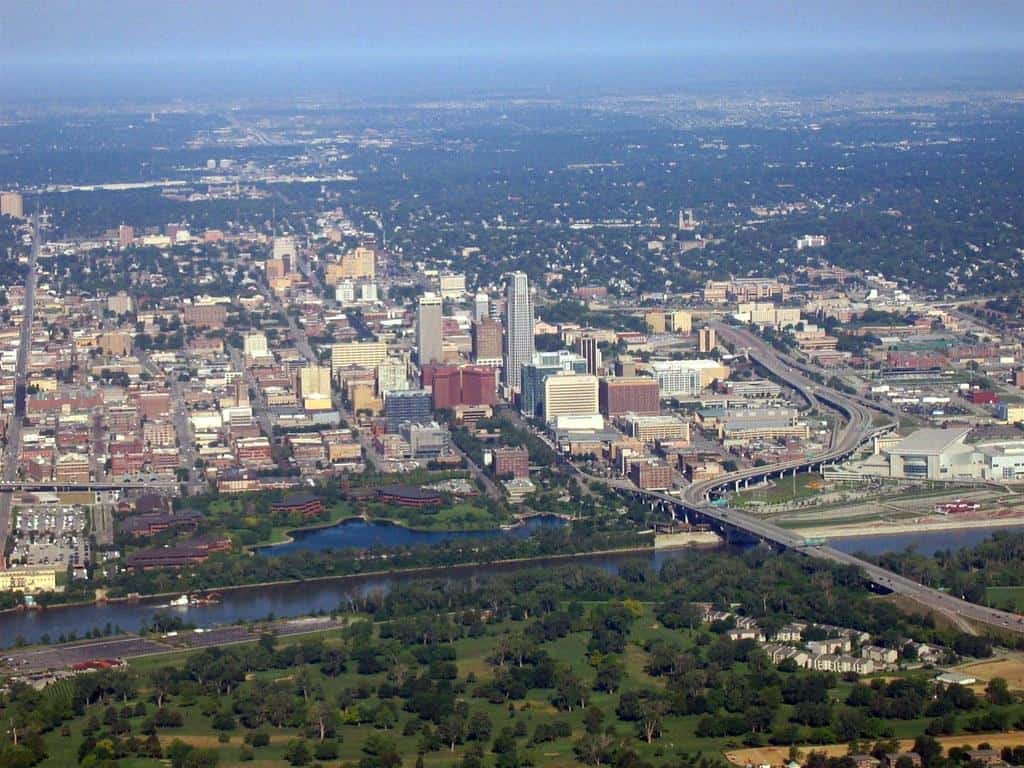
- Median household income: $45,287 (Black); $74,157 (white)
- Homeownership rate: 29.8% (Black); 70.0% (white)
- Unemployment rate: 8.3% (Black); 2.8% (white)
- Black population: 91,357 (4.7% of total)
4. Illinois
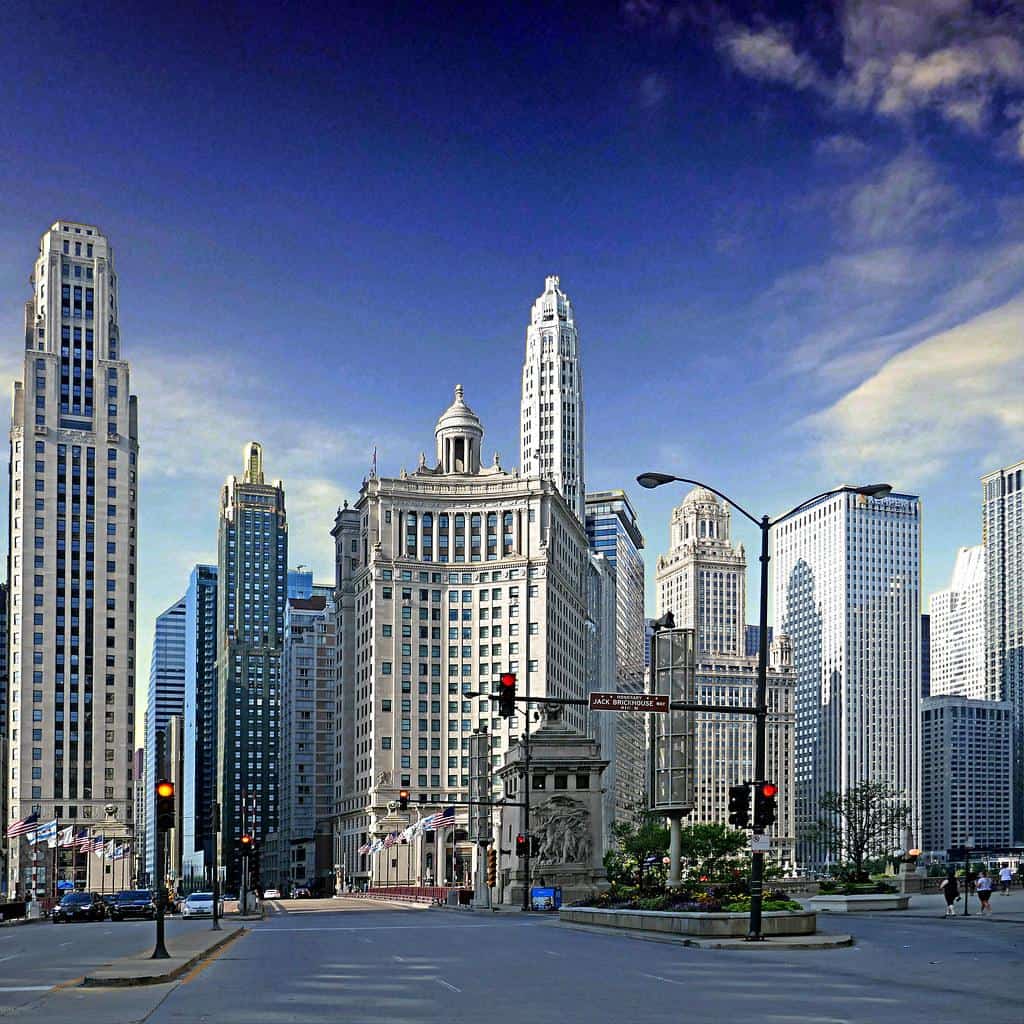
- Median household income: $46,717 (Black); $85,060 (white)
- Homeownership rate: 40.2% (Black); 73.7% (white)
- Unemployment rate: 13.7% (Black); 4.8% (white)
- Black population: 1,744,151 (13.7% of total)
3. Minnesota

- Median household income: $49,738 (Black); $87,692 (white)
- Homeownership rate: 28.4% (Black); 76.8% (white)
- Unemployment rate: 8.6% (Black); 3.4% (white)
- Black population: 377,173 (6.6% of total)
2. Iowa

- Median household income: $40,592 (Black); $72,363 (white)
- Homeownership rate: 27.2% (Black); 74.3% (white)
- Unemployment rate: 11.0% (Black); 3.4% (white)
- Black population: 117,940 (3.7% of total)
1. Wisconsin

- Median household income: $38,732 (Black); $75,803 (white)
- Homeownership rate: 26.5% (Black); 71.9% (white)
- Unemployment rate: 8.3% (Black); 3.0% (white)
- Black population: 356,150 (6.1% of total)
The post These States Consistently Fail Black Communities appeared first on 24/7 Wall St..
