


These American Cities Have Been Hit the Hardest by Inflation
As the central bank of the United States, Federal Reserve is charged with maintaining price stability for American consumers. The Fed targets a 2% annual inflation rate, meaning a dollar will lose 2% of its buying power, on average, year over year, if that goal is achieved. Since 2020, however, inflation has soared to highs […] The post These American Cities Have Been Hit the Hardest by Inflation appeared first on 24/7 Wall St..

As the central bank of the United States, Federal Reserve is charged with maintaining price stability for American consumers. The Fed targets a 2% annual inflation rate, meaning a dollar will lose 2% of its buying power, on average, year over year, if that goal is achieved. Since 2020, however, inflation has soared to highs not seen in decades.
24/7 Wall St. Key Points:
- Inflation, as measured by the consumer price index, hit historic highs in recent years.
- While Americans across the country are feeling the pinch, in several major U.S. cities, prices appear to have climbed even faster than they did nationwide.
- Also: 2 Dividend Legends To Hold Forever
Due in large part to pandemic-related supply constraints and increased consumer demand, the consumer price index, or CPI, increased by about 4.7% in 2021, 8% in 2022, and 4.1% in 2023. This irregularity has had meaningful implications for the American consumer. According to the U.S. Census Bureau, the typical household spent about $77,300 in 2023. If inflation were to continue at the rate it did between 2020 and 2023, a typical household would need to spend an estimated $92,000 for the same goods and services in 2026. (Here is a look at how ongoing inflation could impact your retirement.)
While inflation has generally been on a downward trend for the last few years, higher prices have not gone away, and Americans across the country are still living with the effects — particularly in cities, where the cost of living tends to be higher than it is in nearby, non-metropolitan communities.
Using regional price parity, or RPP, data from the Bureau of Economic Analysis, 24/7 Wall St. identified the American cities hit hardest by inflation. Our ranking is based on the change in RPP in U.S. metro areas between 2020 and 2023. RPP is an index that reflects the average price of goods and services relative to average prices nationwide. All supplemental data in this story is also from the BEA.
It is important to note that the price changes in this story are not a reflection of absolute price change, but rather, price change relative to the national average. For example, the national benchmark for the average price of goods and services is set at 100 every year. This means that if a given city has an RPP of 105, goods and services are 5% more expensive in that city than they are on average nationwide. If, in the following year, that same city’s RPP rises to 106, then prices in that city likely rose faster than they did nationwide. Similarly, if that city’s RPP remains at 105 from one year to the next, prices are moving at the same rate as they are across the U.S. as a whole.
Among the 35 metro areas on this list, consumer prices, as indicated by the RPP index, climbed anywhere from about 3.6 to 8.8 percentage points faster than they did nationwide, on average, between 2020 and 2023.
In nearly every city on this list, faster than average increases in the cost of living were led by housing, a sector of the U.S. economy that was hit especially hard both during and after the pandemic. According to data from Realtor.com, the median home list price surged by 23% between January 2021 and February 2025, from $335,000 to $412,000.
Despite rapidly rising prices, most metro areas on this list — 24 out of 35 — still have a lower average cost of living than the U.S. as a whole. In seven metro areas on this list, mostly concentrated in the South, goods and services are at least 10% less expensive, on average, than they are across the United States. (Here is a look at the voters most likely to approve of Trump’s economic policies.)
In other cities, rising costs may have had more meaningful implications. For example, in four Florida metro areas, as well as one in California and another in Oregon, the cost of living was lower than it was nationwide in 2020. However, as of 2023, the latest year of available data, the cost of living in these places was higher than it was nationwide by anywhere from about 1% to nearly 6%.
Why It Matters

In nearly every state, the average cost of living is higher in metropolitan areas than it is in more rural communities. Not only do cities tend to have higher consumer prices, many were also hit especially hard by inflation in recent years — and local residents are still living with the consequences.
35. Riverside-San Bernardino-Ontario, CA

- Relative change in overall cost of living from 2020 to 2023: 3.55 percentage points faster than national increase
- Overall cost of living in 2023: 7.93% higher than U.S. average
- Overall cost of living in 2020: 4.38% higher than U.S. average
- Relative change in goods prices from 2020 to 2023: +1.55 percentage points
- Relative change in services prices from 2020 to 2023: +4.38 percentage points
- Relative change in housing prices from 2020 to 2023: +5.62 percentage points
- Relative change in utilities prices from 2020 to 2023: +12.08 percentage points
34. Corvallis, OR

- Relative change in overall cost of living from 2020 to 2023: 3.66 percentage points faster than national increase
- Overall cost of living in 2023: 6.36% higher than U.S. average
- Overall cost of living in 2020: 2.70% higher than U.S. average
- Relative change in goods prices from 2020 to 2023: -0.00 percentage points
- Relative change in services prices from 2020 to 2023: +3.83 percentage points
- Relative change in housing prices from 2020 to 2023: +12.86 percentage points
- Relative change in utilities prices from 2020 to 2023: -2.94 percentage points
33. Morristown, TN
- Relative change in overall cost of living from 2020 to 2023: 3.66 percentage points faster than national increase
- Overall cost of living in 2023: 12.29% lower than U.S. average
- Overall cost of living in 2020: 15.95% lower than U.S. average
- Relative change in goods prices from 2020 to 2023: +0.52 percentage points
- Relative change in services prices from 2020 to 2023: +2.56 percentage points
- Relative change in housing prices from 2020 to 2023: +5.58 percentage points
- Relative change in utilities prices from 2020 to 2023: +1.18 percentage points
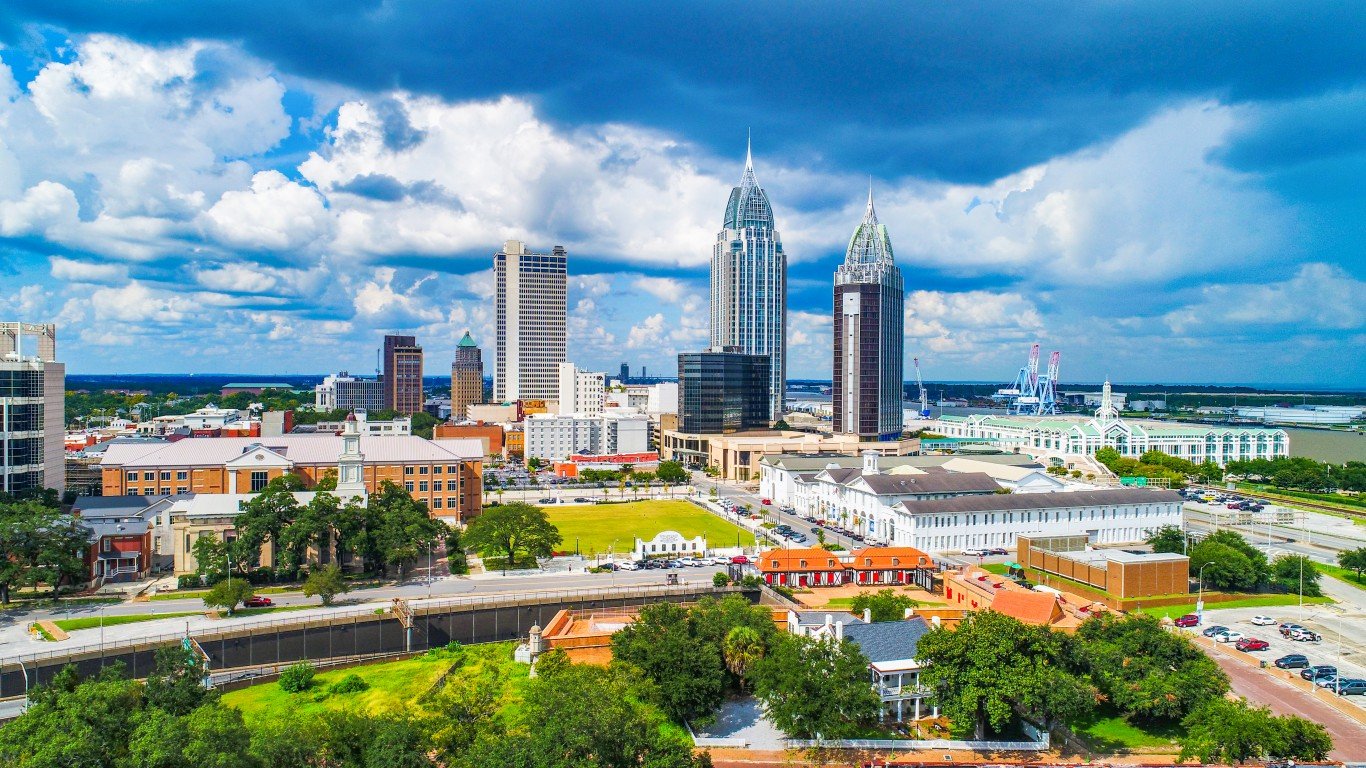
32. Huntsville, AL

- Relative change in overall cost of living from 2020 to 2023: 3.73 percentage points faster than national increase
- Overall cost of living in 2023: 5.60% lower than U.S. average
- Overall cost of living in 2020: 9.33% lower than U.S. average
- Relative change in goods prices from 2020 to 2023: +0.72 percentage points
- Relative change in services prices from 2020 to 2023: +2.22 percentage points
- Relative change in housing prices from 2020 to 2023: +10.66 percentage points
- Relative change in utilities prices from 2020 to 2023: +5.20 percentage points
31. Coeur d’Alene, ID

- Relative change in overall cost of living from 2020 to 2023: 3.85 percentage points faster than national increase
- Overall cost of living in 2023: 3.12% lower than U.S. average
- Overall cost of living in 2020: 6.96% lower than U.S. average
- Relative change in goods prices from 2020 to 2023: -1.36 percentage points
- Relative change in services prices from 2020 to 2023: -2.77 percentage points
- Relative change in housing prices from 2020 to 2023: +29.74 percentage points
- Relative change in utilities prices from 2020 to 2023: -7.23 percentage points
30. Mount Vernon-Anacortes, WA

- Relative change in overall cost of living from 2020 to 2023: 3.88 percentage points faster than national increase
- Overall cost of living in 2023: 6.02% higher than U.S. average
- Overall cost of living in 2020: 2.14% higher than U.S. average
- Relative change in goods prices from 2020 to 2023: +0.31 percentage points
- Relative change in services prices from 2020 to 2023: +2.17 percentage points
- Relative change in housing prices from 2020 to 2023: +17.73 percentage points
- Relative change in utilities prices from 2020 to 2023: -5.15 percentage points
29. Rome, GA
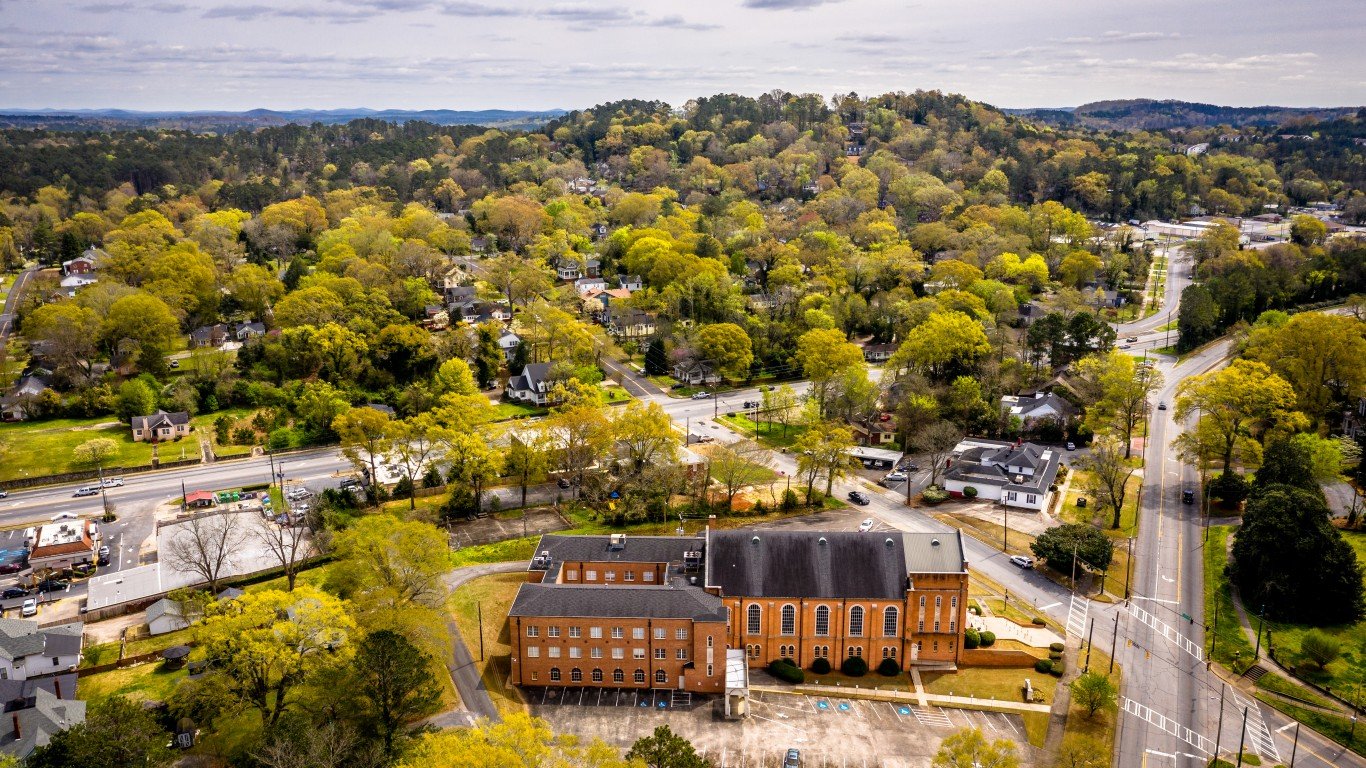
- Relative change in overall cost of living from 2020 to 2023: 3.89 percentage points faster than national increase
- Overall cost of living in 2023: 9.78% lower than U.S. average
- Overall cost of living in 2020: 13.66% lower than U.S. average
- Relative change in goods prices from 2020 to 2023: +0.72 percentage points
- Relative change in services prices from 2020 to 2023: +2.87 percentage points
- Relative change in housing prices from 2020 to 2023: +7.94 percentage points
- Relative change in utilities prices from 2020 to 2023: -3.65 percentage points
28. Daphne-Fairhope-Foley, AL
- Relative change in overall cost of living from 2020 to 2023: 3.98 percentage points faster than national increase
- Overall cost of living in 2023: 5.27% lower than U.S. average
- Overall cost of living in 2020: 9.26% lower than U.S. average
- Relative change in goods prices from 2020 to 2023: +0.72 percentage points
- Relative change in services prices from 2020 to 2023: +2.22 percentage points
- Relative change in housing prices from 2020 to 2023: +10.88 percentage points
- Relative change in utilities prices from 2020 to 2023: +6.53 percentage points
27. North Port-Sarasota-Bradenton, FL

- Relative change in overall cost of living from 2020 to 2023: 4.01 percentage points faster than national increase
- Overall cost of living in 2023: 3.64% higher than U.S. average
- Overall cost of living in 2020: 0.37% lower than U.S. average
- Relative change in goods prices from 2020 to 2023: +0.41 percentage points
- Relative change in services prices from 2020 to 2023: +3.53 percentage points
- Relative change in housing prices from 2020 to 2023: +16.42 percentage points
- Relative change in utilities prices from 2020 to 2023: +5.33 percentage points
26. Duluth, MN-WI
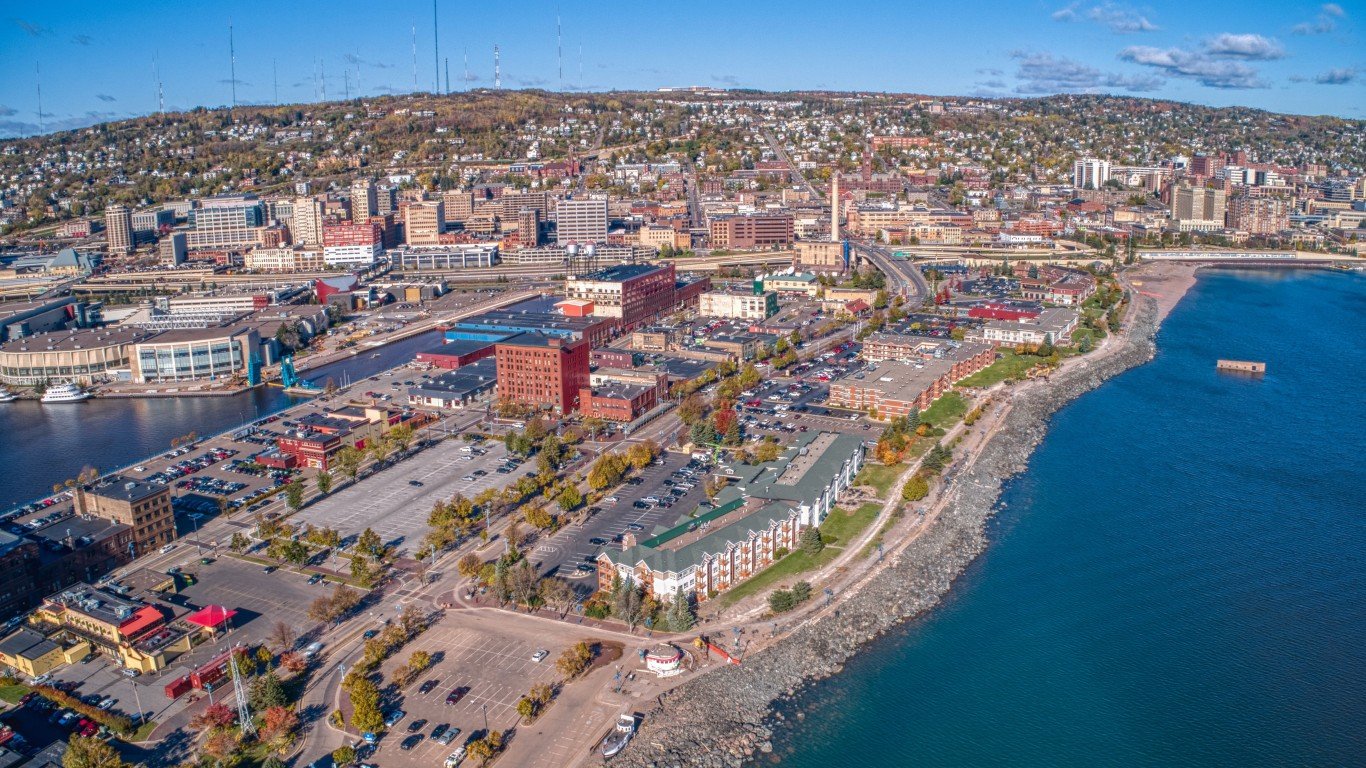
- Relative change in overall cost of living from 2020 to 2023: 4.03 percentage points faster than national increase
- Overall cost of living in 2023: 13.02% lower than U.S. average
- Overall cost of living in 2020: 17.05% lower than U.S. average
- Relative change in goods prices from 2020 to 2023: -0.42 percentage points
- Relative change in services prices from 2020 to 2023: -4.12 percentage points
- Relative change in housing prices from 2020 to 2023: +18.55 percentage points
- Relative change in utilities prices from 2020 to 2023: -3.74 percentage points
25. Palm Bay-Melbourne-Titusville, FL
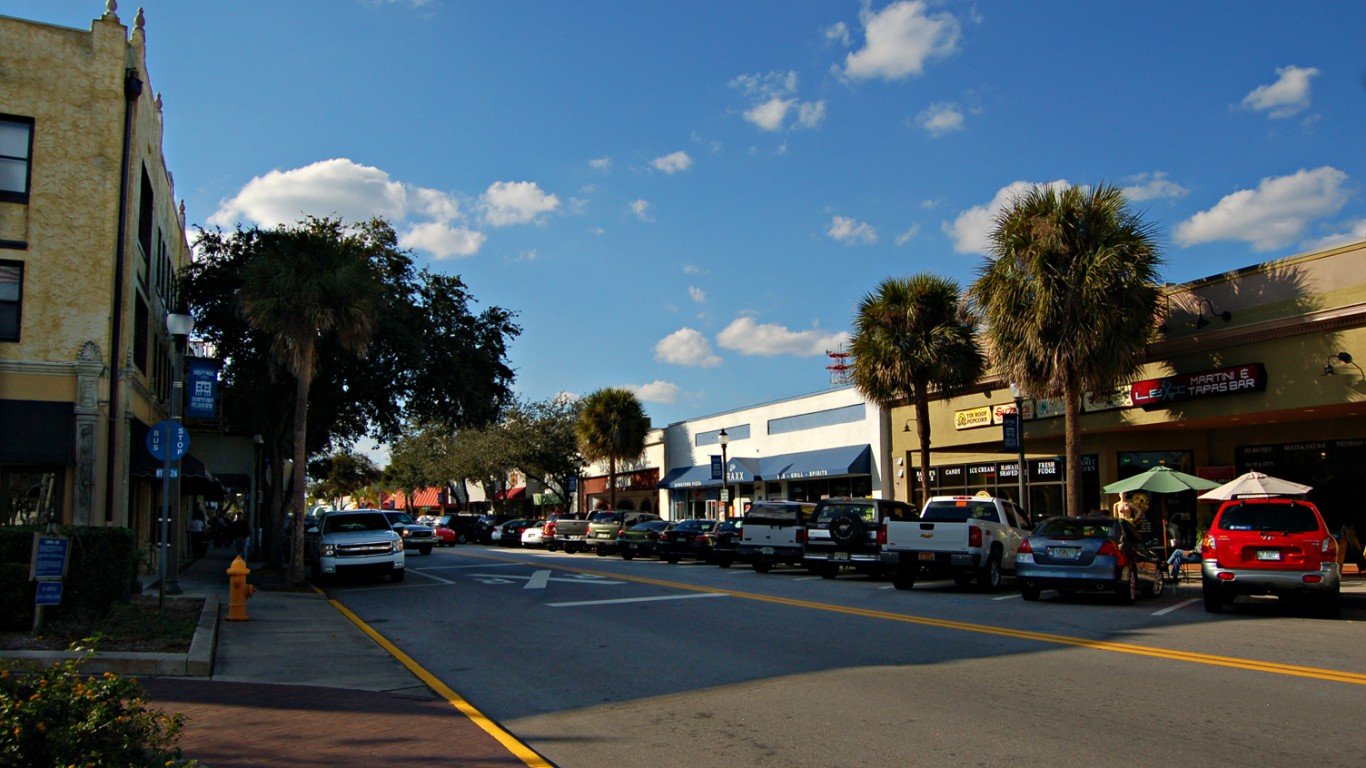
- Relative change in overall cost of living from 2020 to 2023: 4.06 percentage points faster than national increase
- Overall cost of living in 2023: 0.84% higher than U.S. average
- Overall cost of living in 2020: 3.22% lower than U.S. average
- Relative change in goods prices from 2020 to 2023: +0.41 percentage points
- Relative change in services prices from 2020 to 2023: +3.53 percentage points
- Relative change in housing prices from 2020 to 2023: +14.39 percentage points
- Relative change in utilities prices from 2020 to 2023: +5.17 percentage points
24. Hattiesburg, MS

- Relative change in overall cost of living from 2020 to 2023: 4.07 percentage points faster than national increase
- Overall cost of living in 2023: 10.70% lower than U.S. average
- Overall cost of living in 2020: 14.76% lower than U.S. average
- Relative change in goods prices from 2020 to 2023: +0.24 percentage points
- Relative change in services prices from 2020 to 2023: +3.02 percentage points
- Relative change in housing prices from 2020 to 2023: +10.02 percentage points
- Relative change in utilities prices from 2020 to 2023: +5.96 percentage points
23. Hinesville, GA
- Relative change in overall cost of living from 2020 to 2023: 4.11 percentage points faster than national increase
- Overall cost of living in 2023: 6.11% lower than U.S. average
- Overall cost of living in 2020: 10.22% lower than U.S. average
- Relative change in goods prices from 2020 to 2023: +0.72 percentage points
- Relative change in services prices from 2020 to 2023: +2.87 percentage points
- Relative change in housing prices from 2020 to 2023: +14.14 percentage points
- Relative change in utilities prices from 2020 to 2023: -3.80 percentage points
22. Greenville, NC

- Relative change in overall cost of living from 2020 to 2023: 4.11 percentage points faster than national increase
- Overall cost of living in 2023: 8.39% lower than U.S. average
- Overall cost of living in 2020: 12.50% lower than U.S. average
- Relative change in goods prices from 2020 to 2023: +1.06 percentage points
- Relative change in services prices from 2020 to 2023: +2.60 percentage points
- Relative change in housing prices from 2020 to 2023: +10.50 percentage points
- Relative change in utilities prices from 2020 to 2023: -3.83 percentage points
21. Lakeland-Winter Haven, FL
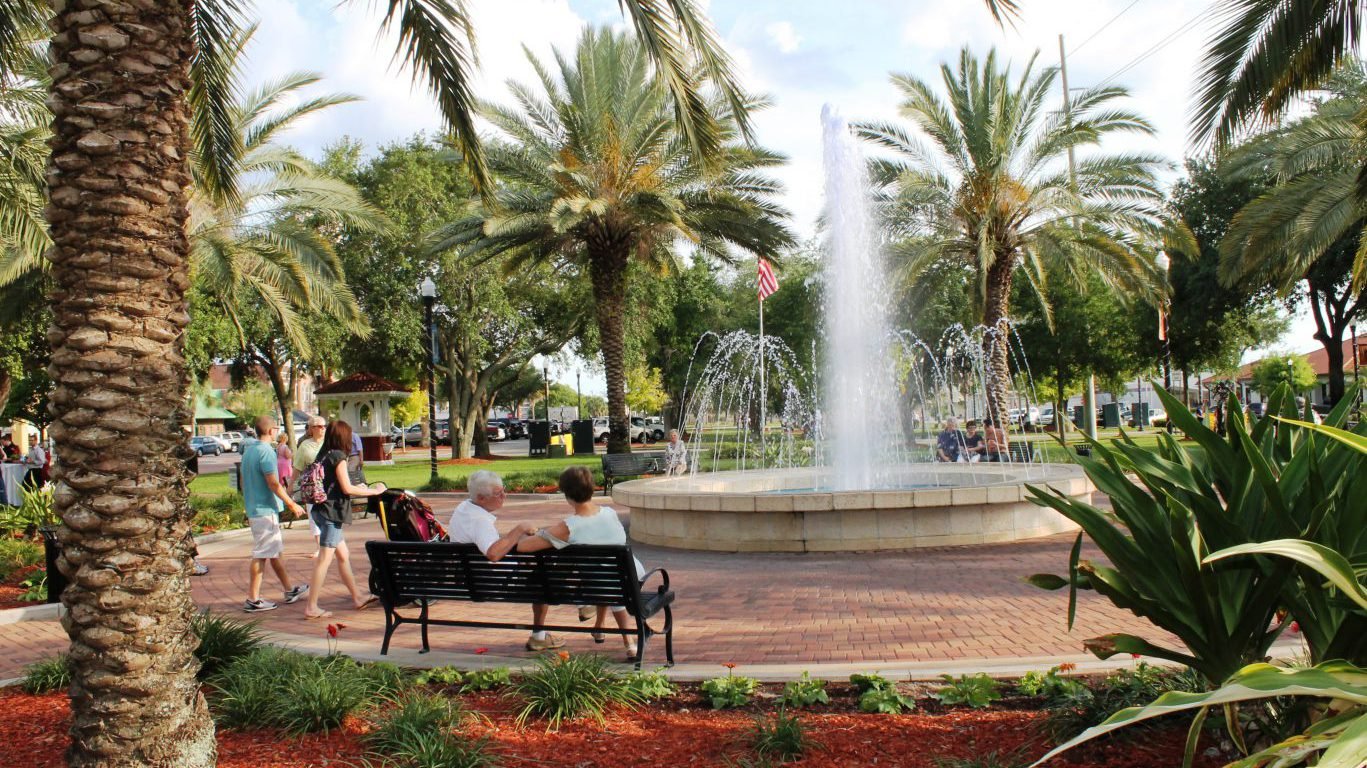
- Relative change in overall cost of living from 2020 to 2023: 4.12 percentage points faster than national increase
- Overall cost of living in 2023: 2.63% lower than U.S. average
- Overall cost of living in 2020: 6.75% lower than U.S. average
- Relative change in goods prices from 2020 to 2023: +0.41 percentage points
- Relative change in services prices from 2020 to 2023: +3.53 percentage points
- Relative change in housing prices from 2020 to 2023: +11.32 percentage points
- Relative change in utilities prices from 2020 to 2023: +5.98 percentage points
20. Gainesville, FL
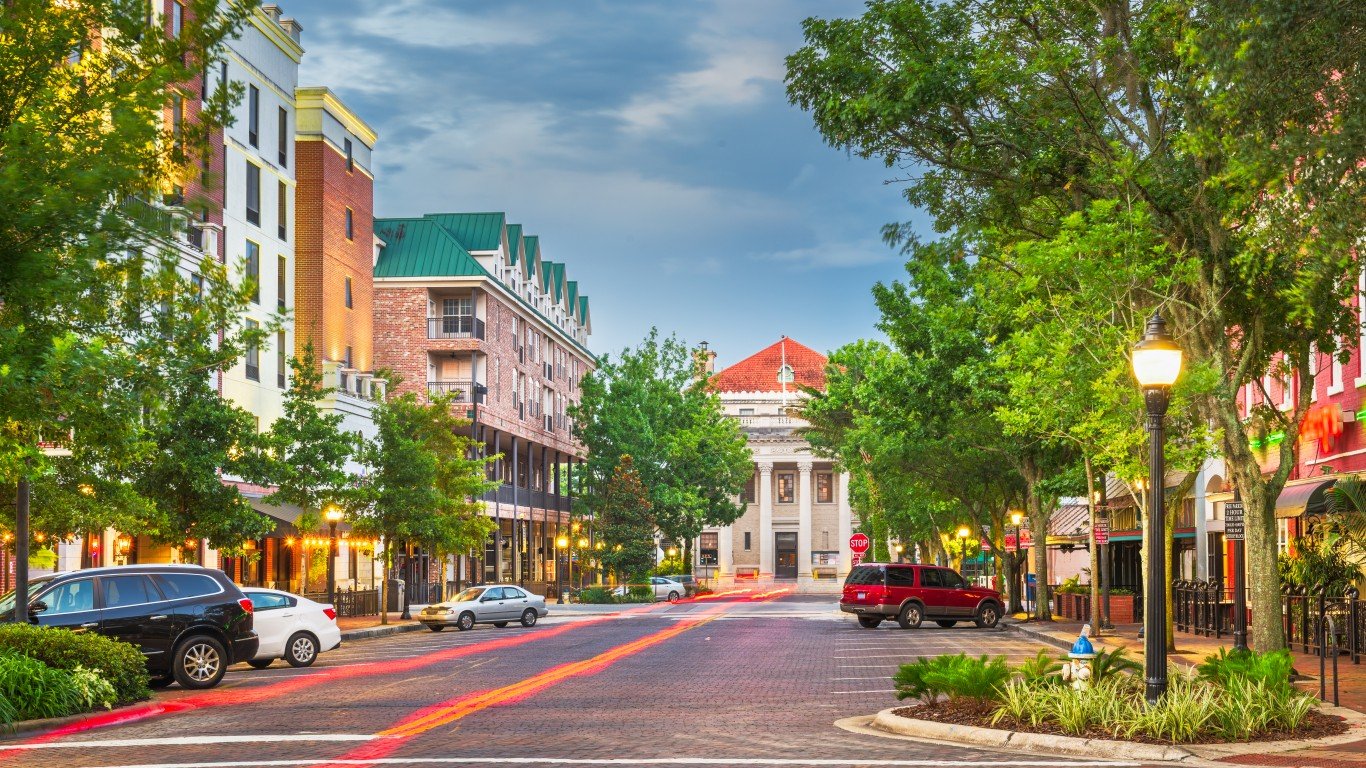
- Relative change in overall cost of living from 2020 to 2023: 4.16 percentage points faster than national increase
- Overall cost of living in 2023: 3.11% lower than U.S. average
- Overall cost of living in 2020: 7.27% lower than U.S. average
- Relative change in goods prices from 2020 to 2023: +0.41 percentage points
- Relative change in services prices from 2020 to 2023: +3.53 percentage points
- Relative change in housing prices from 2020 to 2023: +11.47 percentage points
- Relative change in utilities prices from 2020 to 2023: +5.85 percentage points
19. Tallahassee, FL
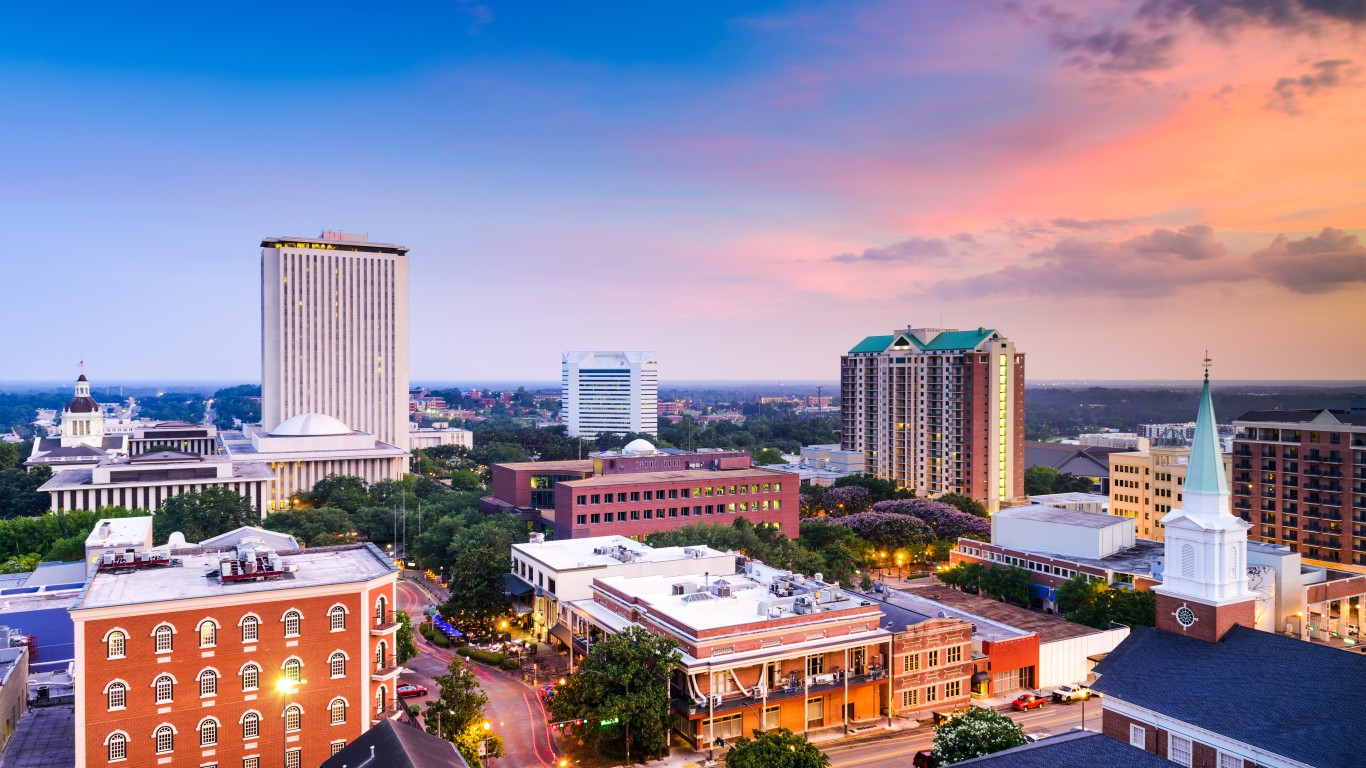
- Relative change in overall cost of living from 2020 to 2023: 4.21 percentage points faster than national increase
- Overall cost of living in 2023: 4.72% lower than U.S. average
- Overall cost of living in 2020: 8.93% lower than U.S. average
- Relative change in goods prices from 2020 to 2023: +0.41 percentage points
- Relative change in services prices from 2020 to 2023: +3.53 percentage points
- Relative change in housing prices from 2020 to 2023: +10.69 percentage points
- Relative change in utilities prices from 2020 to 2023: +6.09 percentage points
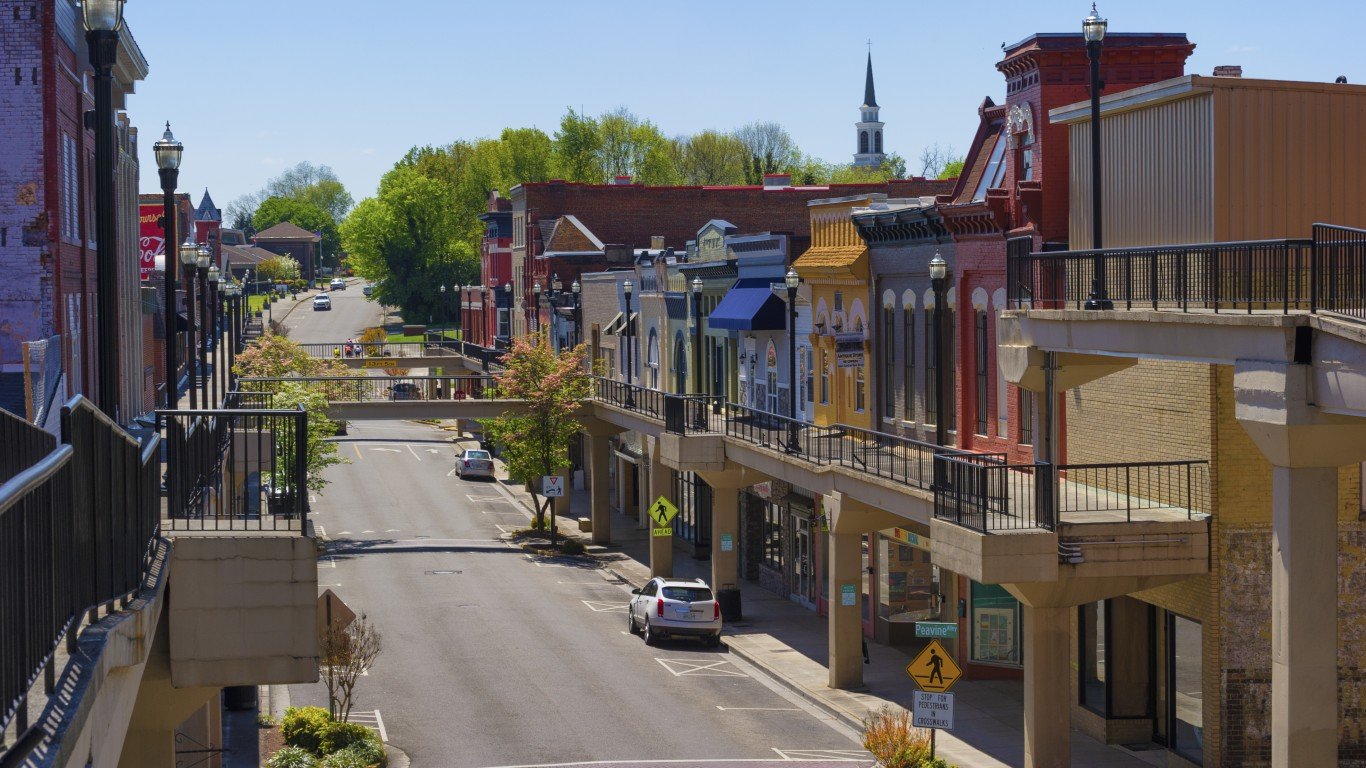
18. Cleveland, TN
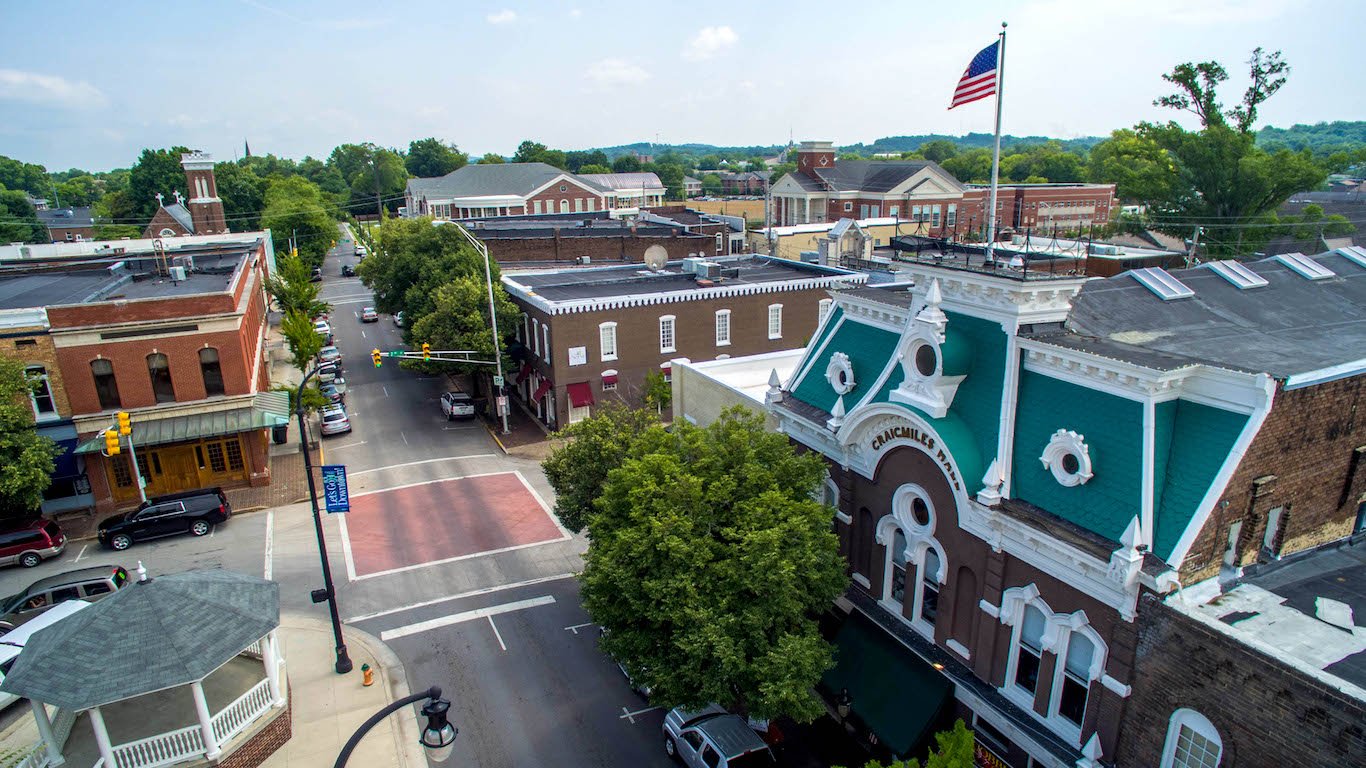
- Relative change in overall cost of living from 2020 to 2023: 4.24 percentage points faster than national increase
- Overall cost of living in 2023: 9.12% lower than U.S. average
- Overall cost of living in 2020: 13.37% lower than U.S. average
- Relative change in goods prices from 2020 to 2023: +0.52 percentage points
- Relative change in services prices from 2020 to 2023: +2.56 percentage points
- Relative change in housing prices from 2020 to 2023: +10.34 percentage points
- Relative change in utilities prices from 2020 to 2023: +1.86 percentage points
17. Goldsboro, NC
- Relative change in overall cost of living from 2020 to 2023: 4.30 percentage points faster than national increase
- Overall cost of living in 2023: 10.27% lower than U.S. average
- Overall cost of living in 2020: 14.57% lower than U.S. average
- Relative change in goods prices from 2020 to 2023: +1.06 percentage points
- Relative change in services prices from 2020 to 2023: +2.60 percentage points
- Relative change in housing prices from 2020 to 2023: +8.85 percentage points
- Relative change in utilities prices from 2020 to 2023: -4.10 percentage points
16. Ocala, FL
- Relative change in overall cost of living from 2020 to 2023: 4.31 percentage points faster than national increase
- Overall cost of living in 2023: 4.49% lower than U.S. average
- Overall cost of living in 2020: 8.80% lower than U.S. average
- Relative change in goods prices from 2020 to 2023: +0.41 percentage points
- Relative change in services prices from 2020 to 2023: +3.53 percentage points
- Relative change in housing prices from 2020 to 2023: +9.27 percentage points
- Relative change in utilities prices from 2020 to 2023: +6.96 percentage points
15. Salisbury, MD-DE
- Relative change in overall cost of living from 2020 to 2023: 4.31 percentage points faster than national increase
- Overall cost of living in 2023: 4.88% lower than U.S. average
- Overall cost of living in 2020: 9.19% lower than U.S. average
- Relative change in goods prices from 2020 to 2023: +0.90 percentage points
- Relative change in services prices from 2020 to 2023: +3.28 percentage points
- Relative change in housing prices from 2020 to 2023: +10.73 percentage points
- Relative change in utilities prices from 2020 to 2023: +1.54 percentage points
14. Rocky Mount, NC
- Relative change in overall cost of living from 2020 to 2023: 4.41 percentage points faster than national increase
- Overall cost of living in 2023: 11.76% lower than U.S. average
- Overall cost of living in 2020: 16.17% lower than U.S. average
- Relative change in goods prices from 2020 to 2023: +1.06 percentage points
- Relative change in services prices from 2020 to 2023: +2.60 percentage points
- Relative change in housing prices from 2020 to 2023: +0.38 percentage points
- Relative change in utilities prices from 2020 to 2023: -2.83 percentage points
13. Cape Coral-Fort Myers, FL

- Relative change in overall cost of living from 2020 to 2023: 4.46 percentage points faster than national increase
- Overall cost of living in 2023: 2.57% higher than U.S. average
- Overall cost of living in 2020: 1.89% lower than U.S. average
- Relative change in goods prices from 2020 to 2023: +0.41 percentage points
- Relative change in services prices from 2020 to 2023: +3.53 percentage points
- Relative change in housing prices from 2020 to 2023: +16.11 percentage points
- Relative change in utilities prices from 2020 to 2023: +5.78 percentage points
12. Barnstable Town, MA
- Relative change in overall cost of living from 2020 to 2023: 4.56 percentage points faster than national increase
- Overall cost of living in 2023: 5.82% higher than U.S. average
- Overall cost of living in 2020: 1.25% higher than U.S. average
- Relative change in goods prices from 2020 to 2023: -1.25 percentage points
- Relative change in services prices from 2020 to 2023: -0.01 percentage points
- Relative change in housing prices from 2020 to 2023: +23.83 percentage points
- Relative change in utilities prices from 2020 to 2023: +3.77 percentage points
11. Olympia-Lacey-Tumwater, WA

- Relative change in overall cost of living from 2020 to 2023: 4.57 percentage points faster than national increase
- Overall cost of living in 2023: 6.48% higher than U.S. average
- Overall cost of living in 2020: 1.91% higher than U.S. average
- Relative change in goods prices from 2020 to 2023: +0.31 percentage points
- Relative change in services prices from 2020 to 2023: +2.17 percentage points
- Relative change in housing prices from 2020 to 2023: +22.67 percentage points
- Relative change in utilities prices from 2020 to 2023: -5.19 percentage points
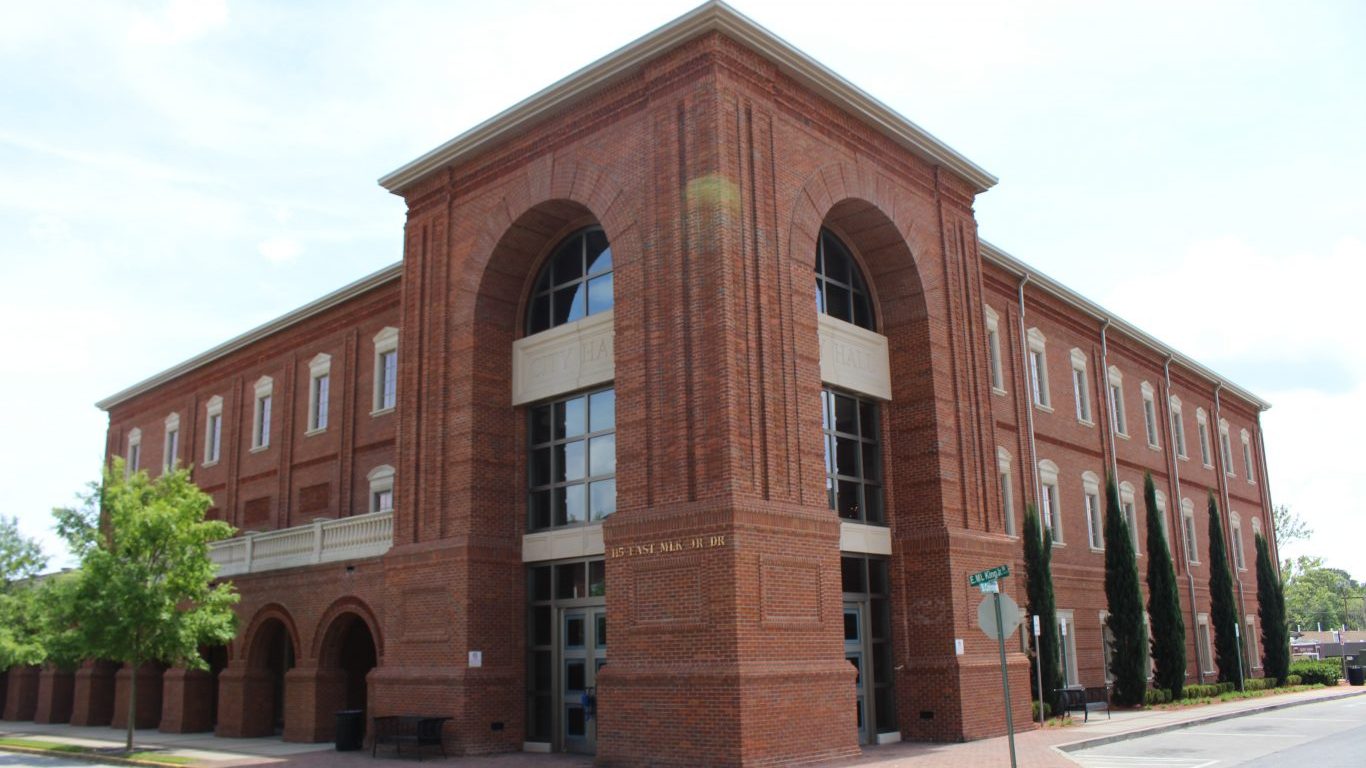
10. Macon-Bibb County, GA

- Relative change in overall cost of living from 2020 to 2023: 4.76 percentage points faster than national increase
- Overall cost of living in 2023: 9.96% lower than U.S. average
- Overall cost of living in 2020: 14.72% lower than U.S. average
- Relative change in goods prices from 2020 to 2023: +0.72 percentage points
- Relative change in services prices from 2020 to 2023: +2.87 percentage points
- Relative change in housing prices from 2020 to 2023: +9.07 percentage points
- Relative change in utilities prices from 2020 to 2023: -4.19 percentage points
9. Sumter, SC
- Relative change in overall cost of living from 2020 to 2023: 4.87 percentage points faster than national increase
- Overall cost of living in 2023: 13.75% lower than U.S. average
- Overall cost of living in 2020: 18.62% lower than U.S. average
- Relative change in goods prices from 2020 to 2023: +0.16 percentage points
- Relative change in services prices from 2020 to 2023: +2.39 percentage points
- Relative change in housing prices from 2020 to 2023: +8.19 percentage points
- Relative change in utilities prices from 2020 to 2023: -9.45 percentage points
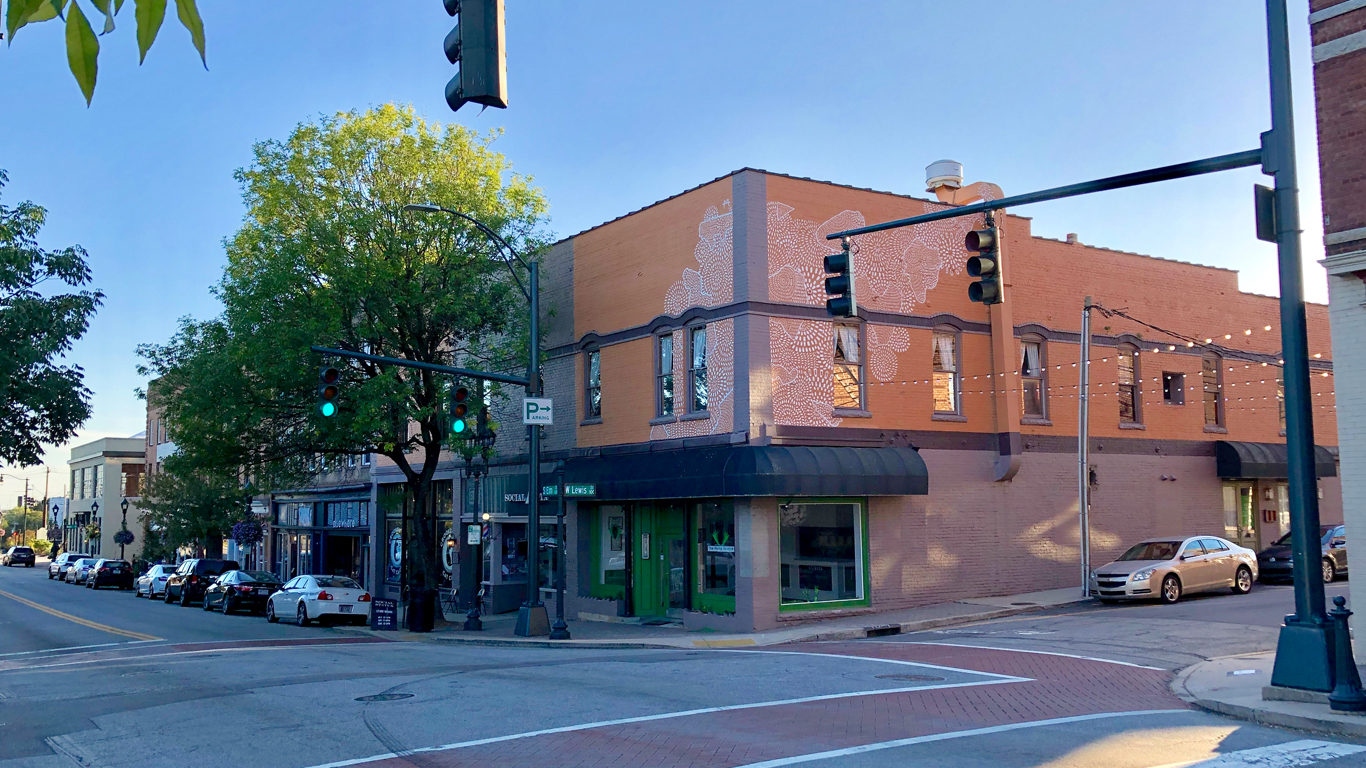
8. Staunton, VA

- Relative change in overall cost of living from 2020 to 2023: 5.02 percentage points faster than national increase
- Overall cost of living in 2023: 7.41% lower than U.S. average
- Overall cost of living in 2020: 12.43% lower than U.S. average
- Relative change in goods prices from 2020 to 2023: +1.53 percentage points
- Relative change in services prices from 2020 to 2023: +3.26 percentage points
- Relative change in housing prices from 2020 to 2023: +11.62 percentage points
- Relative change in utilities prices from 2020 to 2023: -1.91 percentage points
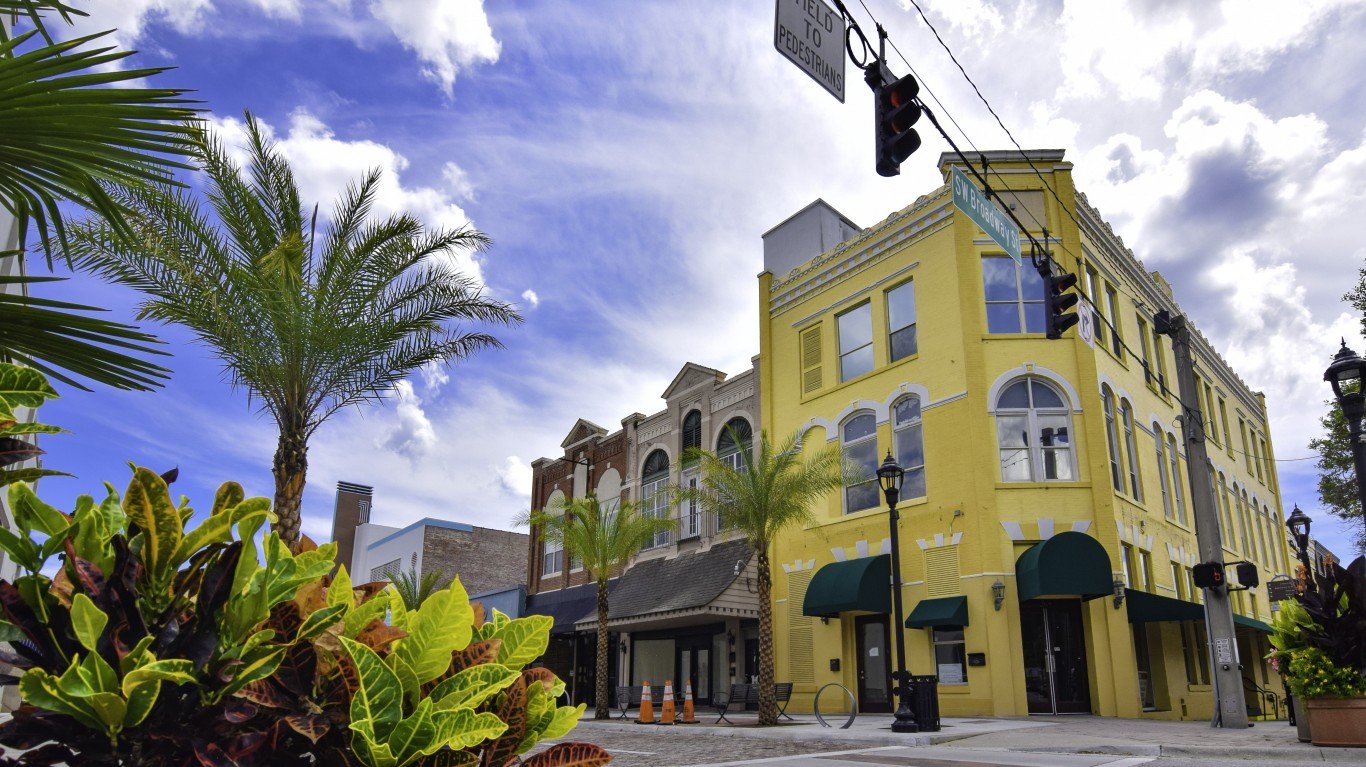
7. Homosassa Springs, FL

- Relative change in overall cost of living from 2020 to 2023: 5.51 percentage points faster than national increase
- Overall cost of living in 2023: 4.57% lower than U.S. average
- Overall cost of living in 2020: 10.08% lower than U.S. average
- Relative change in goods prices from 2020 to 2023: +0.41 percentage points
- Relative change in services prices from 2020 to 2023: +3.53 percentage points
- Relative change in housing prices from 2020 to 2023: +15.55 percentage points
- Relative change in utilities prices from 2020 to 2023: +6.24 percentage points
6. Great Falls, MT

- Relative change in overall cost of living from 2020 to 2023: 5.60 percentage points faster than national increase
- Overall cost of living in 2023: 7.40% lower than U.S. average
- Overall cost of living in 2020: 13.01% lower than U.S. average
- Relative change in goods prices from 2020 to 2023: -1.56 percentage points
- Relative change in services prices from 2020 to 2023: -2.84 percentage points
- Relative change in housing prices from 2020 to 2023: +35.08 percentage points
- Relative change in utilities prices from 2020 to 2023: -6.43 percentage points
5. Grants Pass, OR

- Relative change in overall cost of living from 2020 to 2023: 5.72 percentage points faster than national increase
- Overall cost of living in 2023: 0.71% higher than U.S. average
- Overall cost of living in 2020: 5.01% lower than U.S. average
- Relative change in goods prices from 2020 to 2023: -0.00 percentage points
- Relative change in services prices from 2020 to 2023: +3.83 percentage points
- Relative change in housing prices from 2020 to 2023: +15.80 percentage points
- Relative change in utilities prices from 2020 to 2023: -4.58 percentage points
4. Dalton, GA

- Relative change in overall cost of living from 2020 to 2023: 5.79 percentage points faster than national increase
- Overall cost of living in 2023: 9.72% lower than U.S. average
- Overall cost of living in 2020: 15.52% lower than U.S. average
- Relative change in goods prices from 2020 to 2023: +0.72 percentage points
- Relative change in services prices from 2020 to 2023: +2.87 percentage points
- Relative change in housing prices from 2020 to 2023: +12.98 percentage points
- Relative change in utilities prices from 2020 to 2023: -2.90 percentage points
3. Beckley, WV
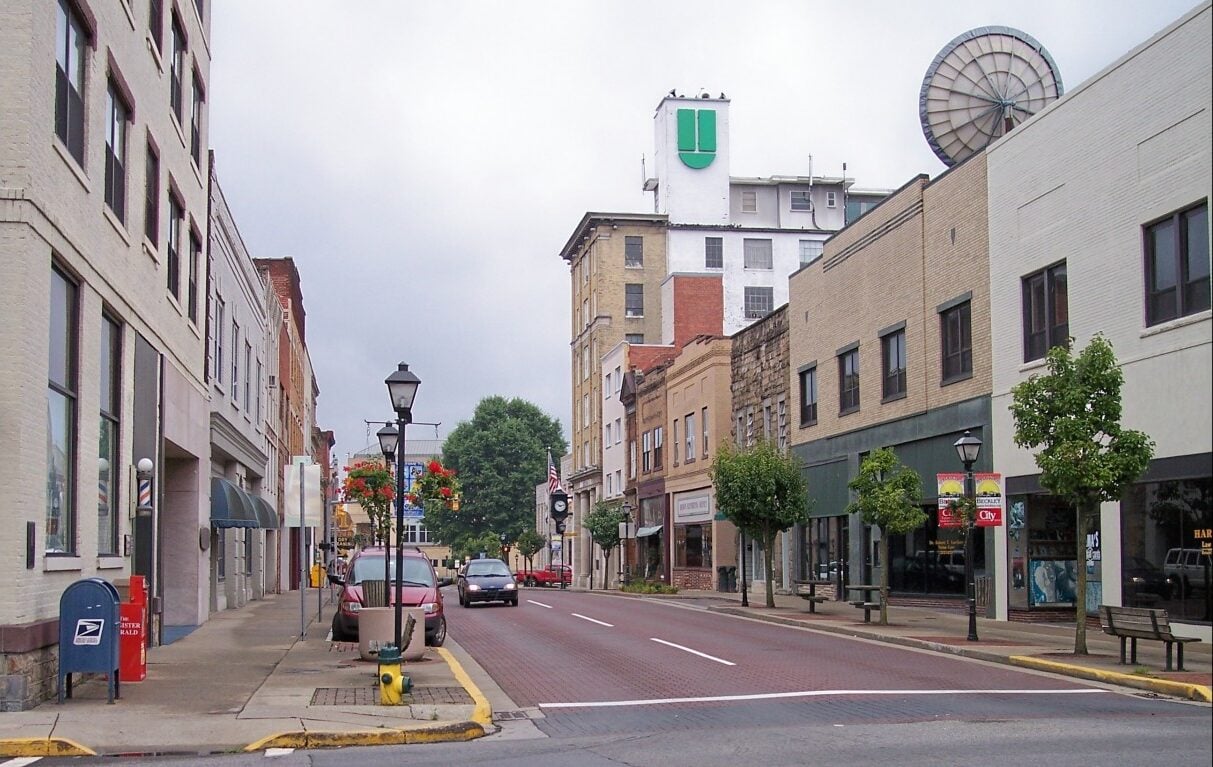
- Relative change in overall cost of living from 2020 to 2023: 6.20 percentage points faster than national increase
- Overall cost of living in 2023: 10.36% lower than U.S. average
- Overall cost of living in 2020: 16.56% lower than U.S. average
- Relative change in goods prices from 2020 to 2023: +0.44 percentage points
- Relative change in services prices from 2020 to 2023: +3.76 percentage points
- Relative change in housing prices from 2020 to 2023: +11.16 percentage points
- Relative change in utilities prices from 2020 to 2023: +0.72 percentage points
2. Naples-Marco Island, FL
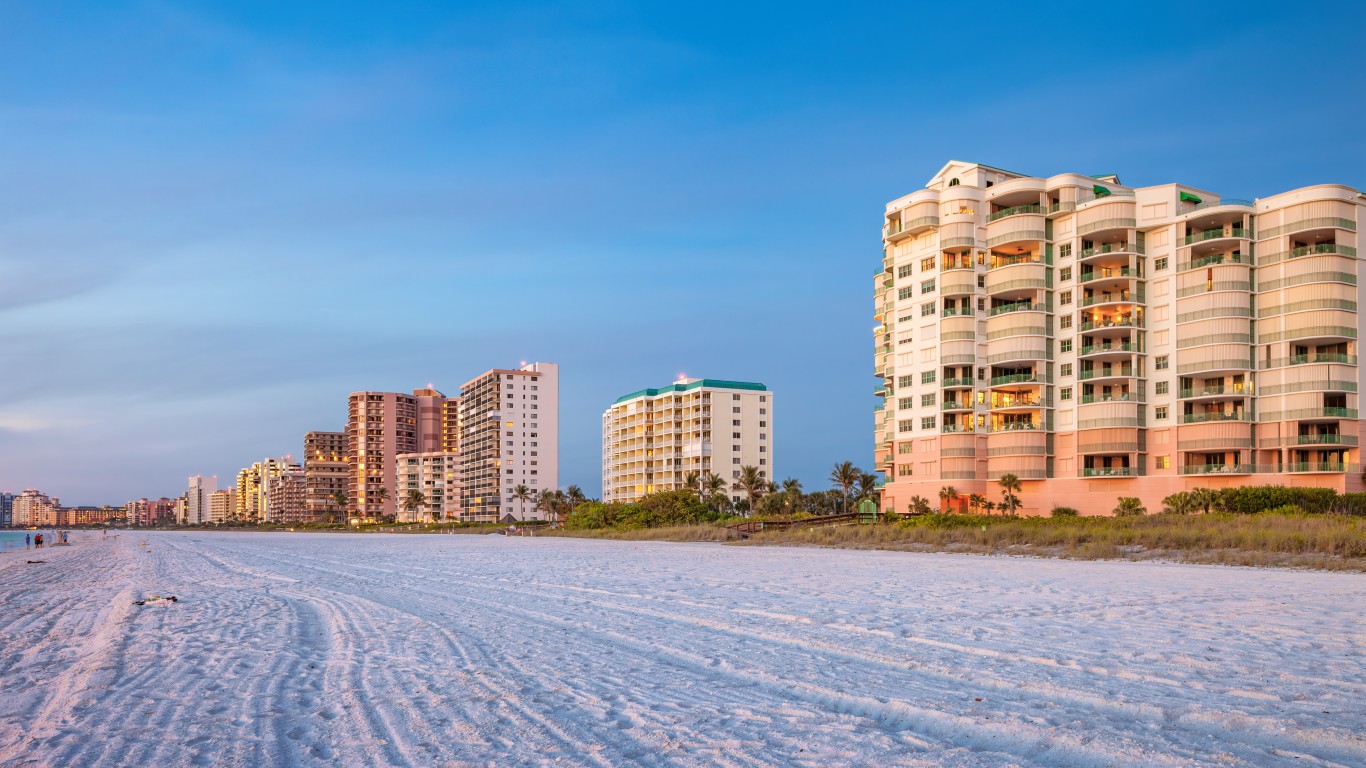
- Relative change in overall cost of living from 2020 to 2023: 6.71 percentage points faster than national increase
- Overall cost of living in 2023: 5.81% higher than U.S. average
- Overall cost of living in 2020: 0.90% lower than U.S. average
- Relative change in goods prices from 2020 to 2023: +0.41 percentage points
- Relative change in services prices from 2020 to 2023: +3.53 percentage points
- Relative change in housing prices from 2020 to 2023: +29.72 percentage points
- Relative change in utilities prices from 2020 to 2023: +5.77 percentage points
1. Madera, CA

- Relative change in overall cost of living from 2020 to 2023: 8.82 percentage points faster than national increase
- Overall cost of living in 2023: 2.95% higher than U.S. average
- Overall cost of living in 2020: 5.88% lower than U.S. average
- Relative change in goods prices from 2020 to 2023: +0.07 percentage points
- Relative change in services prices from 2020 to 2023: +3.84 percentage points
- Relative change in housing prices from 2020 to 2023: +28.58 percentage points
- Relative change in utilities prices from 2020 to 2023: +8.33 percentage points
The post These American Cities Have Been Hit the Hardest by Inflation appeared first on 24/7 Wall St..