


The Stock Market Is Plunging: Here's How Far the Dow Jones, S&P 500, and Nasdaq Can Drop, According to a Historically Flawless Indicator
More than 150 years of back-tested data paints a clear picture of what may come next for Wall Street's major stock indexes.

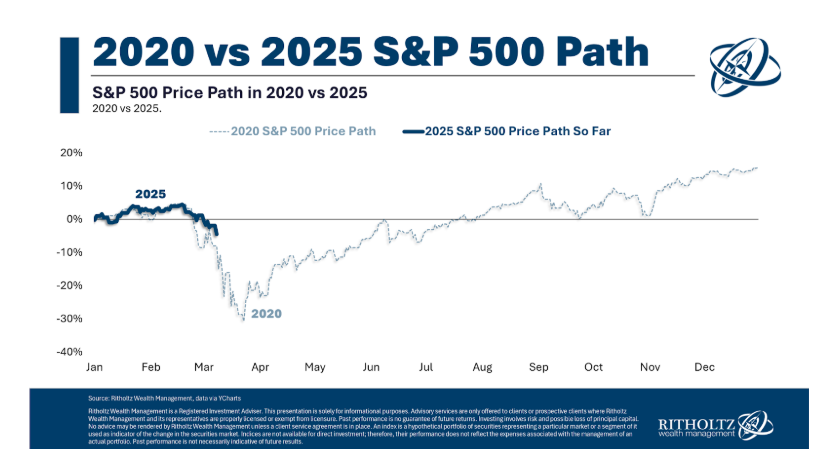
The past few weeks have served as a good reminder that the stock market wouldn't be a "market" unless equities were able to move in both directions. While uptrends have handily outlasted downdrafts spanning more than a century, it's the emotion-driven moves lower that tend to garner all the attention.
On Monday, March 10, all three of Wall Street's major stock indexes struggled mightily. The ageless Dow Jones Industrial Average (DJINDICES: ^DJI), benchmark S&P 500 (SNPINDEX: ^GSPC), and innovation-powered Nasdaq Composite (NASDAQINDEX: ^IXIC) respectively lost 890, 156, and 728 points. This represented the Nasdaq's third-largest daily point loss in its storied history, and marked the S&P 500's ninth-biggest single-session point decline.
These moves lower are even more dramatic when compared to their recent all-time closing highs. As of the closing bell on March 10, the Dow Jones and S&P 500 were 6.9% and 8.6% below their respective closing peaks, while the Nasdaq Composite was firmly in correction territory, with a loss of 13.4%. Nearly the entirety of the Nasdaq's decline has occurred in a 13-session stretch.