


November Non-OPEC and World Oil Production Rose
By Ovi The focus of this post is an overview of World oil production along with a more detailed review of the top 11 Non-OPEC oil producing countries. OPEC production is covered in a separate post. Below are a number of Crude plus Condensate (C + C) production charts, usually shortened to “oil”, for oil […]
By Ovi
The focus of this post is an overview of World oil production along with a more detailed review of the top 11 Non-OPEC oil producing countries. OPEC production is covered in a separate post.
Below are a number of Crude plus Condensate (C + C) production charts, usually shortened to “oil”, for oil producing countries. The charts are created from data provided by the EIA’s International Energy Statistics and are updated to November 2024. This is the latest and most detailed/complete World oil production information available. Information from other sources such as OPEC, the STEO and country specific sites such as Brazil, Norway, Mexico and China is used to provide a short term outlook.
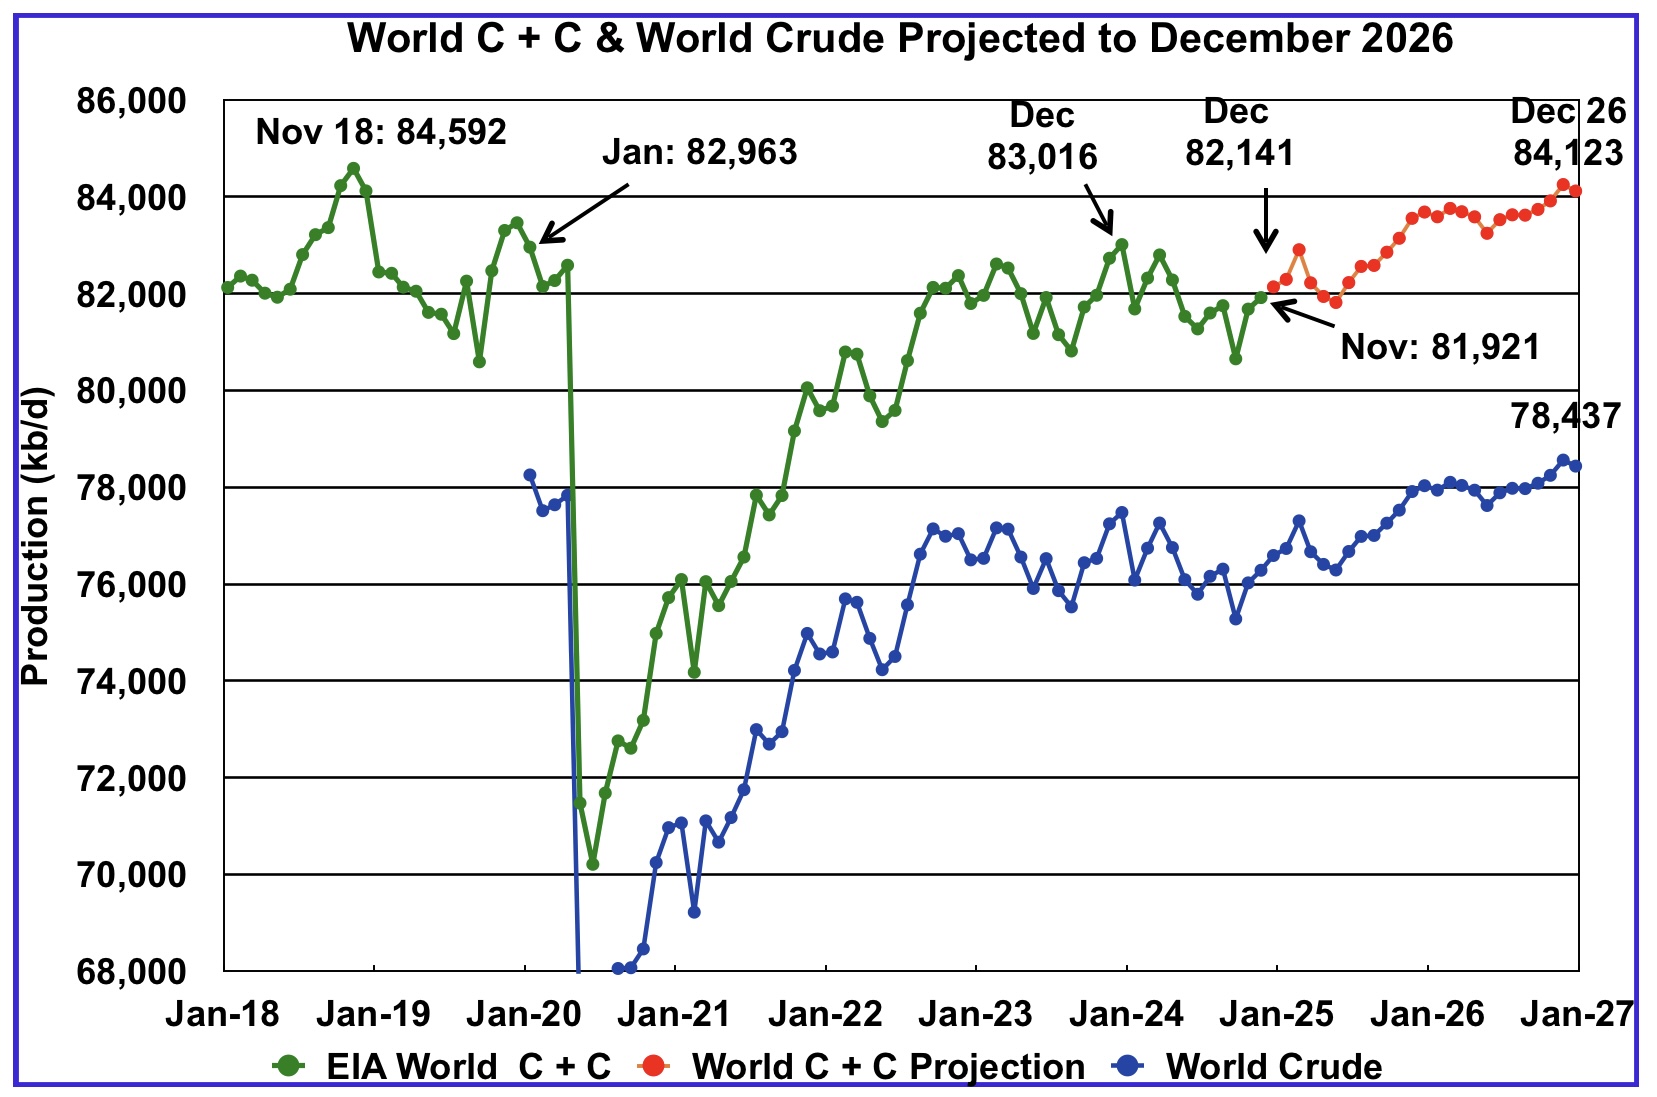
World oil production increased by 238 kb/d in November to 81,921 kb/d, green graph. The largest increases came from Libya, 110 kb/d and Kazakhstan, 164 kb/d. December’s World oil production is projected to increase by 220 kb/d to 82,141 kb/d.
This chart also projects World C + C production out to December 2026. It uses the March 2025 STEO report along with the International Energy Statistics to make the projection.
For December 2026, production is projected to be 84,123 kb/d. The December 2026 oil production is lower than the November 2018 peak by 469 kb/d. December 2026 production has been revised down by 383 kb/d from the previous report. December 2026 crude has been downwardly revised by 357 kb/d.
From December 2023 to December 2026, World oil production is estimated to increase by 1,107 kb/d.
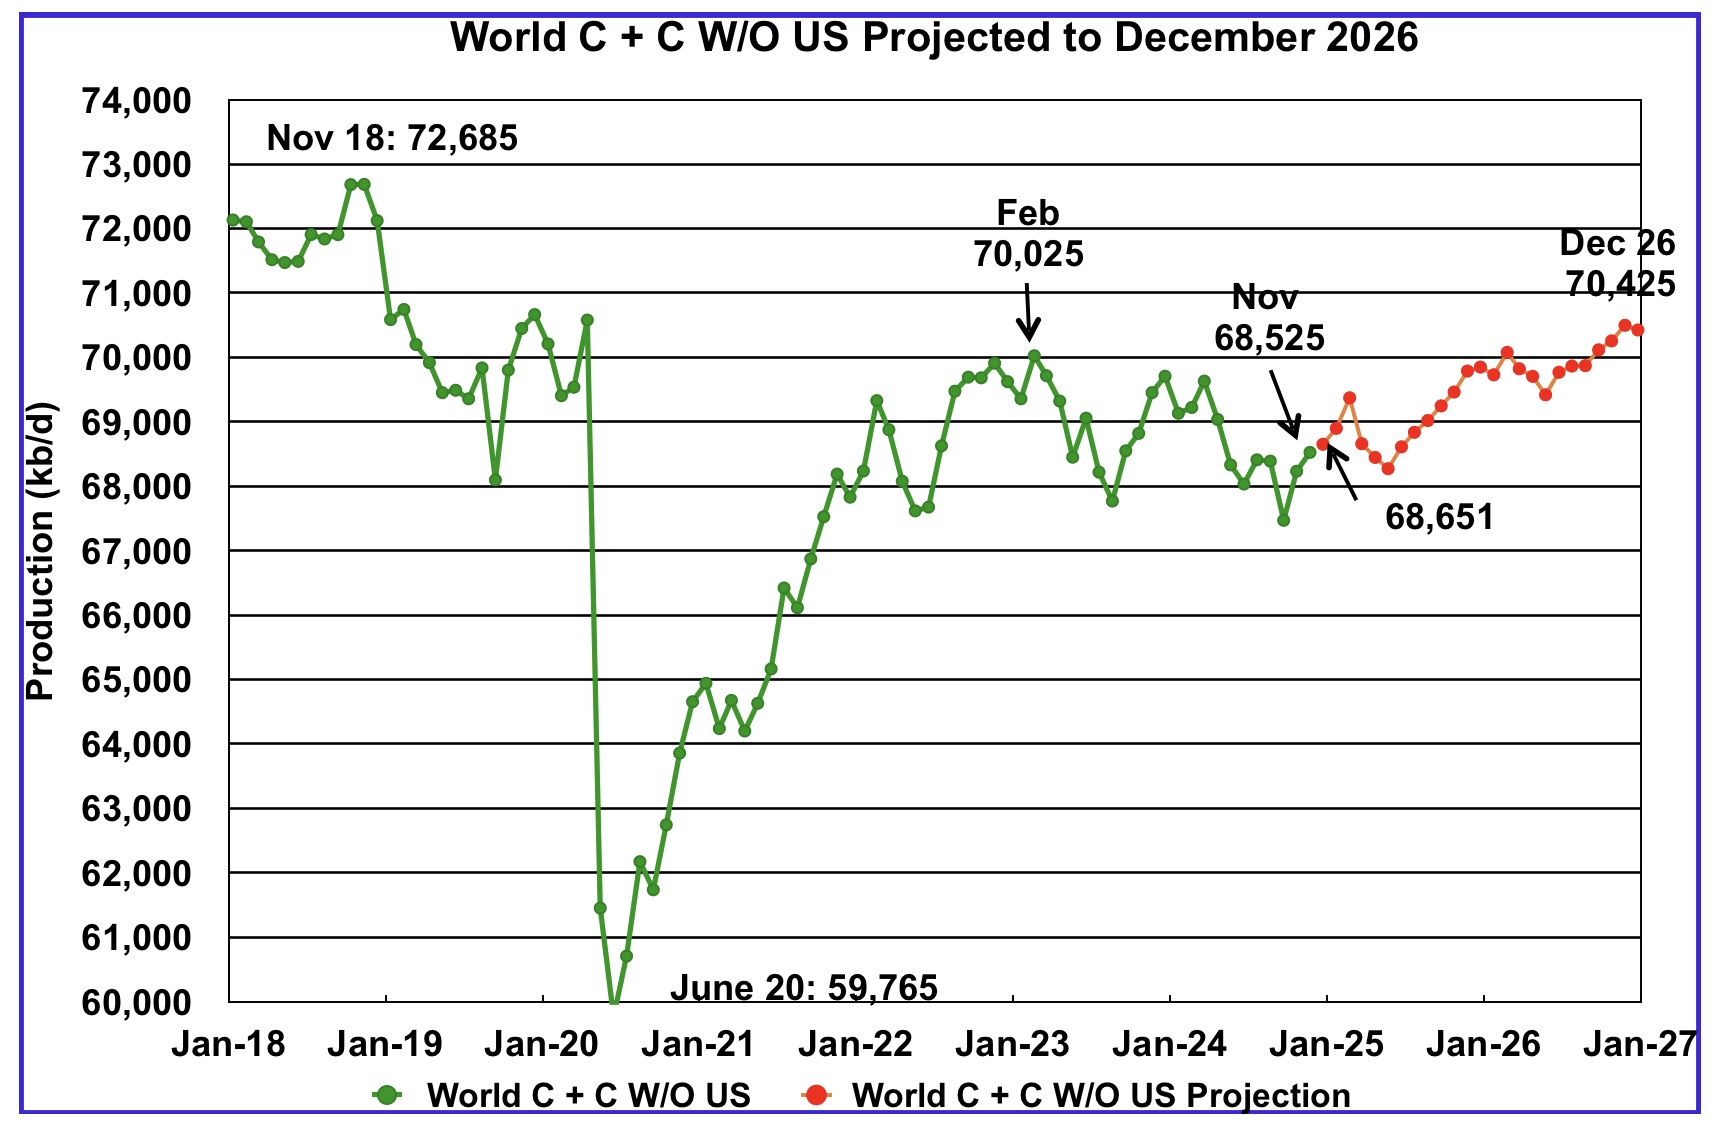
November World oil output without the US increased by 293 kb/d to 68,525 kb/d. December’s production is expected to increase by 126 kb/d to 68,651 kb/d.
The projection is forecasting that December 2026 crude output will be 70,425 kb/d. Note that the December 2026 output is 2,260 kb/d lower than the November 2018 peak of 72,685 kb/d.
World oil production W/O the U.S. from December 2024 to December 2026 is forecast to increase by a total of 1,874 kb/d.
A Different Perspective on World Oil Production
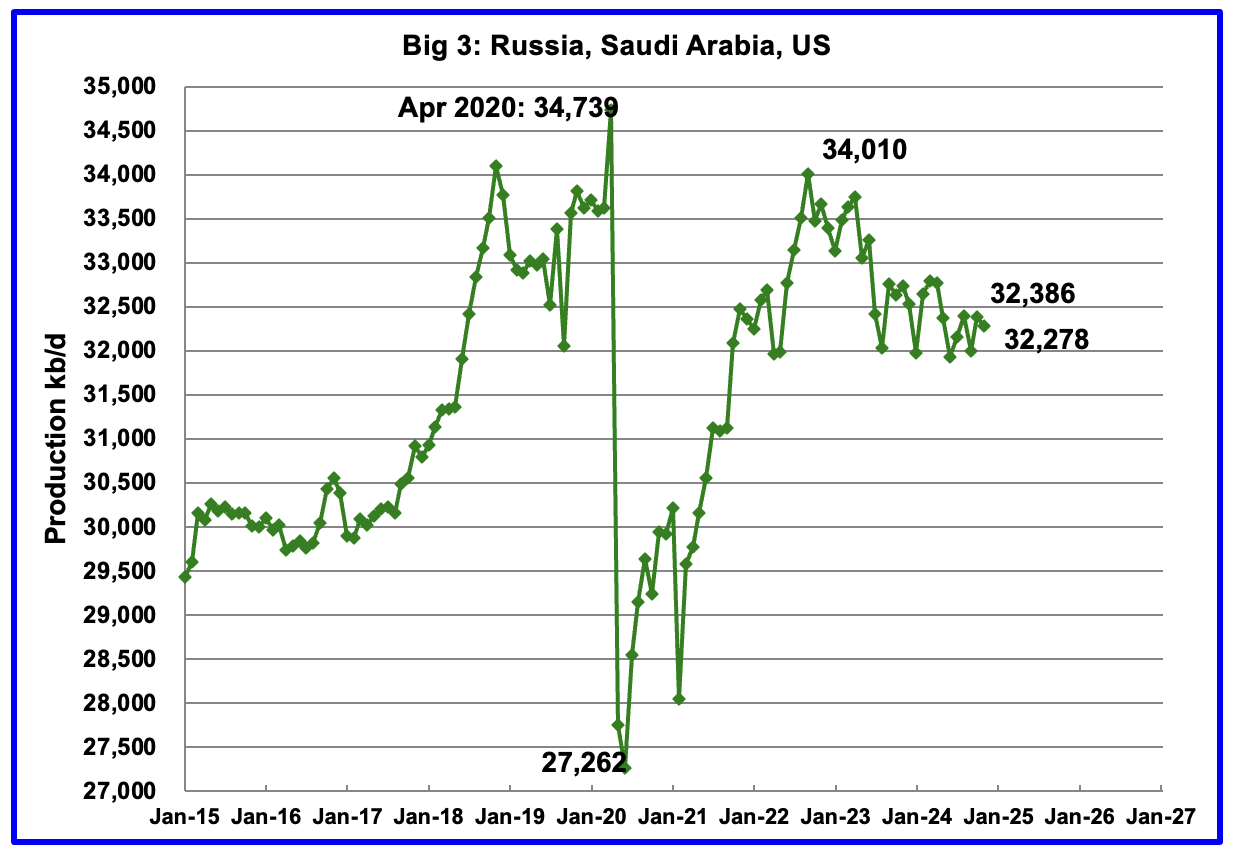
Peak production in the Big 3 occurred in April 2020 at a rate of 34,739 kb/d. The peak was associated with a large production increase from Saudi Arabia. Post covid, production peaked at 34,010 kb/d in September 2022. The production decline since then is primarily due to cutbacks by Saudi Arabia and Russia.
November’s Big 3 oil production decreased by 108 kb/d to 32,278 kb/d. Production in November was 1,732 kb/d lower than the September 2022 post pandemic high of 34,010 kb/d. Of the Big 3, the country with the largest December decrease was the U.S. with a decline of 122 kb/d, see Table below.
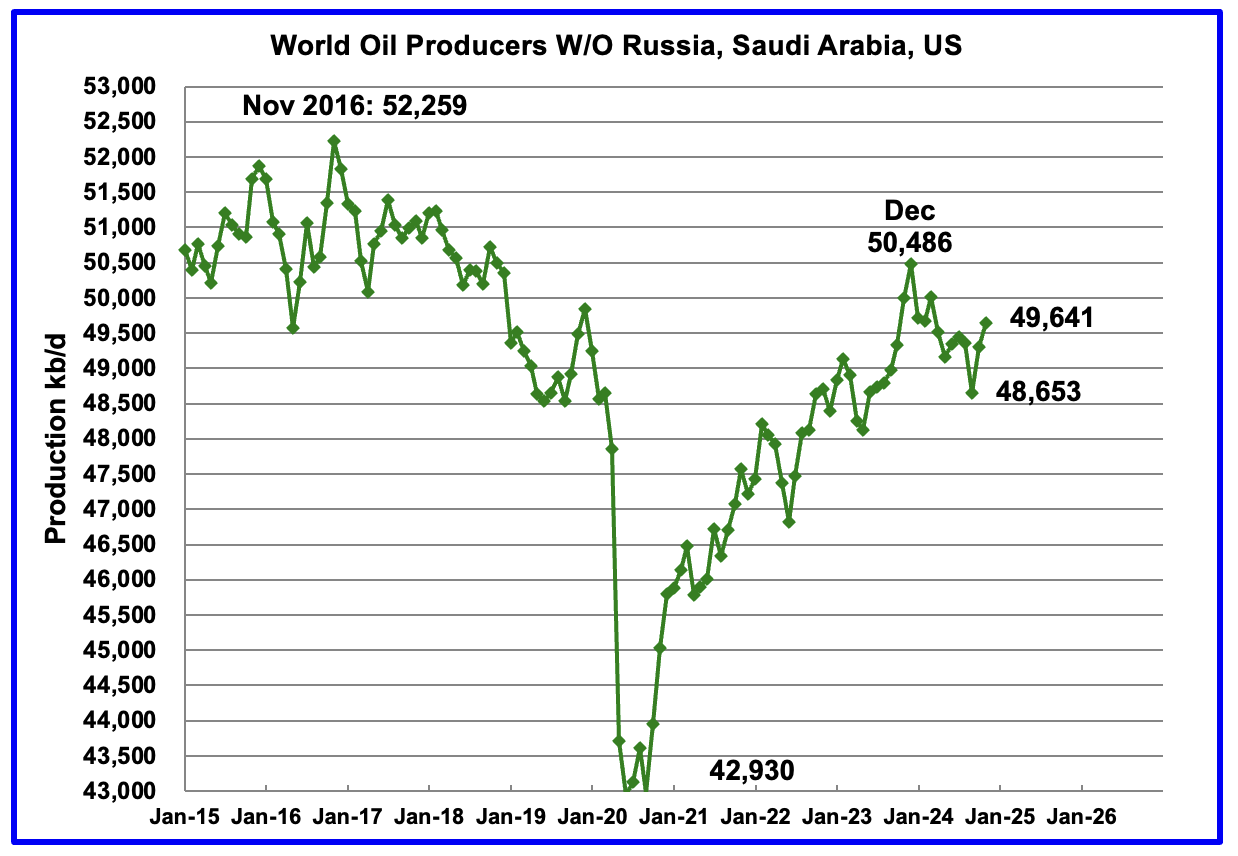
Production in the Remaining Countries had been slowly increasing since the September 2020 low of 42,930 kb/d. Output in December 2023 reached 50,486 kb/d, a new post covid high. However production began falling in January 2024 and been lower ever since. December’s production increased by 344 kb/d to 49,641 kb/d and is now 845 kb/d lower than December 2023.
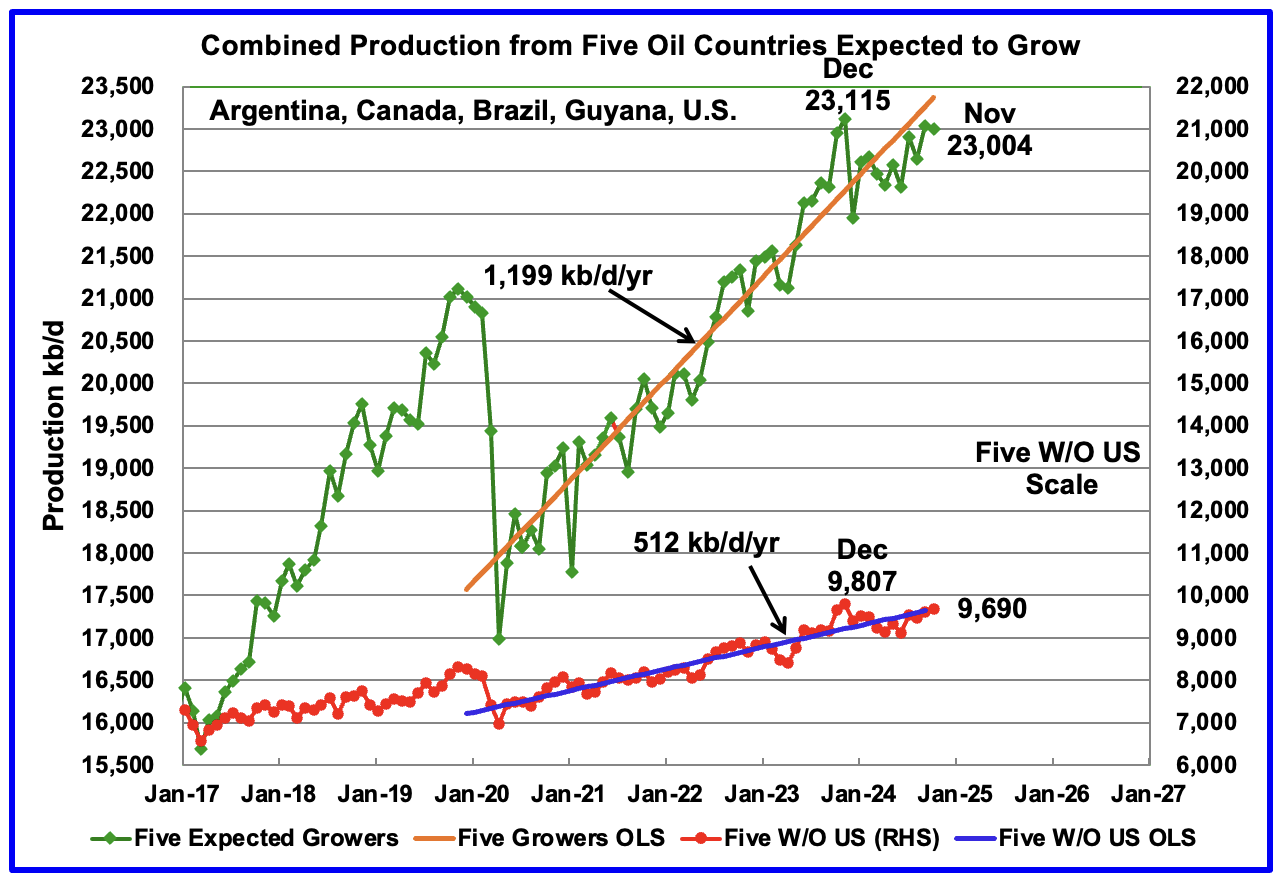
This chart was first posted a few of months back and shows the combined oil production from five Non-OPEC countries, Argentina, Brazil, Canada, Guyana and the U.S. whose oil production is expected to grow. These five countries are often cited by OPEC and the IEA for being capable of meeting the increasing World oil demand for next year while OPEC withholds its oil from the market. For these five countries, production from April 2020 to August 2024 rose at an average rate of 1,199 kb/d/year as shown by the orange OLS line.
To show the impact of US growth over the past 5 years, U.S. production was removed from the five countries and that graph is shown in red. The production growth slope for the remaining four countries has been reduced by 687 kb/d/yr to 512 kb/d/yr.
November production has been added to the five growers chart, down 34 kb/d to 23,004 kb/d. For the Five growers W/O U.S., November production rose by 89 kb/d to 9,690 kb/d.
The OLS lines have not been updated and will not be updated going forward unless there is a strong indication that production is rising.
Production up to December 2023 may be a situation where the past is not a good indicator of the future. In this case it may be more important to focus on what has happened to production after December 2023 rather than before.
Countries Ranked by Oil Production
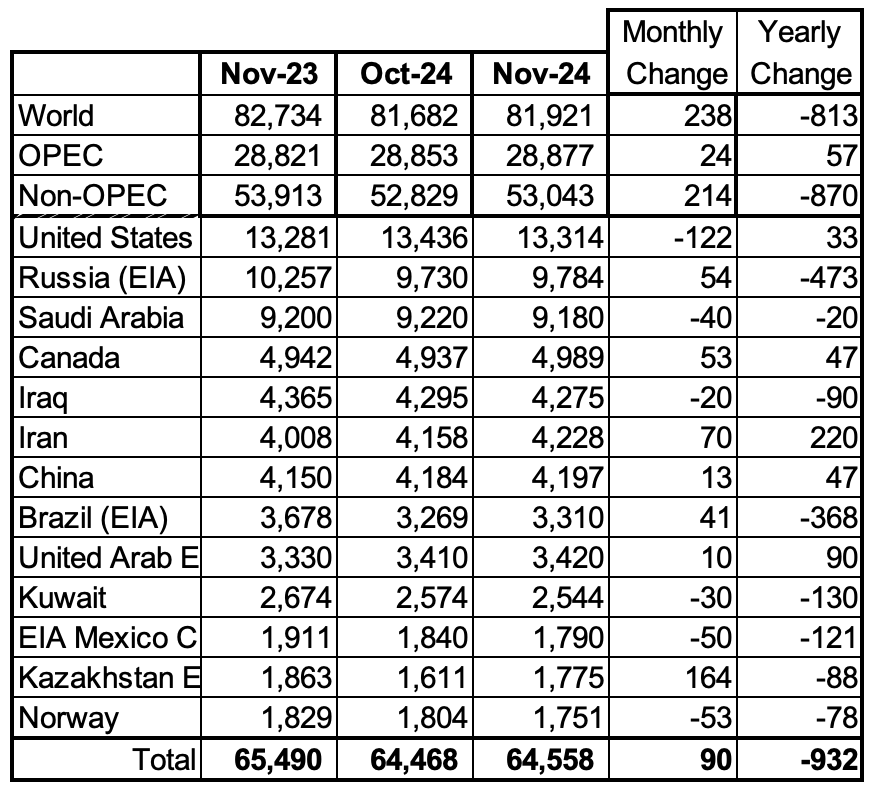
Above are listed the World’s 13th largest oil producing countries. In November 2024, these 13 countries produced 78.8% of the World’s oil. On a MoM basis, production increased by 900 kb/d in these 13 countries while on a YOY basis, production dropped by 932 kb/d. Note the large YoY production increase in Iran and the large drop in Brazil and Russia. Will the upcoming potentially stricter U.S. sanctions on Iran curb/slow that increasing trend?
November Non-OPEC Oil Production Charts
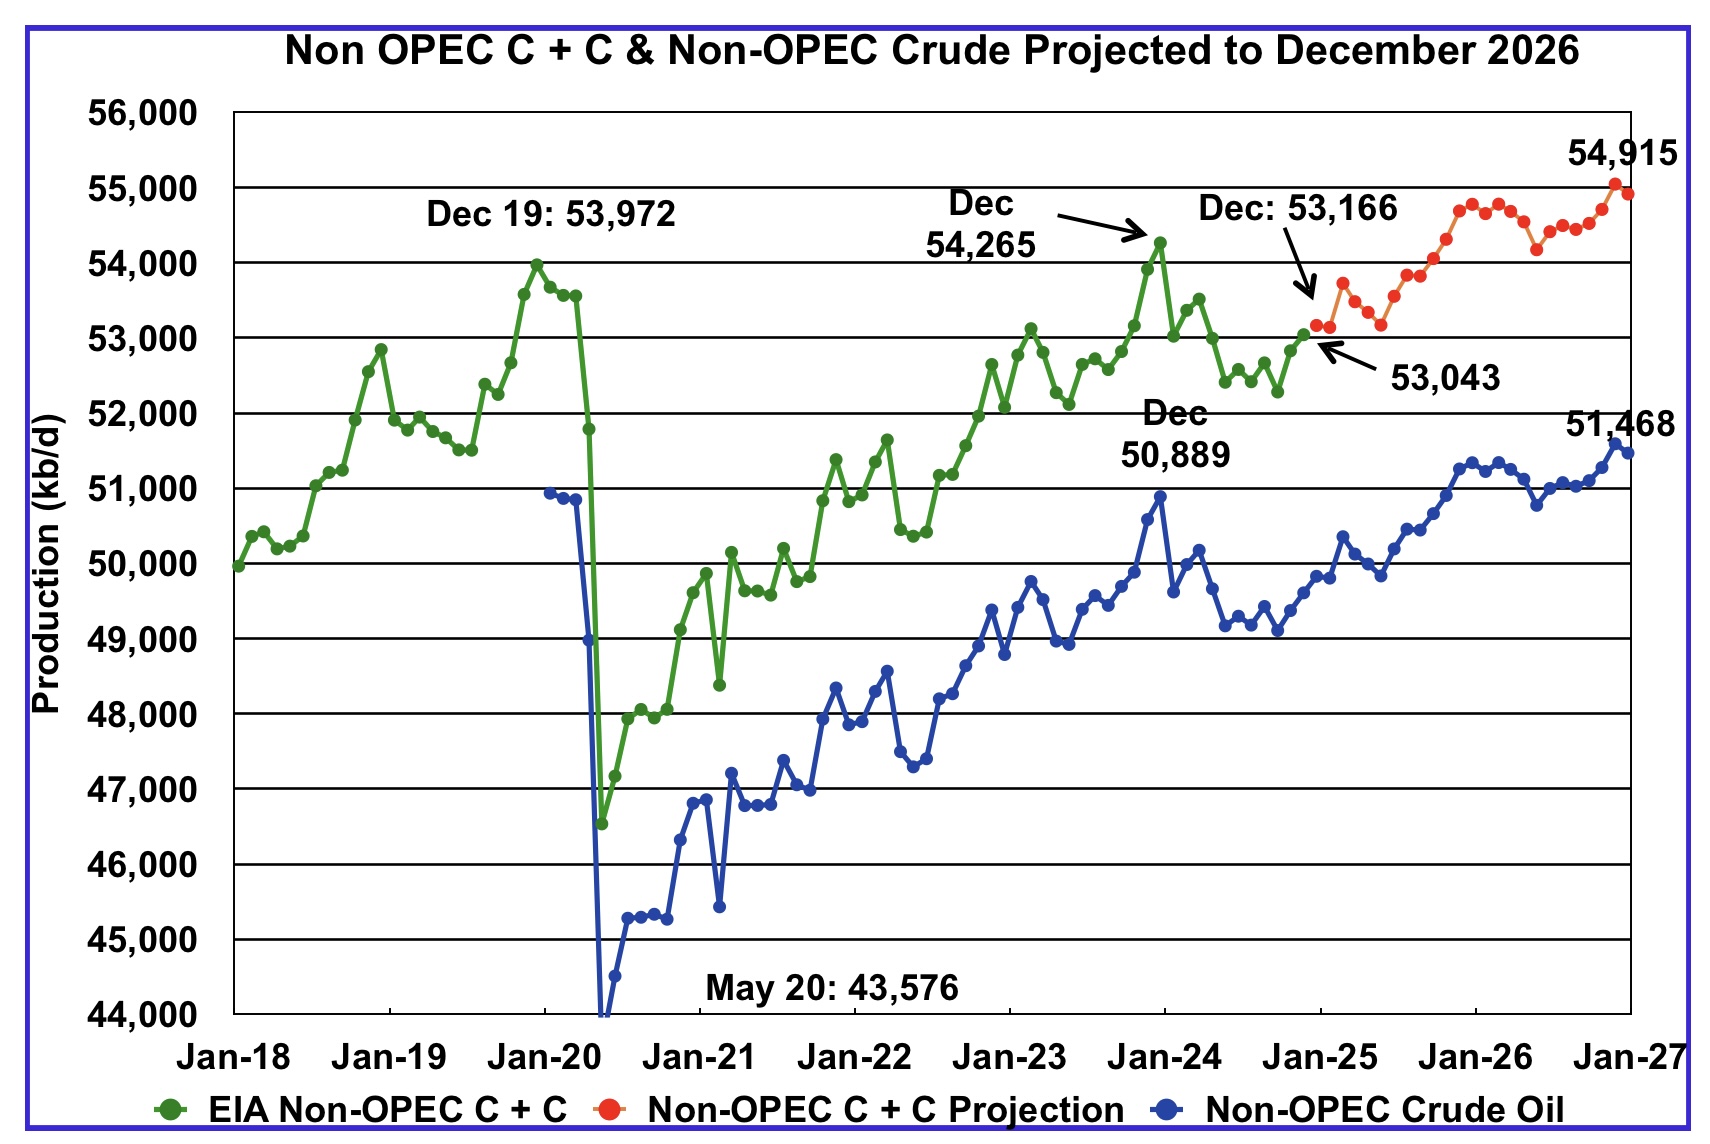
November Non-OPEC oil production increased by 214 kb/d to 53,043 kb/d.
Using data from the March 2025 STEO, a projection for Non-OPEC oil output was made for the period December 2024 to December 2026. (Red graph). Output is expected to reach 54,915 kb/d in December 2026.
From December 2023 to December 2026, oil production in Non-OPEC countries is expected to increase by 650 kb/d.
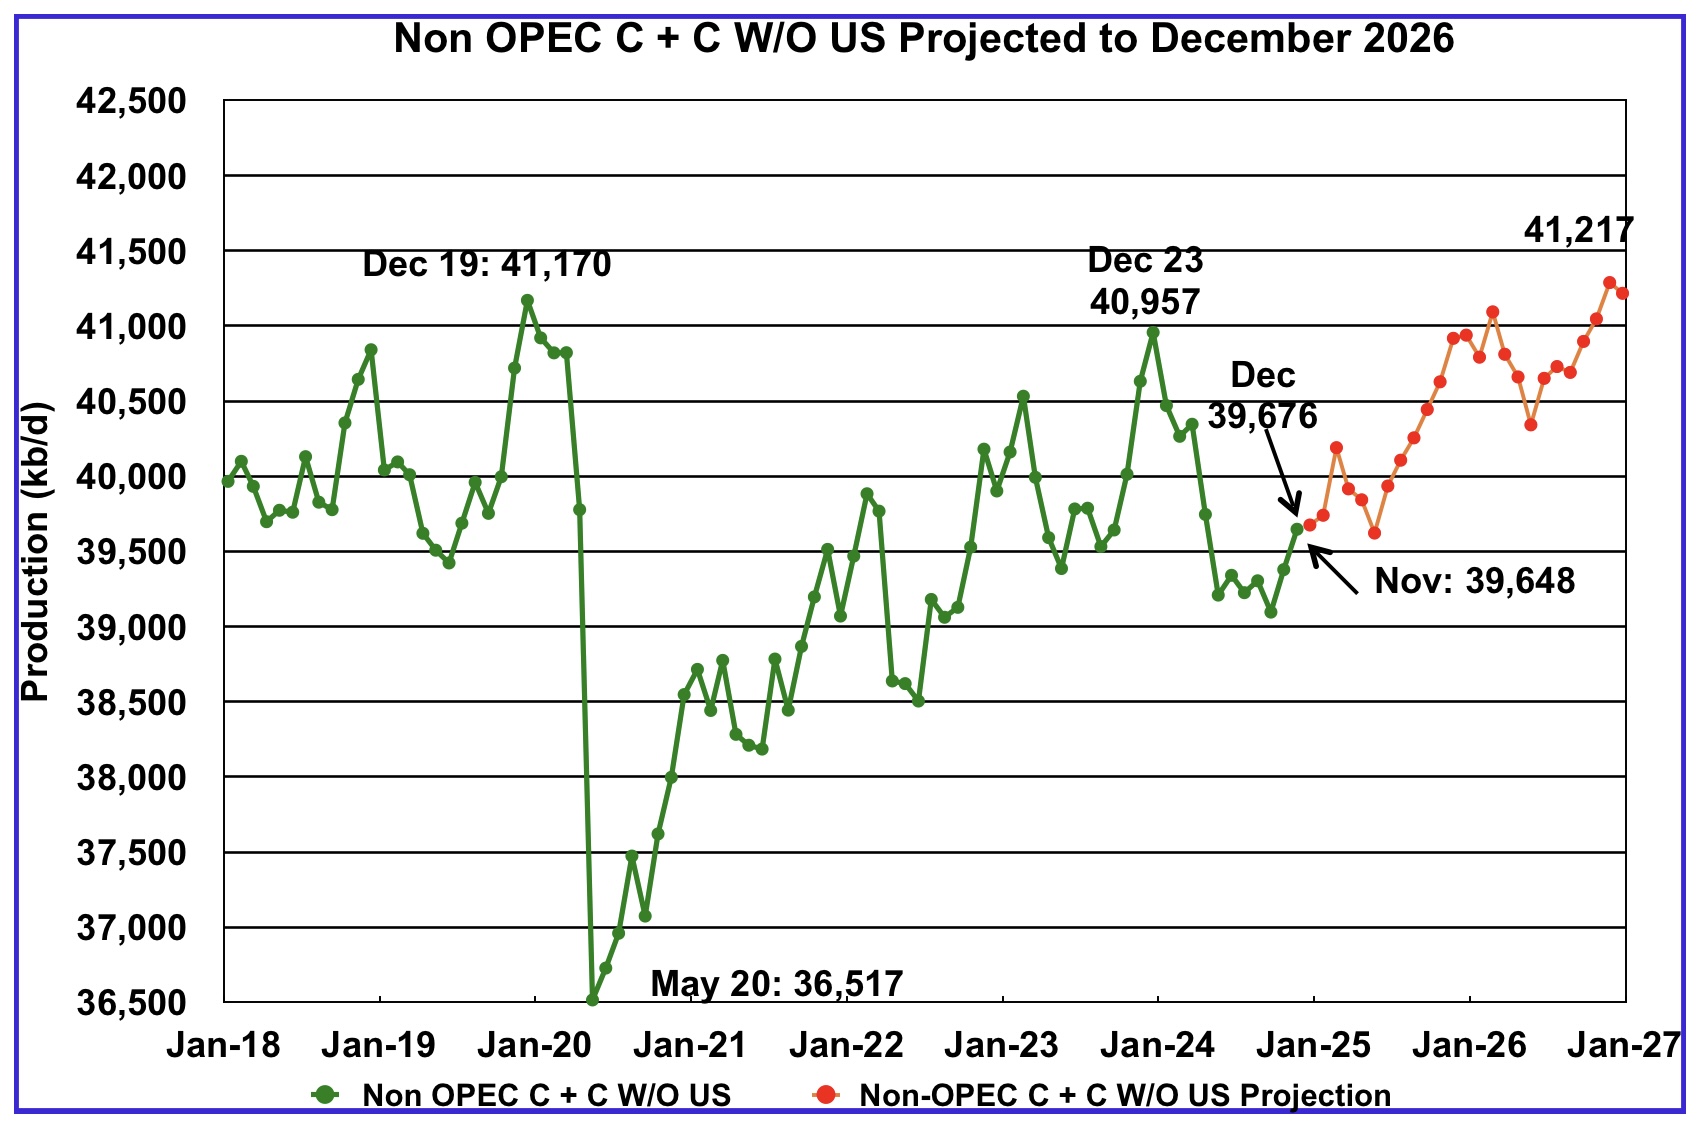
November’s Non-OPEC W/O US oil production rose by 336 kb/d to 39,648 kb/d. December’s production is projected to rise by 7 kb/d to 39,655 kb/d.
From December 2023 to December 2026, production in Non-OPEC countries W/O the U.S. is expected to increase by 260 kb/d or 87 kb/d/yr. December 2026 production is projected to be 47 kb/d higher than December 2019, essentially no growth over seven years.
Non-OPEC Oil Countries Ranked by Production
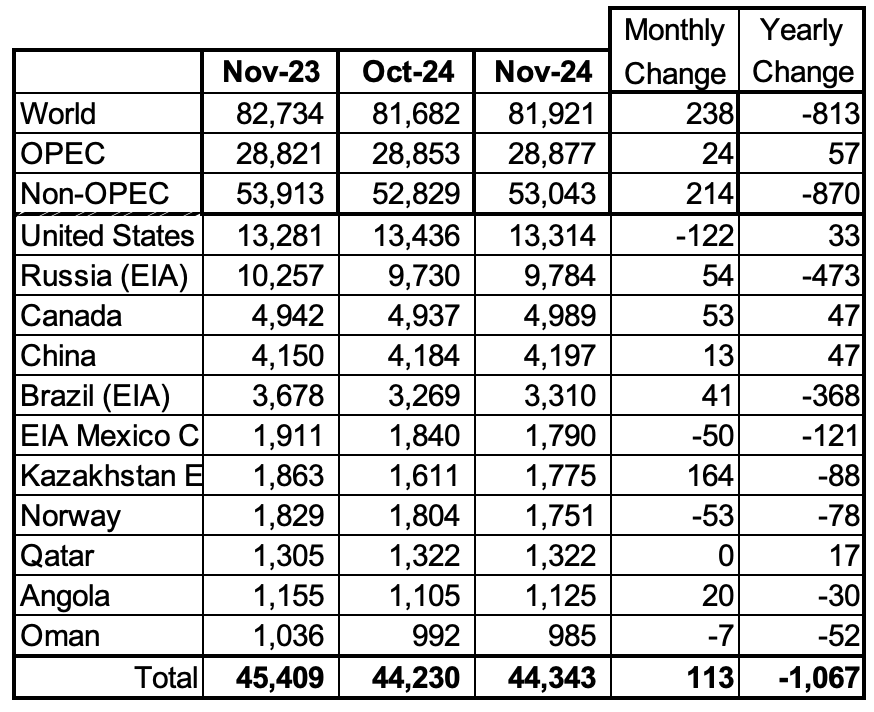
Listed above are the World’s 11 largest Non-OPEC producers. The original criteria for inclusion in the table was that all of the countries produced more than 1,000 kb/d. Oman has recently fallen below 1,000 kb/d.
November’s production increased by 113 kb/d to 44,343 kb/d for these eleven Non-OPEC countries while as a whole the Non-OPEC countries saw a yearly production loss of 870 kb/d to 53,043 kb/d.
In November 2024, these 11 countries produced 83.6% of all Non-OPEC oil.
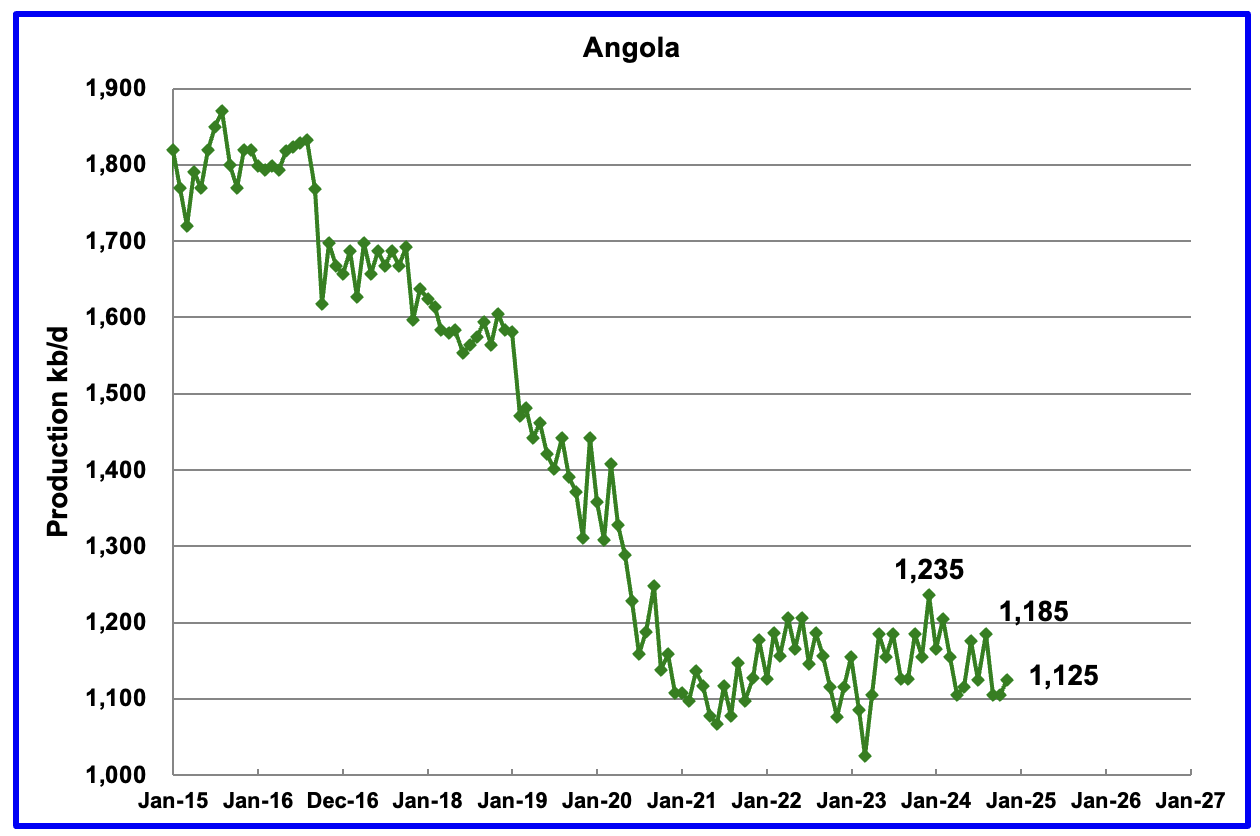
Angola’s November production rose by 20 kb/d to 1,125 kb/d. Since early 2022 Angola’s production appears to have settled into a plateau phase between 1,100 kb/d and 1,200 kb/d.
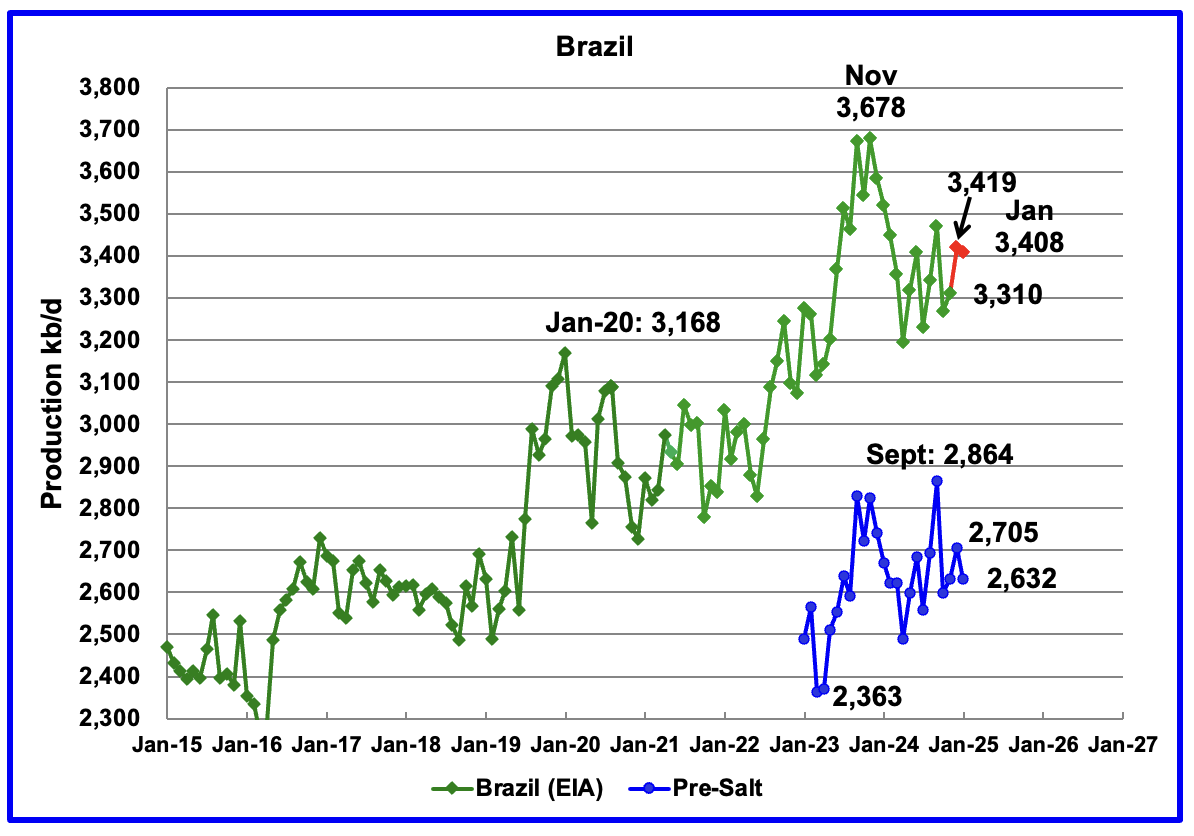
The EIA reported that Brazil’s November production increased by 41 kb/d to 3,310 kb/d.
Brazil’s National Petroleum Association (BNPA) reported that production increased in December and dropped in January to 3,408 kb/d The pre-salt graph tracks Brazil’s trend in the crude oil graph. For December, pre-salt production increased by 74 kb/d to 2,705 kb/d and dropped to 2,632 kb/d in January.
The December increase could be related to the addition of the two new floating platforms. The December OPEC report states that two new floating production storage and offloading (FPSO) platforms came online in November. It also mentions operational issues and slow ramp-ups in several offshore platforms continue to be an issue.
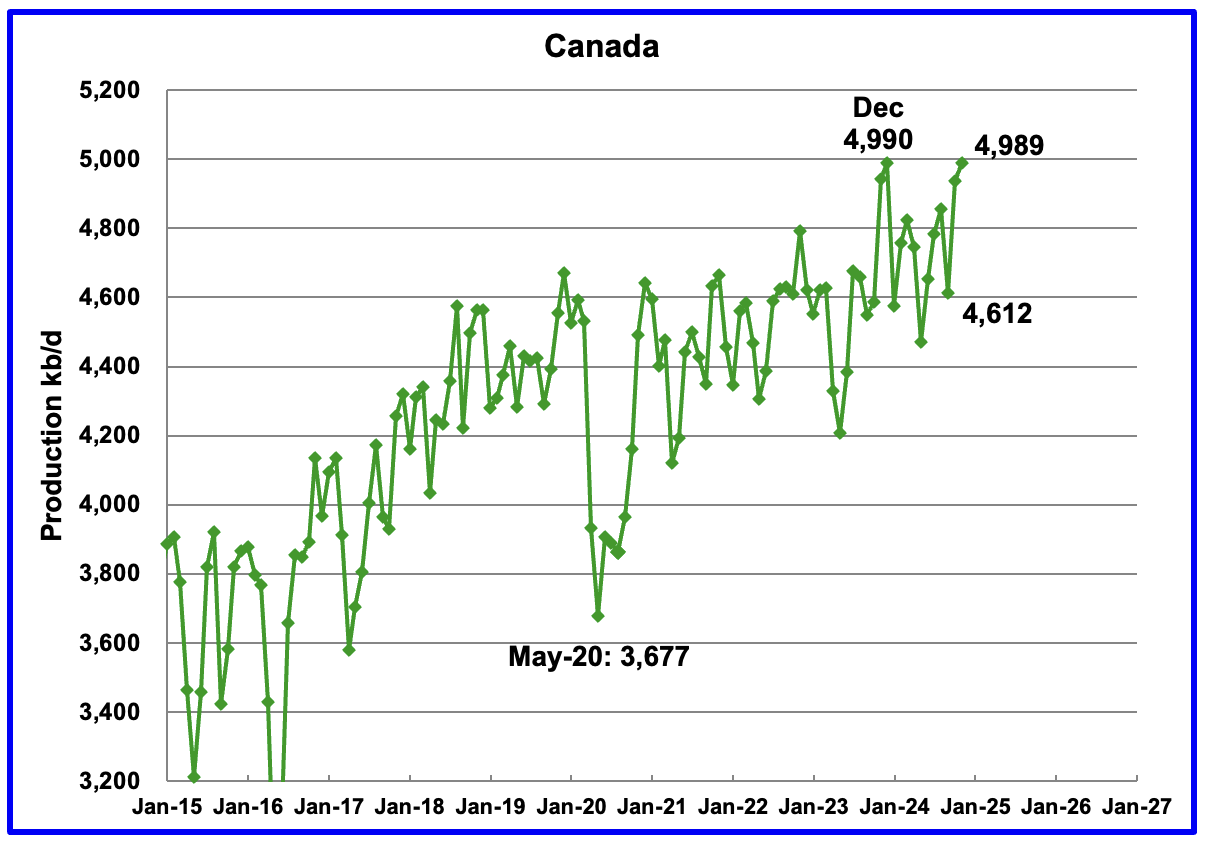
Canada’s production increased by 53 kb/d in November to 4,989 kb/d. The increase is primarily due to site restarts associated with the previous month’s wild fires in the oil sands area around Fort McMurray and the completion of maintenance on oil sands cokers.
With tariffs looming, Canada is now grappling with the effects of having to ship 75% of its oil to the US. Canada has woken up to the risks associated with becoming too close/dependant to a trading neighbour. At this time the anticipated tariff on oil is 10%.
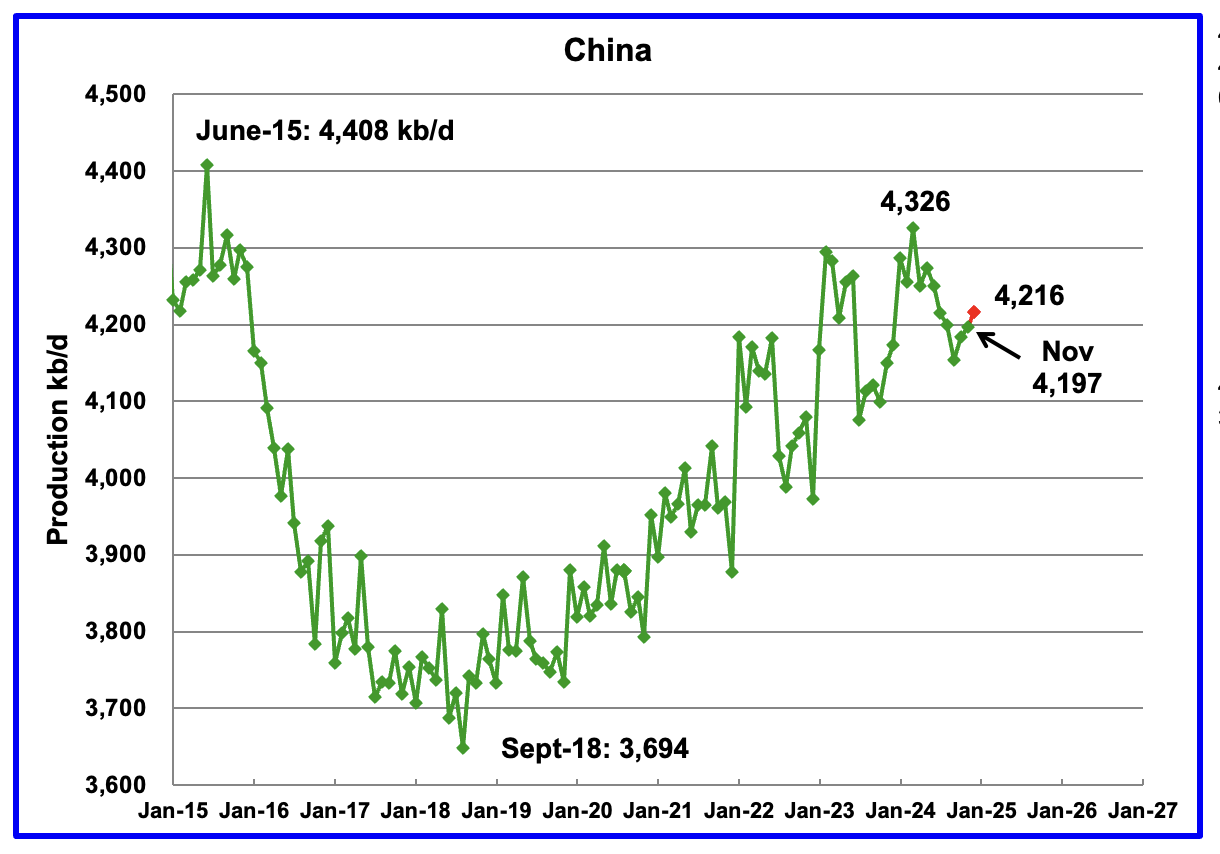
The EIA reported China’s November oil output increased by 13 kb/d to 4,197 kb/d.
The China National Bureau of Statistics reported production for December. December production added 19 kb/d to 4,216 kb/d, red markers.
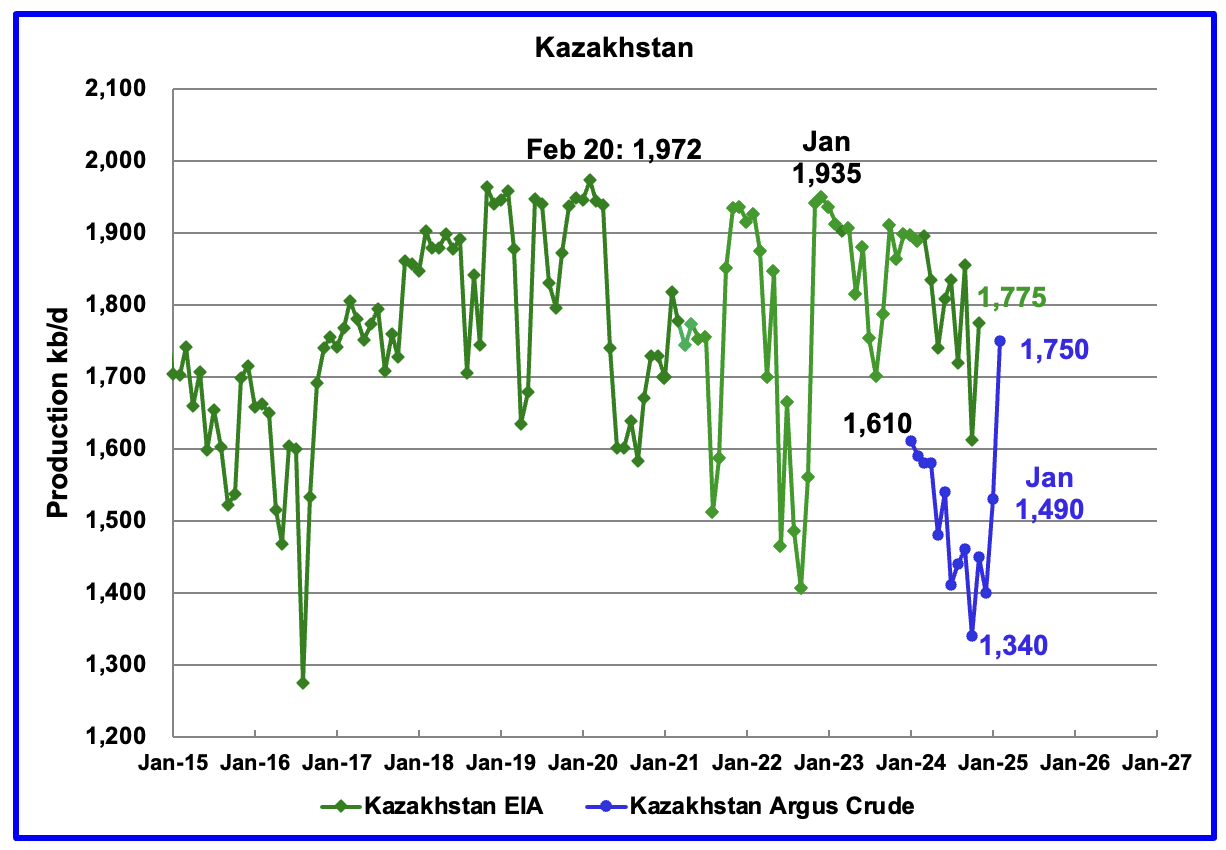
According to the EIA, Kazakhstan’s oil output increased by 164 kb/d in November to 1,775 kb/d.
Kazakhstan’s recent pre-salt crude oil production, as reported by Argus, has been added to the chart. In October pre-salt crude production dropped by 120 kb/d to a low 1,340 kb/d. Since then production has risen by 410 kb/d. February production came in at 1,750 kb/d due to a New Field coming online. Note this is Crude whereas the EIA numbers are C + C.
Kazakhstan’s OPEC crude production target is 1,470 kb/d. At 1,750 kb/d, Kazakhstan is 280 kb/d over their target. According to this Article, Kazakhstan seeks Tengiz and Kashagan output cuts from its international operators.
“Increased output from the Tengiz field helped boost Kazakhstan’s production by 297,000 b/d to a record 1.747mn b/d in February, 279,000 b/d above its Opec+ target of 1.468mn b/d. Kazakhstan’s March target of 1.45mn b/d includes an additional 18,000 b/d cut related to its plan to compensate for past overproduction.
The Chevron-led Tengizchevroil consortium launched a third crude production plant at the field in January. This helped boost Tengiz production to 878,000 b/d in February, compared with about 500,000 b/d in mid-January — although part of the increase is explained by the completion of maintenance at another crude unit at Tengiz.”
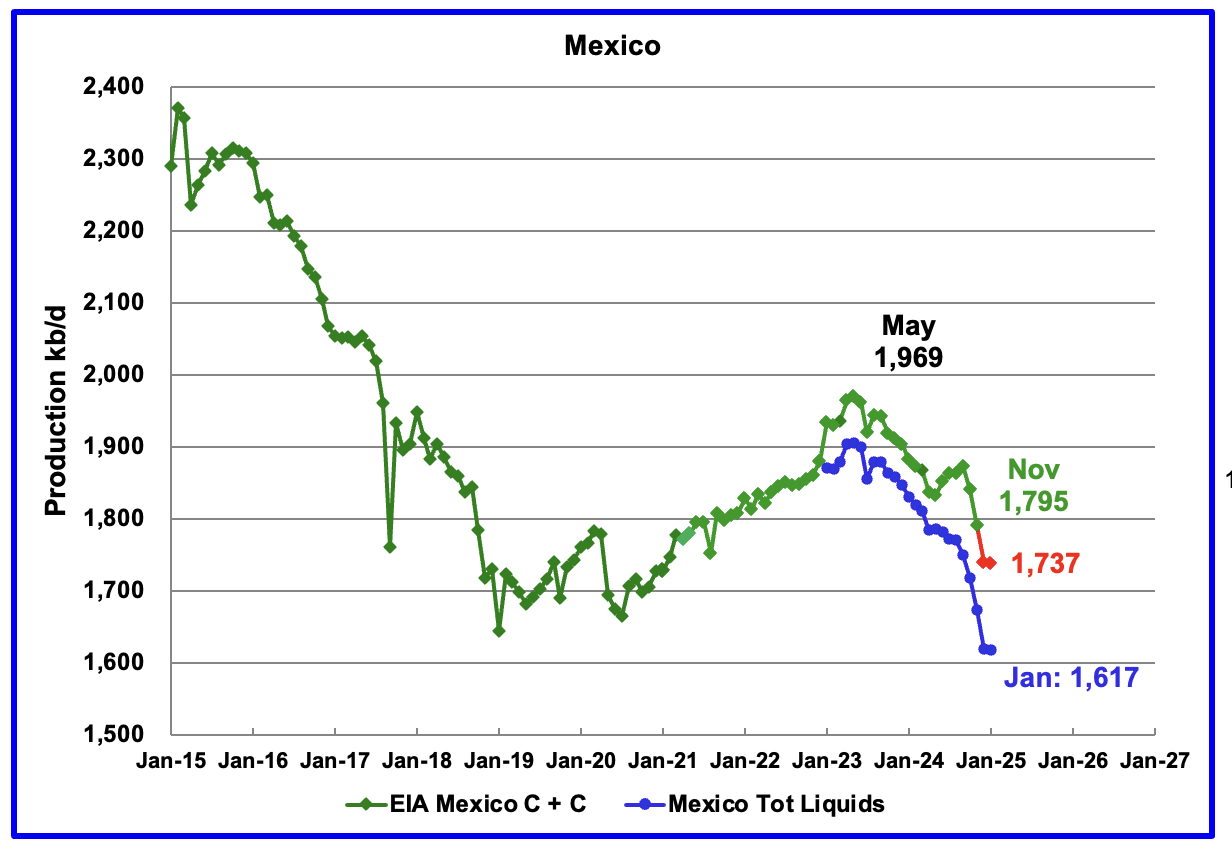
According to the EIA, Mexico’s November output dropped by 45 kb/d to at 1,795 kb/d.
In June 2024, Pemex issued a new and modified oil production report for Heavy, Light and Extra Light oil. It is shown in blue in the chart and it appears that Mexico is not reporting condensate production when compared to the EIA report.
In earlier reports, the EIA would add close to 55 kb/d of condensate to the Pemex report. However for October and November it was increased to 122 kb/d and 117 kb/d respectively. It is not clear if this is the result of better communications with Pemex officials. The condensate addition has been bouncing around 120 kb/d over the last few months.
For December and January production, 120 kb/d have been added to the Pemex production to estimate Mexico’s December and January C + C production, red markers. Note that Mexico’s production, according to Pemex, has continued to fall every month since May 2023, except for one month. However January oil production is little changed from December.
According to this Article, the decline in Mexico’s crude and gas production could accelerate.
“The decline is beyond Pemex control now,” said Alma América Porres Luna, an independent analyst who formerly served as commissioner at the National Hydrocarbons Commission, or CNH, the country’s upstream oil and gas regulator.
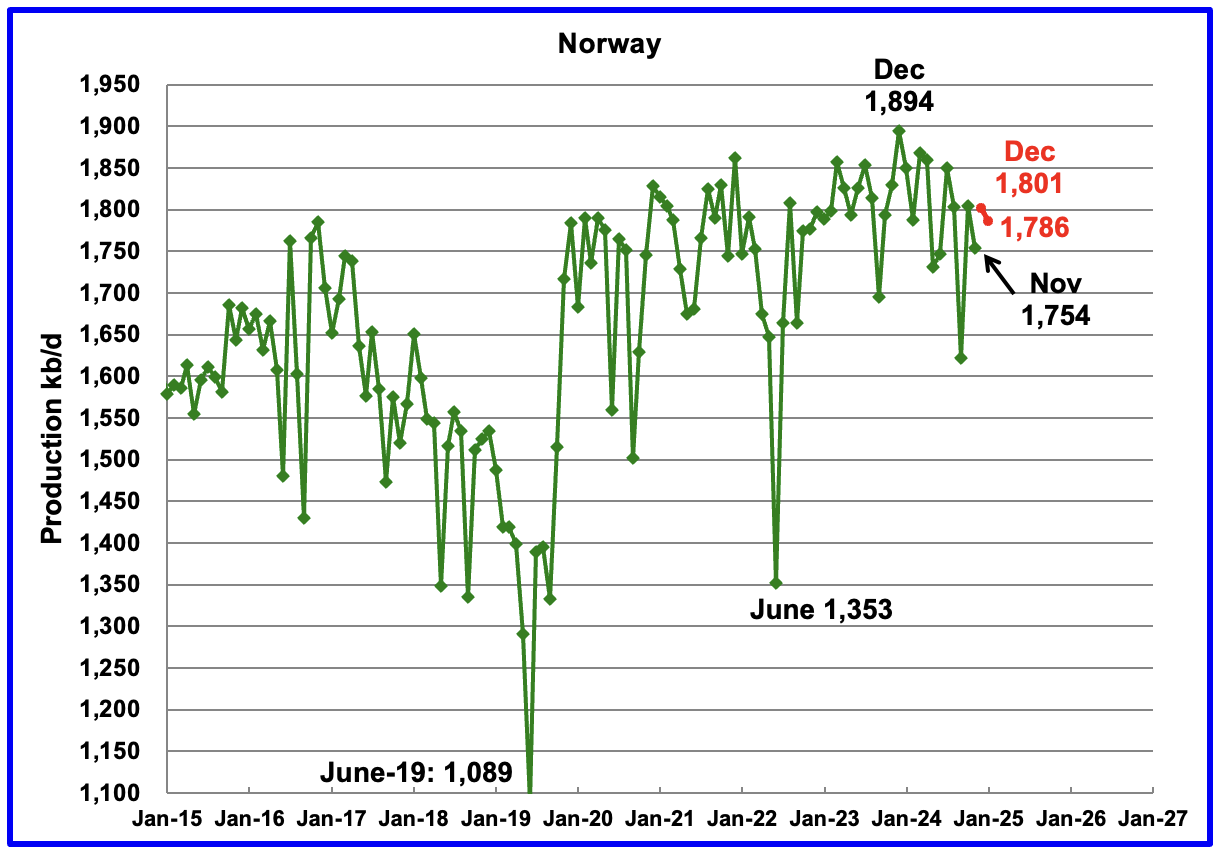
The EIA reported Norway’s November production dropped by 45 kb/d to 1,754 kb/d.
Separately, the Norway Petroleum Directorate (NPD) reported that December production increased by 47 kb/d to 1,801 kb/d and January dropped to 1,786 kb/d, red markers.
The Norway Petroleum Directorship reported that January’s oil production was 2.6% above forecast.
The OPEC February MOMR has this to say for Norway’s 2025 and 2026 oil production. A small production increase for 2025 and then flat. Note this is all liquids.
In 2025, Norwegian liquids production is forecast to grow by 0.1 mb/d to average 2.1 mb/d. Several small-to-large-scale projects are scheduled to ramp up, including Kristin, Eldfisk and Balder/Ringhorne. At the same time, start-ups are expected at the Balder/Ringhome, Norne floating, production, storage and offloading (FPSO), Maria and Kvitebjorn oil field projects. Norway’s Var Energi recently announced the start-up of its Balder X oil project in the North Sea for 2Q25. According to Equinor, the Johan Castberg FPSO is expected to produce the first oil in Norway’s Barents Sea in January or February, after being delayed by bad weather conditions. According to Statistics Norway, total oil and gas investment on the Norwegian continental shelf for 2025 is forecast to rise by about 3%, y-o-y, supporting expected growth this year.
Norwegian liquids production is forecast to drop by about 40 tb/d to average 2.1 mb/d in 2026. Some projects at different scales are scheduled to ramp up in 2026, such as Johan Castberg, Edvard Grieg, Balder/Ringhorne, Heidrun, Grane, Valhall and Ivar Aasen. Simultaneously, start-ups are expected at limited assets, such as the Symra and Edvard Grieg oil field projects.
Comparing the chart with the OPEC statement, it appears that the December 2023 output of 1,894 kb/d is the peak for Norway’s oil production. That peak was associated with the Johan Sverdrup 2 coming online a year before. S & P Global reports that Johan Sverdrup oil field is expected to start declining from late-2024/early-2025.
“Europe’s highest producing oil field, Johan Sverdrup, is expected to start declining in late-2024 or early-2025 — earlier than expected — amid increased signs of water production at some wells”
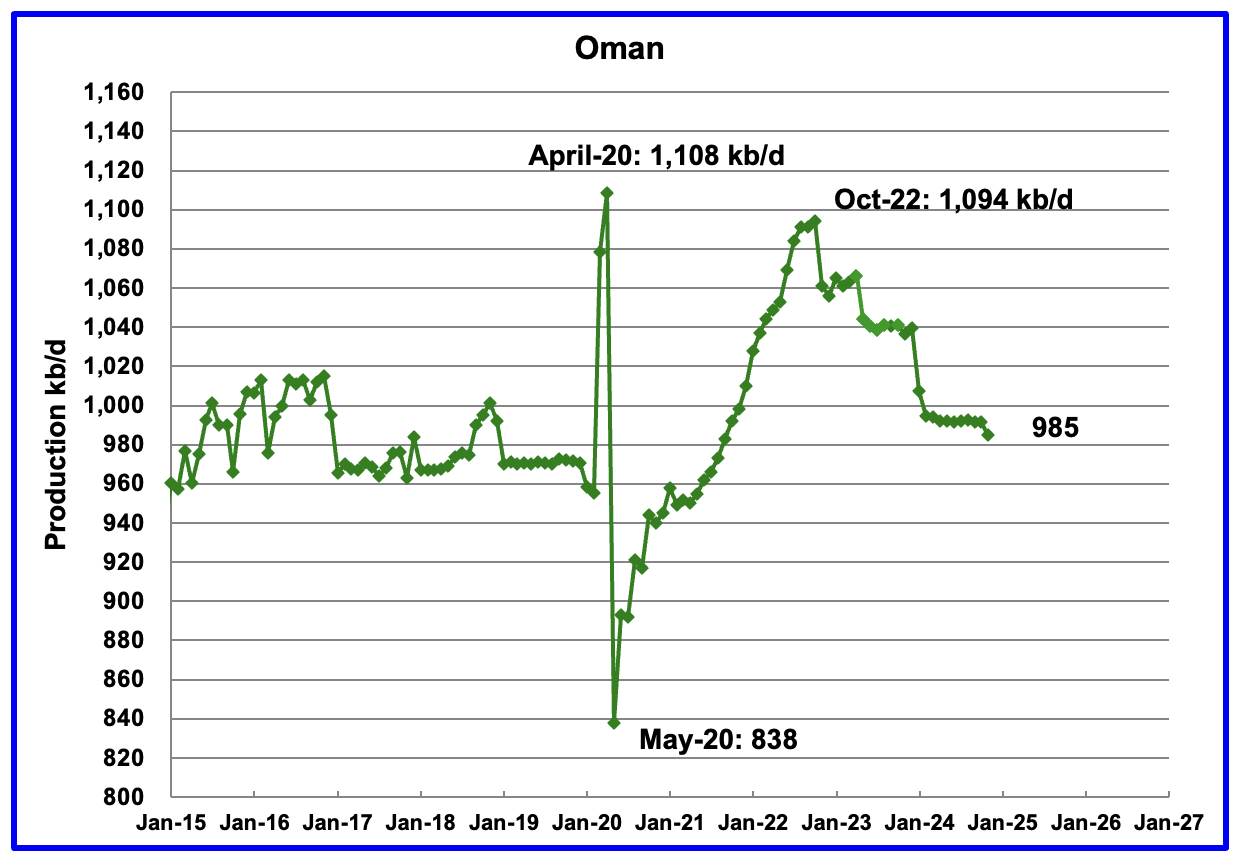
Oman’s production had risen very consistently since the low of May 2020. However production began to drop in November 2022. According to the EIA, November’s output dropped by 7 kb/d to 985 kb/d.
Oman produces a lot of condensate. The OPEC MOMR reports that crude production in November was 764 kb/d, 228 kb/d lower than the EIA’s C + C.
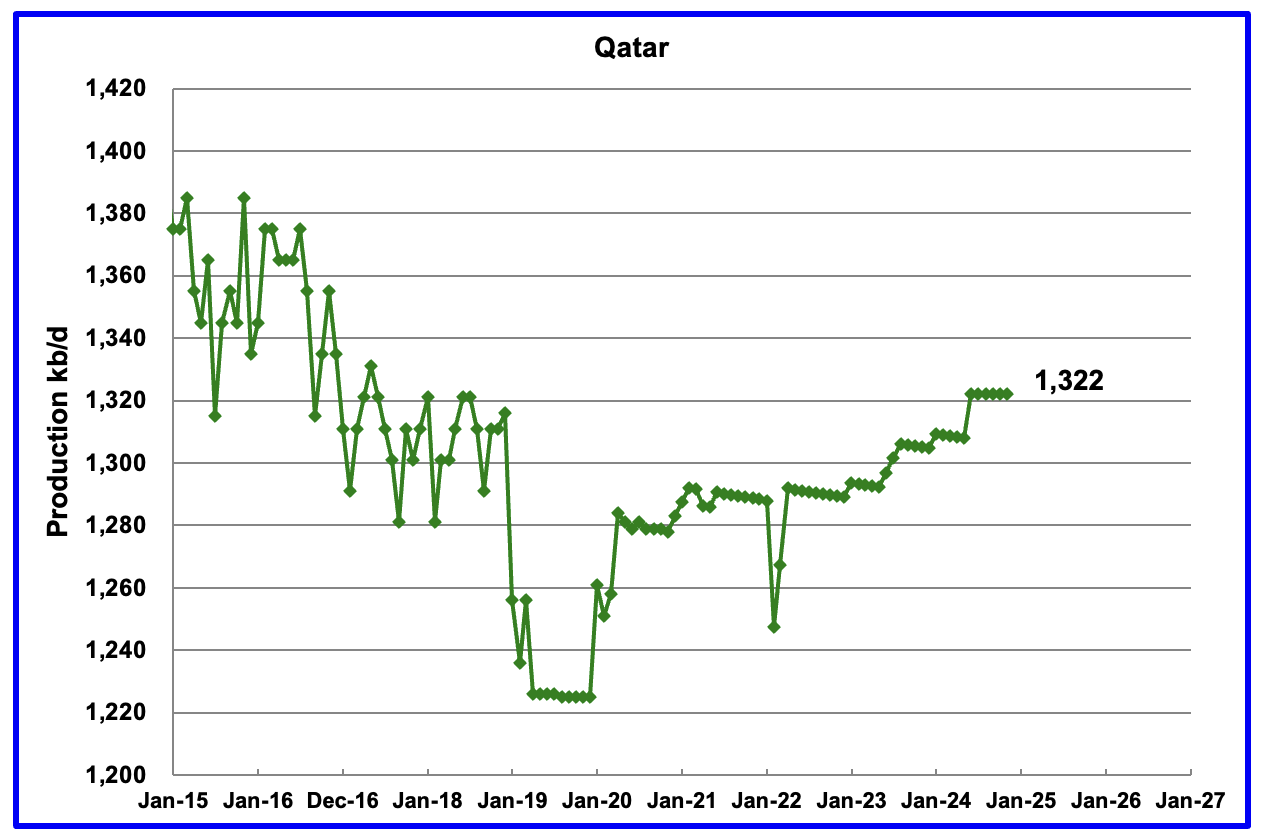
The EIA had been reporting flat output of 1,322 kb/d for Qatar since early 2022. However the current November update has revised down all of the previous production data. Qatar’s November output was reported again to be 1,322 kb/d.
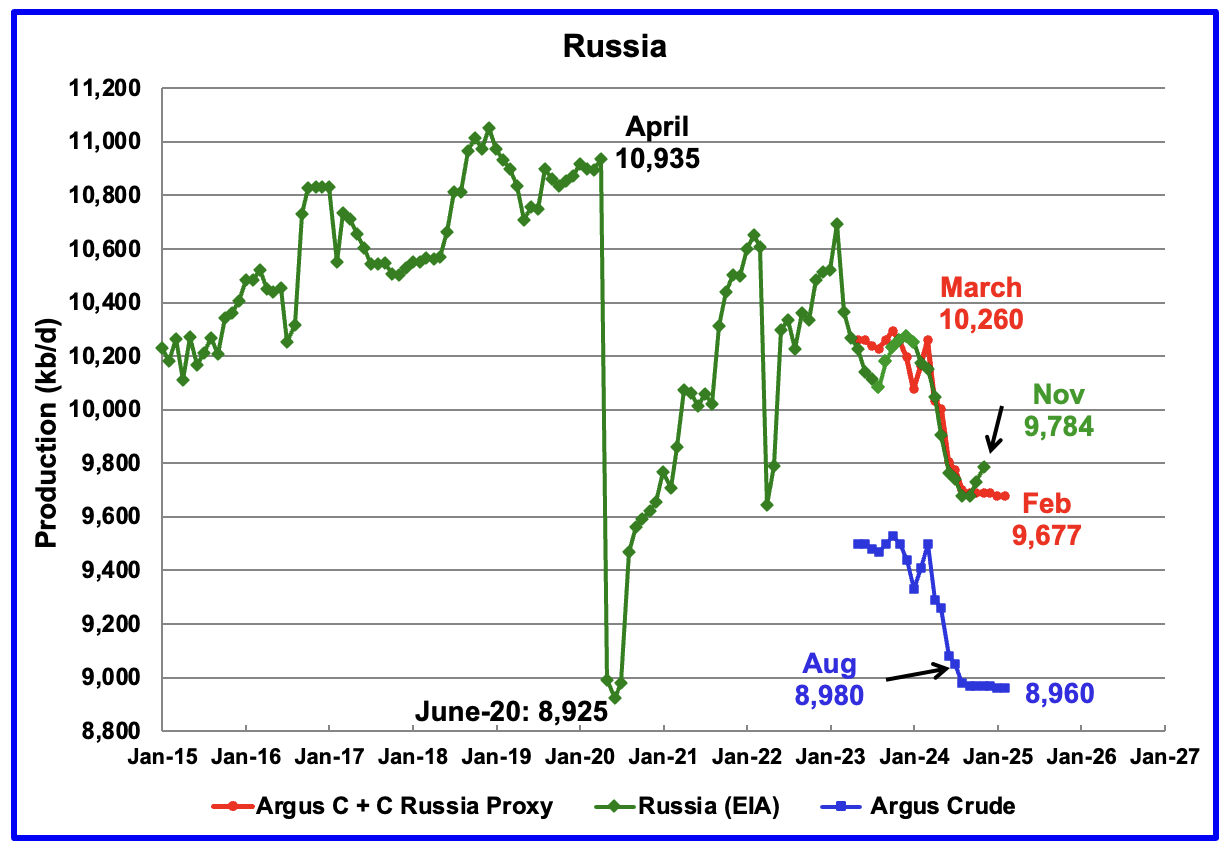
The EIA reported Russia’s November C + C production rose by 54 kb/d to 9,784 kb/d and was down 476 kb/d from March 2024. It is also 96 kb/d higher than the Argus Russia proxy estimate of 9,688 kb/d for November. OPEC reports that Russian crude production in November was 9,010 kb/d.
Using data from Argus Media reports, Russian crude production is shown from May 2023 to January 2025. For February 2025, Argus reported Russian crude production was 8,960 kb/d, unchanged from January, blue markers. Adding 8% to Argus’ February’s crude production provides a C + C production estimate of 9,677 kb/d for Russia, which is a proxy for the Pre-War Russian Ministry estimate, red markers.
According to Argus, Russian crude production of 8,960 kb/d is in compliance with their OPEC target of 8,980 kb/d because it is 20 kb/d lower.
In pre-war times, the Russia Energy Ministry production estimate used to be 400 kb/d higher than the EIA estimate. For November, the EIA’s C + C estimate of 9,784 kb/d is 96 kb/d higher than the Argus proxy estimate of 9,677 kb/d.
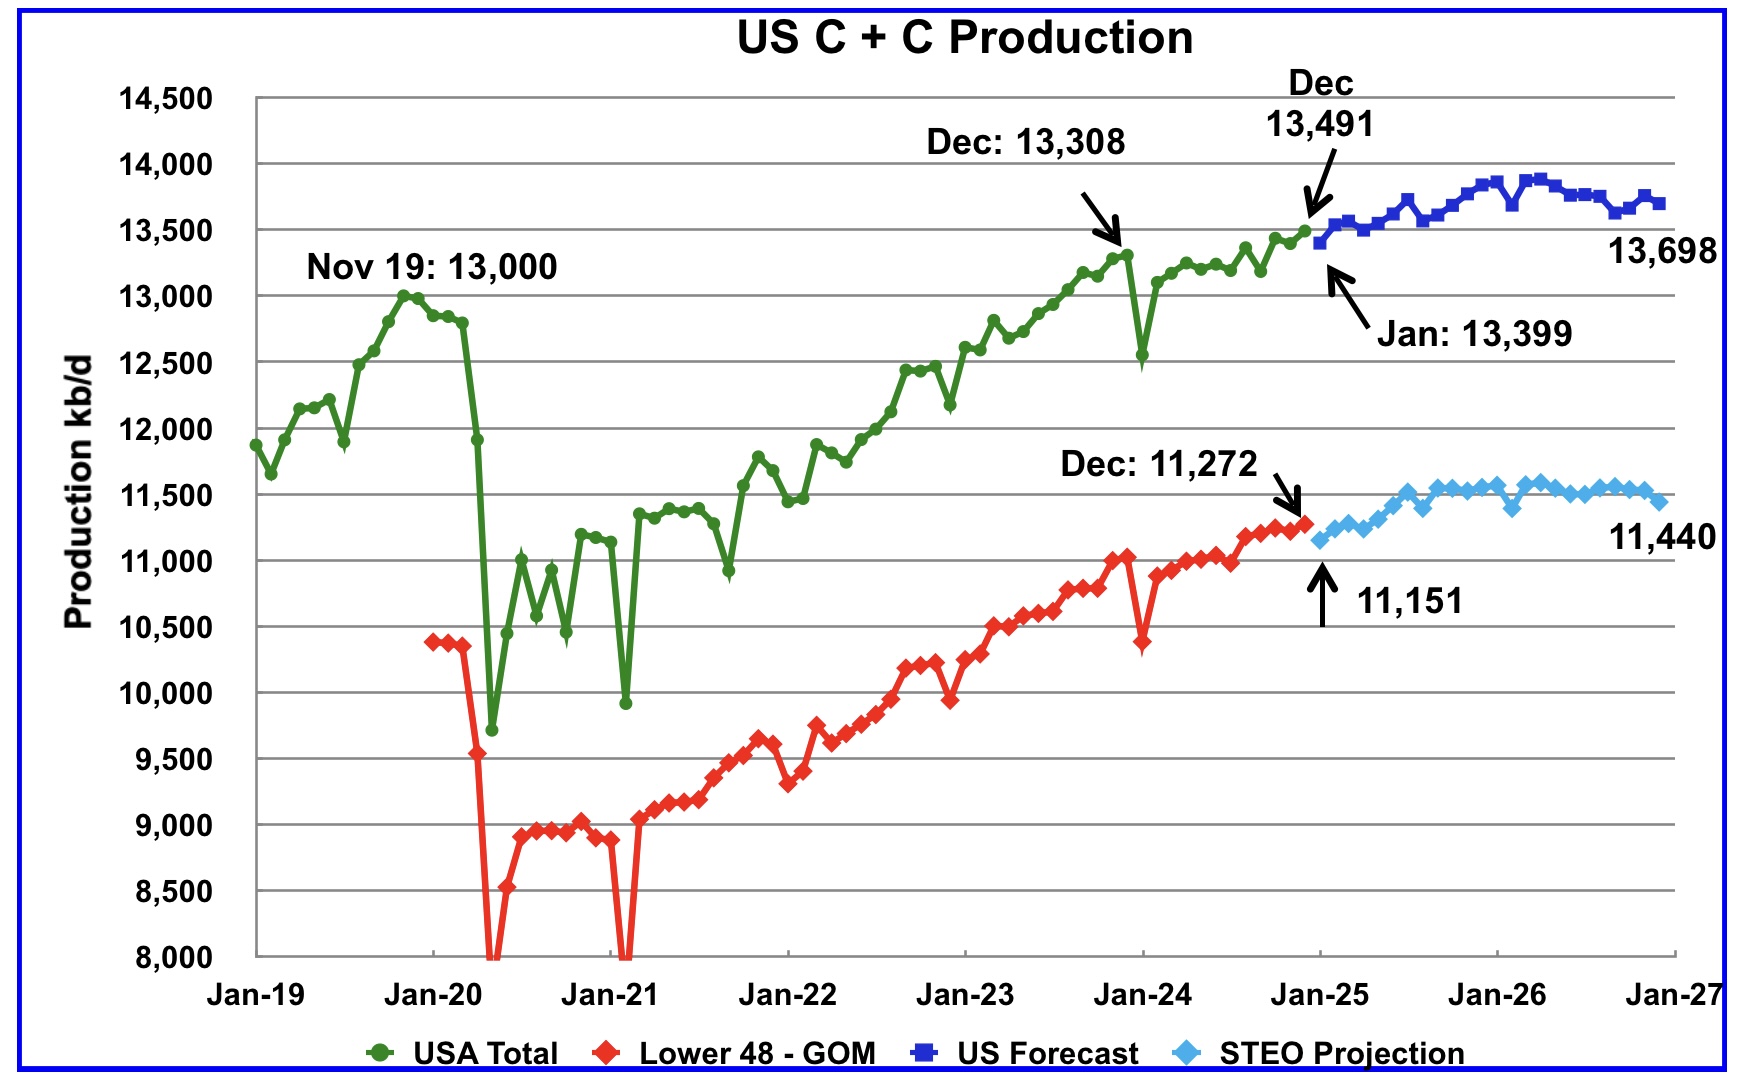
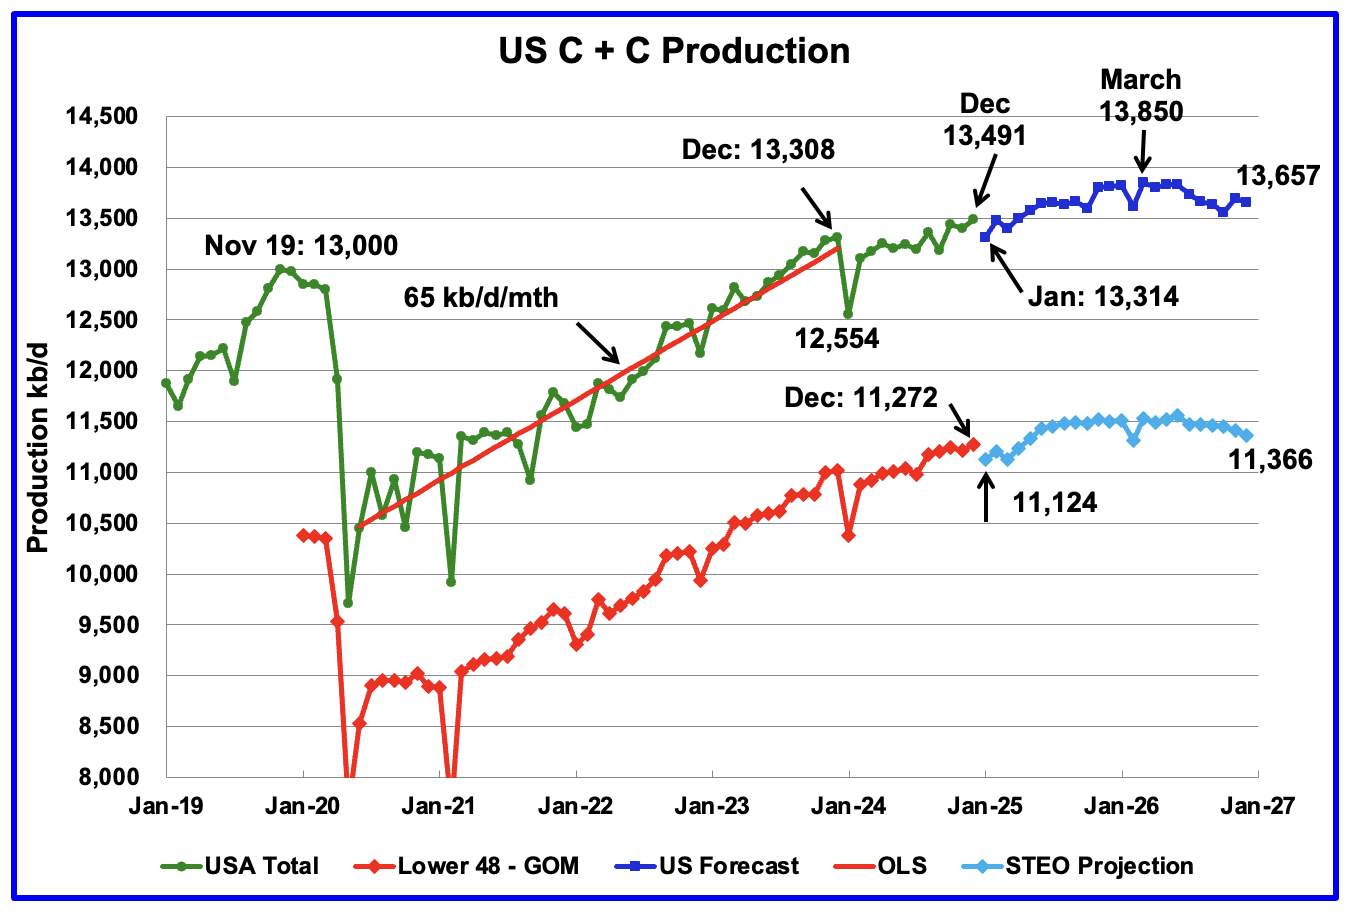
This US production chart is very similar to the one published last week in the US update post. The STEO portions of the two graphs have been updated using the March 2025 STEO.
Production in December 2026 is 41 kb/d higher than reported in the previous post. For the onshore L48, oil production falls off in the latter half of 2026 to 11,440 kb/d and is 74 kb/d higher than in the previous post.