


Short Term Energy Outlook, December 2024
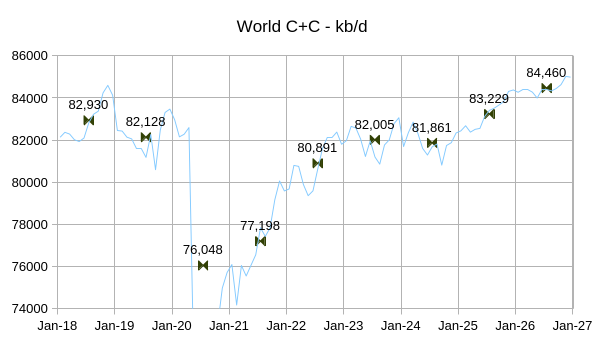
The EIA STEO was published recently, the estimate for World C+C output from September 2024 to December 2025 in the chart below is based on crude oil estimates in the STEO for World minus US C+C output and the trend in the ratio of the STEO crude estimates and C+C estimates from the EIA’s International […]
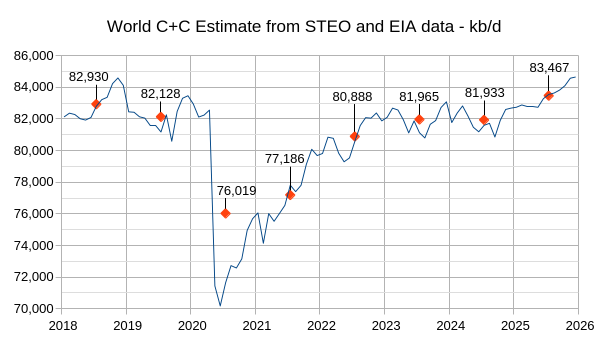
The EIA STEO was published recently, the estimate for World C+C output from September 2024 to December 2025 in the chart below is based on crude oil estimates in the STEO for World minus US C+C output and the trend in the ratio of the STEO crude estimates and C+C estimates from the EIA’s International Energy Statistics for World minus US C+C output for the most recent 48 months (September 2020 to August 2024).
In my view the estimate for World C+C annual output in 2025 (83.47 Mb/d) looks optimistic, I expect World C+C will average about 82.5 Mb/d in 2025 about 600 kb/d higher than the 2024 estimate, which appears reasonable.
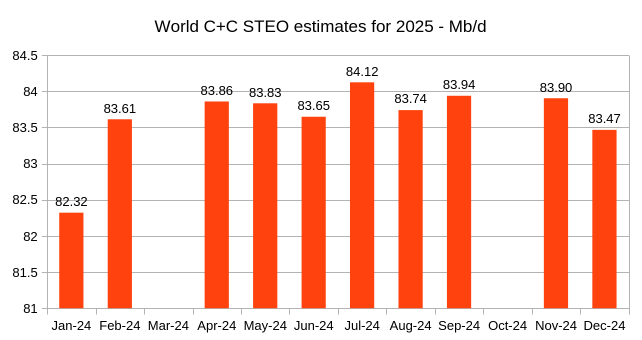
The chart above shows how the STEO estimates for annual output have changed from Jan 2024 to December 2024. If we throw out the Jan 2024 estimate, which is significantly different from the other 10 estimates, the average is 83.79 Mb/d with a standard deviation of 197 kb/d. If we assume that the probability distribution is Gaussian then we expect 95% of the data would fall between 83.4 and 84.2 Mb/d. Note also that decisions by OPEC on future quotas have changed over the past 11 months and this affects the STEO estimate. The decision by OPEC to delay the future ramp up in output from Jan 2024 to April 2024 likely dropped the STEO estimate for December.
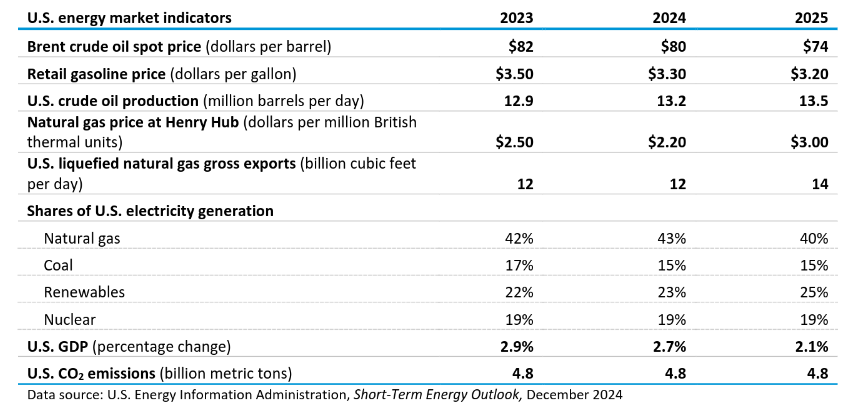
The Brent price has been revised lower by $2/b compared to last month’s STEO and the price of natural gas has been revised higher by 10 cents per MCF, the estimates for US crude oil output and US LNG exports are both unchanged from last month.
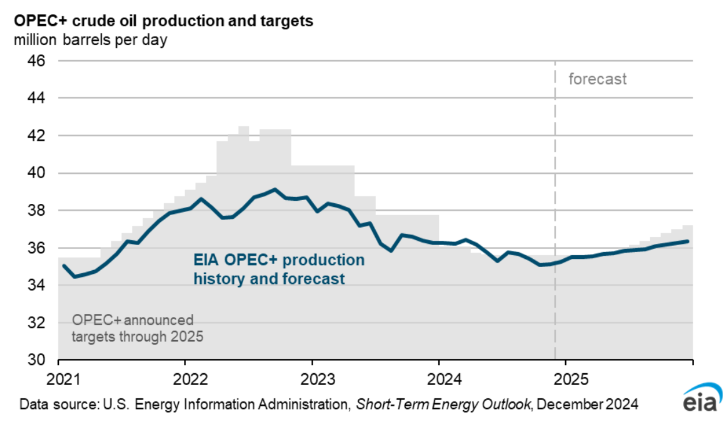
The chart above reflects the delay in OPEC output increases to later in 2025 and shows what the EIA expects for OPEC output in 2025, which is slightly below the OPEC targets for the second half of 2025.

Most of the 1.6 Mb/d increase in World liquids fuel output in 2025 is expected to come from countries that are not part of OPEC+.
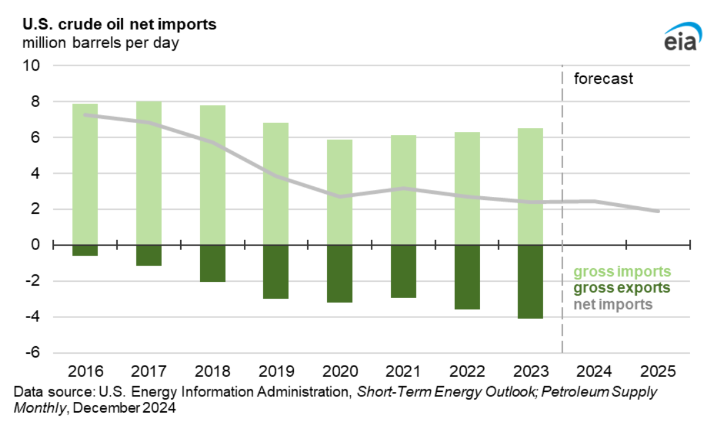
US crude oil net imports are expected to fall below 2 Mb/d for the first time since 1971.

US Jet fuel stocks have been falling since mid 2024 after rising over most of the period starting in Jan 2022, Jet fuel stocks continue to decrease through 2025.
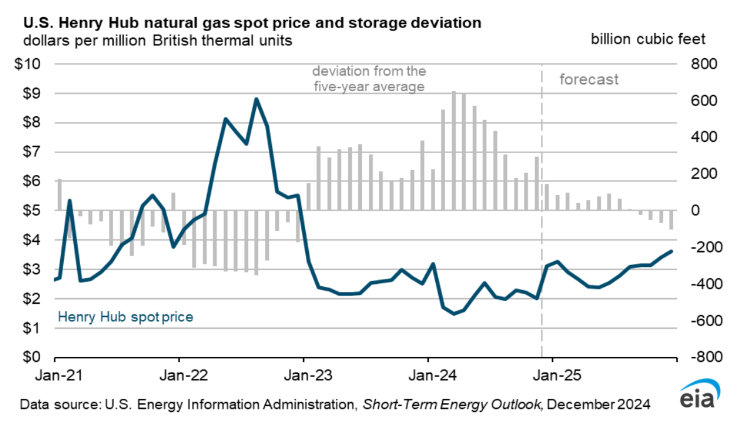
Falling natural gas stocks in 2025 result in generally increasing natural gas prices in 2025.
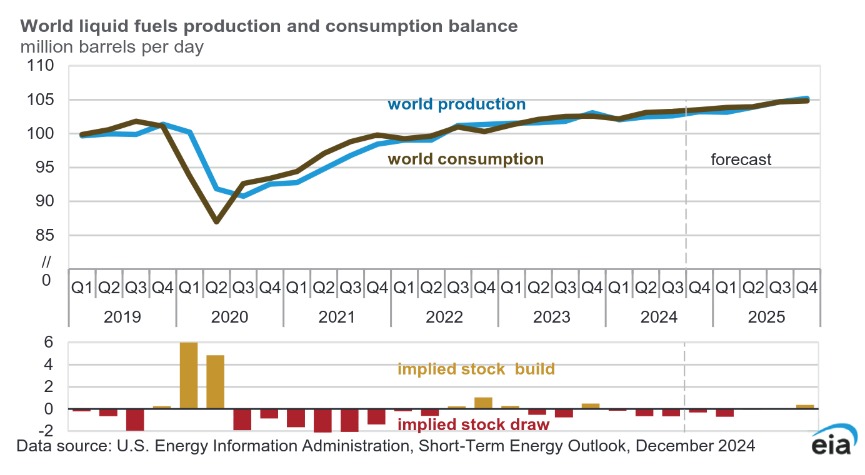
World crude stocks are expected to decrease in 2024 Q4 and 2025Q1 with a small stock build expected for 2025Q4.
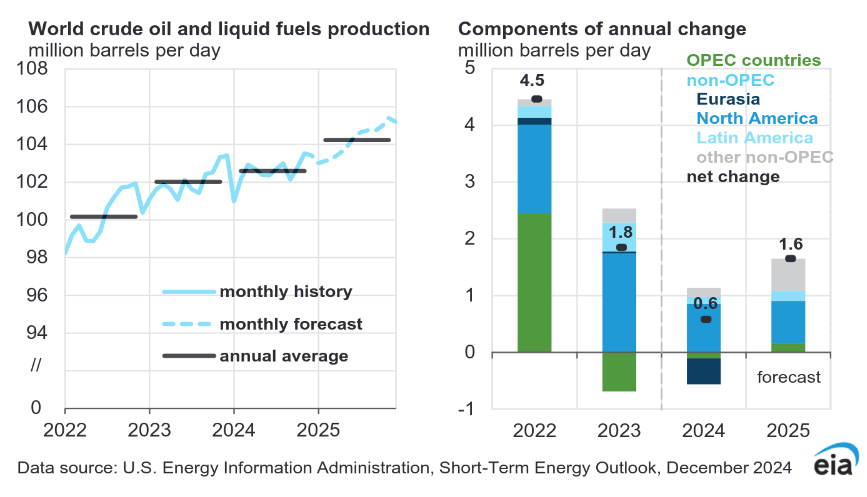
The chart in the right panel above gives some indication of where the increases in liquid fuels in 2025 are coming from. The other non-OPEC increase is about 500 kb/d with about 130 kb/d coming from Europe, 50 kb/d from non-OPEC Middle East nations, 180 kb/d from non-OPEC Africa, and 70 kb/d from Asia and Oceania.
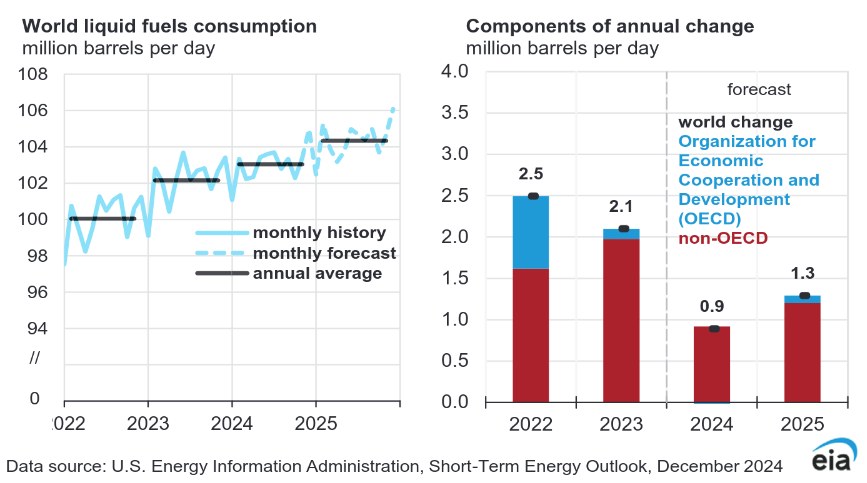
Most of the increase in liquids consumption in 2025 comes from non-OECD nations.

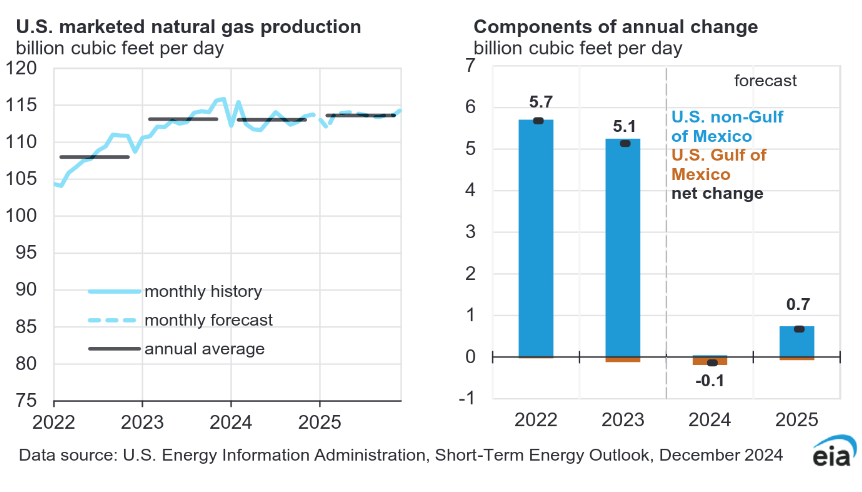
US Natural gas production remains relatively flat in 2025, especially when compared to 2022 and 2023.
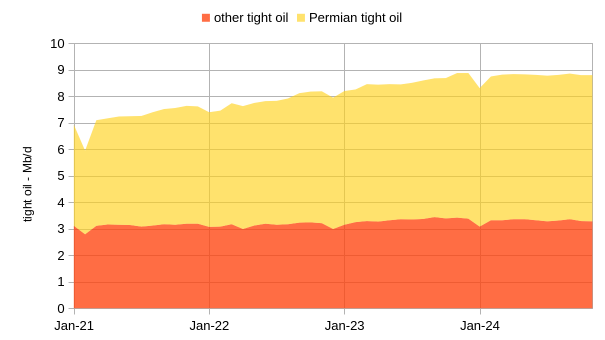
Most of the increase in US tight oil output since 2021 has come from the Permian basin. Notice how flat Permian tight oil looks in 2024 for the EIA estimate above. Below I will suggest this is not a good estimate.

The chart above looks at all US L48 output excluding Gulf of Mexico (GOM), like tight oil most of the increase since Jan 2021 has come from the Permian Basin region (including conventional oil output from this region). Notice how the regional Permian estimate is less flat in 2024 than the tight oil estimate.
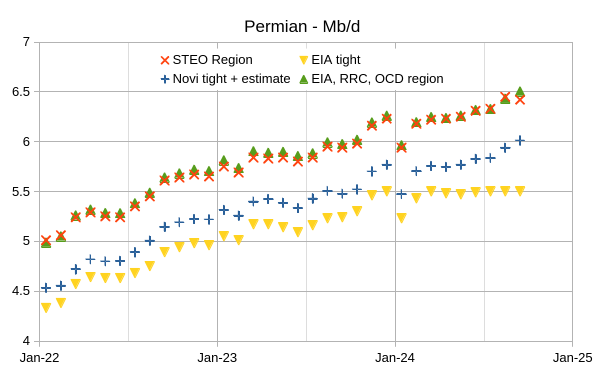
The chart above compares several estimates for the Permian Basin with two regional estimates (the higher two data sets) and two Permian tight oil estimates. The regional estimates compare the EIA STEO estimate for the Permian region with an estimate based on EIA State data for Texas and New Mexico and Permian basin and state level data from the RRC of Texas and the OCD in New Mexico, these estimates are nearly identical. The Permian tight oil estimates compare EIA data with Novilabs data from Jan 2022 to September 2023, from October 2023 to September 2024 I subtract the average difference between the RRC/OCD/EIA Regional estimate and the Novilabs data over the Jan 2022 to Sept 2023 period (493 kb/d) from the RRC/OCD/EIA regional estimate. The EIA leaves out several Permian formations from its tight oil estimate which should be included leading to an underestimate of Permian tight oil output.