


October Non-OPEC and World Oil Production Rose
By Ovi The focus of this post is an overview of World oil production along with a more detailed review of the top 11 Non-OPEC oil producing countries. OPEC production is covered in a separate post. Below are a number of Crude plus Condensate (C + C) production charts, usually shortened to “oil”, for oil […]
By Ovi
The focus of this post is an overview of World oil production along with a more detailed review of the top 11 Non-OPEC oil producing countries. OPEC production is covered in a separate post.
Below are a number of Crude plus Condensate (C + C) production charts, usually shortened to “oil”, for oil producing countries. The charts are created from data provided by the EIA’s International Energy Statistics and are updated to October 2024. This is the latest and most detailed/complete World oil production information available. Information from other sources such as OPEC, the STEO and country specific sites such as Brazil, Norway, Mexico and China is used to provide a short term outlook.
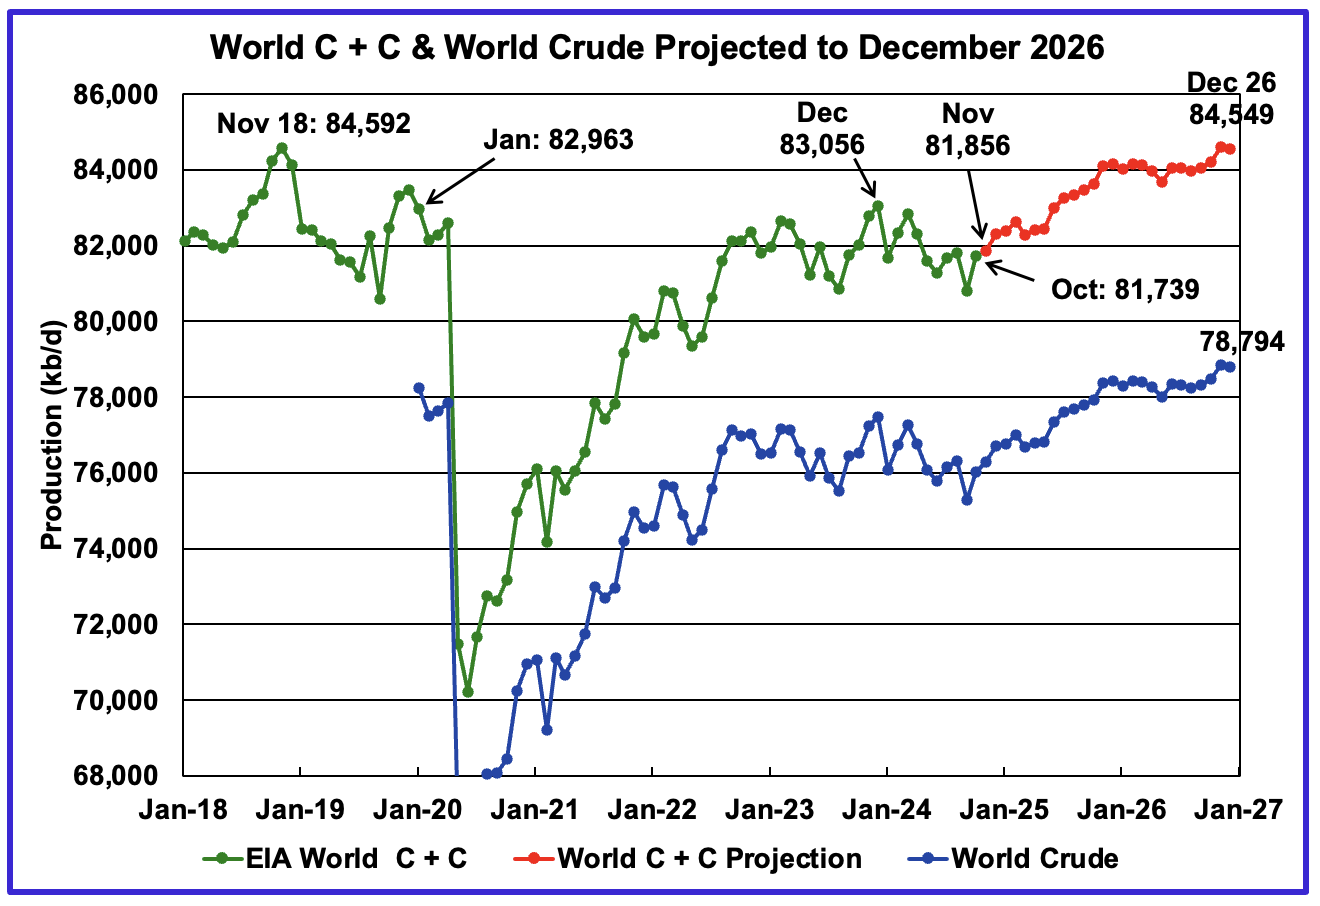
World oil production increased by 930 kb/d in October to 81,739 kb/d, green graph. The largest increases came from Libya, 500 kb/d, and Canada, 325 kb/d. These two countries last month were the two largest decliners. November’s World oil production is projected to increase by 117 kb/d to 81,856 kb/d.
This chart also projects World C + C production out to December 2026. It uses the February 2025 STEO report along with the International Energy Statistics to make the projection.
For December 2026, production is projected to be 84,549 kb/d. The December 2026 oil production is essentially flat relative to the November 2018 peak, a mere difference of 14 kb/d and well within the margin of error.
From December 2023 to December 2026, World oil production is estimated to increase by 493 kb/d.
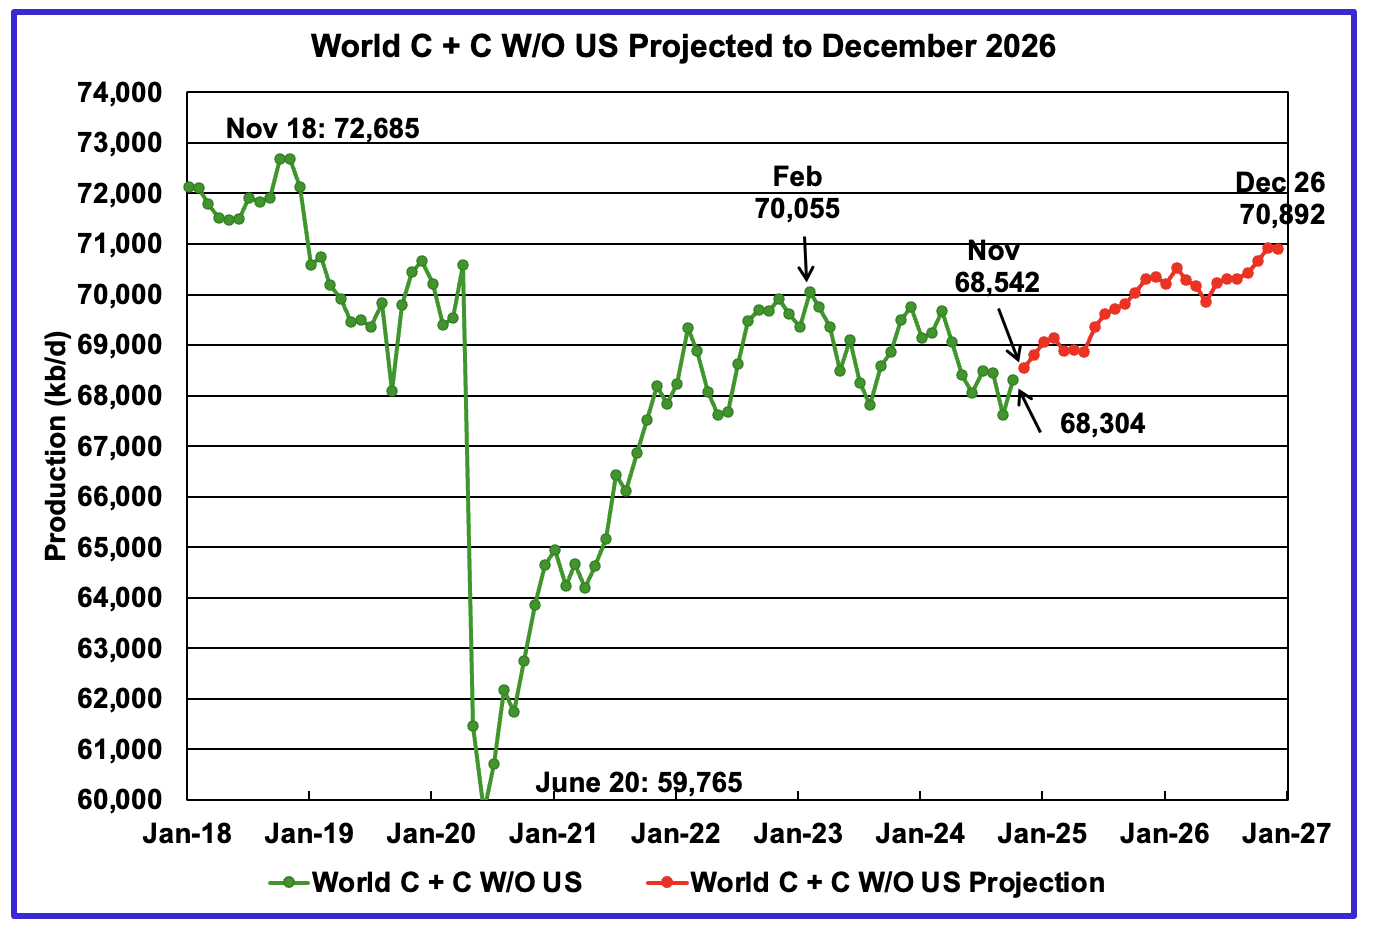
October World oil output without the US increased by 692 kb/d to 68,304 kb/d. November’s production is expected to increase by 238 kb/d to 68,542 kb/d.
The projection is forecasting that December 2026 crude output will be 70,892 kb/d. Note that the December 2026 output is 1,793 kb/d lower than the November 2018 peak of 72,685 kb/d.
World oil production W/O the U.S. from November 2024 to December 2026 is forecast to increase by a total of 2,350 kb/d.
A Different Perspective on World Oil Production
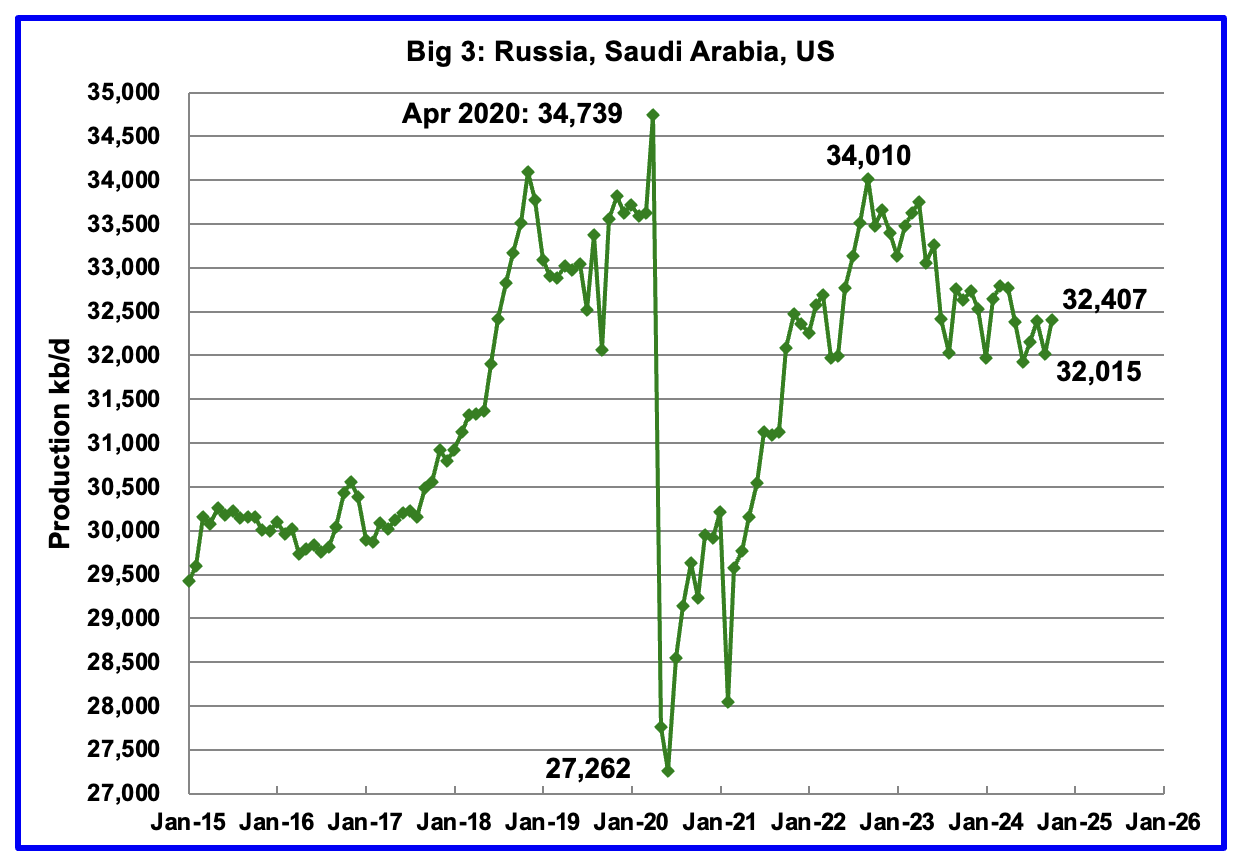
Peak production in the Big 3 occurred in April 2020 at a rate of 34,739 kb/d. The peak was associated with a large production increase from Saudi Arabia. Post covid, production peaked at 34,010 kb/d in September 2022. The production decline since then is primarily due to cutbacks by Saudi Arabia and Russia.
October’s Big 3 oil production increased by 392 kb/d to 32,407 kb/d. Production in October was 1,603 kb/d lower than the September 2022 post pandemic high of 34,010 kb/d. Of the Big 3, the country with the largest October increase was the U.S. with a rise of 259 kb/d, see Table below.
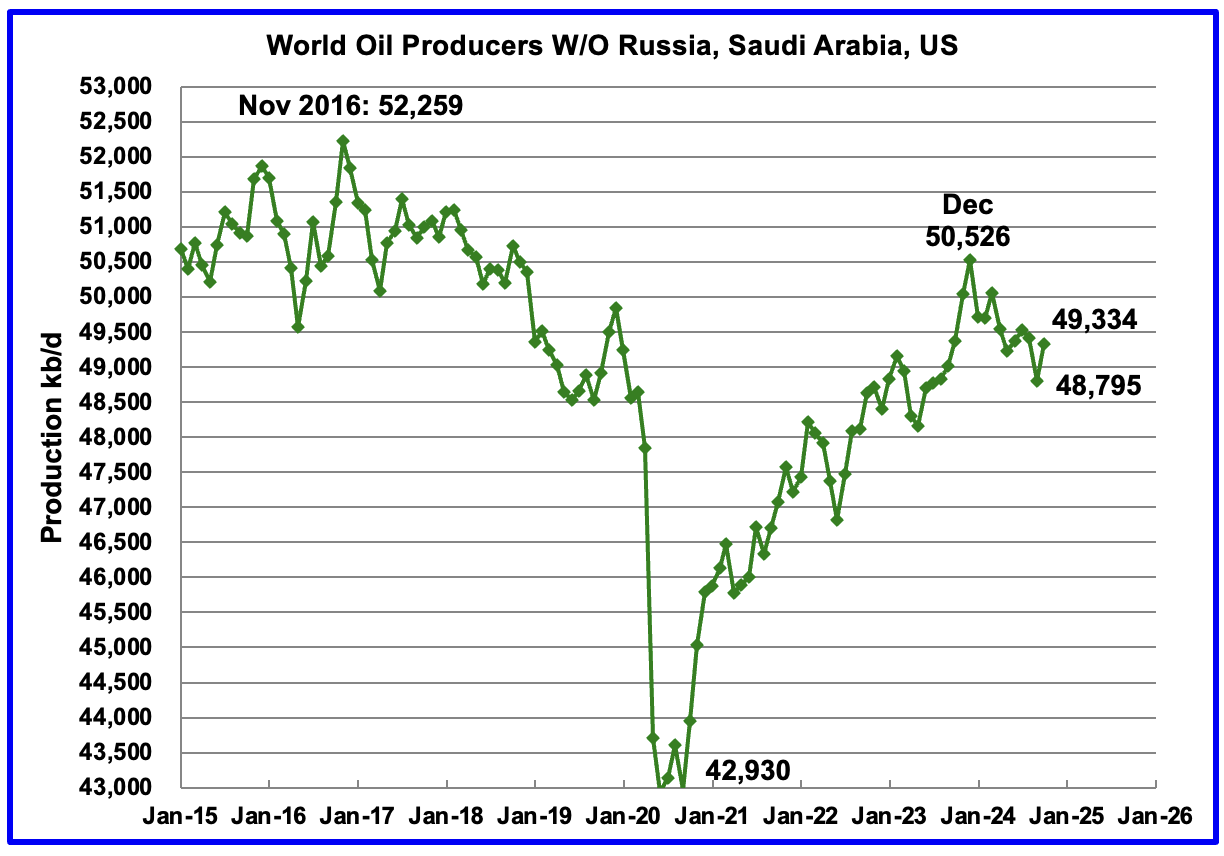
Production in the Remaining Countries had been slowly increasing since the September 2020 low of 42,930 kb/d. Output in December 2023 reached 50,526 kb/d, a new post covid high. However production began falling in January 2024. October’s production increased by 539 kb/d to 49,334 kb/d and is now down 1,192 kb/d below December 2023.
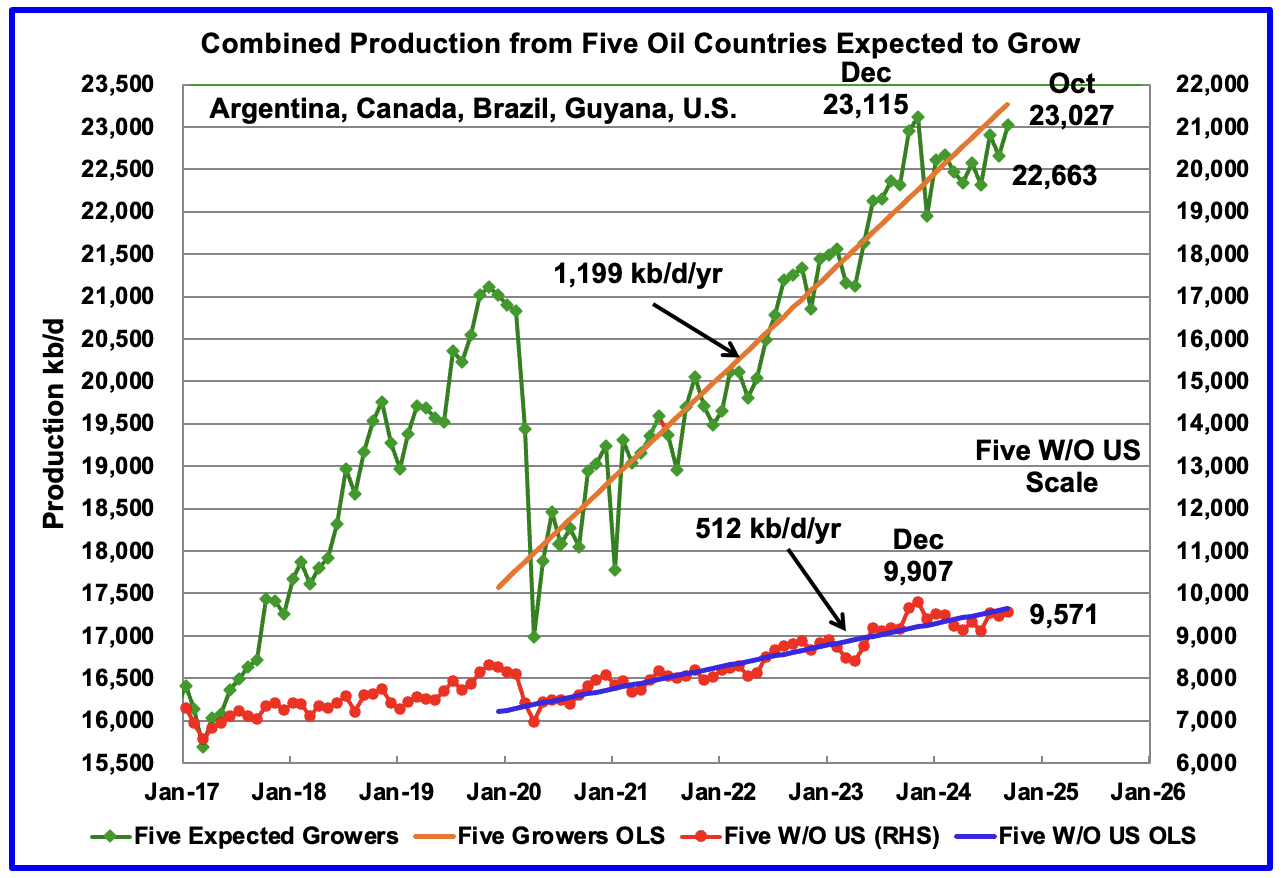
This chart was first posted a couple of months back and shows the combined oil production from five Non-OPEC countries, Argentina, Brazil, Canada, Guyana and the U.S. whose oil production is expected to grow. These five countries are often cited by OPEC and the IEA for being capable of meeting the increasing World oil demand for next year while OPEC withholds its oil from the market. For these five countries, production from April 2020 to August 2024 rose at an average rate of 1,199 kb/d/year as shown by the orange OLS line.
To show the impact of US growth over the past 5 years, U.S. production was removed from the five countries and that graph is shown in red. The production growth slope for the remaining four countries has been reduced by 687 kb/d/yr to 512 kb/d/yr.
October production has been added to the chart, up 364 kb/d to 23,027 kb/d. For the Five growers W/O U.S., October production rose by 106 kb/d to 9,571 kb/d.
The OLS lines have not been updated and will not be updated going forward unless there is a strong indication that production is rising.
Production up to December 2023 may be a situation where the past is not a good indicator of the future. In this case it may be more important to focus on what has happened to production after December 2023 rather than before. In both cases oil production has fallen since then.
Countries Ranked by Oil Production
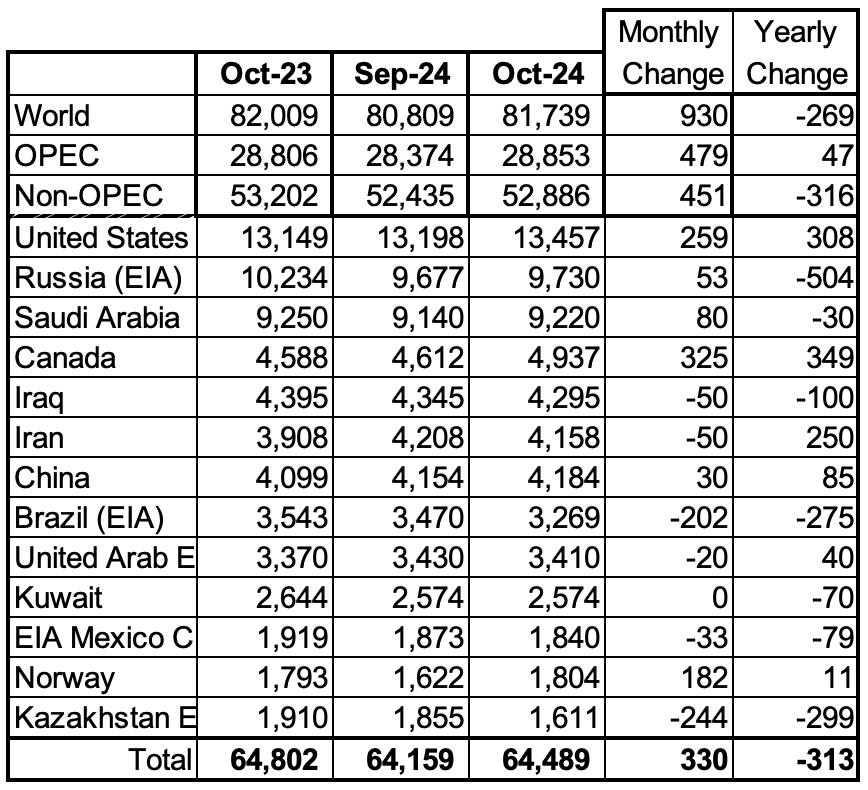
Above are listed the World’s 13th largest oil producing countries. In October 2024, these 13 countries produced 78.9% of the World’s oil. On a MoM basis, production increased by 330 kb/d in these 13 countries while on a YOY basis, production dropped by 313 kb/d. Note the large YoY production increase in Iran, U.S. and Canada and the large drop in Russia. Will the upcoming potentially stricter U.S. sanctions on Iran curb/slow that increasing trend?
October Non-OPEC Oil Production Charts
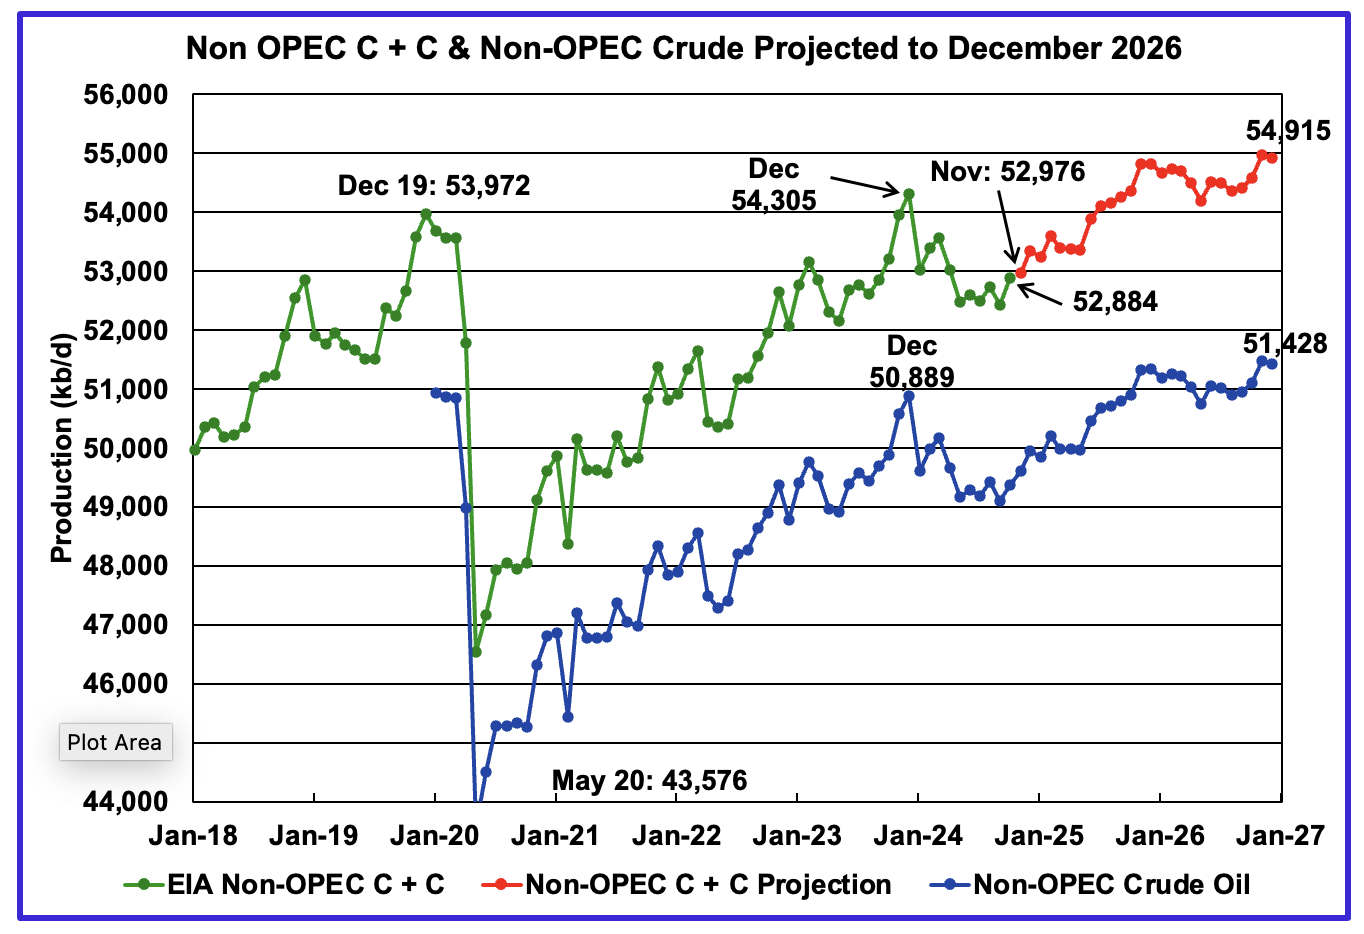
October Non-OPEC oil production increased by 451 kb/d to 52,884 kb/d. The largest increases came from the U.S., Norway and Canada. Note that Non-OPEC production now includes Angola.
Using data from the February 2025 STEO, a projection for Non-OPEC oil output was made for the period November 2024 to December 2026. (Red graph). Output is expected to reach 54,915 kb/d in December 2026, which is 943 kb/d higher than the December 2019 peak of 53,972 kb/d.
From December 2023 to December 2026, oil production in Non-OPEC countries is expected to increase by 610 kb/d.

October’s Non-OPEC W/O US oil production rose by 211 kb/d to 39,449 kb/d. November’s production is projected to rise by 213 kb/d to 39,662 kb/d.
From December 2023 to December 2026, production in Non-OPEC countries W/O the U.S. is expected to increase by 261 kb/d or 87 kb/d/yr. December 2026 production is projected to be 88 kb/d higher than December 2019, essentially no growth over seven years.
Non-OPEC Oil Countries Ranked by Production

Listed above are the World’s 11 largest Non-OPEC producers. The original criteria for inclusion in the table was that all of the countries produced more than 1,000 kb/d. Note that Angola has been added to this table and that Oman has recently fallen below 1,000 kb/d.
October’s production increased by 371 kb/d to 44,251 kb/d for these eleven Non-OPEC countries while as a whole the Non-OPEC countries saw a monthly production rise of 451 kb/d to 52,886 kb/d.
In October 2024, these 11 countries produced 83.7% of all Non-OPEC oil.
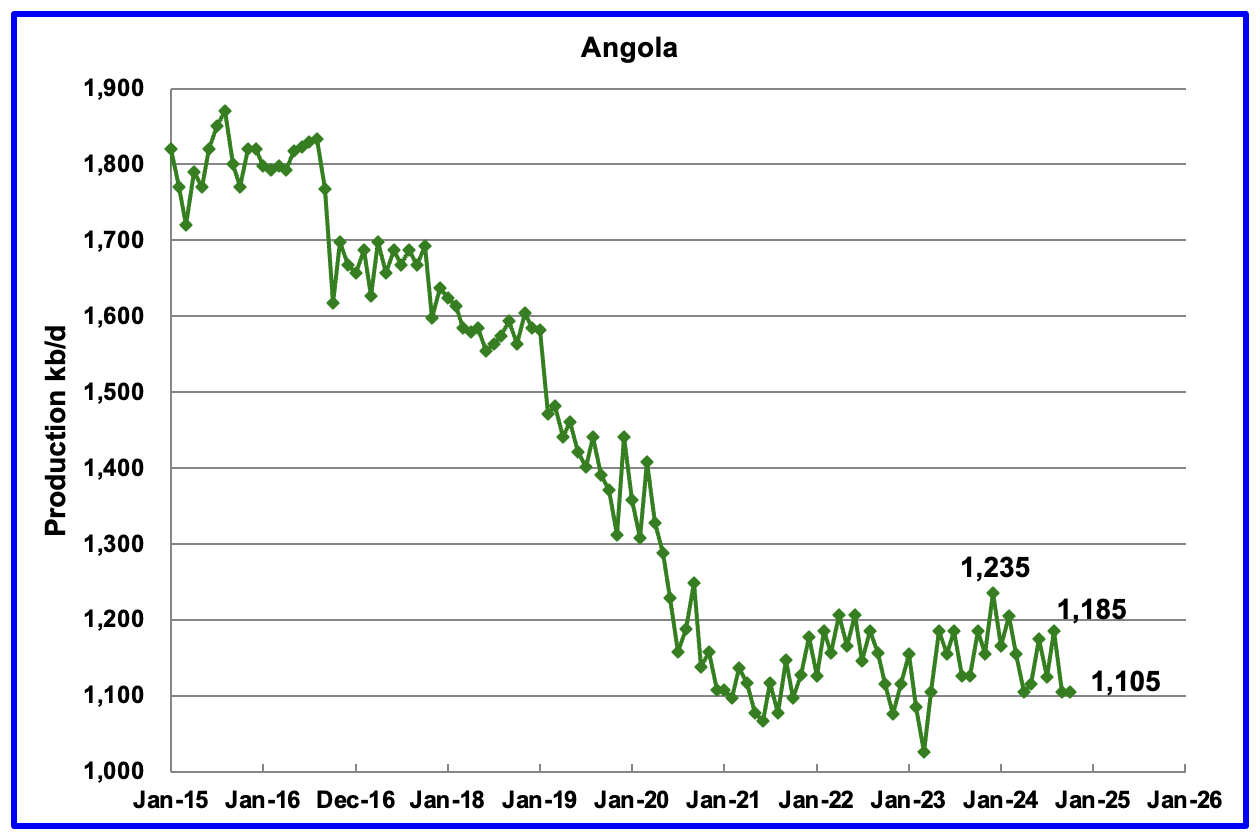
Angola’s October production was flat at 1,105 kb/d. Since early 2022 Angola’s production appears to have settled into a plateau phase between 1,100 kb/d and 1,200 kb/d.
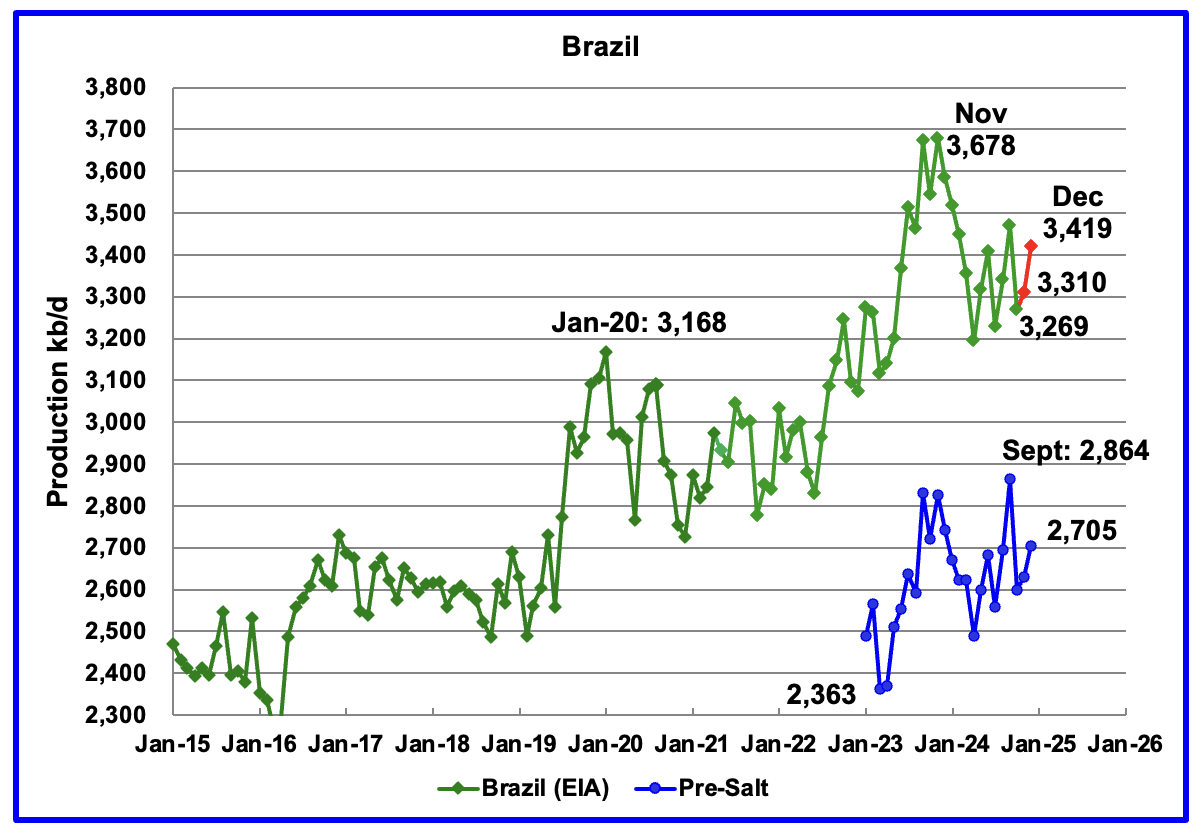
The EIA reported that Brazil’s October production dropped by 202 kb/d to 3,269 kb/d.
Brazil’s National Petroleum Association (BNPA) reported that production increased in November and again in December to 3,419 kb/d The pre-salt graph tracks Brazil’s trend in the crude oil graph. For December, pre-salt production increased by 74 kb/d to 2,705 kb/d.
Brazilian production after December 2024 has to increase by 259 kb/d to exceed the November 2023 high. However production has been very erratic since the November 2023 high. The December OPEC report states that two new floating production storage and offloading (FPSO) platforms came online in November. It also mentions operational issues and slow ramp-ups in several offshore platforms continue to be an issue. December production does show an increase of 109 kb/d, which could be associated with the addition of the two new platforms.
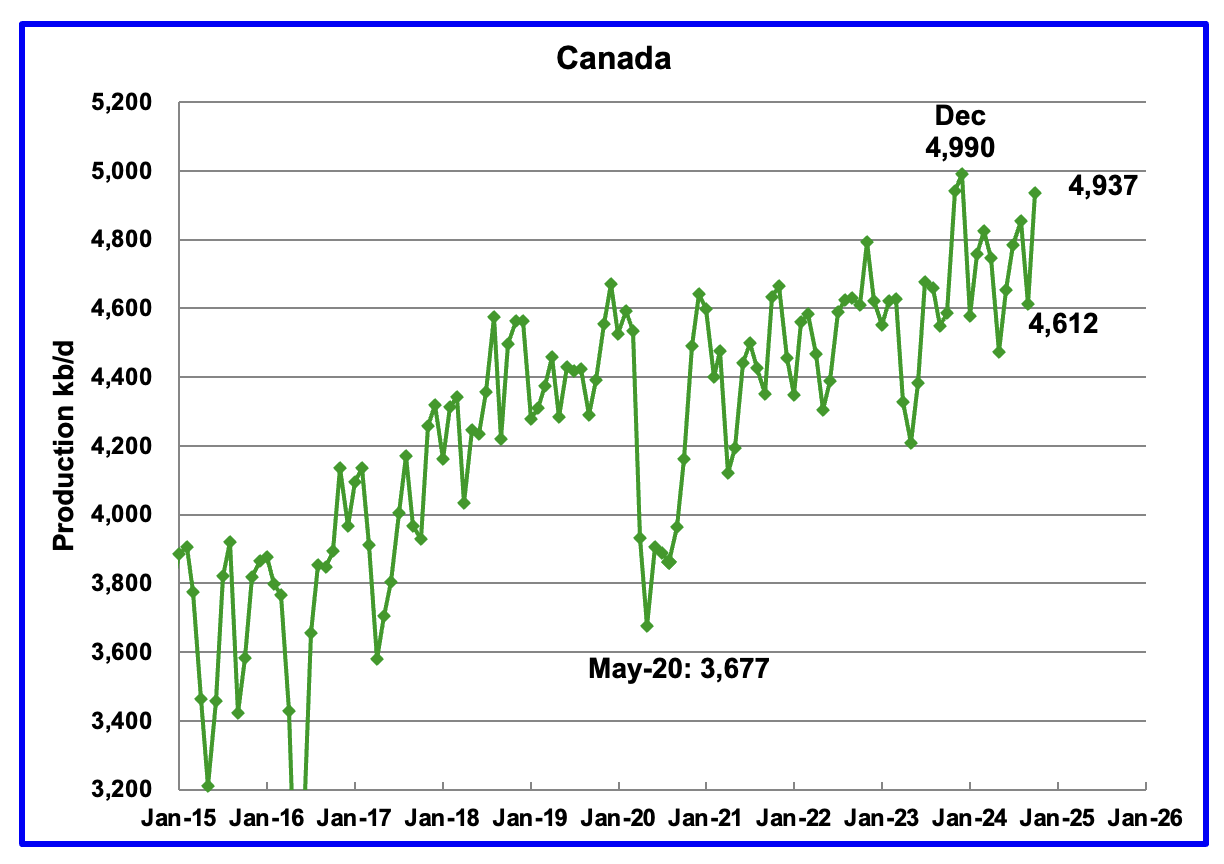
Canada’s production increased by 325 kb/d in October to 4,937 kb/d. The increase is primarily due to site restarts associated with the previous month’s wild fires in the oil sands area around Fort McMurray.
Canada has woken up to the risks associated with becoming too close to a trading neighbour. According to this Article: “The operator behind Trans Mountain’s 890,000 b/d pipeline system in western Canada is looking into increasing its capacity as export congestion looms, while threatened US tariffs may prompt the country to re-examine its broader pipeline strategy.”
Other proposed export pipelines like Enbridge’s 525,000 b/d Northern Gateway and TC Energy’s 1.1mn b/d Energy East did not get past the approval stage under a federal Liberal government. The government has now suggested that discussions need to be revived regarding these two pipelines that did not get approved.
They were blocked for Climate Change considerations. It seems that Tariff threats may now have a higher priority.
In February 2020, 412 kb/d were shipped via rail to the U.S. In November 2024, the rail shipments had dropped to 94 kb/d, largely due to the startup of the TMX pipeline.
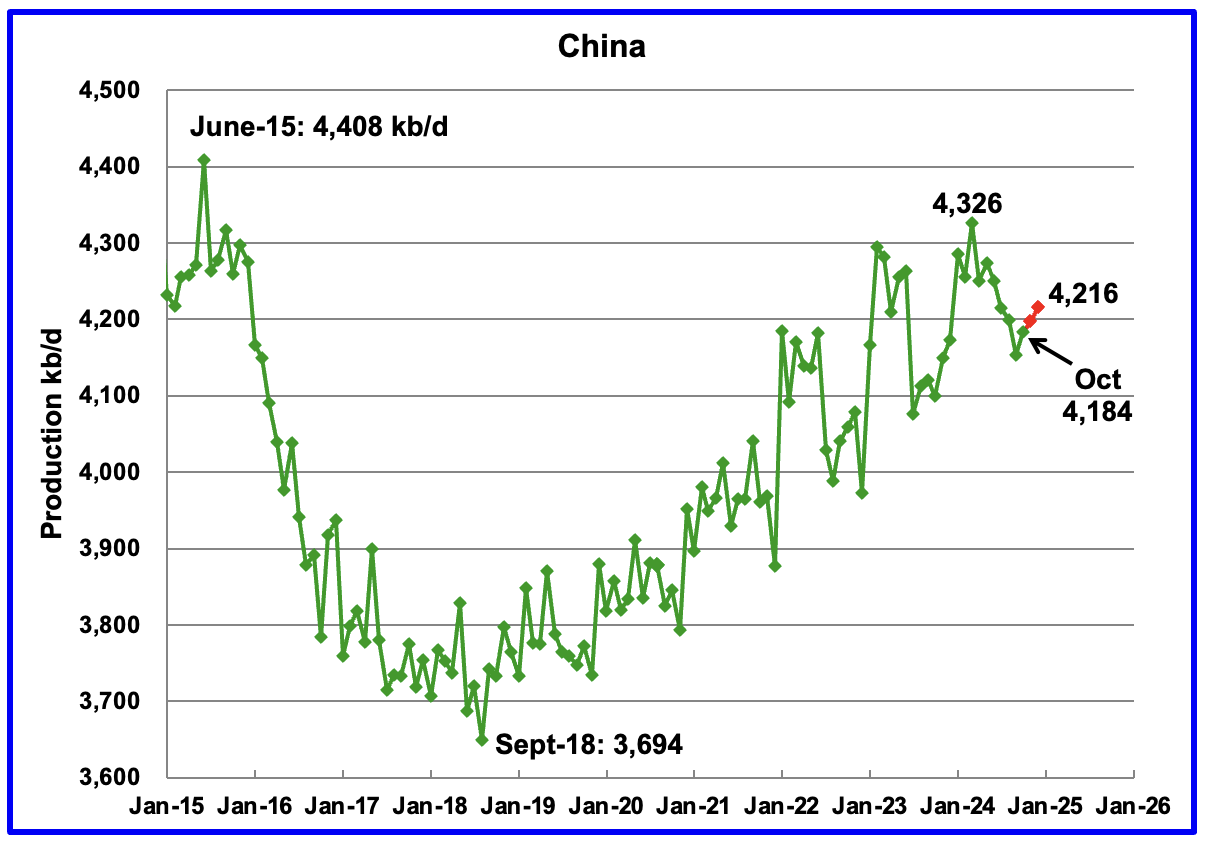
The EIA reported China’s October oil output increased by 30 kb/d to 4,184 kb/d.
The China National Bureau of Statistics reported production for November and December. Combined November and December production added 32 kb/d to 4,216 kb/d, red markers.
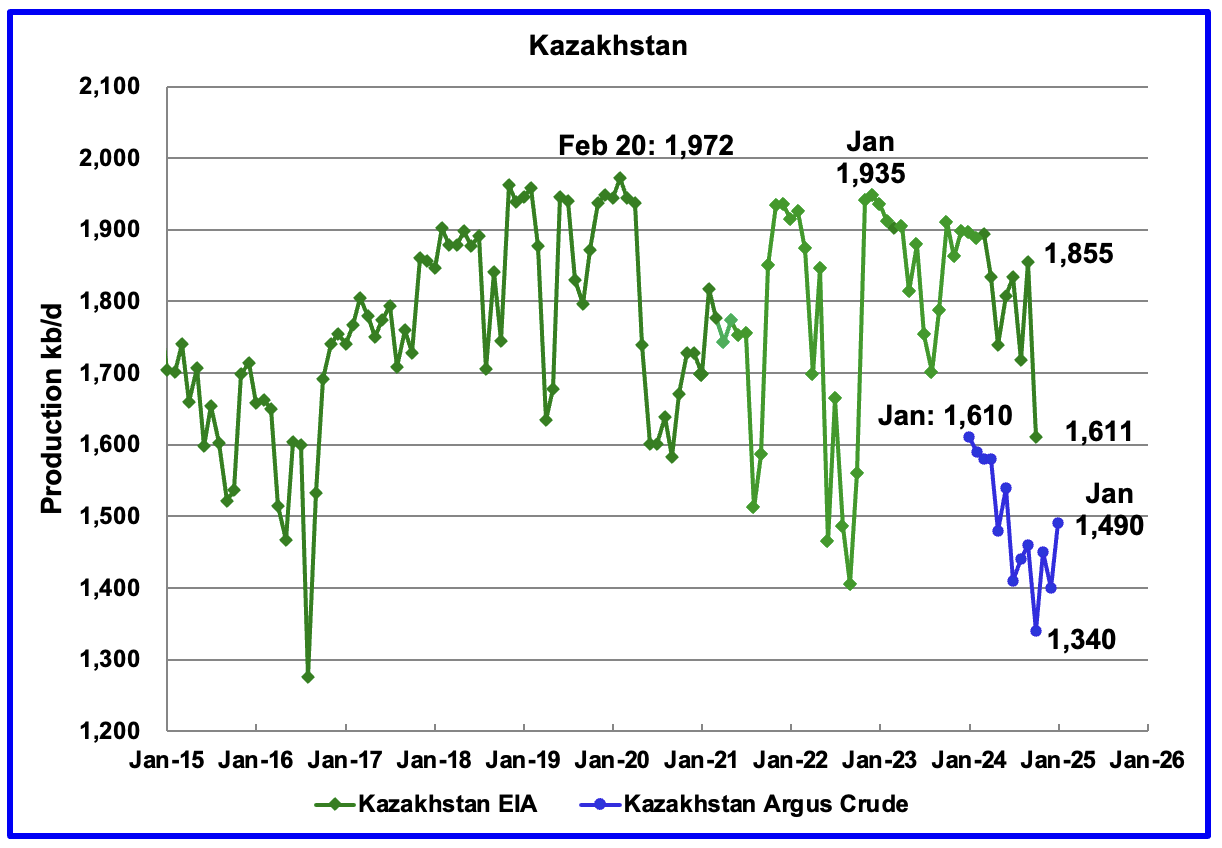
According to the EIA, Kazakhstan’s oil output decreased by 244 kb/d in October to 1,611 kb/d.
Kazakhstan’s recent pre-salt crude oil production, as reported by Argus, has been added to the chart. In October pre-salt crude production dropped by 120 kb/d to 1,340 kb/d. December production dropped to 1,400 kb/d and January added 90 kb/d to 1,490 kb/d.
Kazakhstan’s OPEC production target is 1,470 kb/d. At 1,490 kb/d, Kazakhstan is 20 kb/d over their target. According to this Article it is not clear how Kazakhstan will meet its quota target when Chevron starts increasing production at its Tengiz field.
According to this Article: “Kazakhstan’s compliance has picked up recently, but the start of a new production phase at the Tengiz oil field has raised questions over its willingness to stick to its quota this year. But the group is keeping the pressure on. “
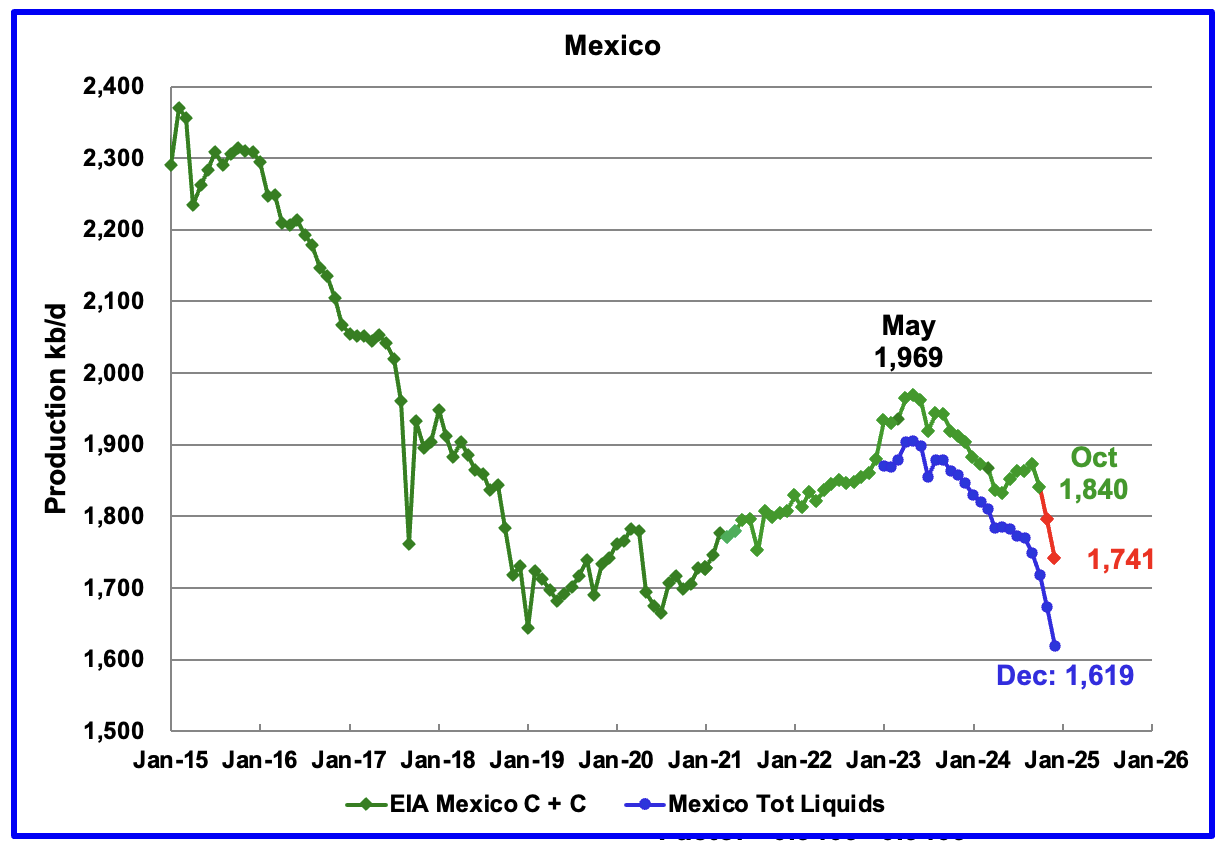
According to the EIA, Mexico’s October output dropped by 33 kb/d to at 1,840 kb/d.
In June 2024, Pemex issued a new and modified oil production report for Heavy, Light and Extra Light oil. It is shown in blue in the chart and it appears that Mexico is not reporting condensate production when compared to the EIA report.
In earlier reports, the EIA would add close to 55 kb/d of condensate to the Pemex report. However for July and August, the condensate contribution increased to 90 kb/d and for September it has increased again to 124 kb/d and 122 kb/d for October. It is not clear if this is the result of better communications with Pemex officials.
For November and December, 122 kb/d have been added to the Pemex production to estimate Mexico’s November and December C + C production, red markers. Note that Mexico’s production, according to Pemex, has continued to fall every month since May 2023, except for one month.
Since May 2023, Mexico’s total liquids production has been in a free fall and has accelerated in the past few months. Just considering Pemex production for the last five months, production has dropped by 151 kb/d or at the rate of 37.9 kb/d/mth or 453 kb/d/yr. If Mexican oil production were to continue at that rate going forward, that would be a significant reduction to World oil production growth.
According to this Article, the decline in Mexico’s crude and gas production could accelerate.
“The decline is beyond Pemex control now,” said Alma América Porres Luna, an independent analyst who formerly served as commissioner at the National Hydrocarbons Commission, or CNH, the country’s upstream oil and gas regulator.
Without any new discoveries in sight, the only two new projects that could contribute to the national production in the short term are Trion and Zama, which will not be enough to compensate for the declining production of Pemex’s main fields, Porres Luna said.
According to this Article, US oil refiners along the Gulf Coast are snubbing shipments from Mexico and instead turning to Colombia and Canada amid complaints that Petroleos Mexicanos is increasingly delivering crude that’s unfit to make gasoline and diesel.
“Flagship Maya crude is being delivered with as much as 6% of water content, or six times more than the industry standard, the people said. That means when a refiner buys a standard cargo of half a million barrels, around 30,000 barrels are water, or the equivalent to almost $2 million, according to Bloomberg calculations.”
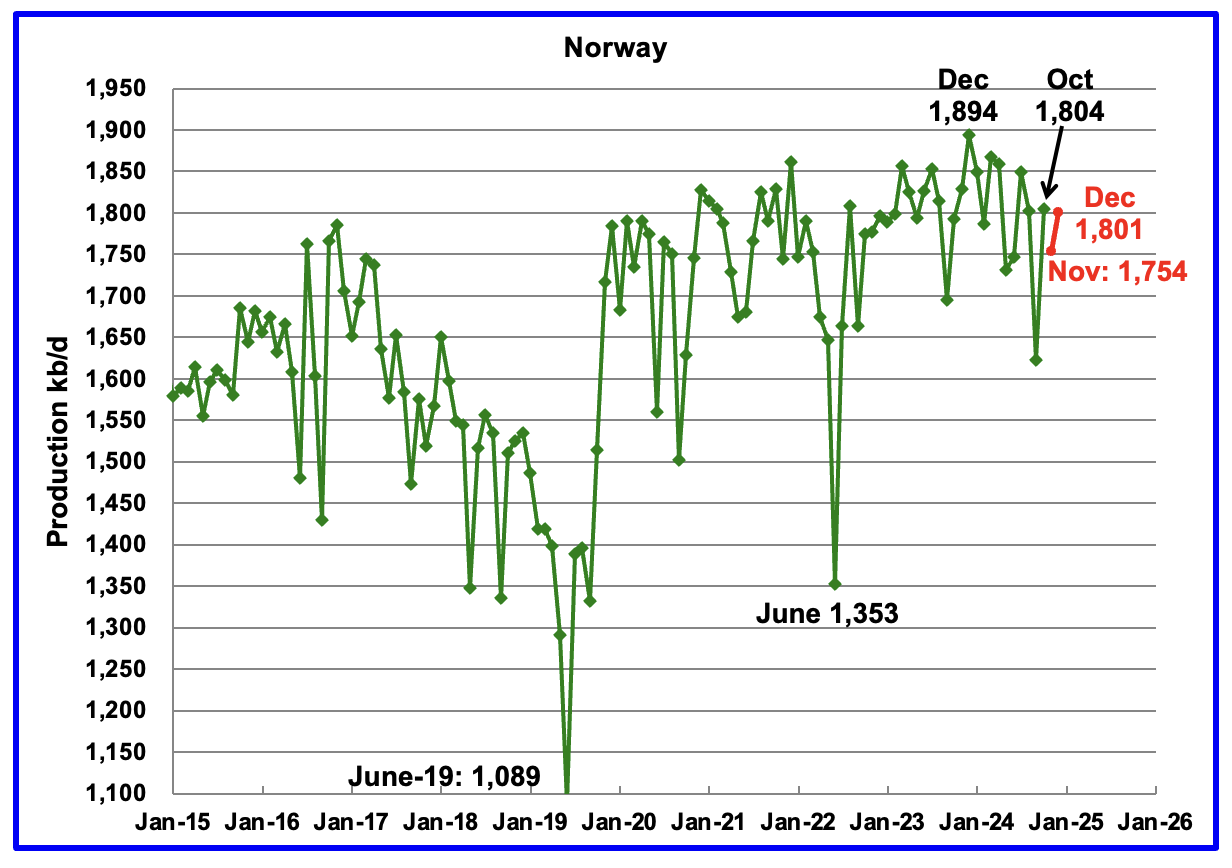
The EIA reported Norway’s October production increased by 182 kb/d to 1,804 kb/d. The increase was due the restoration of a major power failure that occurred during the previous month.
Separately, the Norway Petroleum Directorate (NPD) reported that November production dropped by 50 kb/d to 1,754 kb/d and December rose to 1,801 kb/d, red markers.
The Norway Petroleum Directorship stated that December’s oil production was 0.8% below forecast.
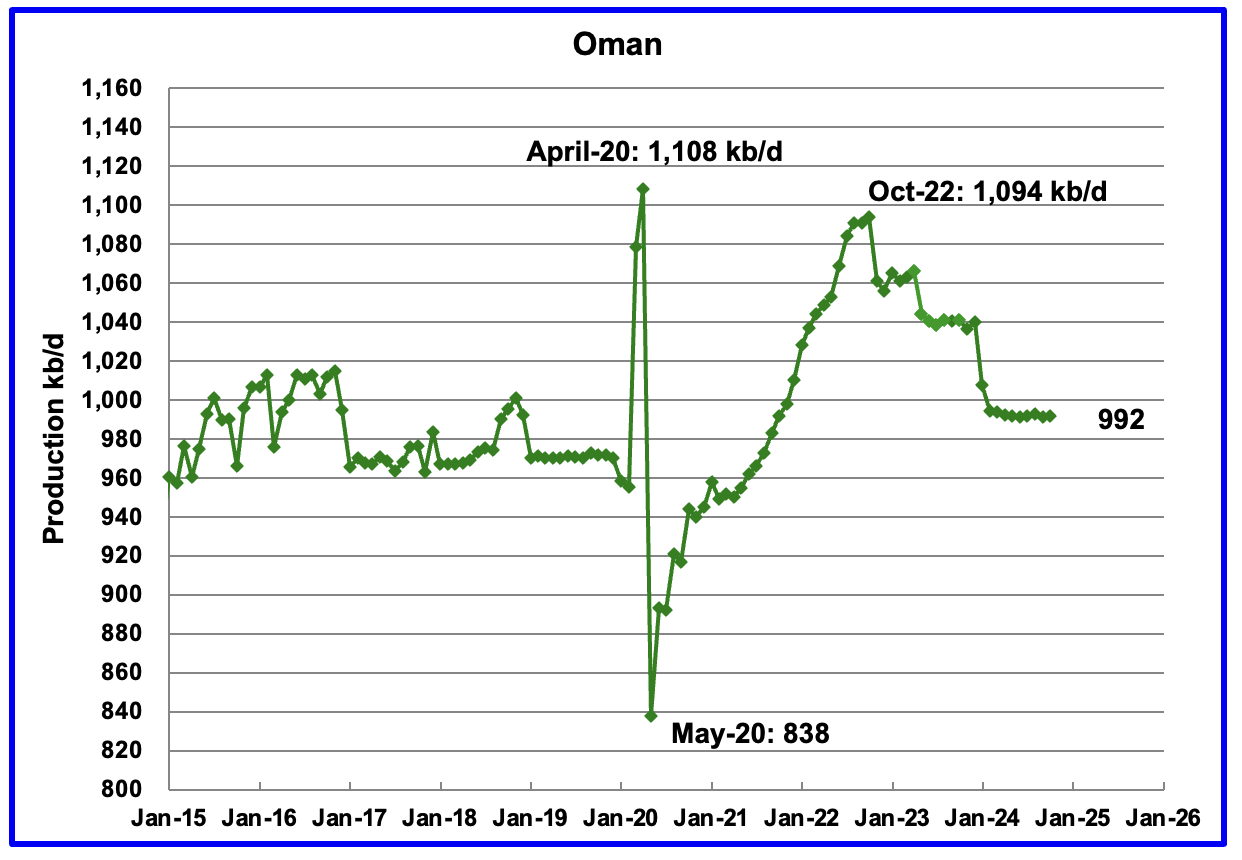
Oman’s production had risen very consistently since the low of May 2020. However production began to drop in November 2022. According to the EIA, October’s output rose by 1 kb/d to 992 kb/d.
Oman produces a lot of condensate. The OPEC MOMR reports that crude production in October was 764 kb/d, 228 kb/d lower than the EIA’s C + C.
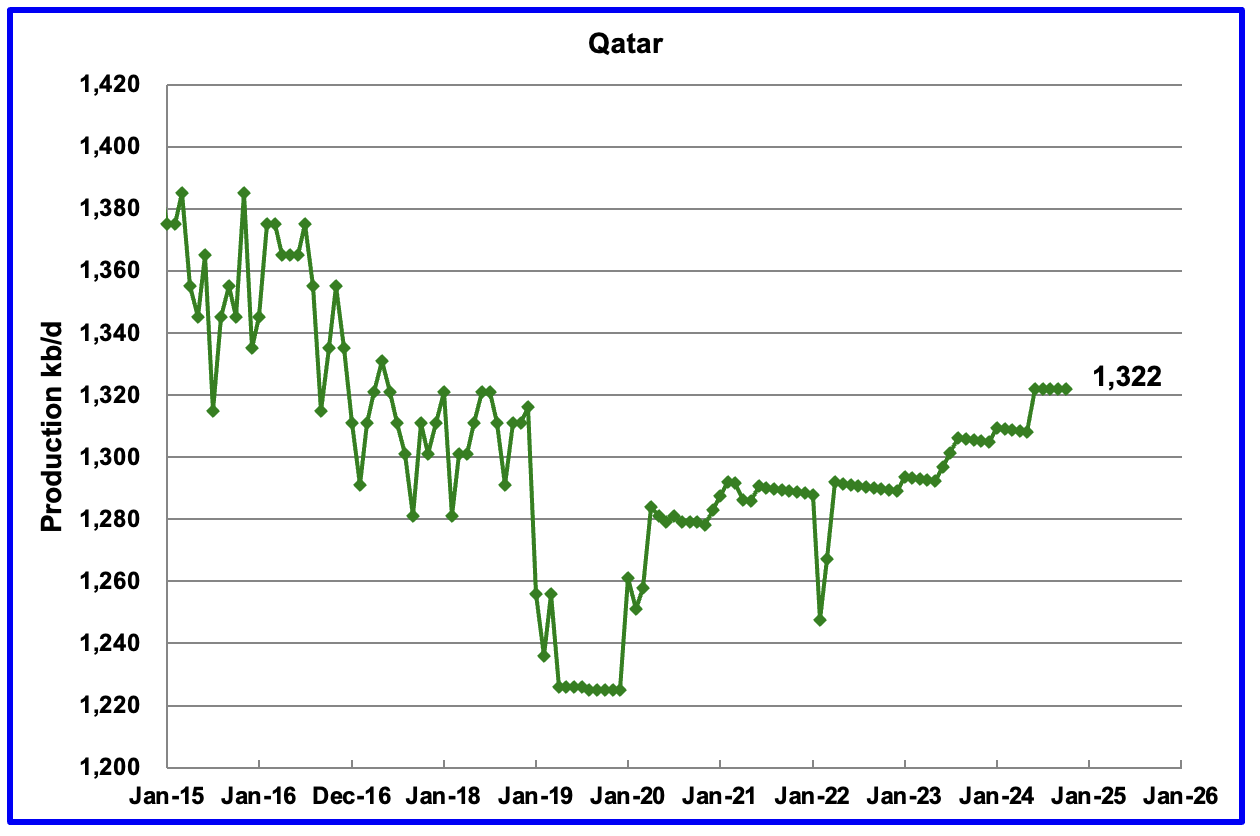
The EIA had been reporting flat output of 1,322 kb/d for Qatar since early 2022. However the current October update has revised down all of the previous production data. Qatar’s October output was reported again to be 1,322 kb/d.
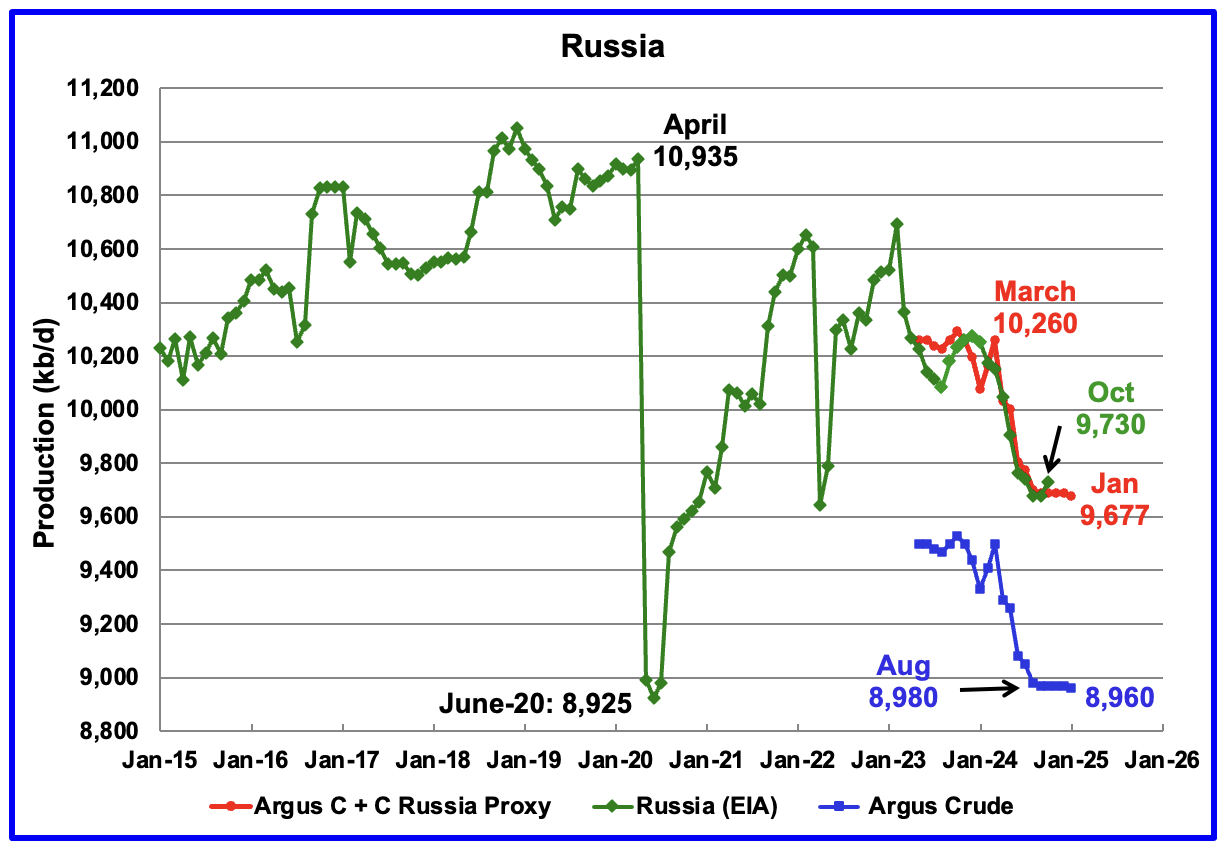
The EIA reported Russia’s October C + C production rose by 53 kb/d to 9,730 kb/d and was down 504 kb/d from last year.
Using data from Argus Media reports, Russian crude production is shown from May 2023 to January 2025. For January 2025, Argus reported Russian crude production was 8,960 kb/d, down 10 kb/d from December, blue markers. Adding 8% to Argus’ January’s crude production provides a C + C production estimate of 9,677 kb/d for Russia, which is a proxy for the Pre-War Russian Ministry estimate, red markers. This Bloomberg Article confirms the Argus estimate for Russian production.
According to Argus, Russian crude production of 8,960 kb/d is in compliance with their OPEC target of 8,980 kb/d because it is 20 kb/d lower.
In pre-war times, the Russia Energy Ministry production estimate used to be 400 kb/d higher than the EIA estimate. For October, the EIA’s C + C estimate of 9,730 is 42 Kb/d higher than the Argus proxy estimate of 9,688 kb/d.
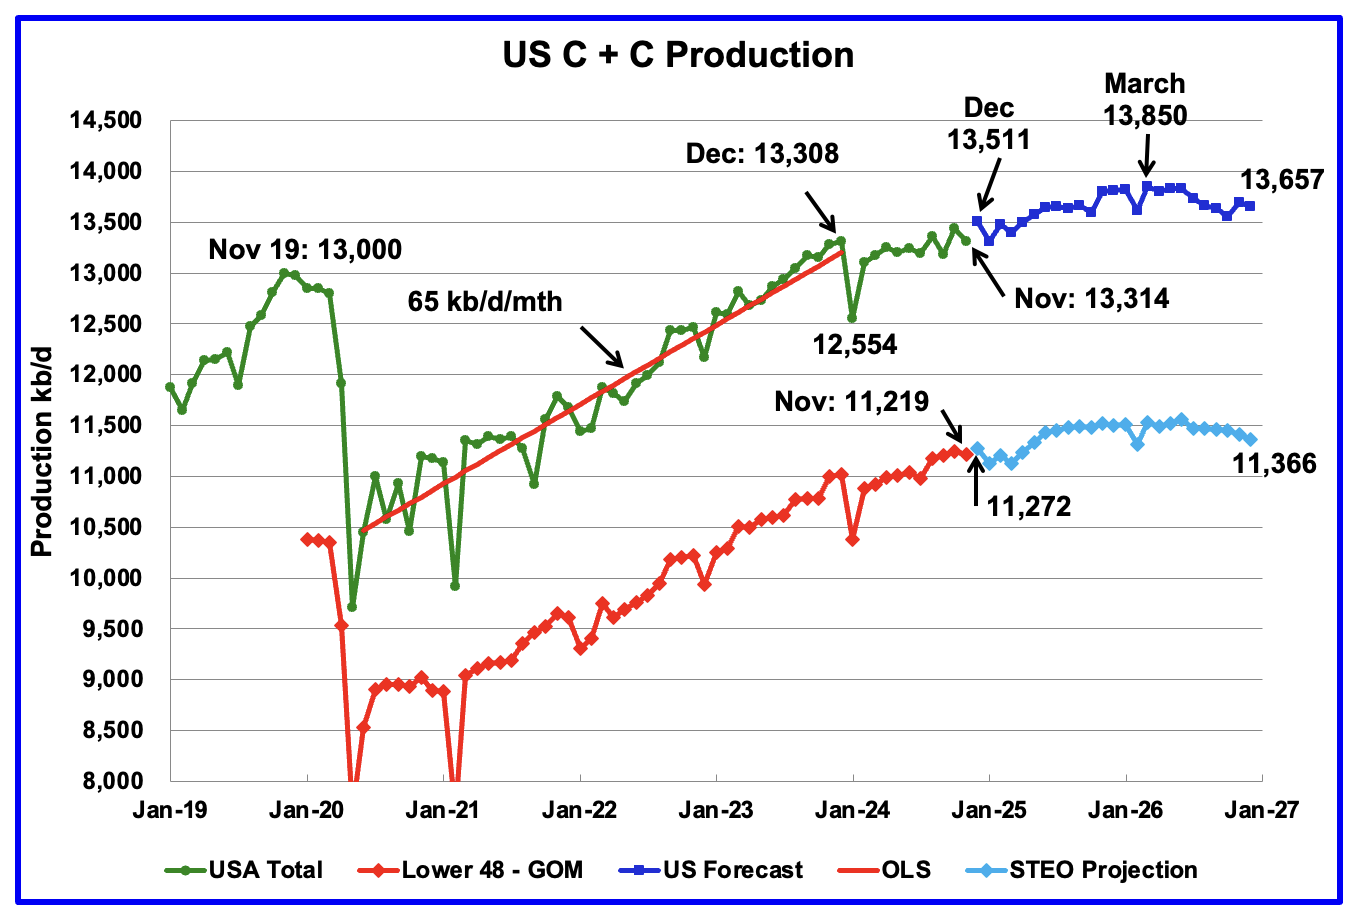
This US production chart is very similar to the one published last week in the US update post. The STEO portions of the two graphs have been updated using the February 2025 STEO.
Production in December 2026 is 193 kb/d lower than the March 2026 peak of 13,850 kb/d. For the onshore L48, oil production falls off in the latter half of 2026 to 11,366 kb/d.