


New Record High for U.S. October Oil Production
By Ovi All of the Crude plus Condensate (C + C) production data, oil, for the US state charts comes from the EIAʼs Petroleum Supply monthly PSM which provides updated information up to October 2024. U.S. October oil production increased by 259 kb/d to 13,457 kb/d. The largest increases came from the GOM, 191 kb/d and Texas, 55 kb/d. […]
By Ovi
All of the Crude plus Condensate (C + C) production data, oil, for the US state charts comes from the EIAʼs Petroleum Supply monthly PSM which provides updated information up to October 2024.
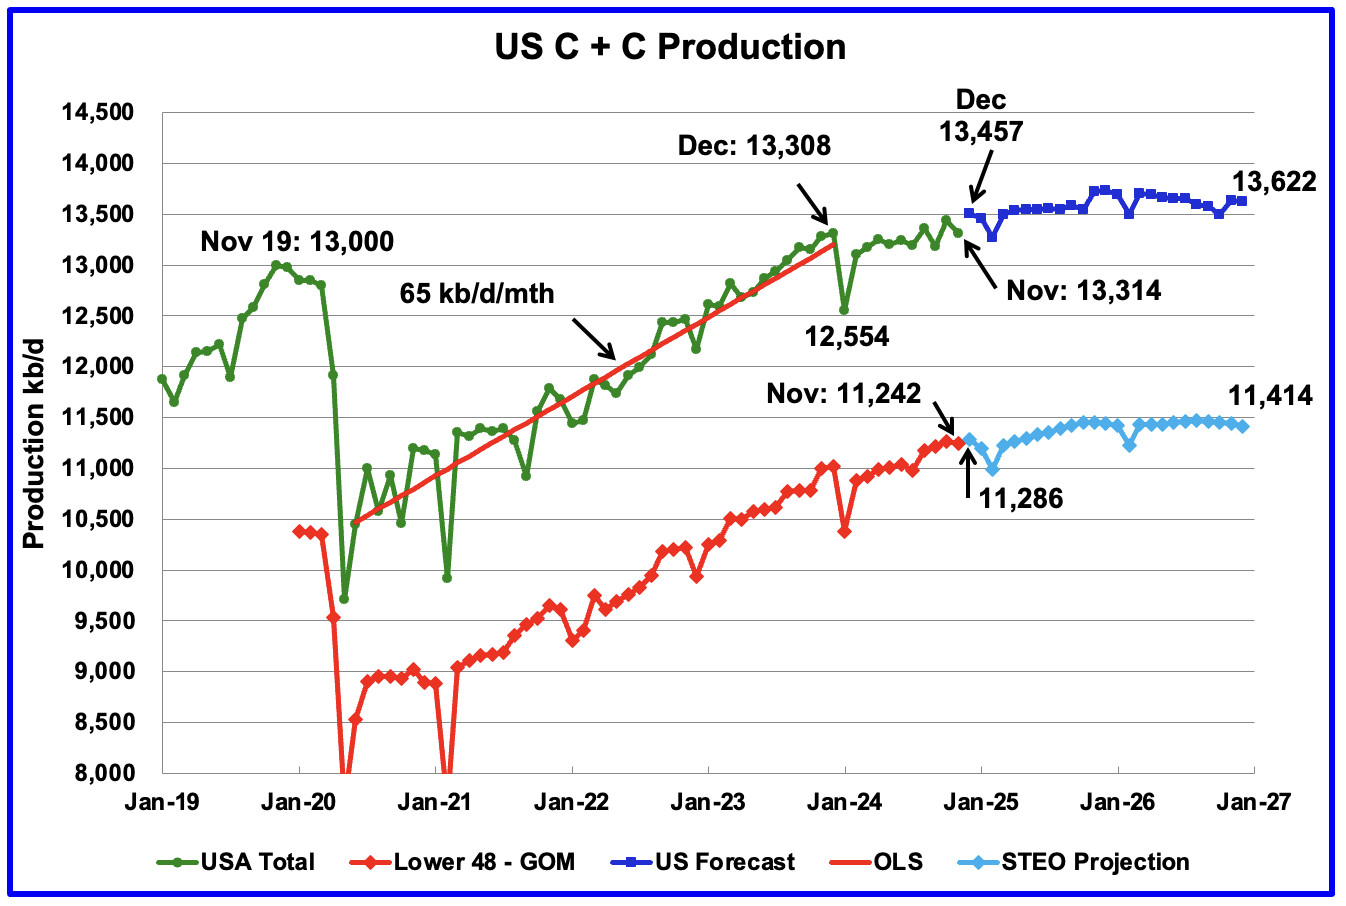
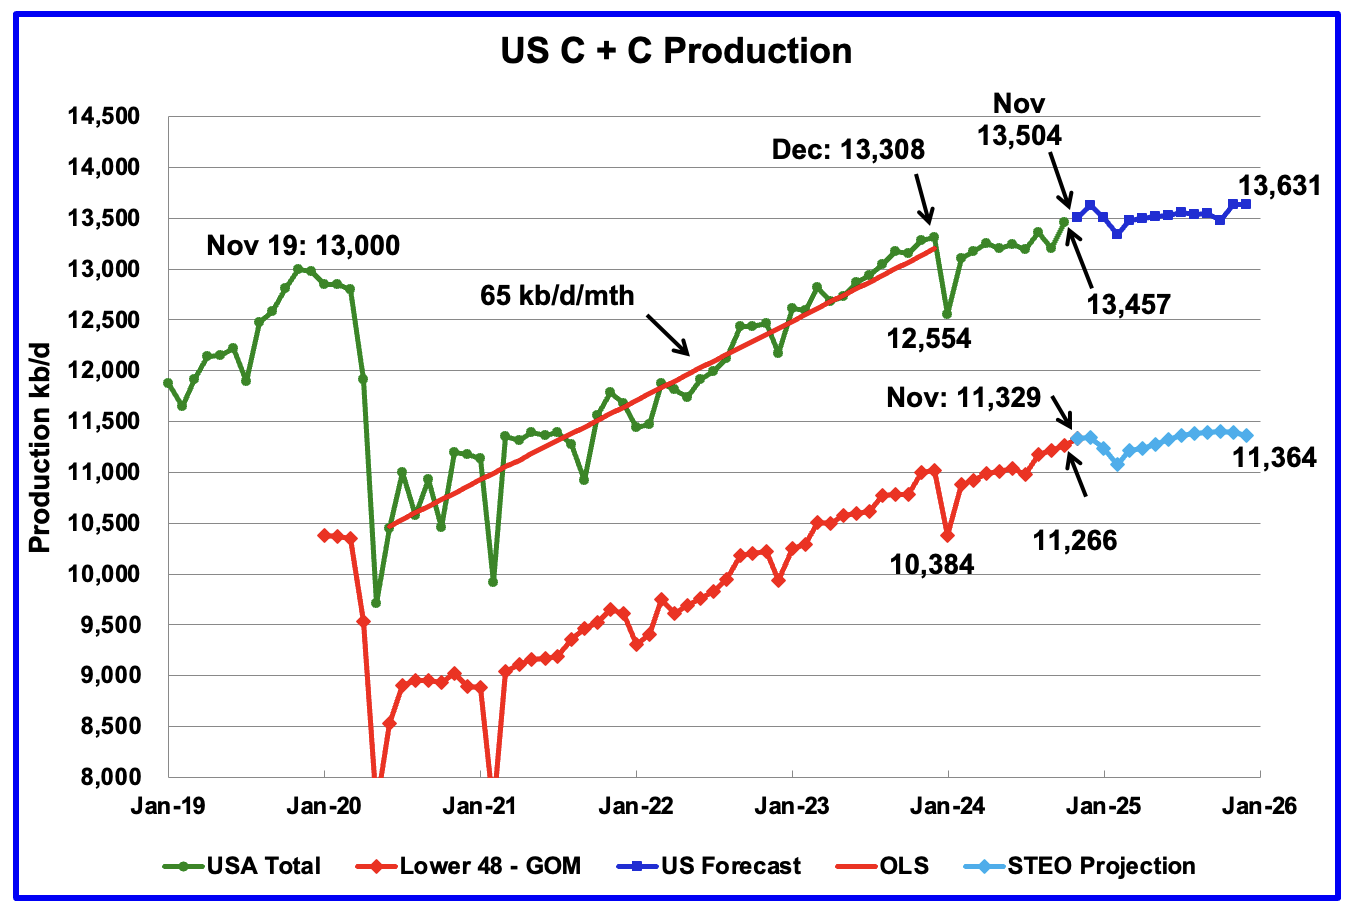
U.S. October oil production increased by 259 kb/d to 13,457 kb/d. The largest increases came from the GOM, 191 kb/d and Texas, 55 kb/d.
The dark blue graph, taken from the December 2024 STEO, is the forecast for U.S. oil production from November 2024 to December 2025. Output for December 2025 is expected to reach 13,631 kb/d, down 30 kb/d from the previous post. From November 2024 to December 2025 production is expected to grow by 127 kb/d. Most of the increase will occur in November/December 2025 time frame.
The light blue graph is the STEO’s projection for output to December 2025 for the Onshore L48. October Onshore L48 production increased by 49 kb/d to 11,266 kb/d. From October 2024 to December 2025, production is expected to increase by 98 kb/d to 11,364 kb/d. Note how the last three months are indicating a possible peak in the Onshore L48.
US Oil Production Ranked by State
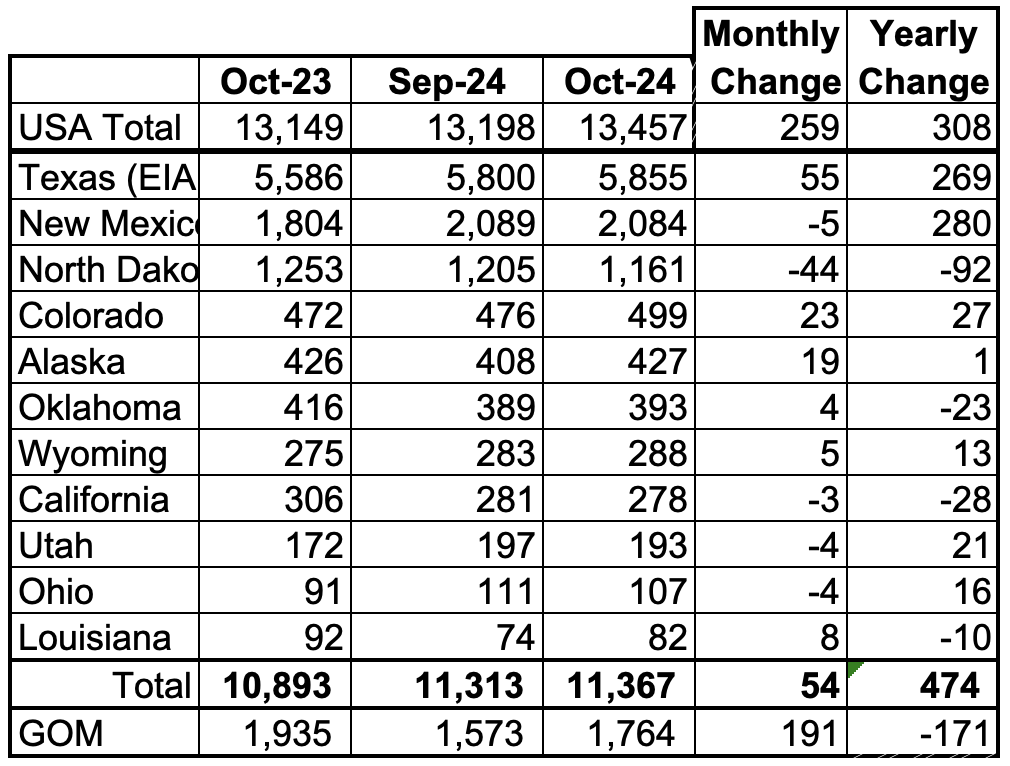
Listed above are the 11 US states with the largest oil production along with the Gulf of Mexico. Ohio has been added to this table since its production approached 100 kb/d in January and exceeded Louisiana’s production. These 11 states accounted for 84.5% of all U.S. oil production out of a total production of 13,457 kb/d in October 2024.
On a MoM basis, October oil production in these 11 states rose by 54 kb/d. On a YoY basis, US production increased by 308 kb/d.
State Oil Production Charts
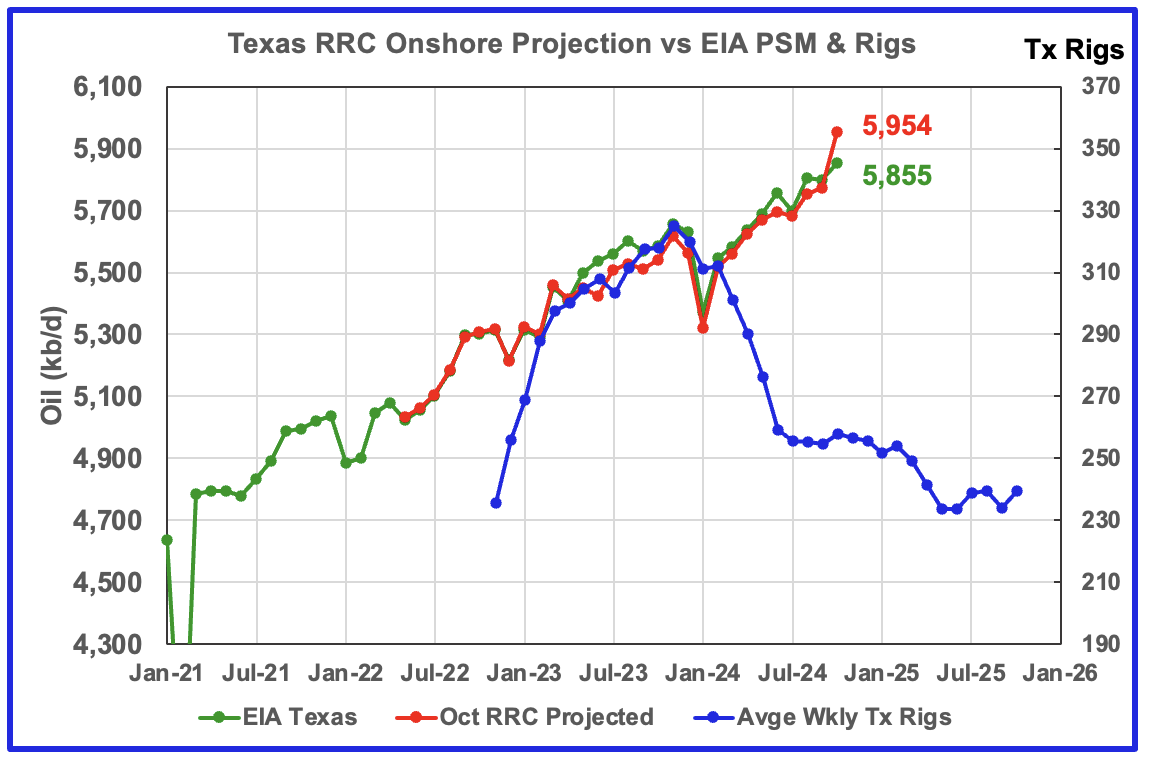
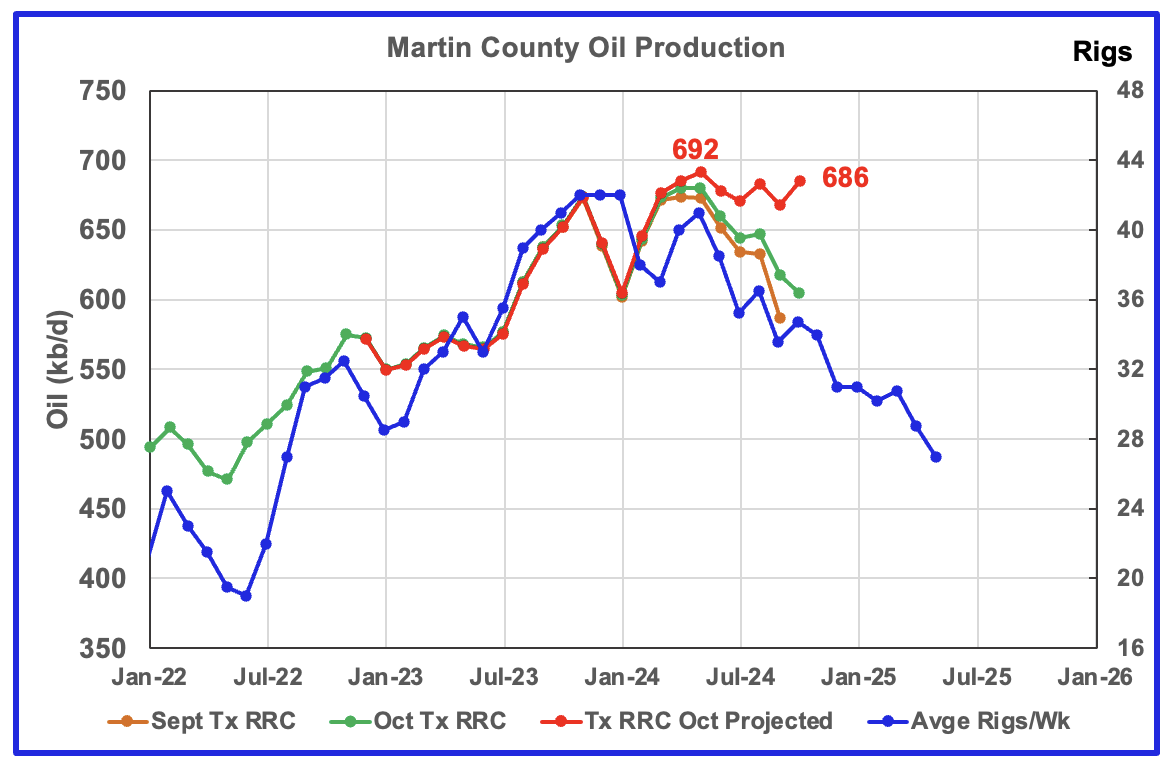
Texas production increased by 55 kb/d in October to 5,855 kb/d a new record high. YoY production is up by 269 kb/d.
The red graph is a production projection for Texas using Texas’ RRC reported September and October oil production. The projection uses the cumulative difference between the September and October preliminary production data provided by the Texas RRC. I think there is some catch up reporting of older production in the September production reported in the October RRC data. This makes the October production projection of 5,954 slightly on the high side. This slight over production estimate may be corrected in the November update.
The blue graph shows the average number of weekly rigs reported for each month, shifted forward by 10 months. So the 276 rigs operating in July 2023 have been shifted forward to May 2024. From February 2024 to July 2024, the rig count dropped from 312 in time shifted February 2024 to 256 in July 2024. That drop of 56 rigs has had no impact on production up to now.
As of October, production rose even though the rig count continued to fall. This is a clear indication that some significant improvements have been made with drilling technology and possibly fracturing.

According to the EIA, New Mexico’s October production dropped by 5 kb/d to 2,084 kb/d.
The blue graph is a production projection for Lea plus Eddy counties. These two counties account for close to 99% of New Mexico’s oil production. The projection used the difference between the September and October preliminary production data provided by the New Mexico Oil Conservation Division. A 1% correction was added to the Lea plus Eddy projection to account for their approximate fraction of New Mexico’s oil production. The projection estimates October production increased by 73 kb/d to 2,121 kb/d. The increase is related to increasing production in Eddy county and discussed further down in the Permian section.
Note the methodology used to project New Mexico’s production is the same as that used for Texas.
More oil production information for a few New Mexico and Texas counties is reviewed in the special Permian section further down.
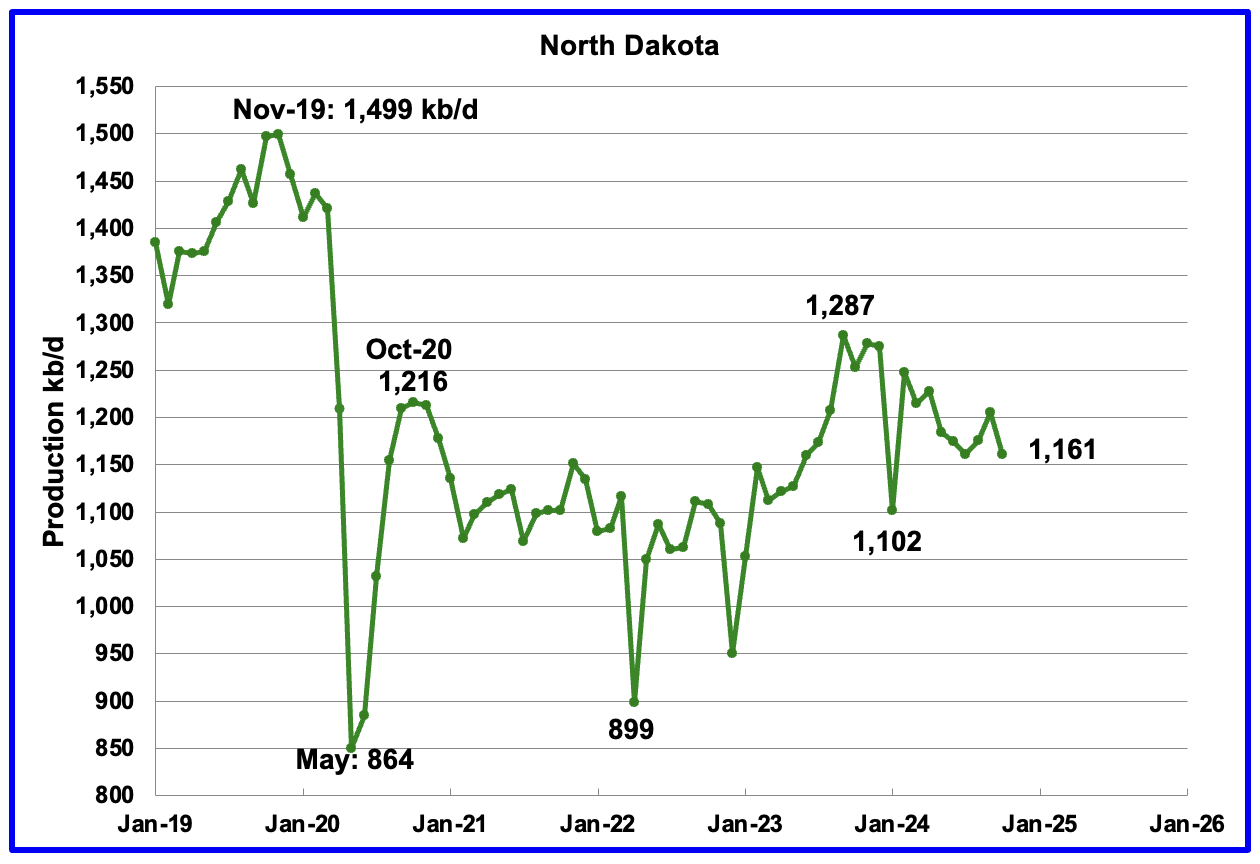
October’s output decreased by 44 kb/d to 1,161 kb/d. Production is down by 126 kb/d from the post pandemic peak of 1,287 kb/d.
According to this article, ND production drillers shut in wells due to fires.
Oil operators in North Dakota, the third-largest producing state in the U.S., are still bringing some facilities back online after wildfires swept through key oil-producing counties in October, the state’s Industrial Commission said on Wednesday.
The outages are limited to isolated production facilities such as well pads, which experienced either local equipment damage or a loss of electricity due to damaged power lines, according to Justin Kringstad, the director of the North Dakota Pipeline Authority.
October output in the state shrank by 520,000 barrels largely due to operators shutting in wells to protect against wildfire damage, said Mark Bohrer, assistant director of the oil and gas division at the North Dakota Department of Mineral Resources.
“The (fall in production) figure is significant,” said Bohrer.
Production in October fell to 1.178 million barrels per day (bpd), down from 1.2 million bpd in September, monthly data from the commission showed on Wednesday. (Ovi: Note the EIA October production estimate is 17 kb/d lower at 1.161 Mb/d than reported by North Dakota).
Currently, the state’s rig count is steady on the month, at 37 in December. But this is expected to increase to the mid-40s over the next couple of years, Bohrer added.
There are 14 active hydraulic fracturing crews in North Dakota as of December, down from 16 last month and from 18 in October.
Another Article reports that some 4 mile laterals are being permitted.
“He said the trend over the past several years has been less 2-mile lateral wells being permitted and more 3-mile lateral permits coming in. He said most recently, there’s been probably half a dozen 4-mile lateral permits, He said the trend for longer laterals continues in the state.“
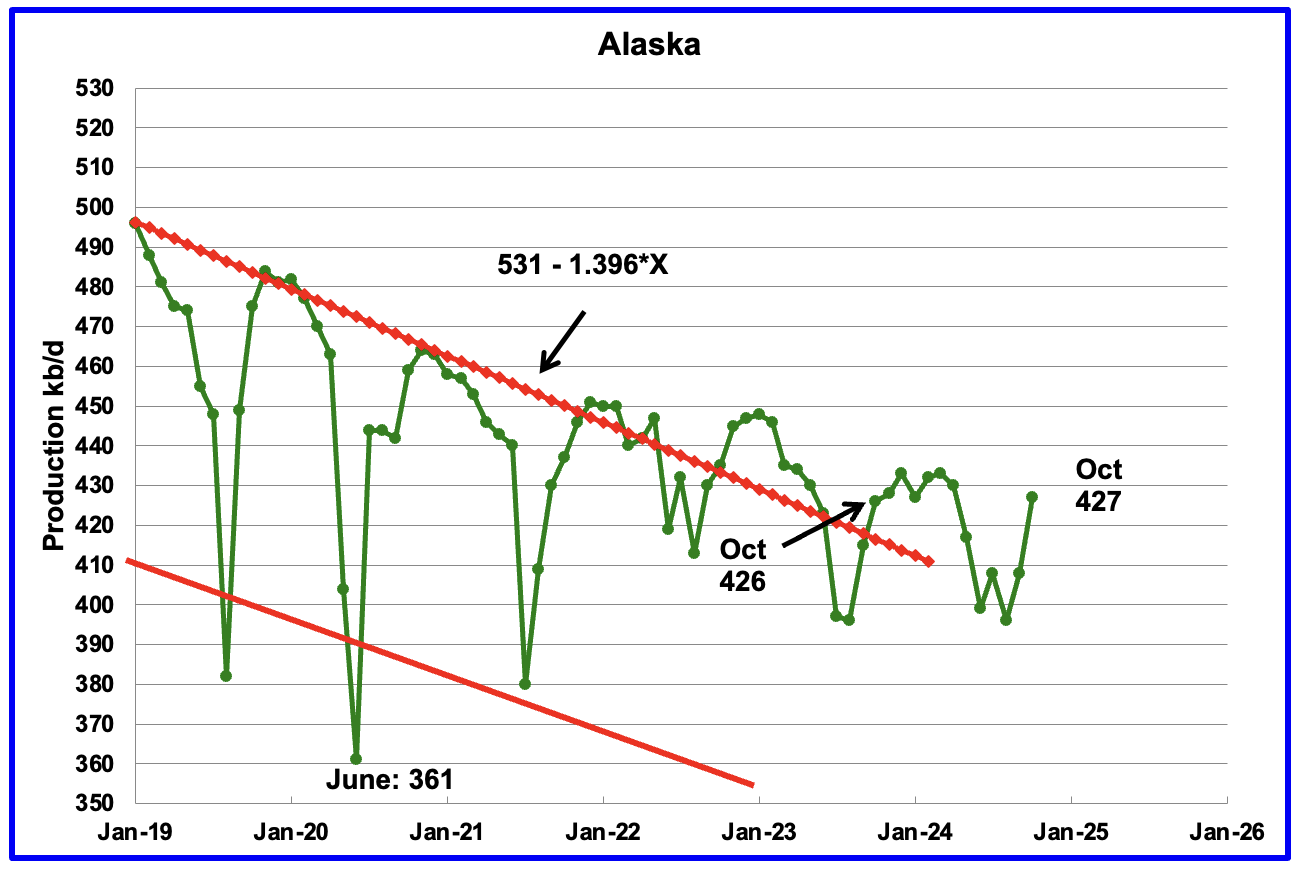
Alaskaʼs October output rose by 19 kb/d to 427 kb/d while YoY production rose by 1 kb/d. The increase in production is an indication that summer maintenance is winding down and production should begin to recover. Weekly Alaska October production reports are close to 430 kb/d while December is approaching 436 kb/d.

Coloradoʼs October oil production increased by 23 kb/d to 499 kb/d. Colorado began the year with 12 rigs but dropped to 10 during June, July and August and had 8 in operation October and November.
The majority of Colorado’s oil comes from the Denver-Julesburg (DJ) Basin located in Weld county, according to this Article.
According to this Article, “Colorado oil and gas regulators have given final approval to a new rule requiring drillers to better analyze the combined environmental effects of their operations, but activists say the move is the latest example of the state failing to live up to the goals of a 2019 health and safety law.”
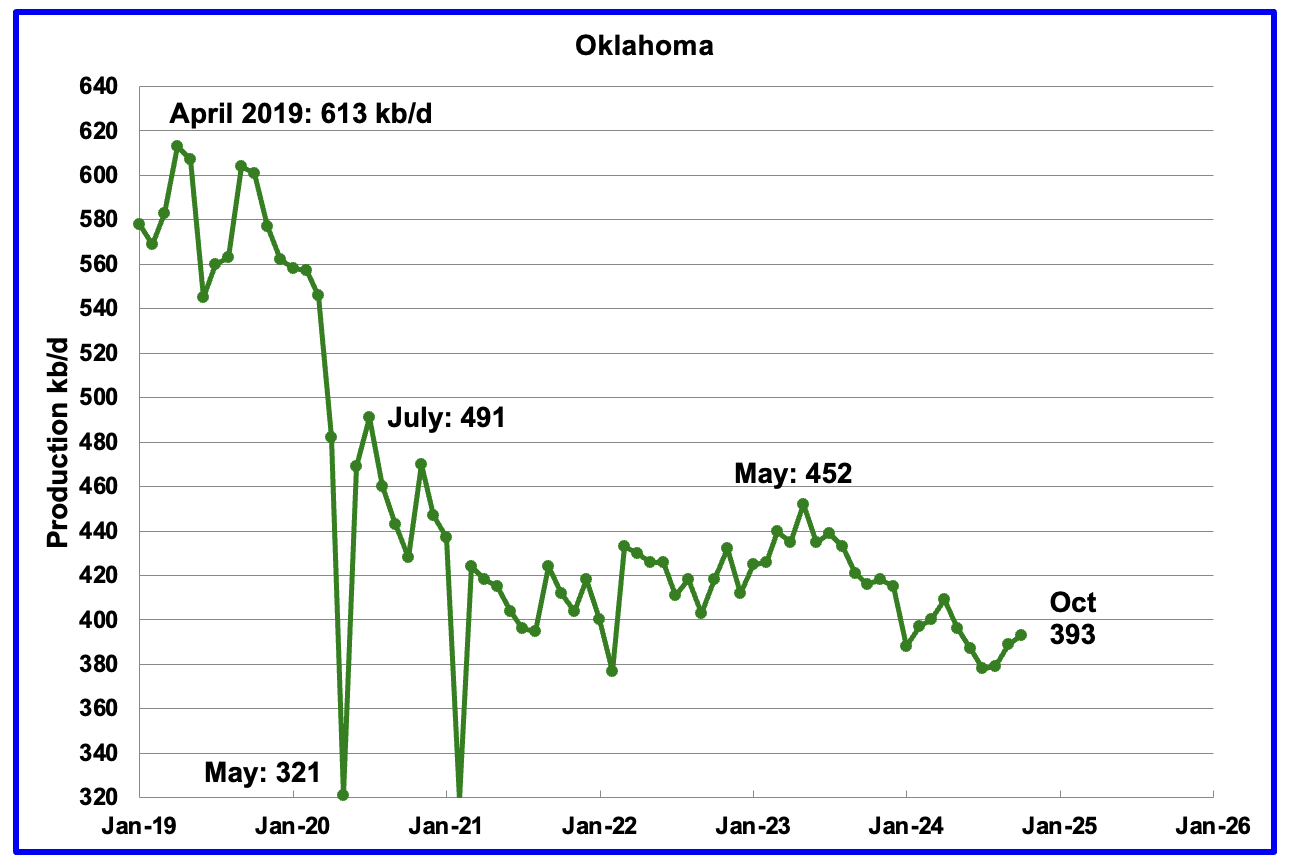
Oklahoma’s output in October rose by 4 kb/d to 393 kb/d. Production remains below the post pandemic July 2020 high of 491 kb/d and is down by 59 kb/d since May 2023. Output entered a slow declining phase in June 2023 but appears to be recovering.
Oklahoma’s rig count dropped from 40 in May to 30 in July. By the end of September 2024 there was an uptick to 41 operational rigs and has held steady at 40 in October and November. Will the increase in the rig count result in increasing/stabilizing oil production.
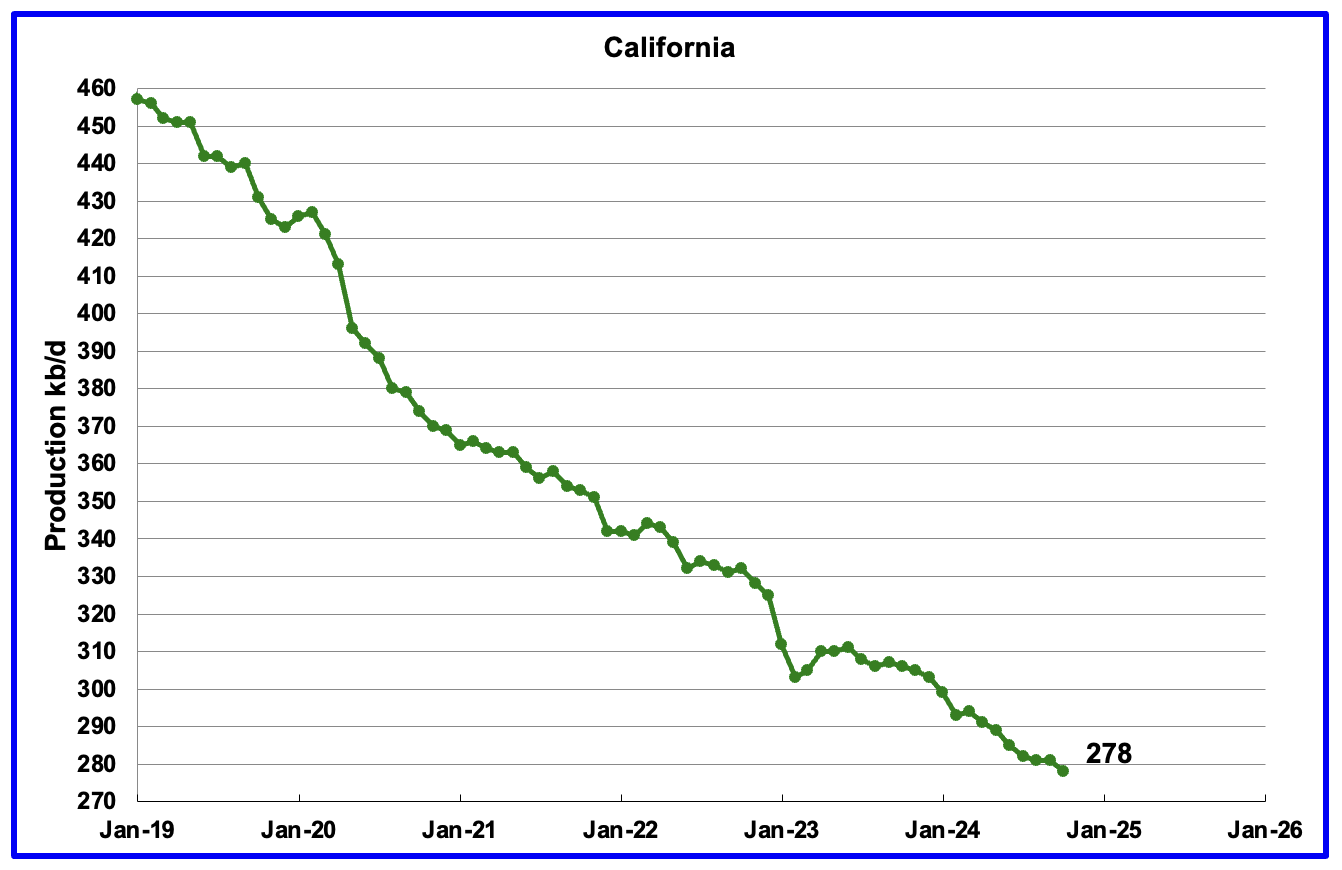
California’s declining production trend continues. October production dropped by 3 kb/d to 278 kb/d.
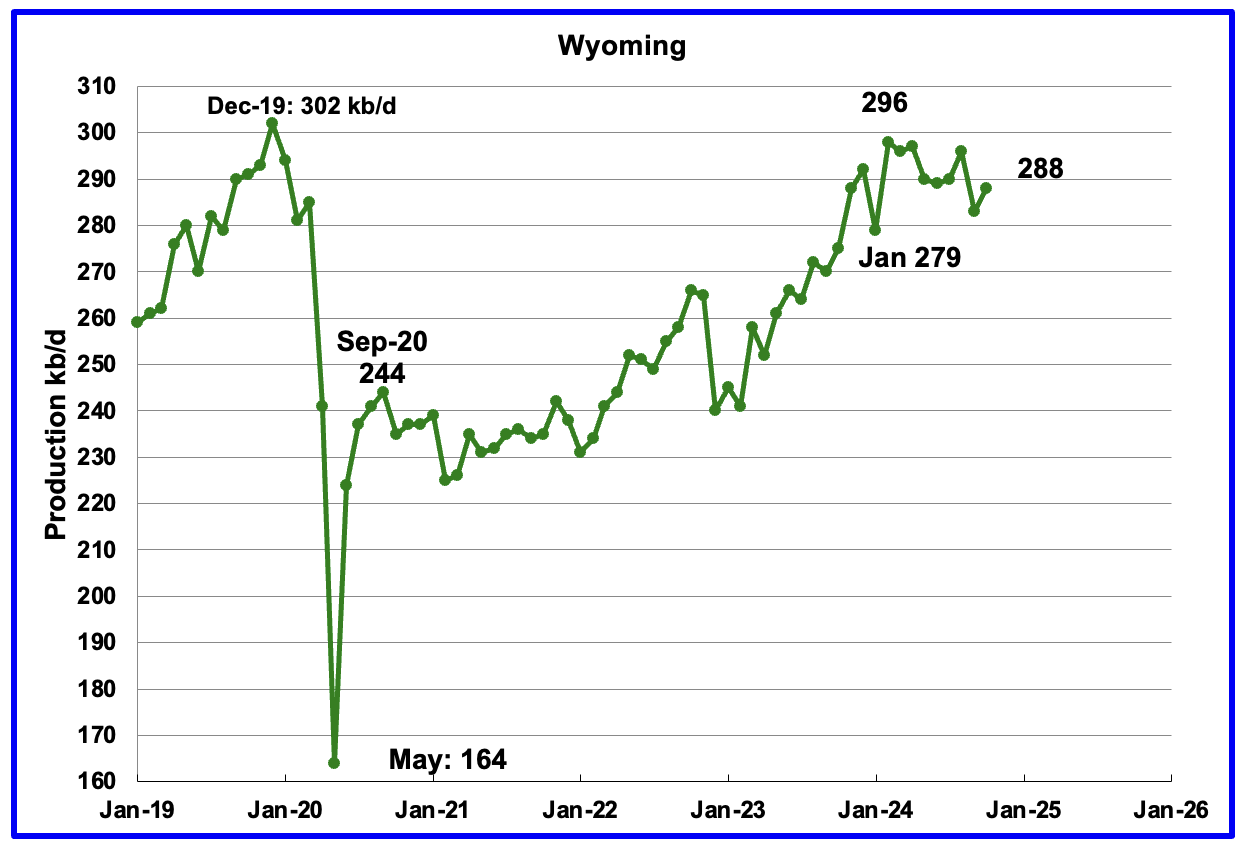
Wyoming’s oil production has been rebounding since March 2023. However the rebound was impacted by the January 2024 storm. Production peaked in February 2024 and is showing signs of being on a plateau.
October’s production rose by 5 kb/d to 288 kb/d. Note that production has almost recovered to the pre-Covid level of 302 kb/d.
In August Wyoming had 8 operational rigs. The rig count has slowly risen to 14 in November.
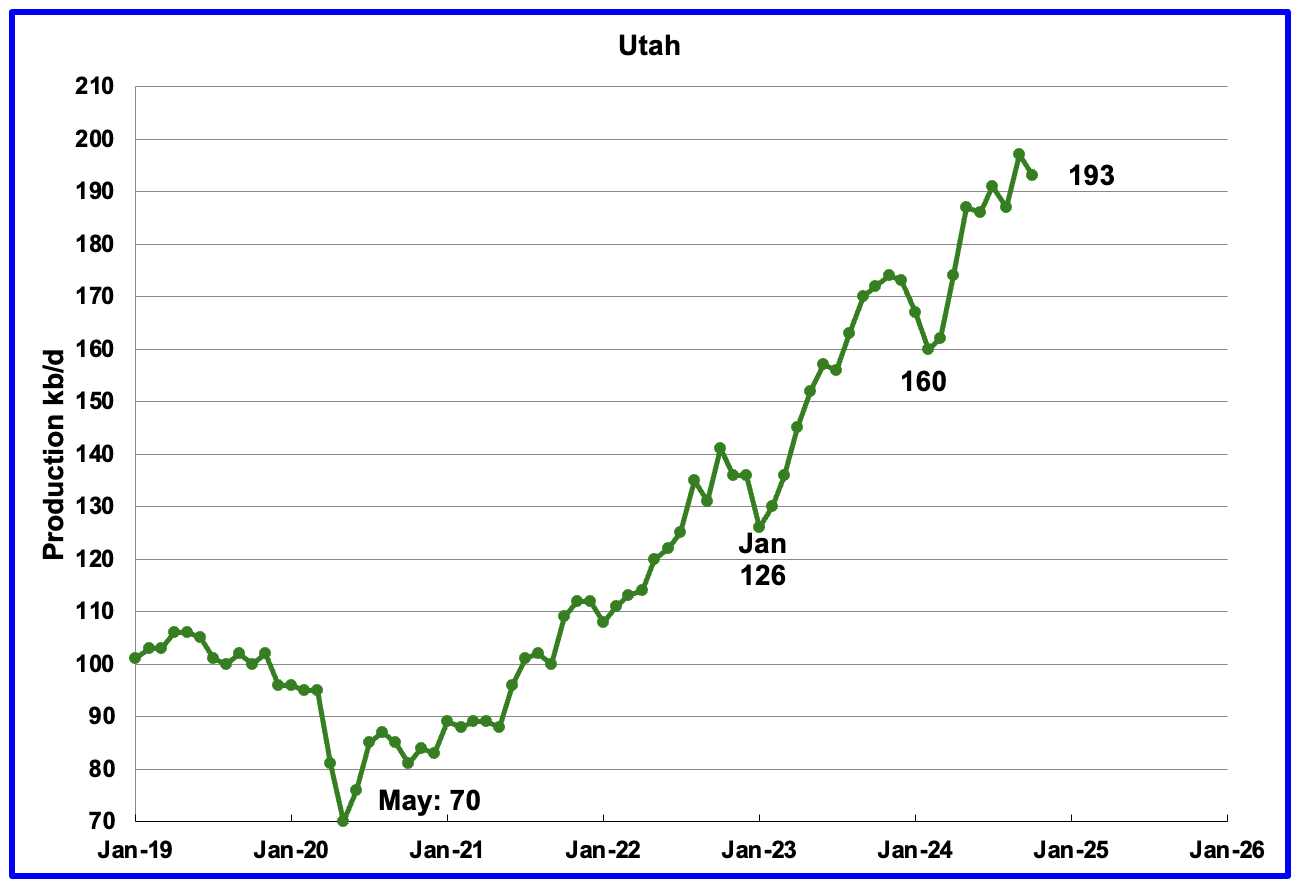
October’s production decreased by 4 kb/d to 193 kb/d. Utah had 9 oil rigs in operation from January to September 2024 but dropped to 8 in October and November.
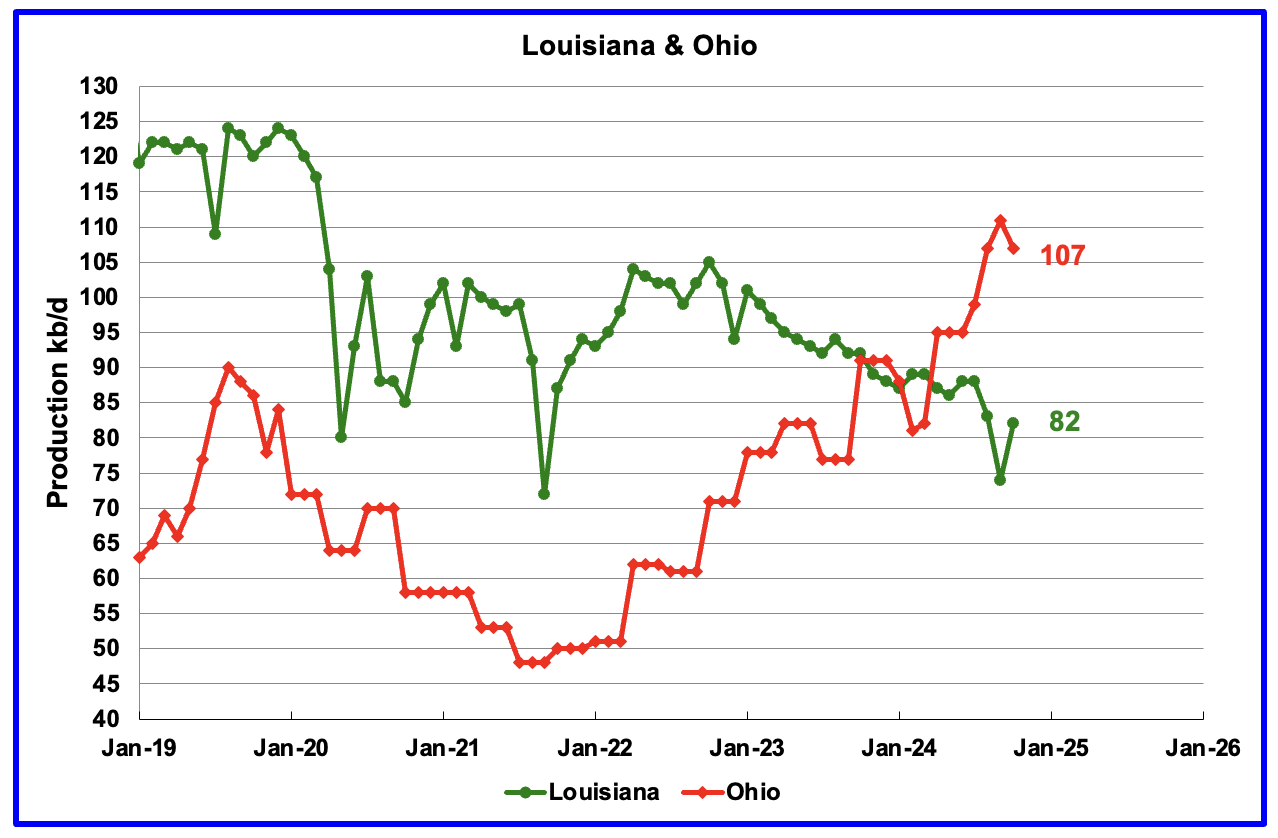
Ohio has been added to the Louisiana chart because Ohio’s production has been slowly increasing since October 2021 and passed Louisiana in November 2023.
Louisiana’s output entered a slow decline phase in October 2022. October’s production rose by 8 kb/d to 82 kb/d.
Ohio’s October oil production dropped by 4 kb/d to 107 kb/d. The most recent Baker Hughes rig report shows two horizontal oil rigs operating in Ohio in September, October and November.
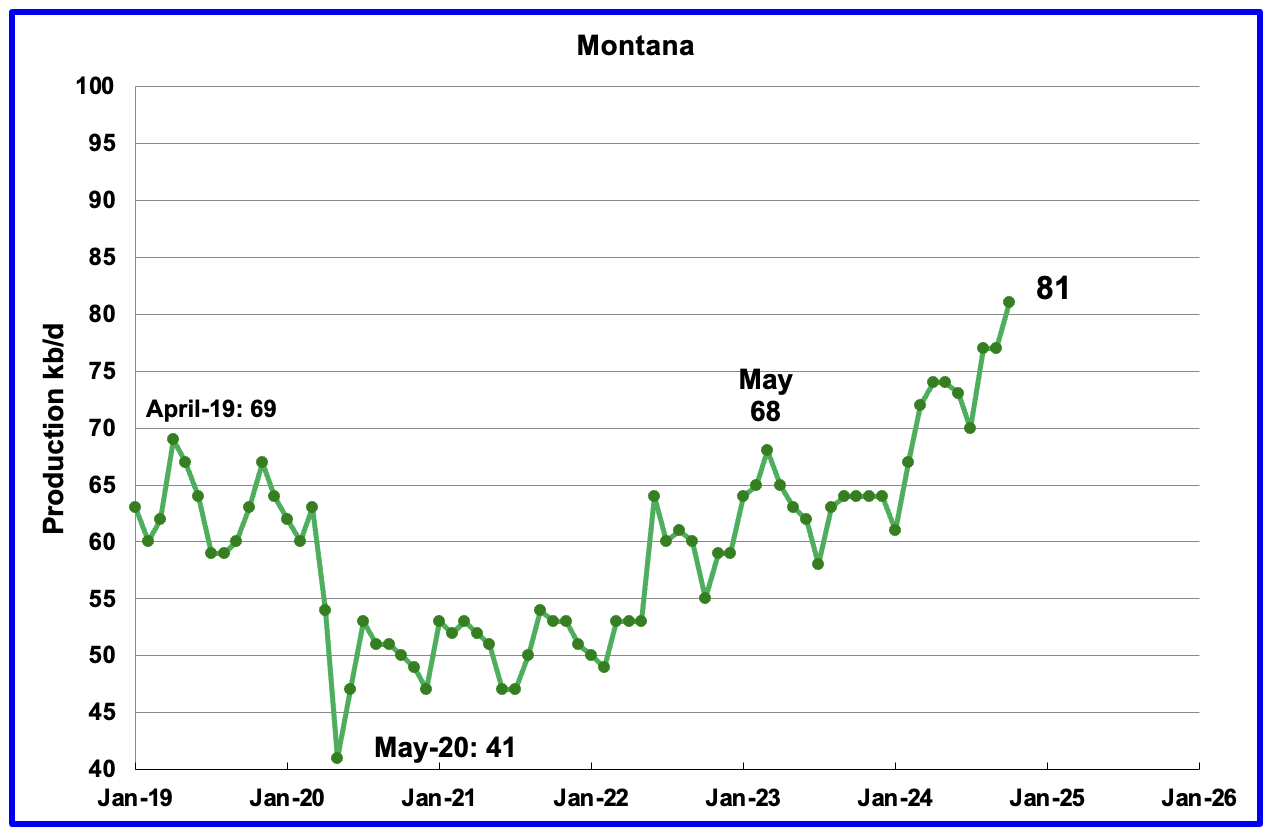
Montana’s oil production is at another new high and possibly heading for 100 kb/d. It’s October oil production is now 1 kb/d lower than Louisiana’s.
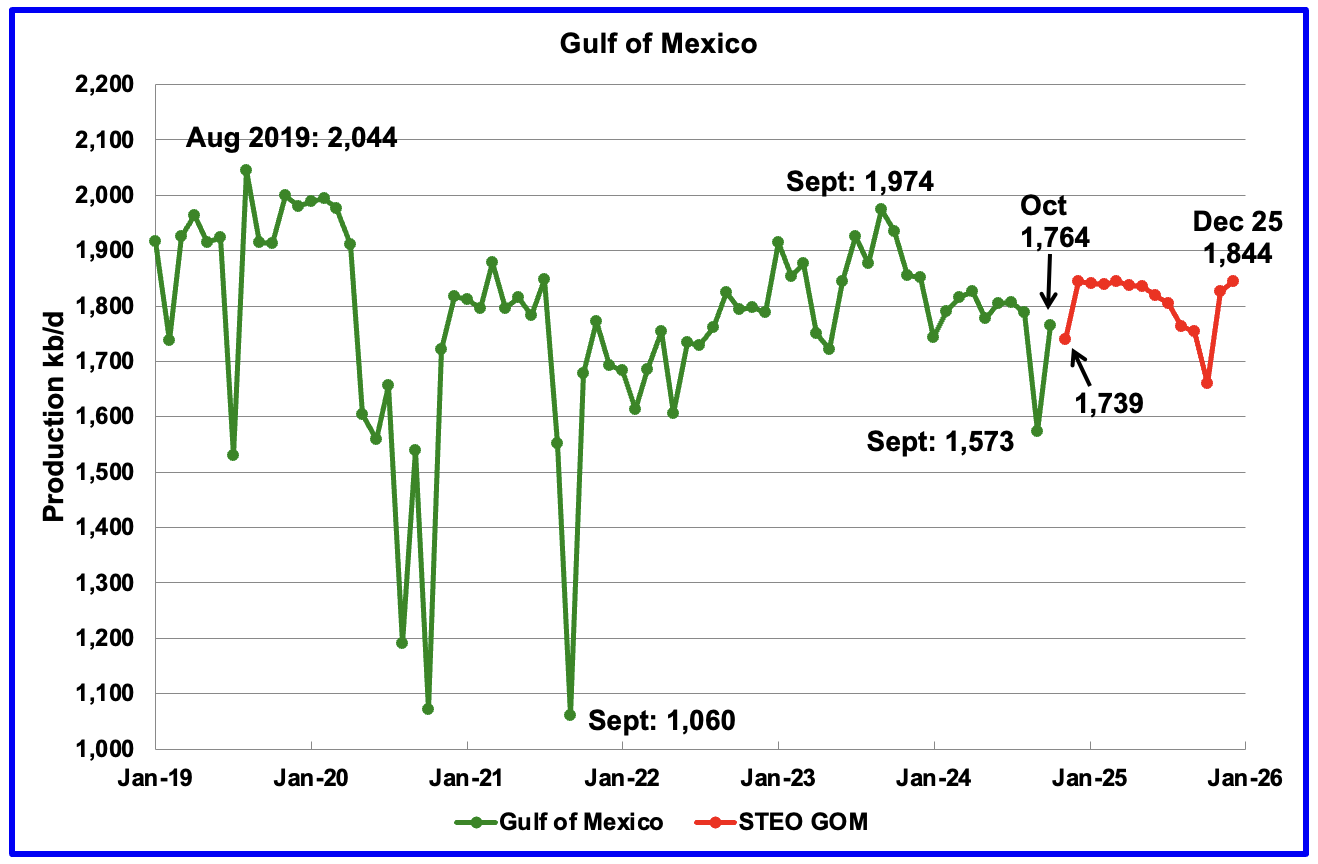
GOM production rose by 191 kb/d in October to 1,764 kb/d but is expected to drop by 25 kb/d in November to 1,739 kb/d. October’s increase is simply the production rebound that came after the September drop caused by Category 4 hurricane Helene.
The December 2024 STEO projection for the GOM output has been added to this chart. It projects production from October 2024 to December 2025 will rise by 80 kb/d to 1,844 kb/d.
A Different Perspective on US Oil Production
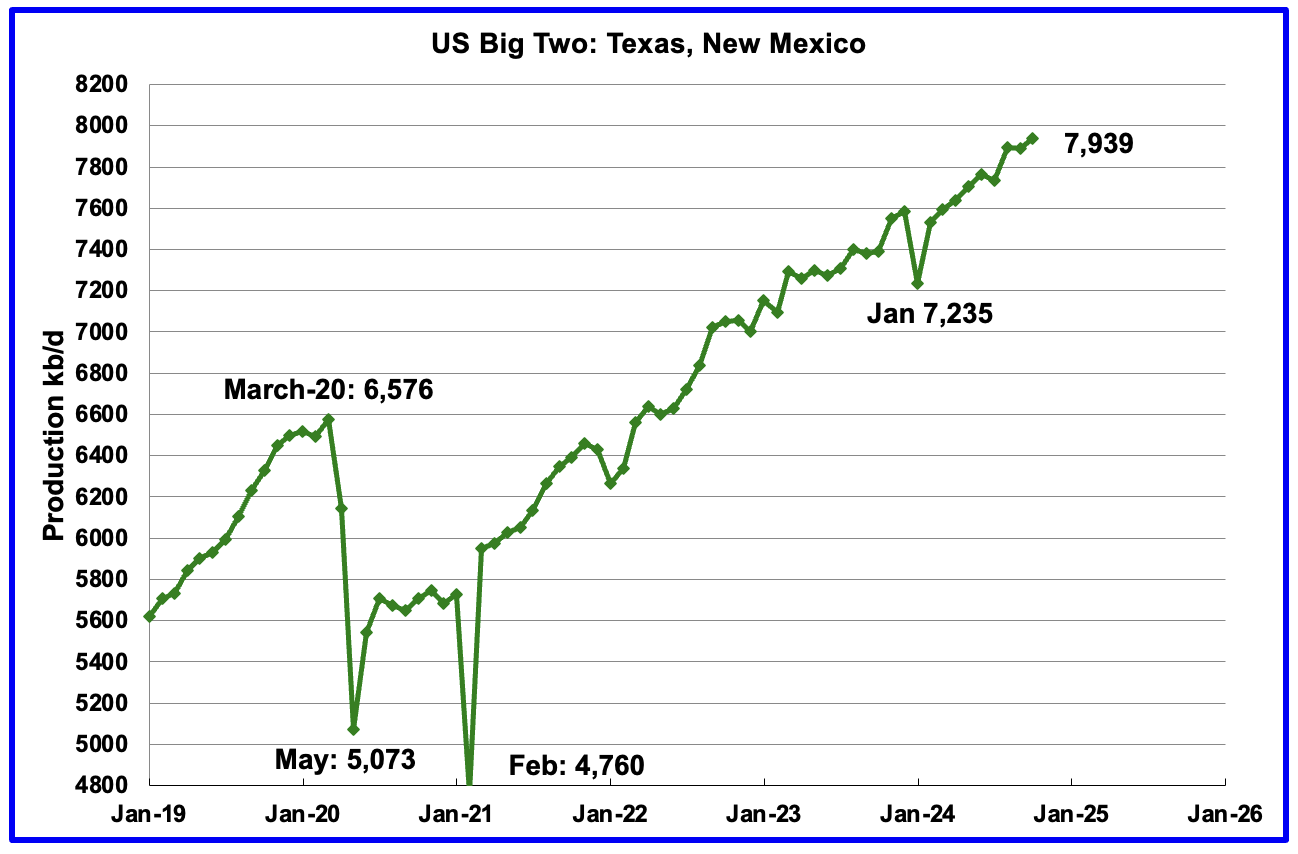
The Big Two states combined oil output for Texas and New Mexico.
October’s production in the Big Two states increased by a combined 50 kb/d to 7,939 kb/d, a new high, with Texas adding 55 kb/d while New Mexico dropped by 5 kb/d.
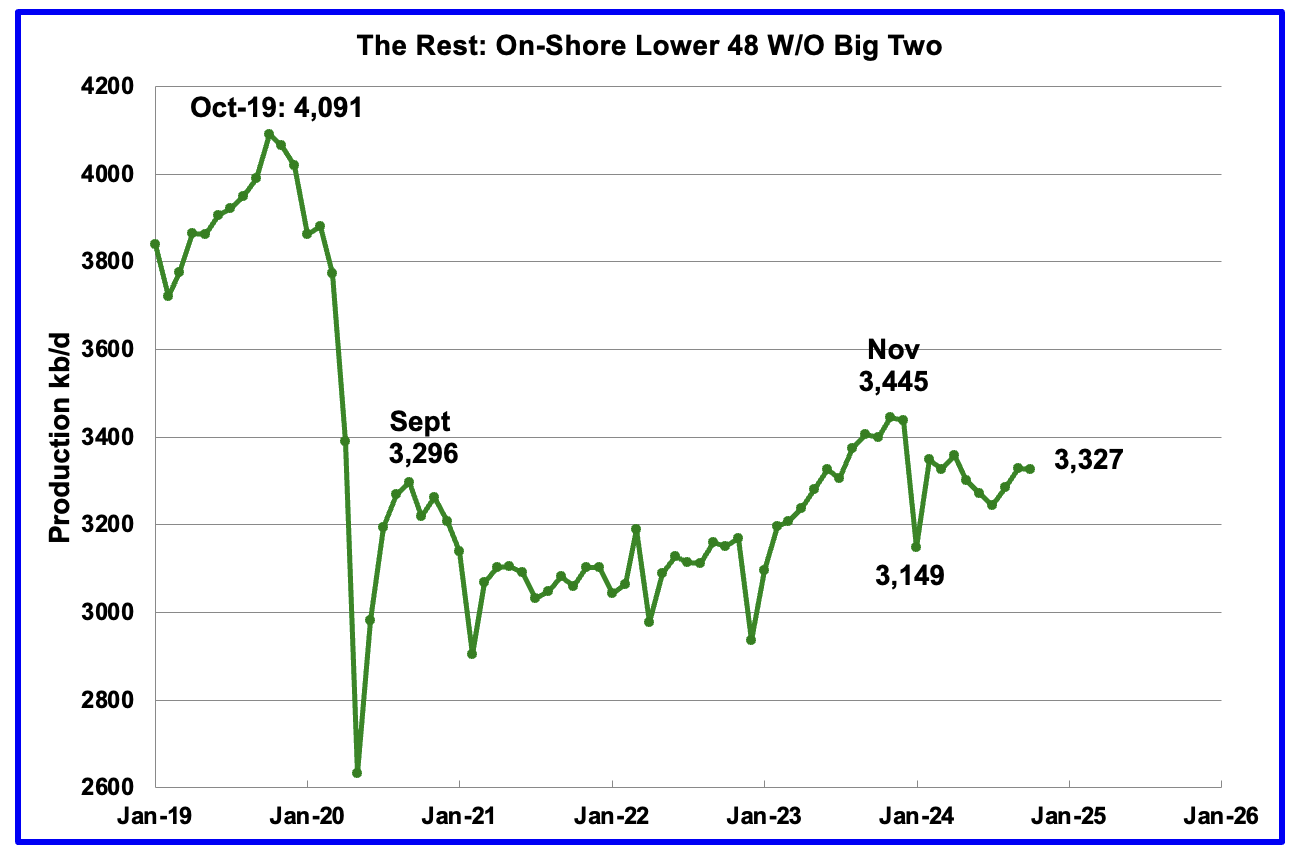
Oil production by The Rest
October’s oil production by The Rest dropped by 1 kb/d to 3,327 kb/d and is 118 kb/d lower than November 2023.
The main takeaway from The Rest chart is that current production is below the high of October 2019 and is a significant loss that occurred during the Covid shut down and will not be readily recovered. Note that October 2024 production has now exceeded the Sept 2020 post covid rebound to 3,296 kb/d by 31 kb/d.
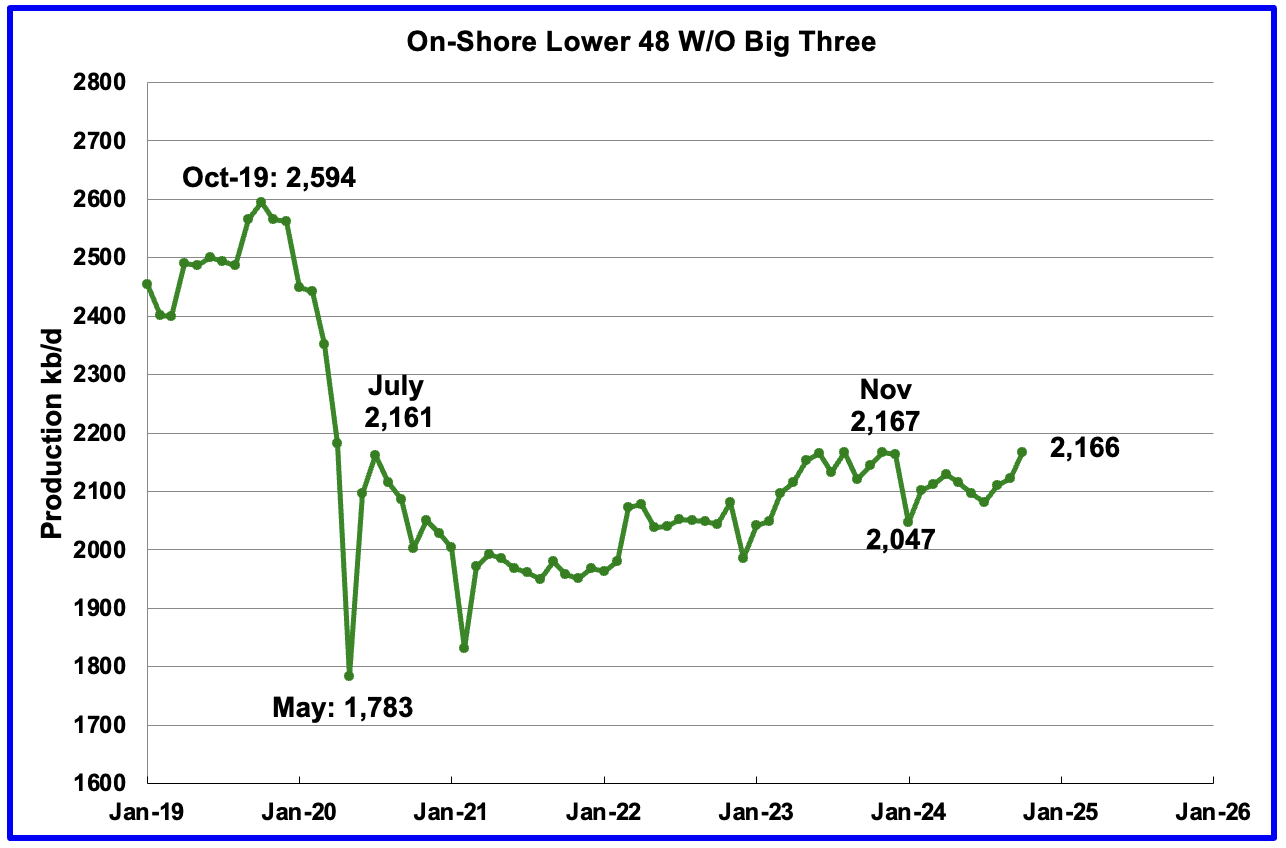
The OnShore L48 W/O the big three, Texas, New Mexico and North Dakota, shows production is on a plateau in the range of 2,100 ±100 kb/d from January 2023.
October’s OnShore L48 W/O the big three production increased by 43 kb/d to 2,166 kb/d.
Permian Basin Report by Main Counties and Districts
This special monthly Permian section was recently added to the US report because of a range of views on whether Permian production will continue to grow or will peak over the next year or two. The issue was brought into focus recently by two Goehring and Rozencwajg Report and Report2 which indicated that a few of the biggest Permian oil producing counties were close to peaking or past peak. Also comments by posters on this site have similar beliefs from hands on experience.
This section will focus on the four largest oil producing counties in the Permian, Lea, Eddy, Midland and Martin. It will track the oil and natural gas production and the associated Gas Oil Ratio (GOR) on a monthly basis. The data is taken from the state’s government agencies for Texas and New Mexico. Typically the data for the latest two or three months is not complete and is revised upward as companies submit their updated information. Note the natural gas production shown in the charts that is used to calculate the GOR is the gas coming from both the gas and oil wells.
Of particular interest will be the charts which plot oil production vs GOR for a county to see if a particular characteristic develops that indicates the field is close to entering or in the bubble point phase. While the GOR metric is best suited for characterizing individual wells, counties with closely spaced horizontal wells may display a behaviour similar to individual wells due to pressure cross talking . For further information on the bubble point and GOR, there are a few good thoughts on the intricacies of the GOR in an earlier POB comment and here. Also check this EIA topic on GOR.
New Mexico Permian
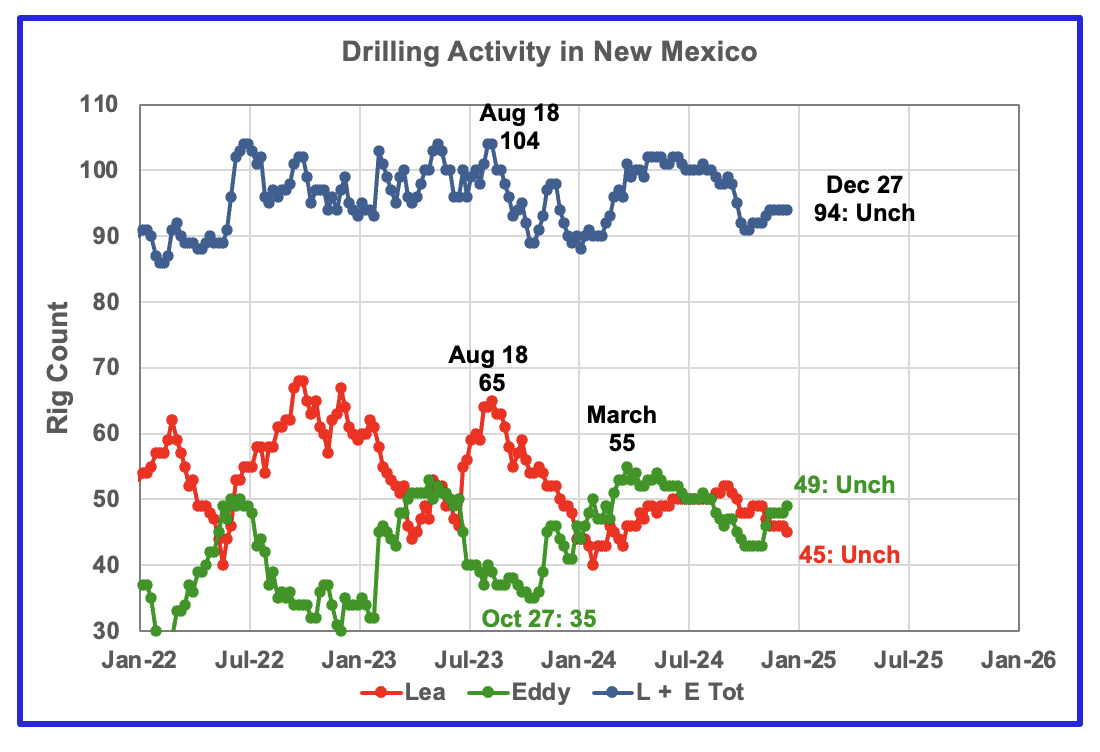
The total rig count in Lea and Eddy counties in the week ending December 27 is down 6 to 94 from the July count of 100 and has held steady for 6 weeks
Lea county rigs have declined from 50 in July to 45 in December.
The Eddy county rig count has increased by 6 from 43 in October to 49 in December. The rise in the Eddy rig count from 35 in October 2023 to 55 in March 2024 is now resulting in increasing production since June 2024. See further down.
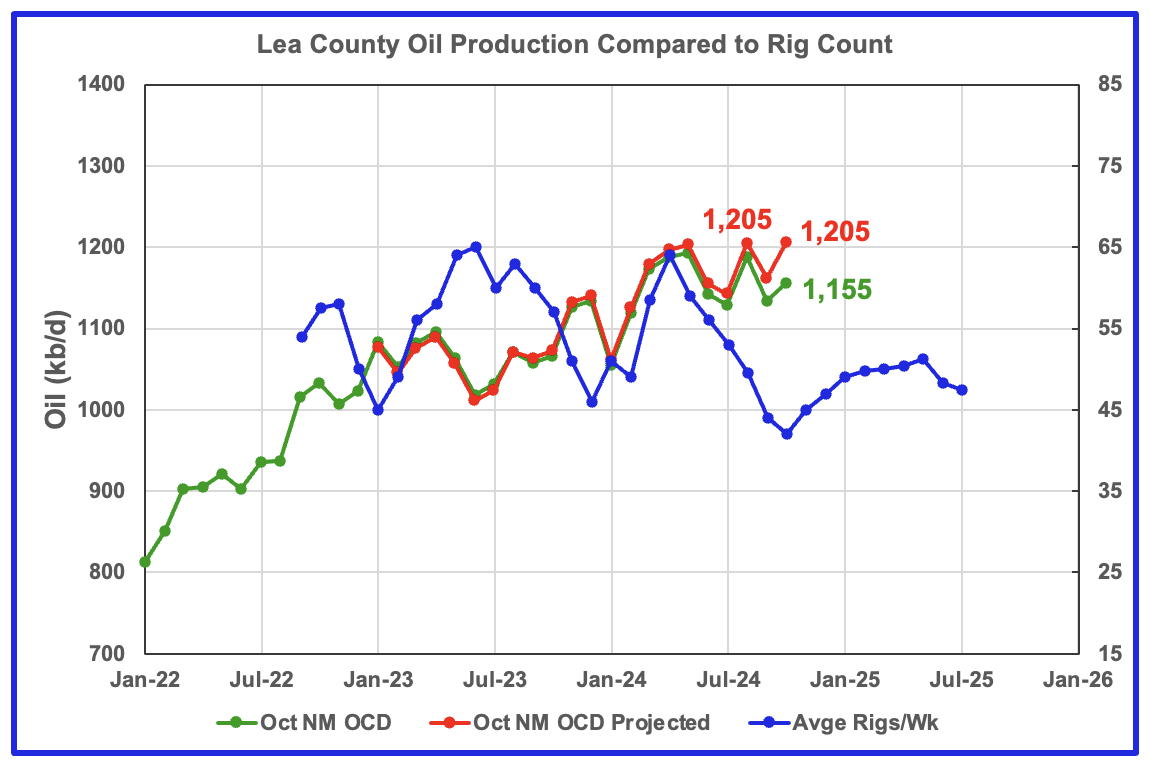
Lea County’s oil production appears to have entered a plateau phase in May at 1,203 kb/d and produced slightly more in August and October at 1,205 kb/d.
Preliminary October data from New Mexico’s Oil Conservation Division (OCD) indicates Lea County’s oil production increased by 21 kb/d to 1,155 kb/d. A projection for October’s final production estimates it will be closer to 1,205 kb/d, an increase of 41 kb/d from September.
The blue graph shows the average number of weekly rigs operating during a given month as taken from the weekly rig chart. The rig graph has been shifted forward by 8 months. So the 64 Rigs/wk operating in August 2023 have been time shifted forward to April 2024 to show the possible correlation and time delay between rig count, completion and oil production. If the oil production were to follow the rig count going forward, oil production in Lea County should start to drop in a few month before recovering in November/December.
Note that rig counts are being used to project production as opposed to completions because very few extra DUCs are being completed at this time.
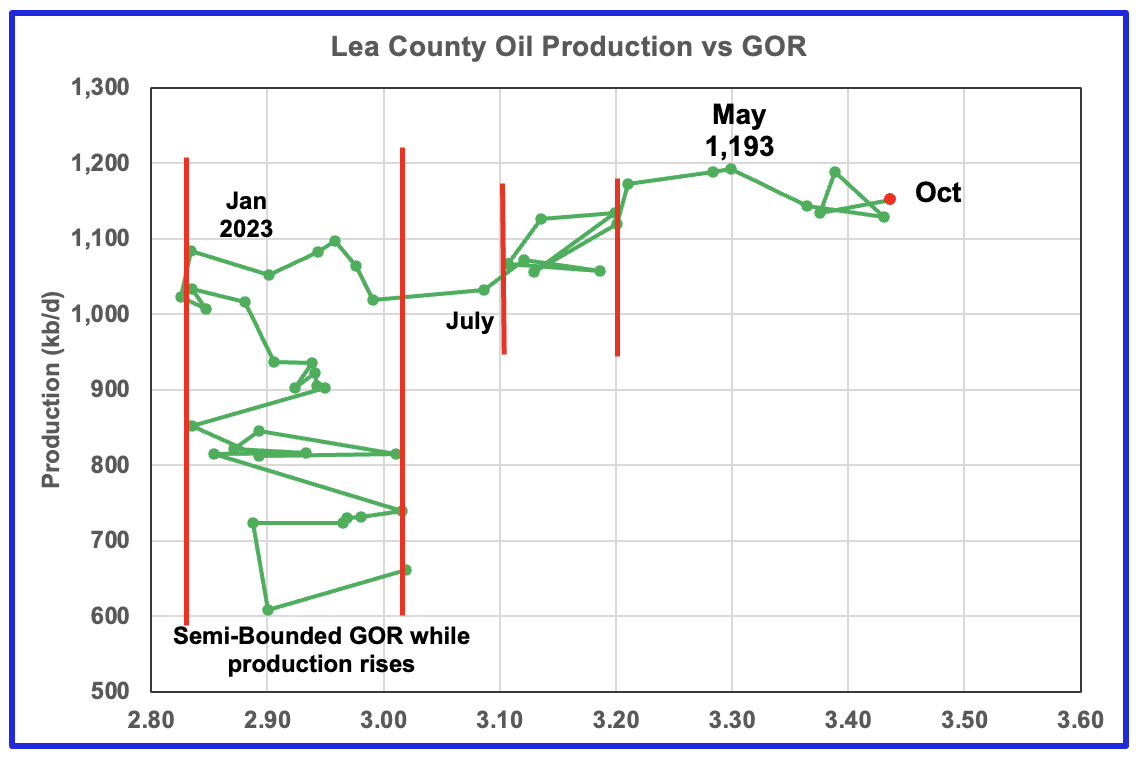
After much zigging and zagging, oil production in Lea county stabilized just below 1,100 kb/d in early 2023. Once production reached a new high in January 2023, production appeared to be on a plateau while the GOR started to increase rapidly to the right and entered the bubble point phase in July 2023.
Since July 2023 the Lea County GOR has continued to increase as production increased within a second semi-bounded GOR. This may indicate that the recent additional production is coming from a new bench/field since the GOR’s behaviour since August 2023 to March 2024 time frame appears once again to be in a semi bounded GOR phase accompanied with rising production.
The GOR moved out of the second semi-bounded GOR region in April and has continued to increase and production appears to be in a plateau phase. The GOR hit a new high of 3.45 in October and this is another indicator that Lea County may be close to peak production.
This zigging and zagging GOR pattern within a semi-bounded GOR while oil production increases to some stable level and then moves out to a higher GOR to the right has shown up in a number of counties. See a few additional cases below.
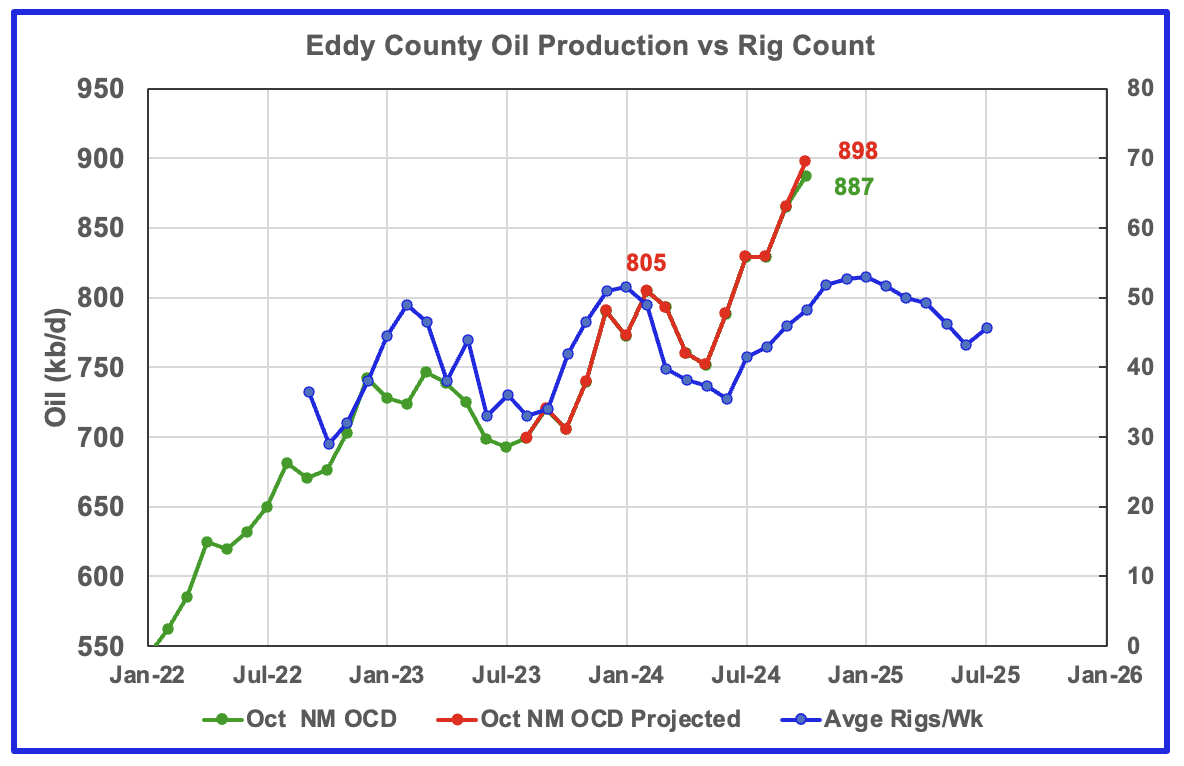
Eddy County’s oil production first peaked in February 2024 at 805 kb/d. After dropping for three months, the number of rigs and associated wells increased and so did oil production. In October the projected oil production increased by 32 kb/d to a new high of 898 kb/d.
From May to October production rose by 146 kb/d. Over that same time shifted rig period, 13 rigs were added to Eddy County. Was a new Tier 1 area/shelf discovered?
The blue graph shows the average number of weekly rigs operating during a given month as taken from the above weekly drilling chart. The rig graph has been shifted forward by 8 months to roughly coincide with the increase in the production graph starting in October 2023.
If production were to follow the rig count trend going forward, production should continue to rise for the next few months and begin to roll over closer to November/December, provided it continues to track the rig count.
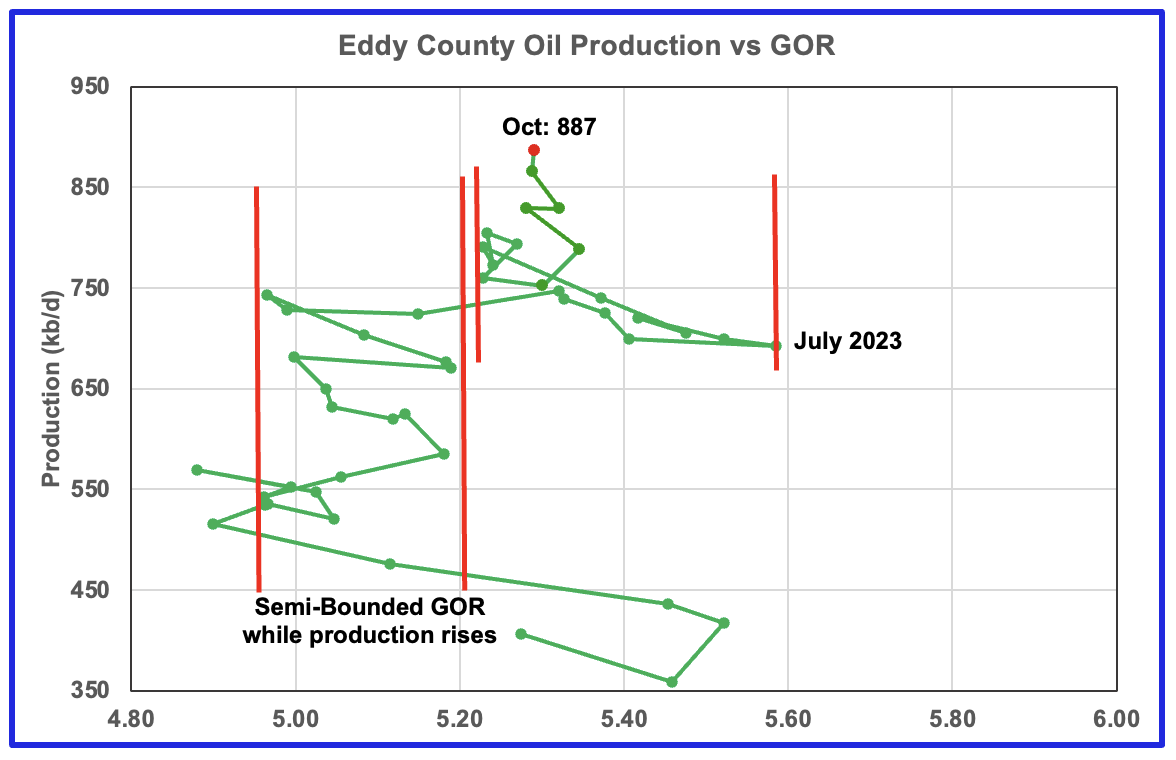
The Eddy county GOR pattern is similar to Lea county except that Eddy broke out from the semi bounded range earlier and for a longer time and then added a second semi bounded GOR phase. For October production continued to increase and stayed within the second semi-bounded region.
The right hand red bar could possibly be placed closer to a GOR 5.35 which may better define the second semi Bounded GOR region.
Texas Permian
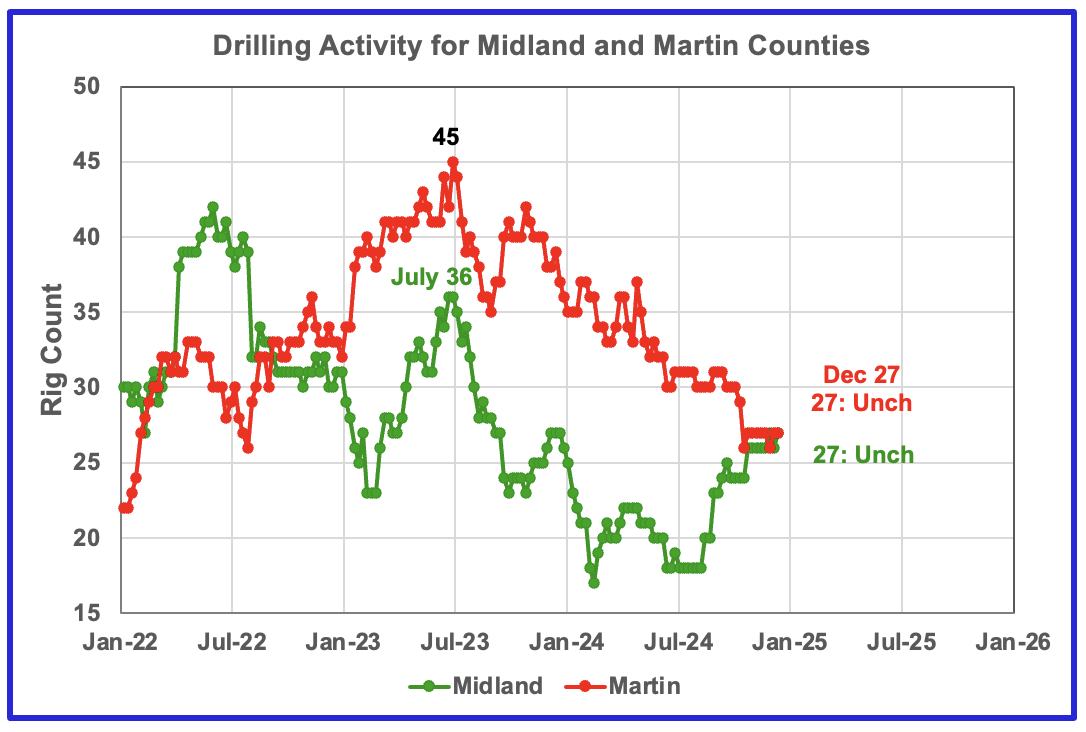
The Midland county rig count has been rising since July and is up 9 to 27 in December. The opposite is true for Martin county. On December 27, 27 rigs were operational, down from 45 in July 2023.
Texas County Oil Production
The Texas RRC made significant revisions to its production data in their September report and those revisions now continue to affect the October projections in this update but to a lesser degree. The projections for this Texas update are almost back to being reasonable. However in a few cases the projections are still questionable.
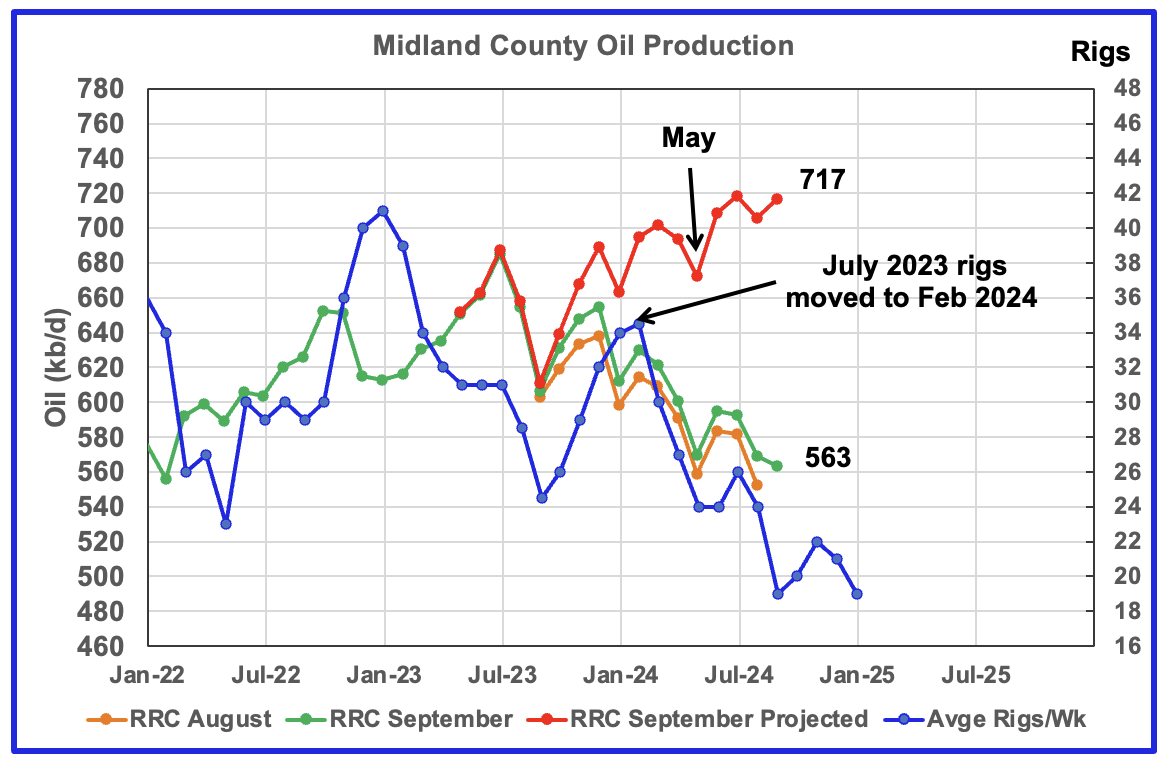
Midland September oil production chart for comparison with October chart below.
For many months in previous posts Midland county’s oil production had been declining. The revisions in the RRC September update have turned the decline into rising production in this chart and the next chart which I don’t think is correct.
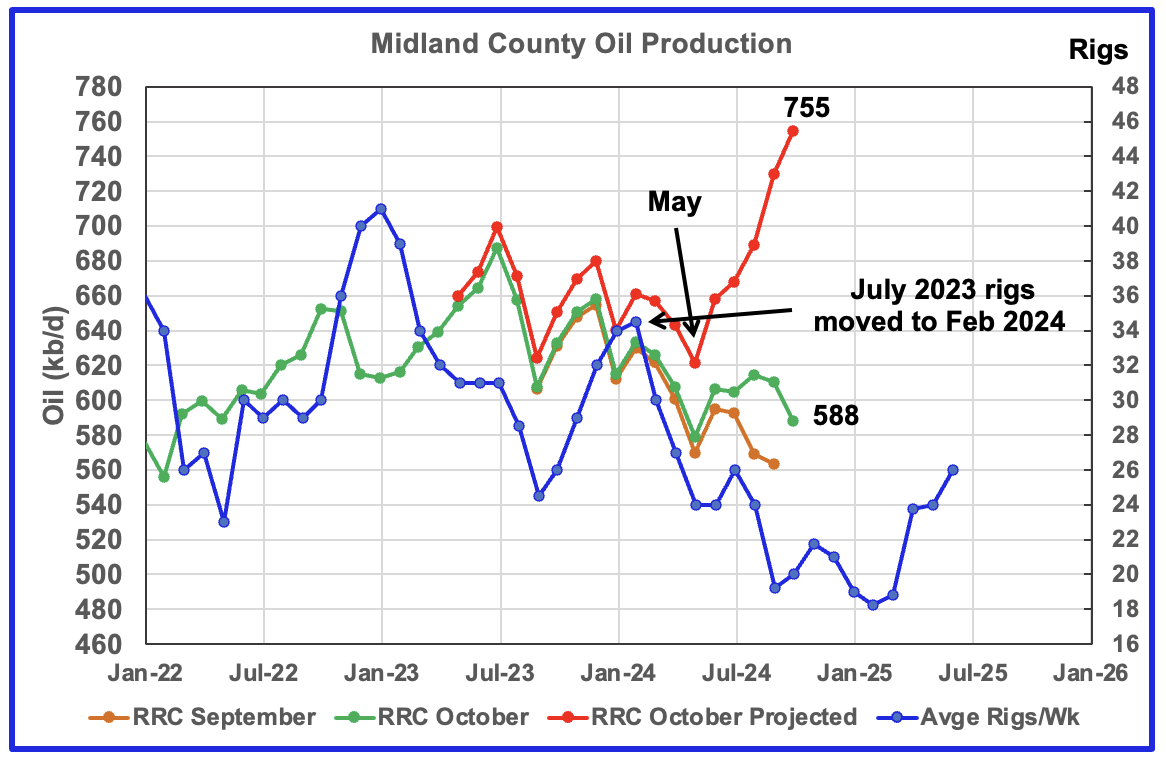
The orange and green graphs show the production as reported by the Texas RRC for September and October. The red graph uses the September and October data to project production as it would look after being updated over many months.
I think the increase in the projected production after May is related to the under reporting of production in the September data, especially after July. A partial production update was made by the Texas RRC up to May and can be seen in the current chart by comparing it with May production in the previous comparison chart. In the previous chart, May’s projected production was slightly under 680 kb/d. In the latest October chart, May’s projected production has dropped to 622 kb/d.
The post May production projection is not real and credible and hopefully will correct itself in the next data release. Considering that oil production from July 2023 to May 2024 followed the rig count graph, it is not unreasonable to question whether the production rise after May is believable.
The blue graph shows the average number of weekly rigs operating during a given month as taken from the weekly drilling chart. The rig graph has been shifted forward by seven months. So the average 34.5 Rigs/wk operating in July 2023 have been moved forward to February 2024 to show the possible correlation and time delay between rig count, completions and oil production. If the seven month shift in the rig count is approximately correct in that oil production can be tied to the rig count, oil production in Midland county should increase for a month or two before resuming its decline.
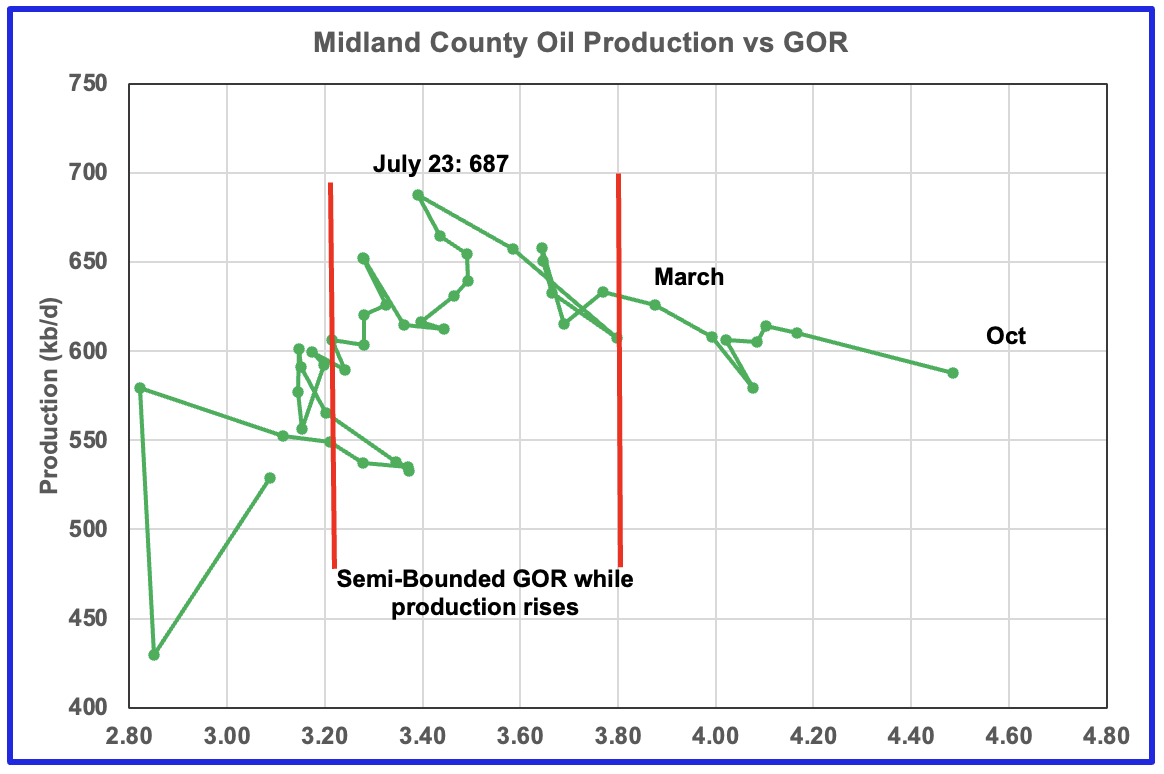
The production revisions do not affect the GOR. For October the GOR ratio continued to increase to a new high of 4.49.
With Midland county deep into the bubble point phase, oil production dropped steadily from July 2023 as the GOR continued to increase. The oil production and GOR shown in this chart is based on the RRC’s October production report. Note that while the last few months are subject to revisions, the July 2023 production has been steady for a number of months.
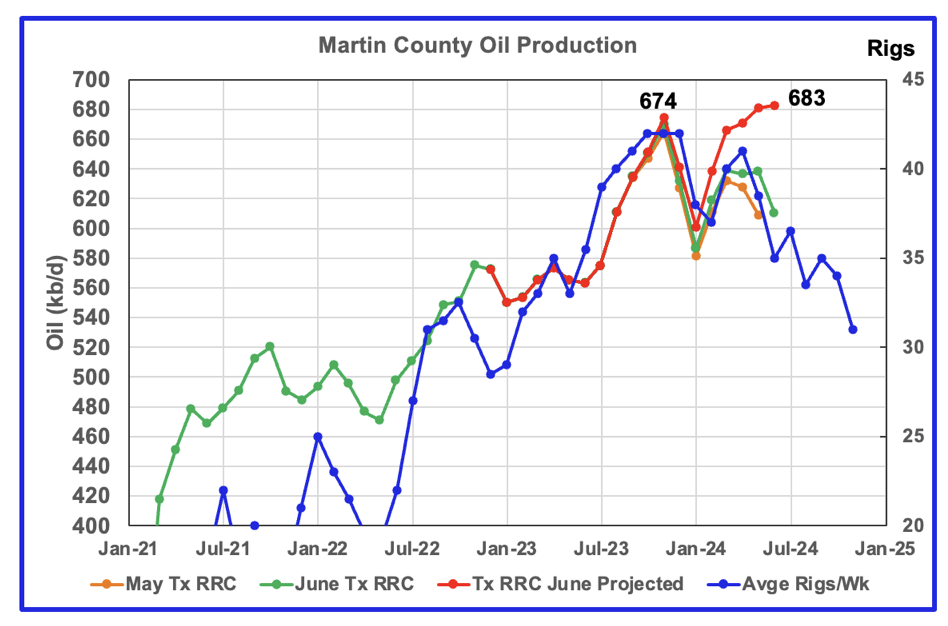
Above is the Martin county oil production chart posted in June. It was the second month that was hinting at a production peak for Martin county. Also it was the first month in which the GOR moved out of the semi-bounded GOR region. The subsequent July and August charts were affected by significant revisions to the earlier production data and as a result the projected results were not credible. This chart has been posted to compare with the October oil production chart below which appears to confirm that Martin county has entered a plateau phase or possibly a declining phase.
The orange and green graphs show the production for Martin County as reported by the Texas RRC for September and October. The red graph is a projection for oil production as it would look after being updated over many months.
Martin county’s projected October oil production increased by 18 kb/d and is 6 kb/d lower than the peak rate achieved five months ago.
Texas’ RRC oil production for Martin County was showing initial signs of peaking in November 2023 but was then followed by declining production into January 2024. Production since June has been on a plateau while the rig count has been dropping.
The red graph is a production forecast which the Texas RRC could be reporting for Martin county about one year from now as the Texas RRC reports additional updated production information. This projection is based on a methodology that used September and October production. The green graph shows oil production reported by the Texas RRC for October.
The blue chart shifts the rig count ahead by 6 months. Note the three flat spots in the November, December and January rig count and similar flat spots in production a few months later.
A few more months of good data is required to confirm that Martin county oil production is in decline.
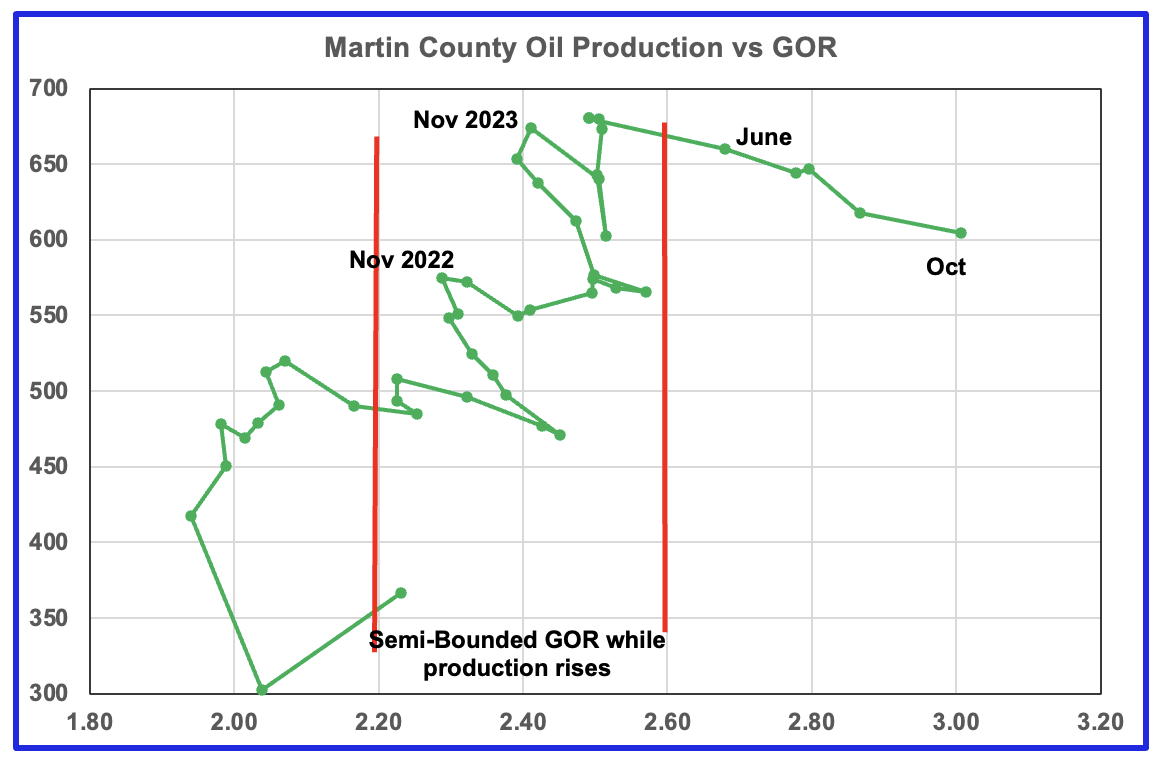
Martin county’s oil production after November 2022 increased and at the same time drifted to slightly higher GORs within the semi bounded range. However the June 2024 GOR saw its first move out of the semi bounded region. October’s preliminary oil production was lower than November 2023 and June 2023. In October the GOR reached a new high of 3.01, which is consistent with falling oil production.
Martin county has the lowest semi-bounded GOR of the four counties at a GOR of close to 2.60 but for October it has jumped to 3.01 and is clearly out of the semi-bounded region. Martin County has now entered the bubble point phase that should result in a dropping oil production trend.
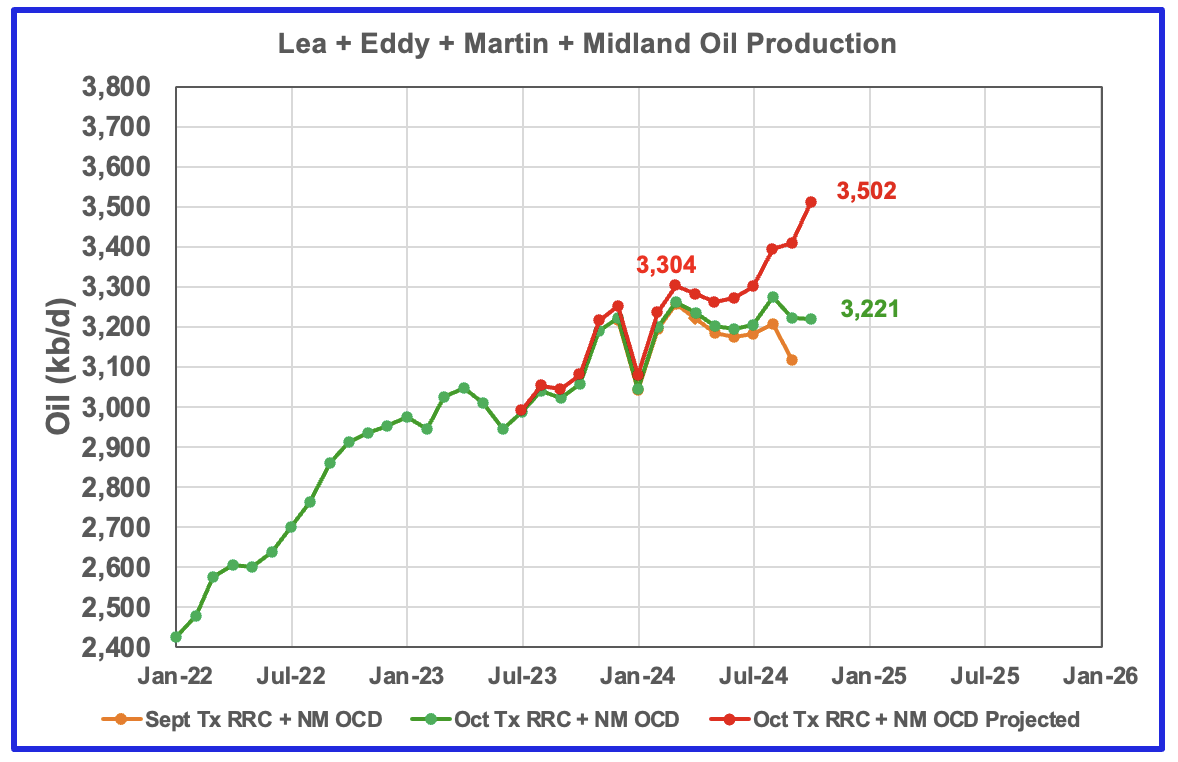
This chart shows the total oil production from the above four largest Permian counties. Assuming that current October Permian production is close to 6,400 kb/d, these four counties account for close to 50% of the total.
The projected production after July is a combination of a real production increase from Eddy county and a revision to earlier Midland production that results in an over estimation for its post July oil production. Hopefully the post July forecast production will be corrected when production is reported for November.
The September and October initial production data is shown in the orange and green graphs respectively. The red graph uses the September and October data to project an estimate for the final October production.
Findings
– Lea county may have peaked in May 2024 and oil production is following the rig count graph
– Eddy County oil production initially peaked in February 2024 but has now started a new increasing phase as it follows the uptrend in the rig count and it has exceeded its previous February peak
– Midland county peaked in July 2023
– Martin County may have also peaked in May 2024 and could have entered a plateau phase.
– Three of the four largest Permian oil producing counties are now in their post peak phase, assuming that drilling does not start to increase. It will take a few more months to confirm this forecast
A note on assumptions. In the above charts of production vs rig count, the rig count has been shifted forward by 6 to 9 months and the assumption is made that production follows rig count. The underlying assumption for doing that is that no more or very few DUCs are being used. Also implicit in making the above calls is that the drillers and frackers are using the latest technology, i.e. 3 mile laterals, max proppant and chemicals in new wells and some refracs. I have no basis for assuming that all drillers are using maximum/latest technology.
Texas District 8
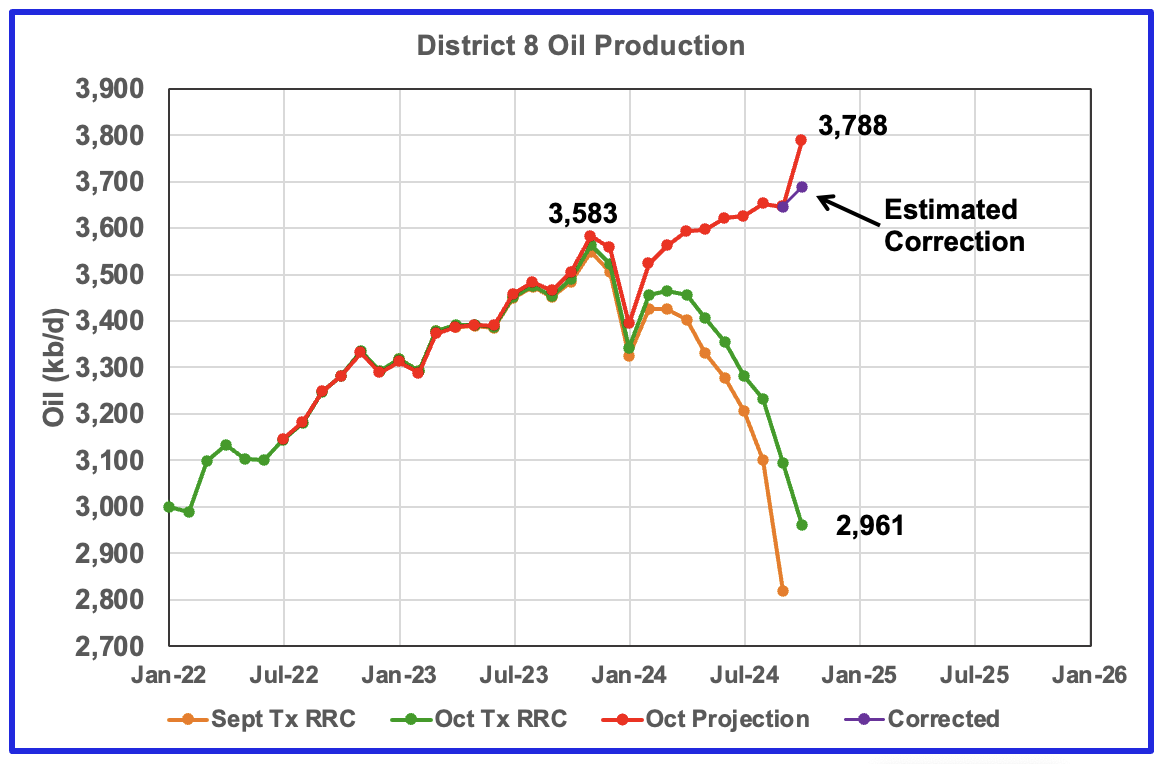
This chart indicates that production is growing in District 8 and that production had a spike increase in the October projection. Unfortunately this spike increase is related to large revisions/updates to older production data.
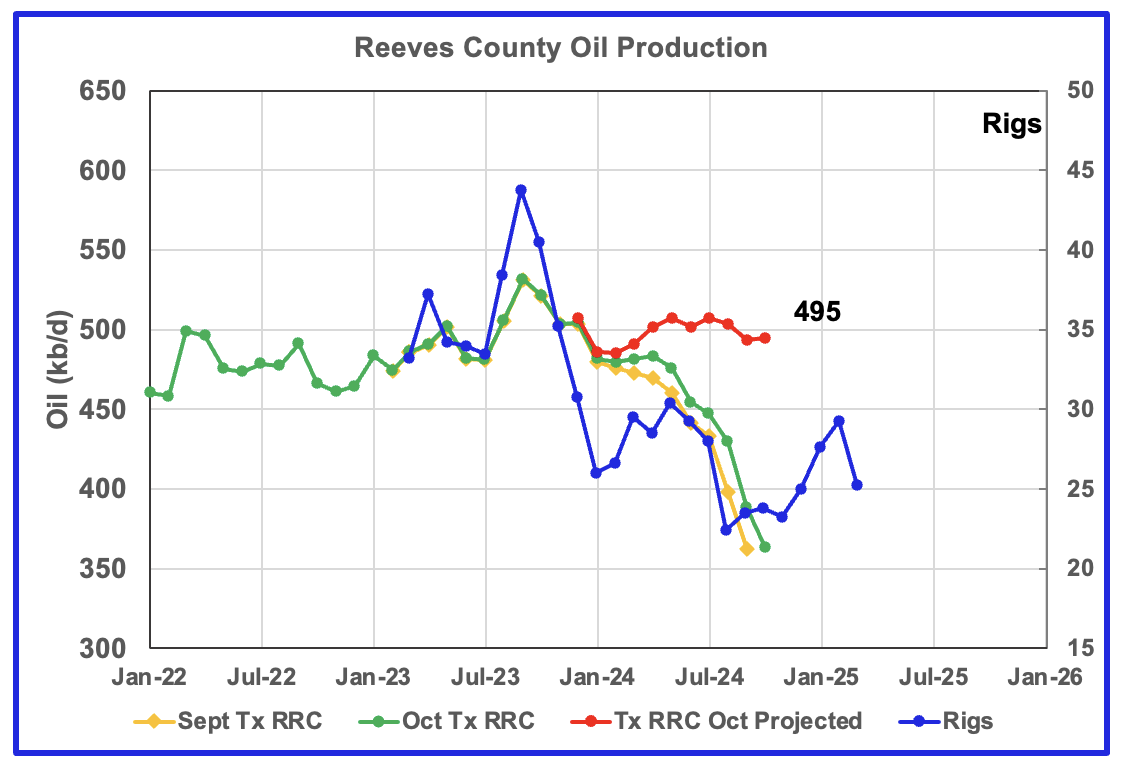
Texas District 8 contains both the Midland and Martin counties. Combined these two counties produce close to 1,300 kb/d of oil. While these two counties are the two largest oil producers, there are many other counties with smaller production, such as Reeves #3, Loving #4 and Howard #5 that in total produced 3,583 kb/d of oil in November 2023. Essentially the Midland and Martin counties produce close to 1/3 of the District 8 oil.
The orange and green graphs show the production reported by the Texas RRC for September and October. A more realistic projection for October would be the purple markers. It is the result of dropping 100 kb/d from the October RRC data because the typical gap between the last two months is closer to 200 kb/d rather than 100 kb/d. This anomaly should correct itself in the next RRC update.
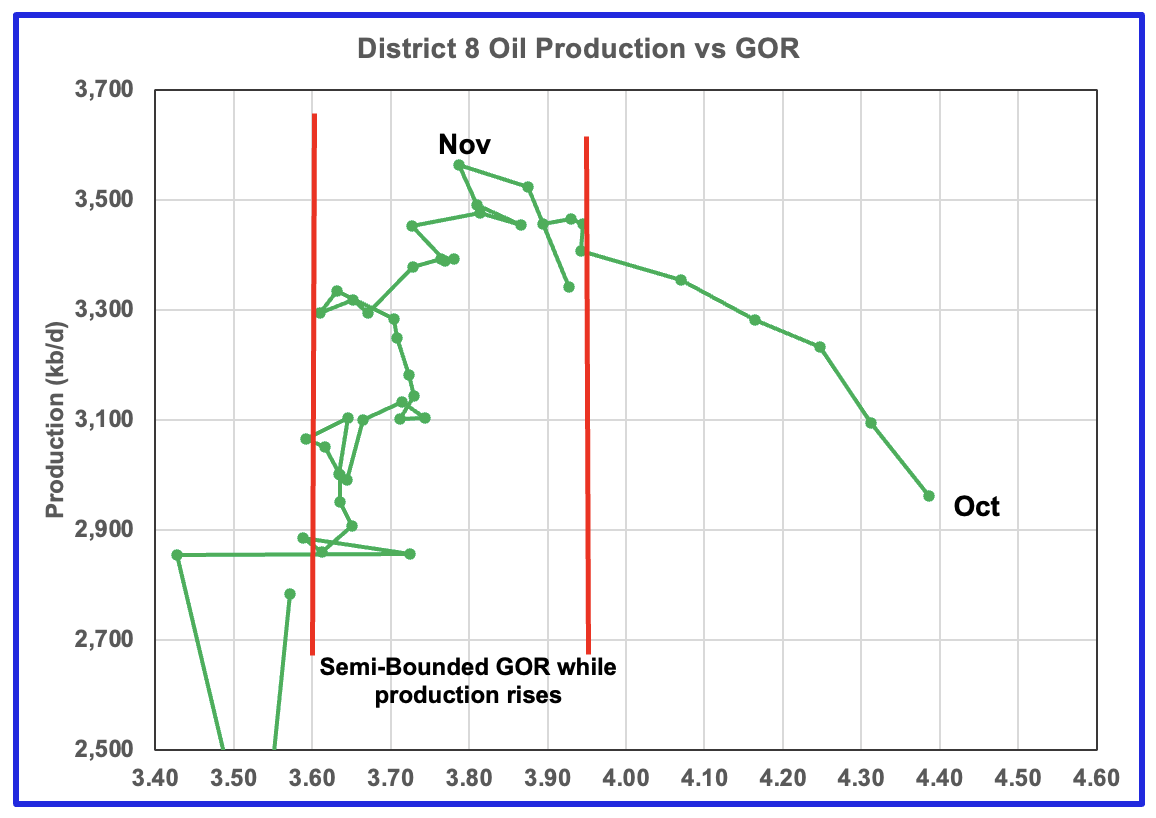
Plotting an oil production vs GOR graph for a district may be a bit of a stretch. Regardless here it is and it seems to indicate many District 8 counties may well be into the bubble point phase.
Oil Production and GOR Charts for Two of the Next Biggest Oil Producing Counties in Texas
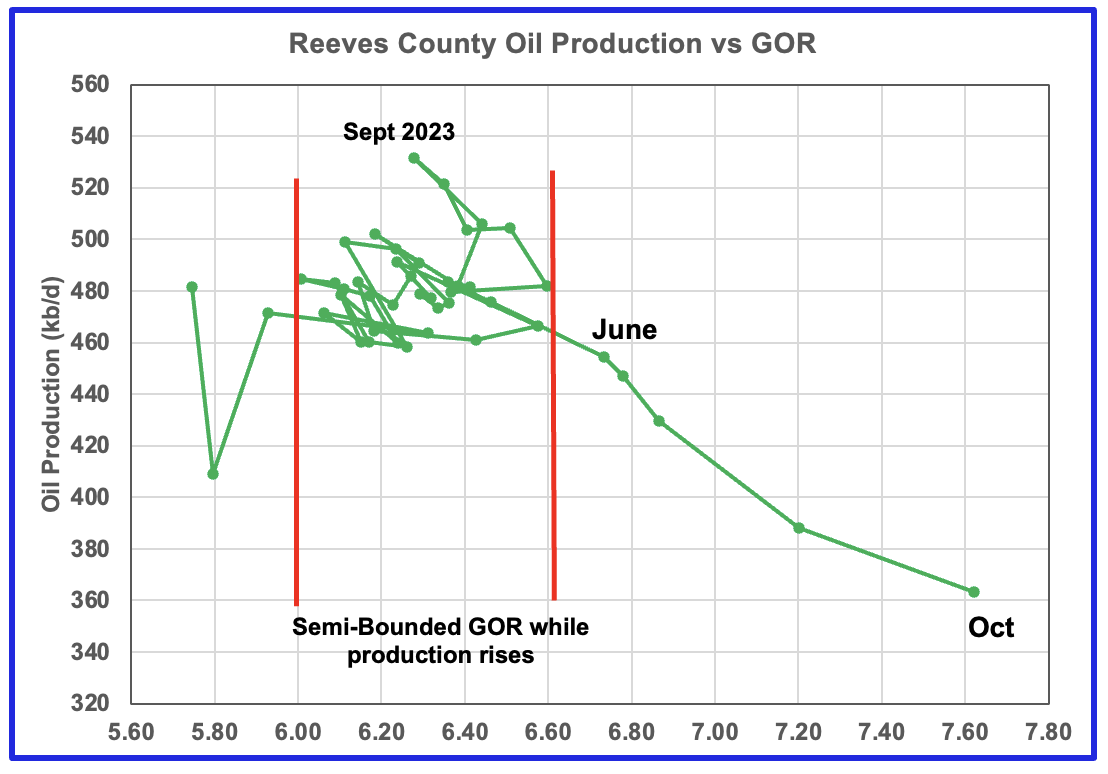
Reeves county peaked in September 2023 at 534 kb/d. Note the rapid movement of the GOR once it broke out of the Semi-Bounded GOR range to higher GORs. While the GOR has risen to new highs, production appears to be on a plateau.
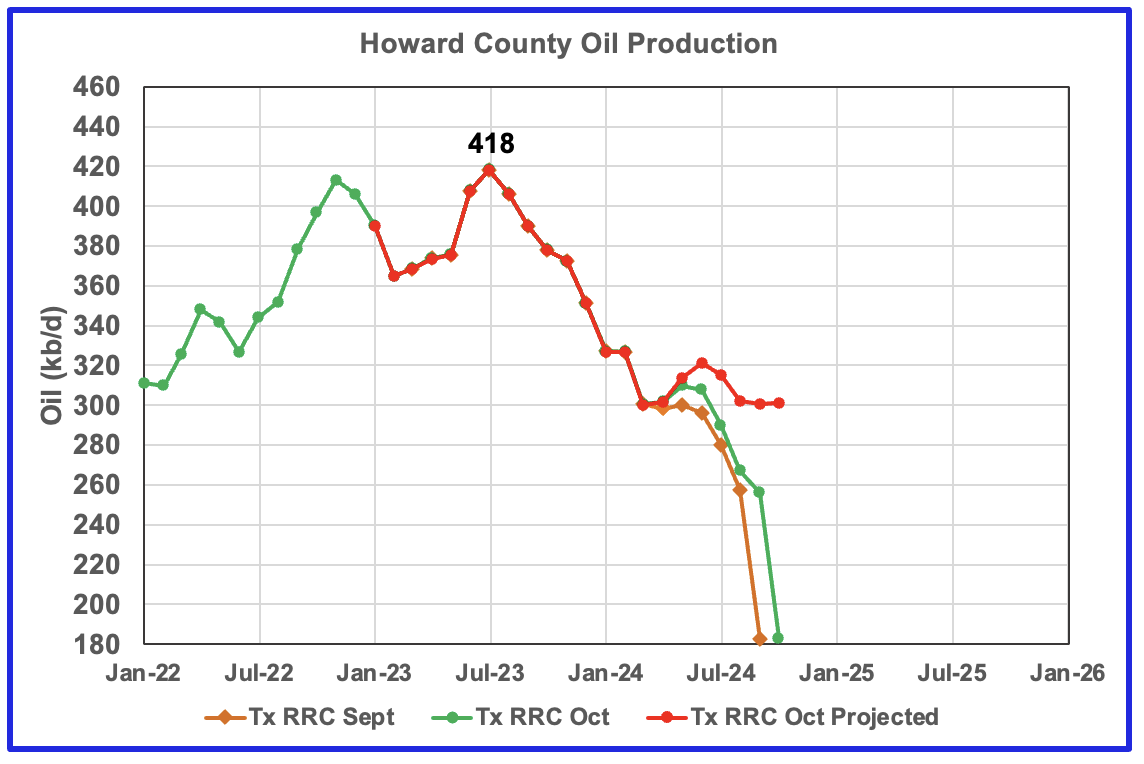
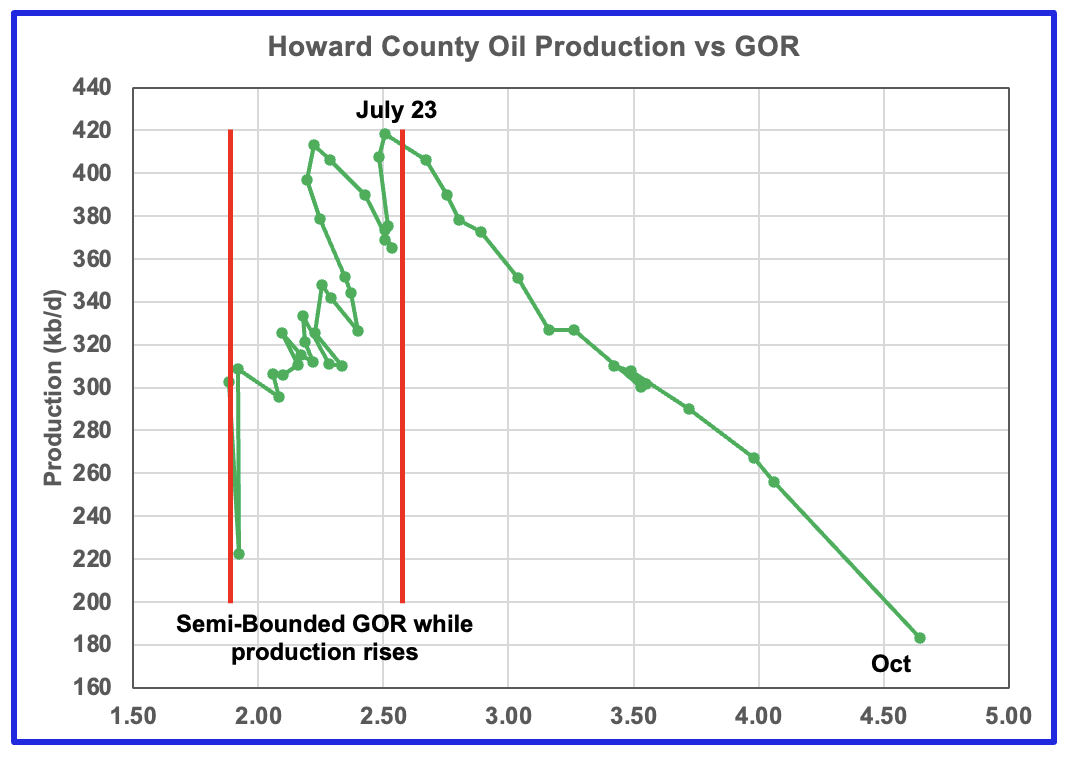
Howard county oil production peaked in July 2023 at 418 kb/d and then the GOR began to increase and along with it, production dropped.
Drilling Productivity Report
The Drilling Productivity Report (DPR) uses recent data on the total number of drilling rigs in operation along with estimates of drilling productivity and estimated changes in production from existing oil wells to provide estimated changes in oil production for the principal tight oil regions. The new DPR report in the STEO provides production up to November 2024. The report also projects output to December 2025. The DUC charts and Drilled Wells charts are also updated to November 2024.
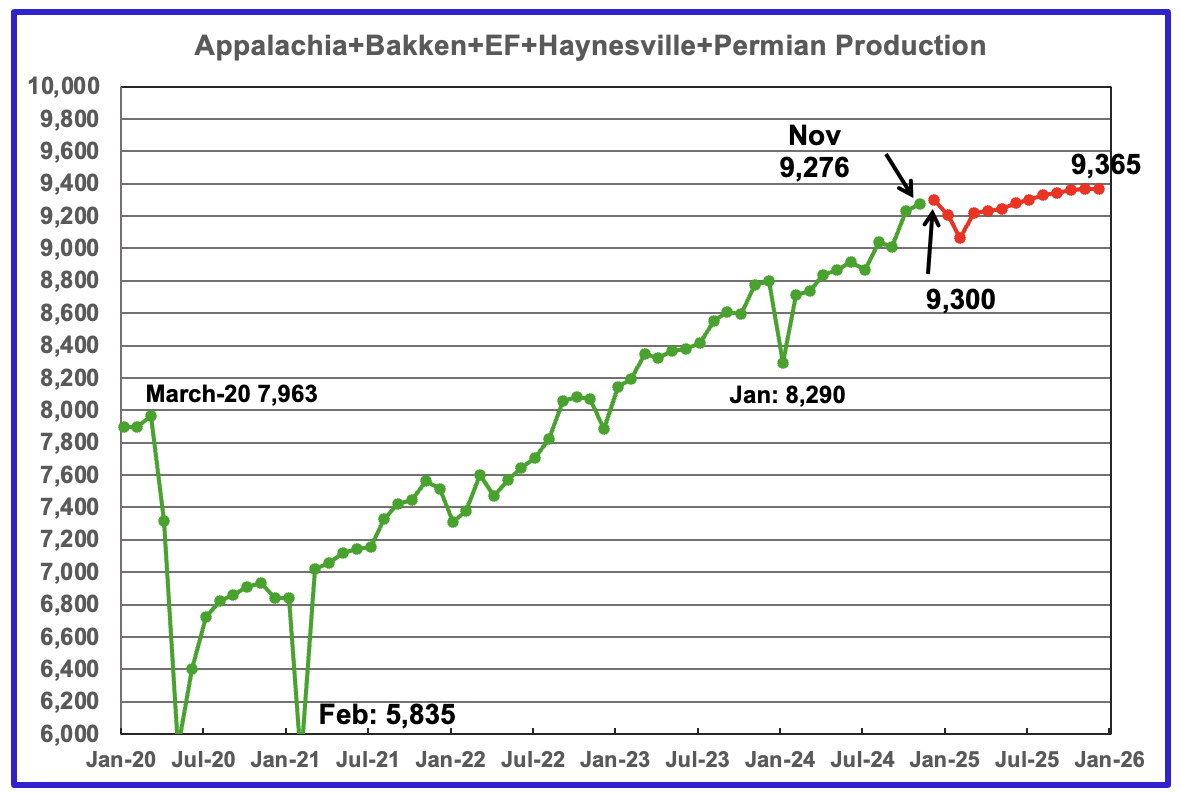
The oil production for the 5 DPR regions tracked by the EIA is shown above. Also a projection by the STEO to December 2025 has been added, red markers. Note DPR production includes both LTO oil and oil from conventional wells. DPR oil production for the Anadarko and Niobrara regions is no longer available.
The November oil output in the five DPR regions increased by 46 kb/d to 9,276 kb/d. Production is expected to grow by 24 kb/d in December to 9,300 kb/d. By December 2025 production is expected to reach 9,365 kb/d.
From December 2024 to December 2025, production is expected to grow by 65 kb/d. Note how production is flat from October 2025 to December 2025. An early indication for an upcoming plateau and possible decline.
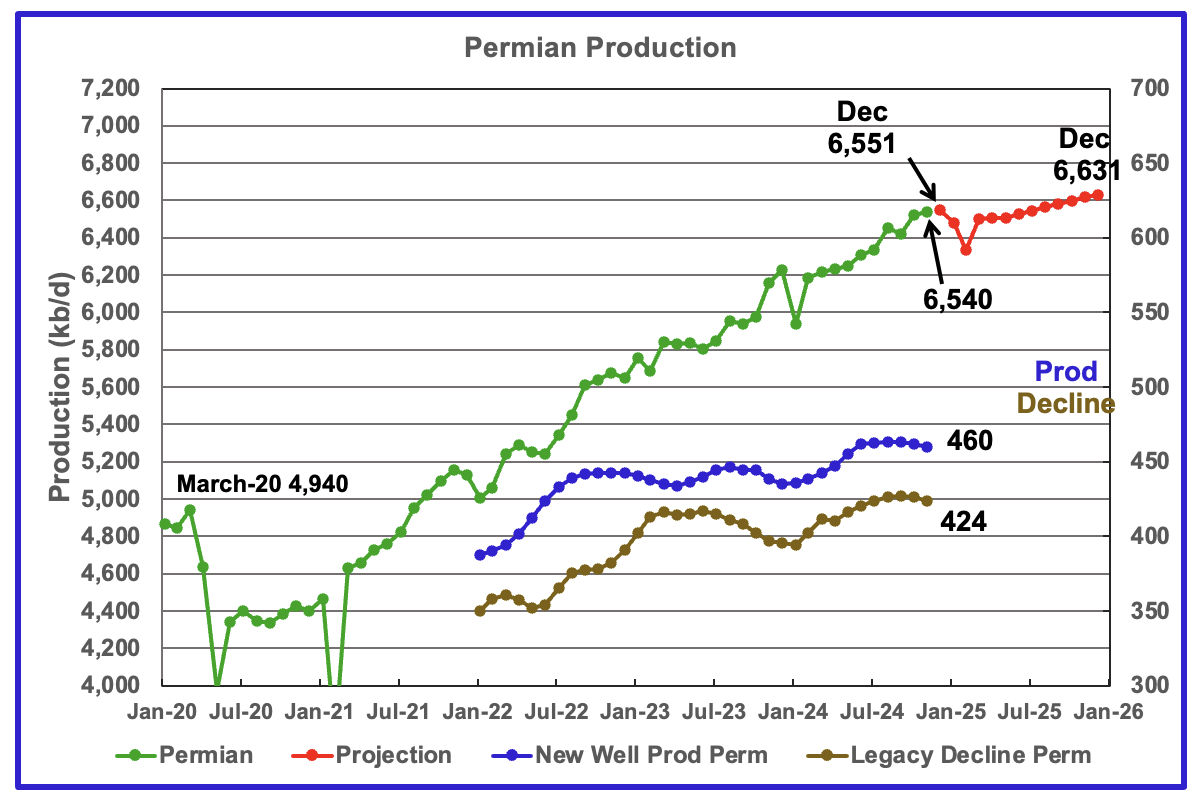
The EIA’s November DPR report shows Permian output increased by 20 kb/d to 6,540 kb/d. By December 2025 output is expected to be 6,631 kb/d.
Production from new wells and legacy decline, right scale, have been added to this chart to show the difference between new production and legacy decline.
According to the new wells and legacy decline graphs November production should have increased by 36 kb/d which is higher than the actual 20 kb/d reported.
From December 2024 to December 2025, Permian oil production is expected to grow by 80 kb/d.
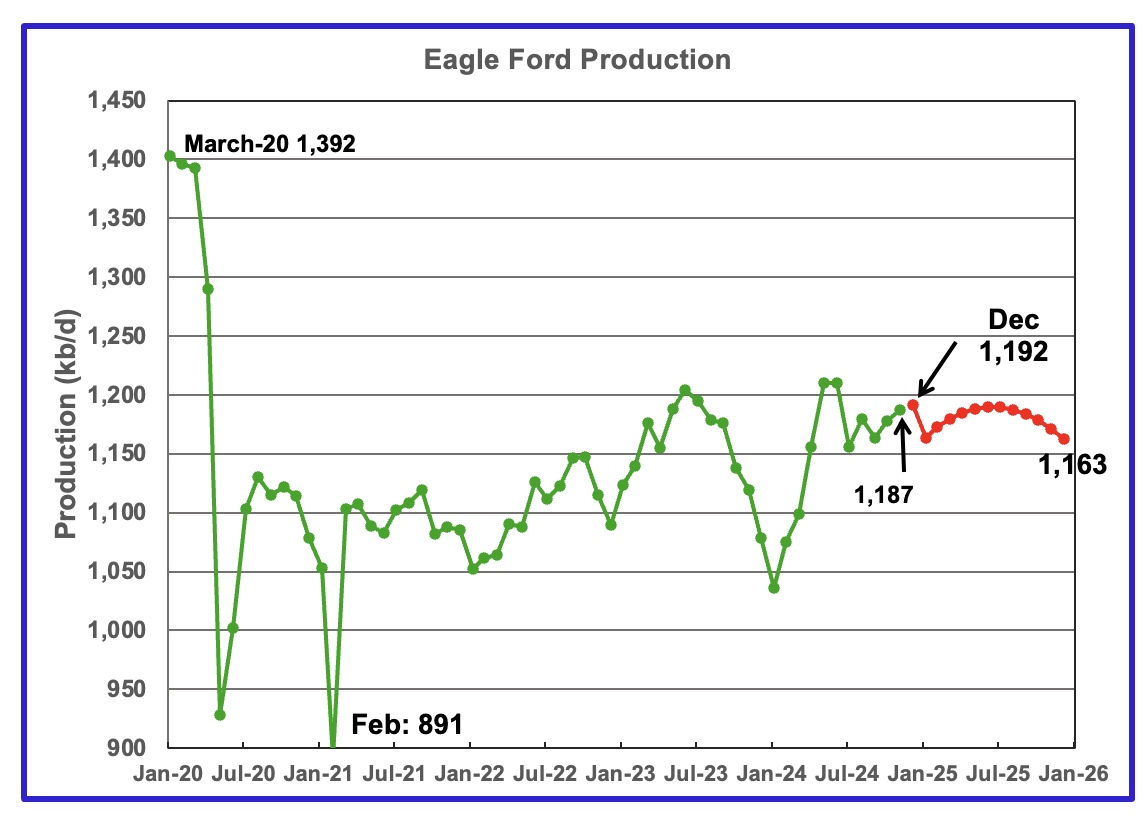
Output in the Eagle Ford basin has been increasing since January 2024 and may have peaked in June 2024. November production rose by 10 kb/d to 1,187 kb/d. Production is projected to be essentially flat going forward.Output in December 2025 expected to be 1,163 kb/d, 24 kb/d lower than November 2924. December production is forecast to increase by 5 kb/d to 1,192 kb/d.
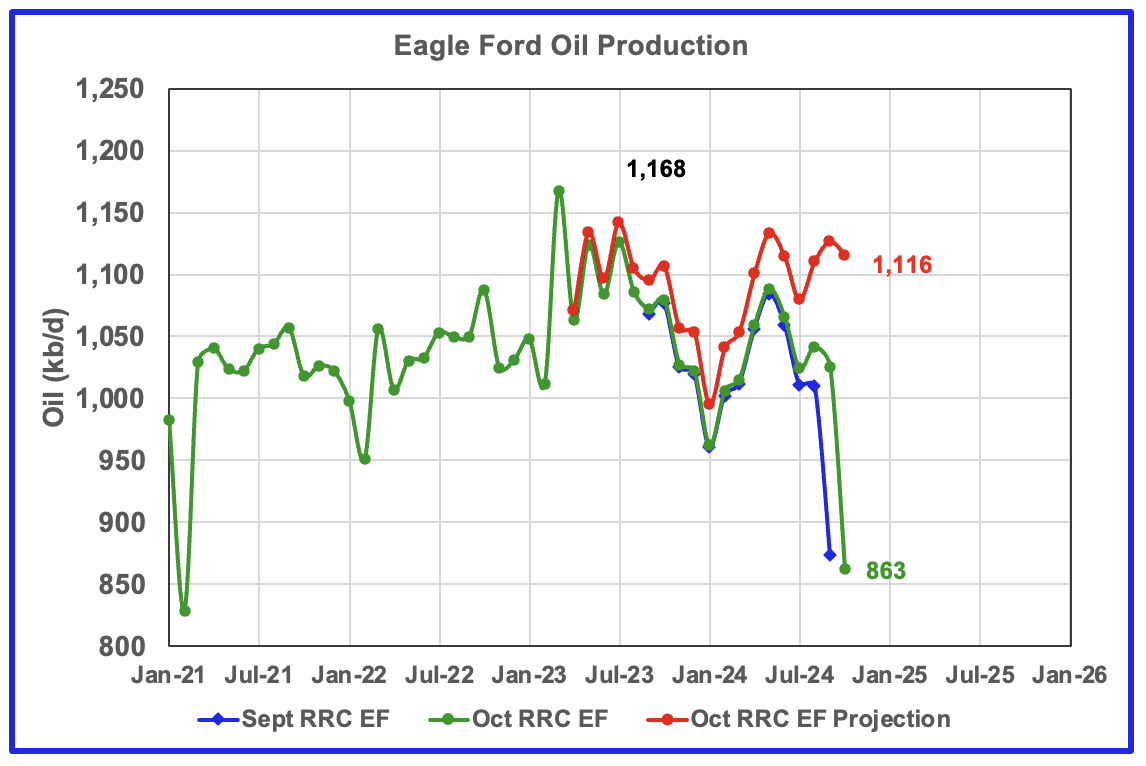
This chart estimates the Eagle Ford production using the sum of the Texas’ RRC production for Districts 1 and 2. These two districts cover most of the Eagle Ford basin. The red graph is a projection based on September and October production. The latest production data indicates that the Eagle Ford basin is in a plateau, similar to the DPR report.
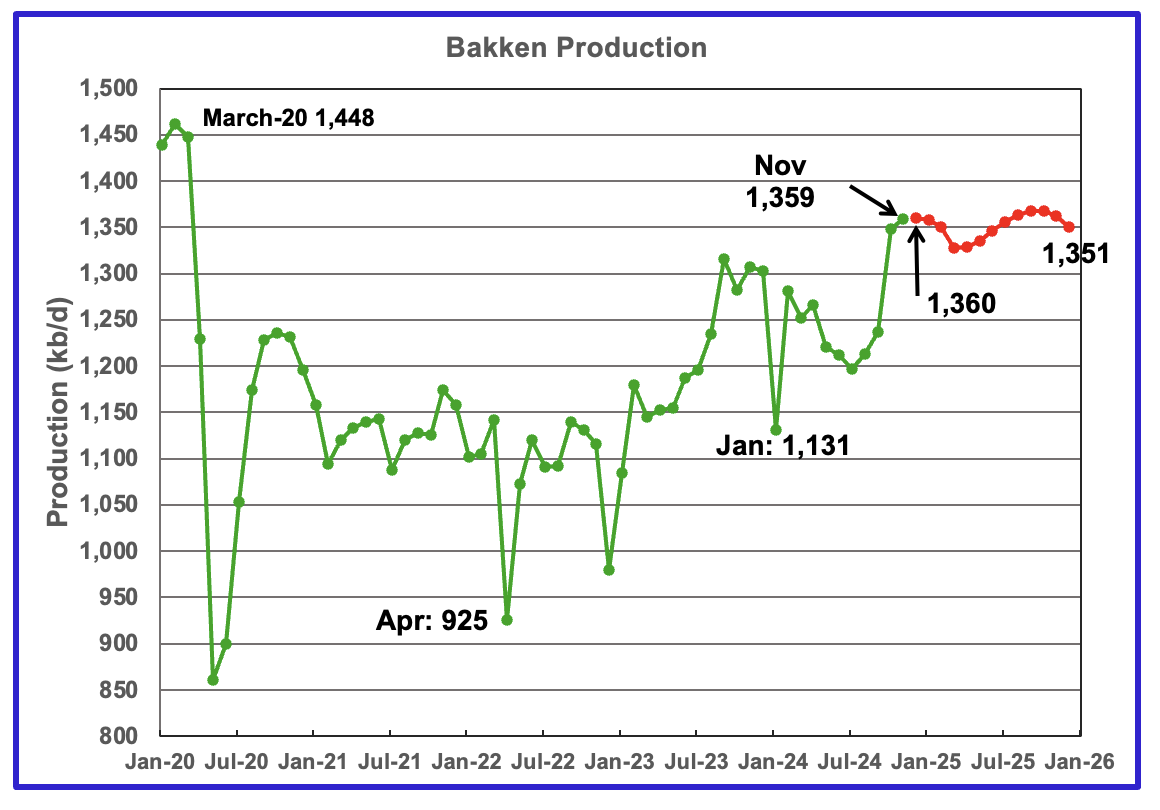
The DPR/STEO reported that Bakken output in November rose by 11 kb/d to 1,359 kb/d. The STEO projection out to December 2025 shows output varying between 1,325 kb/d and 1,370 kb/d over the next 13 months.
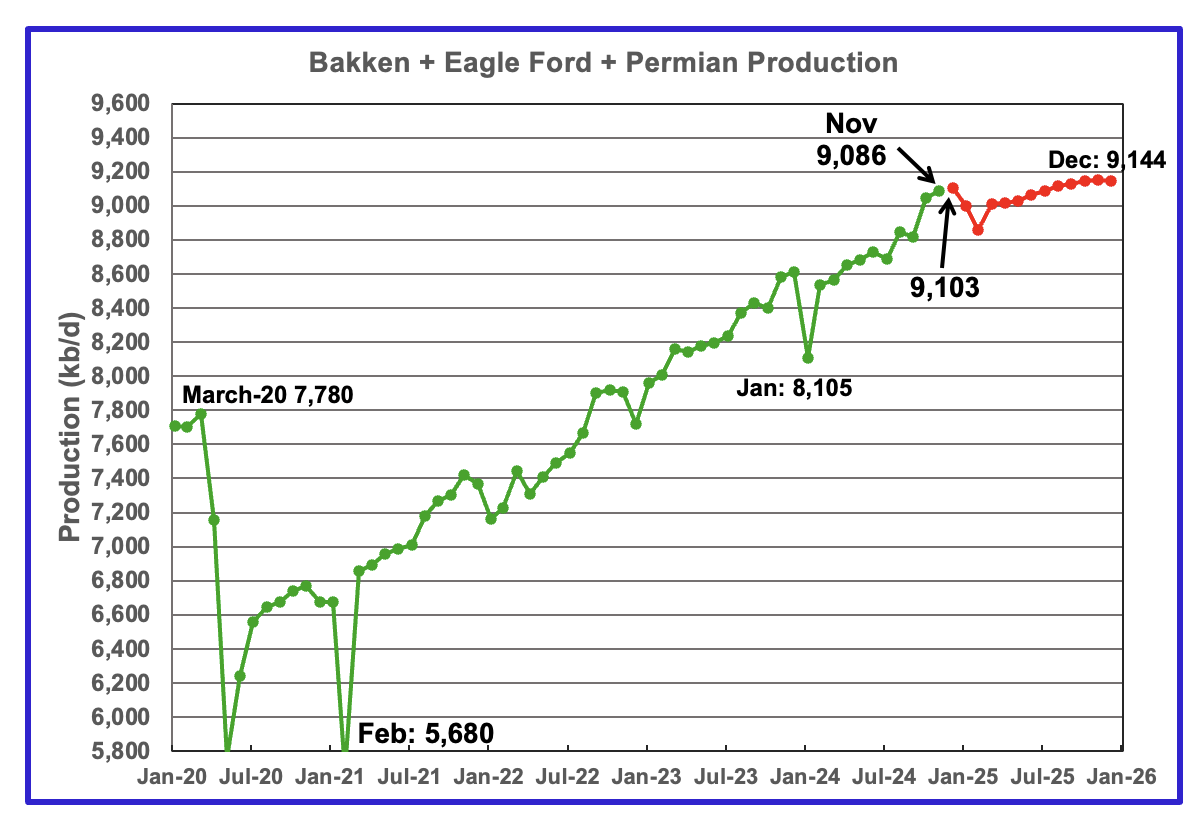
This chart plots the combined production from the three main LTO regions. For November output rose by 41 kb/d to 9,086 kb/d. Production in December 2025 is expected to reach 9,144 kb/d. This is a 46 kb/d production increase than forecast in the previous report.
DUCs and Drilled Wells
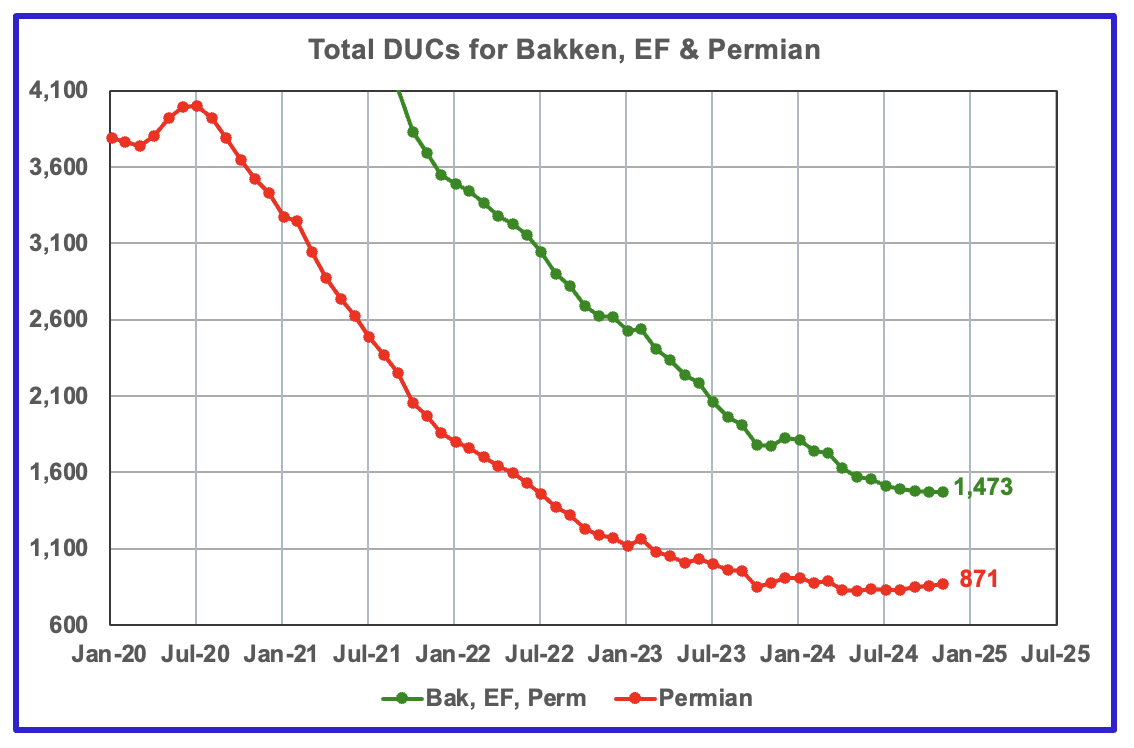
The number of DUCs available for completion in the Permian and the three major DPR regions has fallen every month since July 2020. November DUCs were unchanged at 1,473. However October was revised down from 1,506 to 1,473. In the Permian, the DUC count increased by 13 to 871.
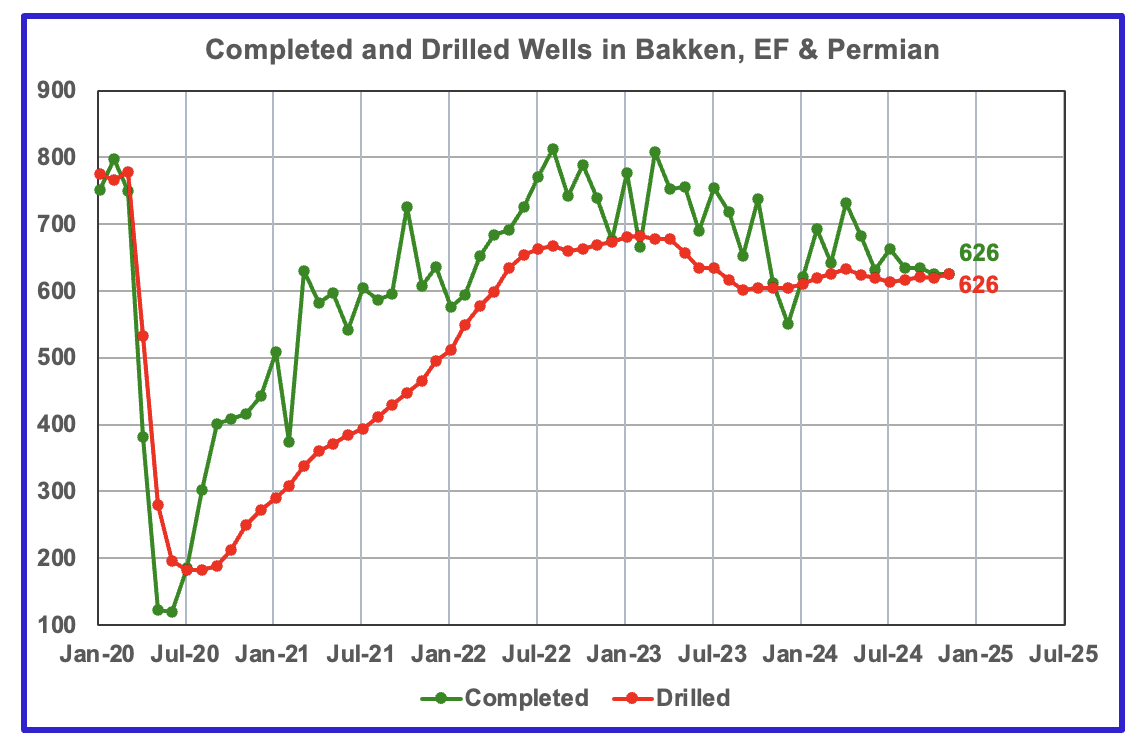
In the three primary regions, 626 wells were completed and 6626 were drilled.
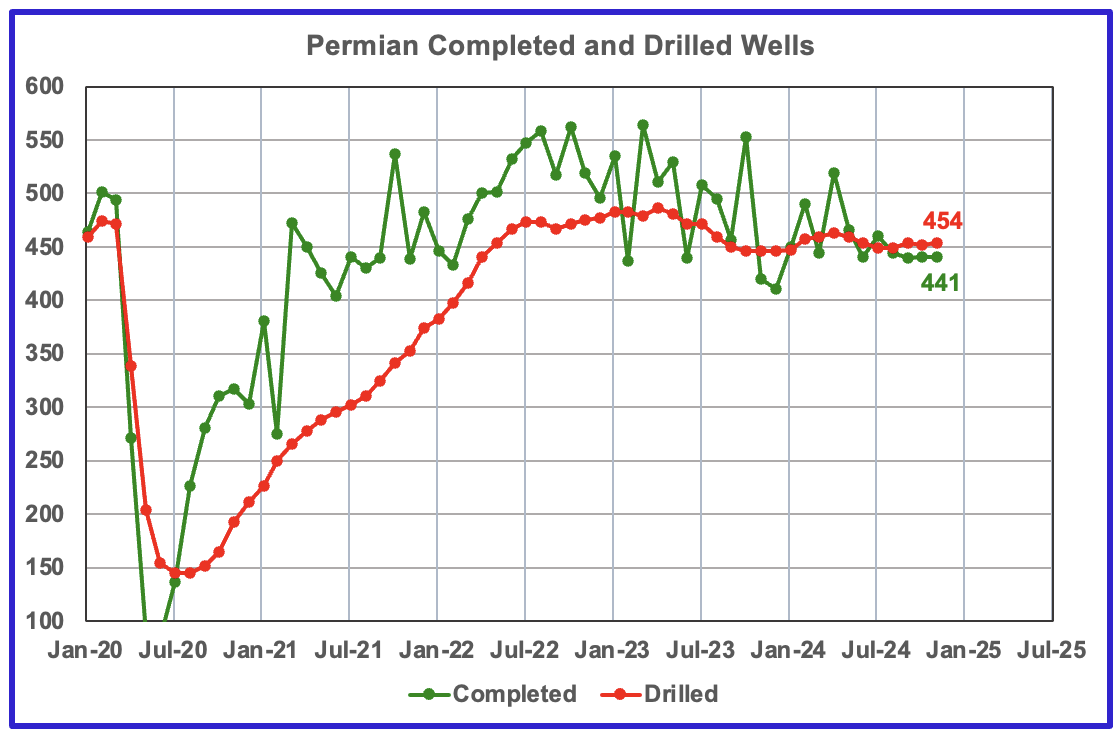
In the Permian, the monthly completion and drilling rates have been both stabilizing in the 440 to 450 range over the last 6 months.
In November 2024, 441 wells were completed while 454 new wells were drilled. This is the fourth month in a row in which the number of wells drilled exceeded the number of completed wells.