


In These U.S. Cities, Income Inequality is Getting Worse
In any capitalist economy, some level of income inequality is to be expected — but when the gap between the rich and the poor becomes wide enough and persistent enough, negative effects can begin to snowball. According to a recent study out of The University of Chicago, economic inequality is one of the strongest predictors […] The post In These U.S. Cities, Income Inequality is Getting Worse appeared first on 24/7 Wall St..

In any capitalist economy, some level of income inequality is to be expected — but when the gap between the rich and the poor becomes wide enough and persistent enough, negative effects can begin to snowball. According to a recent study out of The University of Chicago, economic inequality is one of the strongest predictors of the erosion of democracy, as highly unequal distributions of wealth have historically fueled political polarization and declining trust in public institutions.These findings appear especially relevant to the United States, where income inequality is more pronounced than it is in much of the rest of the developed world — and has been steadily getting worse in recent decades.
24/7 Wall St. Key Points:
- In recent decades, wealth has been increasingly concentrated in the hands of a small subset of the U.S. population.
- This growing divide between the rich and the poor is especially evident in certain American cities.
- Also: 2 Dividend Legends To Hold Forever
According to a recent study from the fiscal policy advocacy group the Peter G. Peterson Foundation, the average income among the highest earning quintile of American households surged by 165% between 1981 and 2021, adjusting for inflation. Meanwhile, the average income of the lowest earning quintile increased by just 38% over the same period. Similarly, between 2019 and 2022 alone, income for the top 10% of earners grew at over four times the growth rate reported among the American middle class. (Here is a look at the voters most likely to approve of Trump’s economic policies.)
Income inequality is often compared across different regions or time periods through the Gini coefficient — an single index measure that can be expressed on a scale of 0 to 100, where 0 represents perfect equality in income distribution and 100 represents perfect inequality. According to the U.S. Census Bureau’s American Community Survey, the U.S. had a Gini index score of about 48.3 out of 100 in 2023, up slightly from 48.2 out of 100 in 2019. In cities across the country, however, income inequality has climbed at a far faster rate over the same time period.
Using five year estimates from the 2023 and 2019 ACS, 24/7 Wall St. identified the American cities where income inequality is getting worse. We reviewed all places with populations of at least 65,000 and ranked them based on the change in their Gini index score between 2019 and 2023, listing the top 35. All supplemental data are also five year estimates from the 2023 and 2019 ACS.
Among the cities on this list, Gini index scores climbed by anywhere from 2.41 to 6.44 between 2019 and 2023. Despite the increases, most cities on this list still have a lower level of income inequality than the U.S. as a whole.
As may be expected, the share of residents at either the top or the bottom of the income scale appears to have grown in most of these cities over the last five years of available data. Since 2019, the U.S. poverty rate fell by one percentage point. In contrast, 20 of the 35 cities on this list reported a higher poverty rate in 2023 than in 2019. At the same time, in every city on this list, the share of households earning $200,000 or more per year increased between 2019 and 2023. (Here is a look at the richest city in every state.)
These are the American cities where the gap between the rich and the poor is growing wider.
Why It Matters
Income inequality has historically been a destabilizing force in democratic countries — and currently, the U.S. has some of the highest levels of income inequality in the developed world. In recent years, the gap between America’s rich and poor has grown considerably — particularly in certain cities.
35. Roanoke, Virginia

- 5-year change in Gini index score: +2.41 points (50.43 in 2023, 48.02 in 2019)
- 5-year change in share of households earning less than $25,000: -3.8 ppt.(25.4% in 2023, 29.2% in 2019)
- 5-year change in share of households earning at least $200,000: +1.6 ppt.(5.2% in 2023, 3.6% in 2019)
- 5-year change in median household income: +$8,441 ($52,671 in 2023, $44,230 in 2019)
- 5-year change in poverty rate: -1.1 ppt.(19.7% in 2023, 20.8% in 2019)
34. West Des Moines, Iowa
- 5-year change in Gini index score: +2.50 points (46.65 in 2023, 44.15 in 2019)
- 5-year change in share of households earning less than $25,000: -0.7 ppt.(9.6% in 2023, 10.3% in 2019)
- 5-year change in share of households earning at least $200,000: +4.8 ppt.(14.7% in 2023, 9.9% in 2019)
- 5-year change in median household income: +$8,557 ($84,925 in 2023, $76,368 in 2019)
- 5-year change in poverty rate: +1.4 ppt.(7.3% in 2023, 5.9% in 2019)
33. Maple Grove, Minnesota
- 5-year change in Gini index score: +2.54 points (40.73 in 2023, 38.19 in 2019)
- 5-year change in share of households earning less than $25,000: -1.4 ppt.(4.7% in 2023, 6.1% in 2019)
- 5-year change in share of households earning at least $200,000: +8.6 ppt.(24.8% in 2023, 16.2% in 2019)
- 5-year change in median household income: +$19,924 ($129,481 in 2023, $109,557 in 2019)
- 5-year change in poverty rate: +0.8 ppt.(3.9% in 2023, 3.1% in 2019)
32. Cedar Park, Texas
- 5-year change in Gini index score: +2.62 points (40.24 in 2023, 37.62 in 2019)
- 5-year change in share of households earning less than $25,000: +0.7 ppt.(7.6% in 2023, 6.9% in 2019)
- 5-year change in share of households earning at least $200,000: +9.9 ppt.(23.3% in 2023, 13.4% in 2019)
- 5-year change in median household income: +$19,953 ($123,972 in 2023, $104,019 in 2019)
- 5-year change in poverty rate: +0.9 ppt.(5.7% in 2023, 4.8% in 2019)
31. Livermore, California

- 5-year change in Gini index score: +2.64 points (42.80 in 2023, 40.16 in 2019)
- 5-year change in share of households earning less than $25,000: -0.4 ppt.(6.4% in 2023, 6.8% in 2019)
- 5-year change in share of households earning at least $200,000: +13.9 ppt.(38.5% in 2023, 24.6% in 2019)
- 5-year change in median household income: +$26,150 ($153,602 in 2023, $127,452 in 2019)
- 5-year change in poverty rate: -0.1 ppt.(4.4% in 2023, 4.5% in 2019)
30. Spring Valley, Nevada

- 5-year change in Gini index score: +2.66 points (46.25 in 2023, 43.59 in 2019)
- 5-year change in share of households earning less than $25,000: -1.2 ppt.(15.3% in 2023, 16.5% in 2019)
- 5-year change in share of households earning at least $200,000: +4.3 ppt.(8.5% in 2023, 4.2% in 2019)
- 5-year change in median household income: +$13,976 ($72,364 in 2023, $58,388 in 2019)
- 5-year change in poverty rate: +0.7 ppt.(12.9% in 2023, 12.2% in 2019)
29. Downey, California

- 5-year change in Gini index score: +2.68 points (43.08 in 2023, 40.40 in 2019)
- 5-year change in share of households earning less than $25,000: -1.9 ppt.(9.4% in 2023, 11.3% in 2019)
- 5-year change in share of households earning at least $200,000: +5.5 ppt.(13.2% in 2023, 7.7% in 2019)
- 5-year change in median household income: +$11,522 ($87,400 in 2023, $75,878 in 2019)
- 5-year change in poverty rate: +0.3 ppt.(9.1% in 2023, 8.8% in 2019)
28. Flower Mound, Texas

- 5-year change in Gini index score: +2.69 points (40.18 in 2023, 37.49 in 2019)
- 5-year change in share of households earning less than $25,000: -0.4 ppt.(3.7% in 2023, 4.1% in 2019)
- 5-year change in share of households earning at least $200,000: +10.8 ppt.(37.1% in 2023, 26.3% in 2019)
- 5-year change in median household income: +$20,452 ($157,737 in 2023, $137,285 in 2019)
- 5-year change in poverty rate: +1.1 ppt.(4.0% in 2023, 2.9% in 2019)
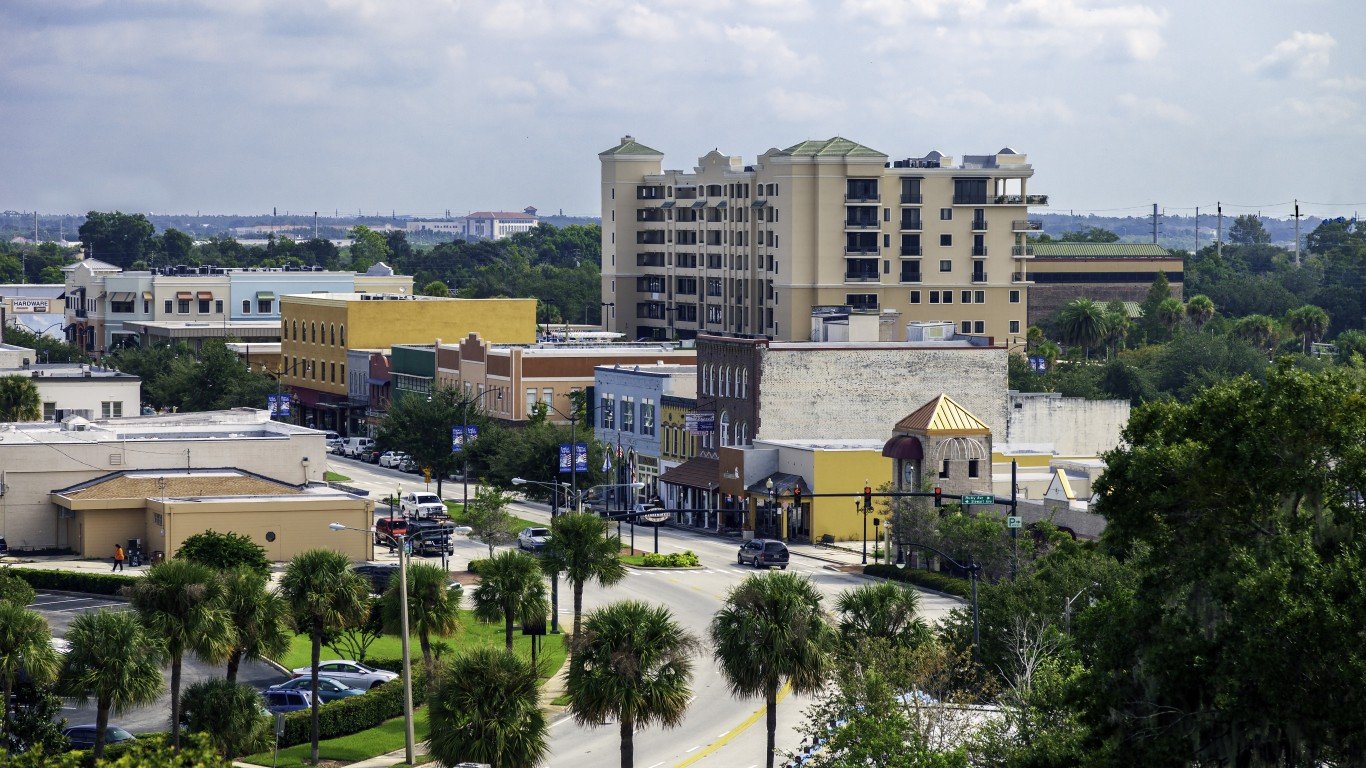
27. Poinciana, Florida

- 5-year change in Gini index score: +2.70 points (41.85 in 2023, 39.15 in 2019)
- 5-year change in share of households earning less than $25,000: -6.6 ppt.(14.2% in 2023, 20.8% in 2019)
- 5-year change in share of households earning at least $200,000: +3.4 ppt.(4.4% in 2023, 1.0% in 2019)
- 5-year change in median household income: +$13,164 ($63,042 in 2023, $49,878 in 2019)
- 5-year change in poverty rate: -2.6 ppt.(13.9% in 2023, 16.5% in 2019)
26. Kissimmee, Florida
- 5-year change in Gini index score: +2.72 points (45.48 in 2023, 42.76 in 2019)
- 5-year change in share of households earning less than $25,000: -4.8 ppt.(23.6% in 2023, 28.4% in 2019)
- 5-year change in share of households earning at least $200,000: +2.1 ppt.(3.3% in 2023, 1.2% in 2019)
- 5-year change in median household income: +$10,451 ($51,277 in 2023, $40,826 in 2019)
- 5-year change in poverty rate: +0.1 ppt.(23.7% in 2023, 23.6% in 2019)
25. Leander, Texas

- 5-year change in Gini index score: +2.74 points (40.14 in 2023, 37.40 in 2019)
- 5-year change in share of households earning less than $25,000: +0.2 ppt.(5.4% in 2023, 5.2% in 2019)
- 5-year change in share of households earning at least $200,000: +16.5 ppt.(28.0% in 2023, 11.5% in 2019)
- 5-year change in median household income: +$38,308 ($140,180 in 2023, $101,872 in 2019)
- 5-year change in poverty rate: +0.2 ppt.(4.4% in 2023, 4.2% in 2019)
24. Enterprise, Nevada

- 5-year change in Gini index score: +2.76 points (42.99 in 2023, 40.23 in 2019)
- 5-year change in share of households earning less than $25,000: -0.9 ppt.(9.0% in 2023, 9.9% in 2019)
- 5-year change in share of households earning at least $200,000: +5.6 ppt.(13.1% in 2023, 7.5% in 2019)
- 5-year change in median household income: +$12,519 ($93,980 in 2023, $81,461 in 2019)
- 5-year change in poverty rate: +1.7 ppt.(9.4% in 2023, 7.7% in 2019)
23. Portsmouth, Virginia

- 5-year change in Gini index score: +2.86 points (46.10 in 2023, 43.24 in 2019)
- 5-year change in share of households earning less than $25,000: -3.3 ppt.(21.1% in 2023, 24.4% in 2019)
- 5-year change in share of households earning at least $200,000: +2.0 ppt.(4.4% in 2023, 2.4% in 2019)
- 5-year change in median household income: +$6,797 ($58,972 in 2023, $52,175 in 2019)
- 5-year change in poverty rate: +0.8 ppt.(17.6% in 2023, 16.8% in 2019)
22. Alameda, California

- 5-year change in Gini index score: +2.96 points (47.21 in 2023, 44.25 in 2019)
- 5-year change in share of households earning less than $25,000: -2.6 ppt.(9.0% in 2023, 11.6% in 2019)
- 5-year change in share of households earning at least $200,000: +12.7 ppt.(32.1% in 2023, 19.4% in 2019)
- 5-year change in median household income: +$27,259 ($132,015 in 2023, $104,756 in 2019)
- 5-year change in poverty rate: -0.4 ppt.(6.9% in 2023, 7.3% in 2019)
21. Plantation, Florida

- 5-year change in Gini index score: +3.02 points (47.78 in 2023, 44.76 in 2019)
- 5-year change in share of households earning less than $25,000: -0.8 ppt.(12.4% in 2023, 13.2% in 2019)
- 5-year change in share of households earning at least $200,000: +6.8 ppt.(15.5% in 2023, 8.7% in 2019)
- 5-year change in median household income: +$12,174 ($87,077 in 2023, $74,903 in 2019)
- 5-year change in poverty rate: +1.7 ppt.(10.1% in 2023, 8.4% in 2019)
20. Santa Clara, California

- 5-year change in Gini index score: +3.19 points (44.78 in 2023, 41.59 in 2019)
- 5-year change in share of households earning less than $25,000: -0.6 ppt.(7.6% in 2023, 8.2% in 2019)
- 5-year change in share of households earning at least $200,000: +18.4 ppt.(43.9% in 2023, 25.5% in 2019)
- 5-year change in median household income: +$47,664 ($173,670 in 2023, $126,006 in 2019)
- 5-year change in poverty rate: +1.1 ppt.(7.8% in 2023, 6.7% in 2019)
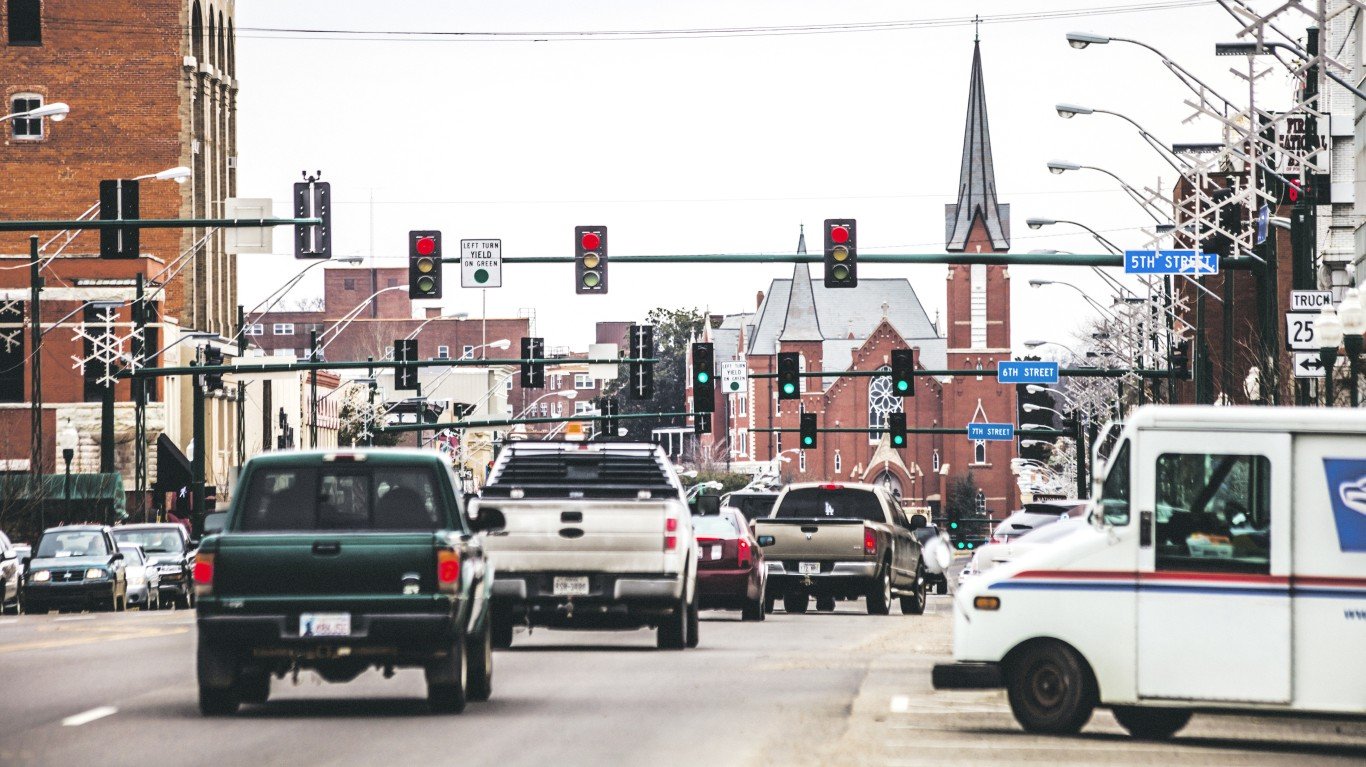
19. St. Joseph, Missouri

- 5-year change in Gini index score: +3.27 points (48.46 in 2023, 45.19 in 2019)
- 5-year change in share of households earning less than $25,000: -1.4 ppt.(23.3% in 2023, 24.7% in 2019)
- 5-year change in share of households earning at least $200,000: +2.3 ppt.(5.0% in 2023, 2.7% in 2019)
- 5-year change in median household income: +$7,381 ($55,578 in 2023, $48,197 in 2019)
- 5-year change in poverty rate: +0.0 ppt.(18.7% in 2023, 18.7% in 2019)
18. Sammamish, Washington

- 5-year change in Gini index score: +3.27 points (40.35 in 2023, 37.08 in 2019)
- 5-year change in share of households earning less than $25,000: +1.7 ppt.(5.3% in 2023, 3.6% in 2019)
- 5-year change in share of households earning at least $200,000: +15.2 ppt.(58.0% in 2023, 42.8% in 2019)
- 5-year change in median household income: +$53,270 ($227,273 in 2023, $174,003 in 2019)
- 5-year change in poverty rate: +2.0 ppt.(4.4% in 2023, 2.4% in 2019)
17. Redmond, Washington

- 5-year change in Gini index score: +3.31 points (44.22 in 2023, 40.91 in 2019)
- 5-year change in share of households earning less than $25,000: -0.3 ppt.(7.5% in 2023, 7.8% in 2019)
- 5-year change in share of households earning at least $200,000: +13.2 ppt.(39.0% in 2023, 25.8% in 2019)
- 5-year change in median household income: +$29,911 ($162,099 in 2023, $132,188 in 2019)
- 5-year change in poverty rate: +0.4 ppt.(5.8% in 2023, 5.4% in 2019)
16. Lewisville, Texas

- 5-year change in Gini index score: +3.37 points (41.63 in 2023, 38.26 in 2019)
- 5-year change in share of households earning less than $25,000: -3.6 ppt.(8.2% in 2023, 11.8% in 2019)
- 5-year change in share of households earning at least $200,000: +8.7 ppt.(12.3% in 2023, 3.6% in 2019)
- 5-year change in median household income: +$20,509 ($85,002 in 2023, $64,493 in 2019)
- 5-year change in poverty rate: -2.8 ppt.(7.6% in 2023, 10.4% in 2019)
15. Pearland, Texas

- 5-year change in Gini index score: +3.41 points (40.54 in 2023, 37.13 in 2019)
- 5-year change in share of households earning less than $25,000: -0.5 ppt.(6.7% in 2023, 7.2% in 2019)
- 5-year change in share of households earning at least $200,000: +8.7 ppt.(21.0% in 2023, 12.3% in 2019)
- 5-year change in median household income: +$7,966 ($112,470 in 2023, $104,504 in 2019)
- 5-year change in poverty rate: +0.7 ppt.(4.2% in 2023, 3.5% in 2019)
14. Broken Arrow, Oklahoma
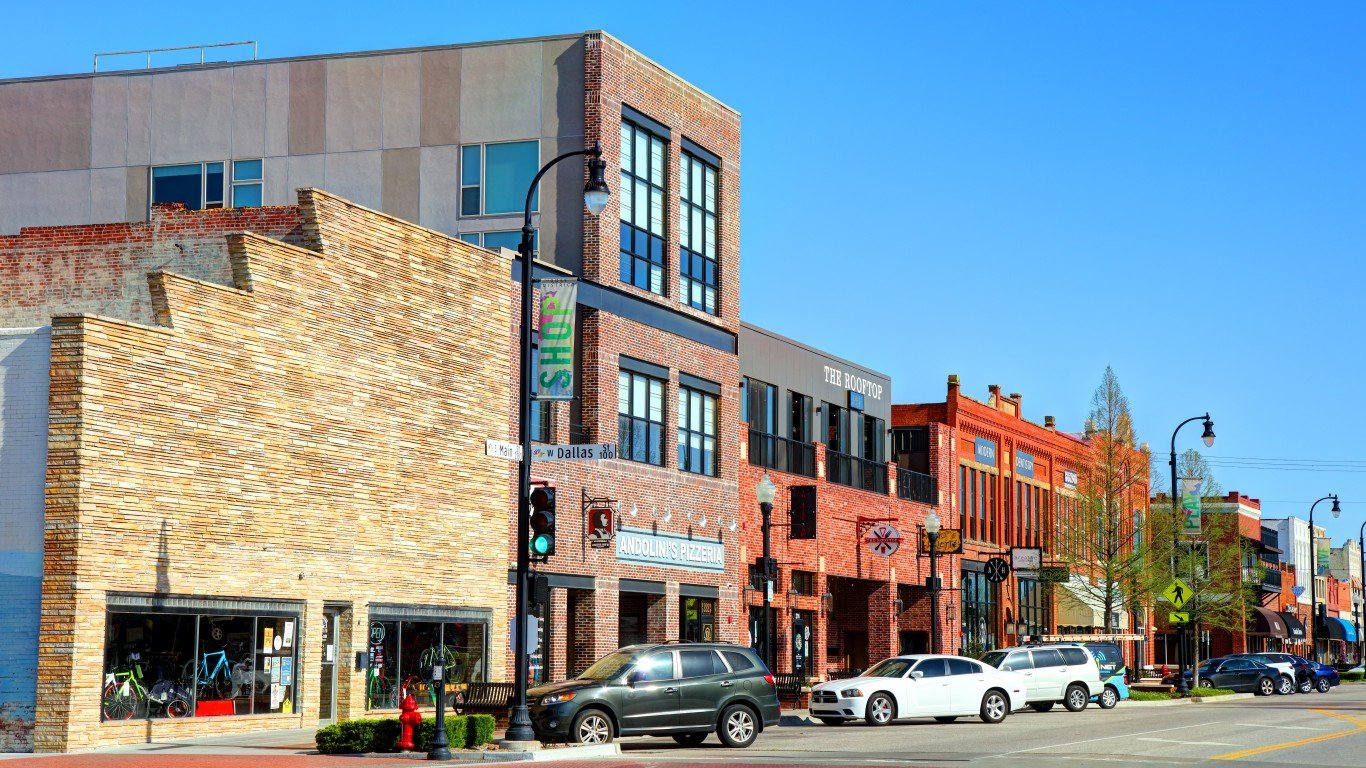
- 5-year change in Gini index score: +3.45 points (44.34 in 2023, 40.89 in 2019)
- 5-year change in share of households earning less than $25,000: -1.8 ppt.(9.6% in 2023, 11.4% in 2019)
- 5-year change in share of households earning at least $200,000: +3.8 ppt.(9.7% in 2023, 5.9% in 2019)
- 5-year change in median household income: +$12,101 ($85,220 in 2023, $73,119 in 2019)
- 5-year change in poverty rate: +1.0 ppt.(9.0% in 2023, 8.0% in 2019)
13. Round Rock, Texas

- 5-year change in Gini index score: +3.62 points (42.44 in 2023, 38.82 in 2019)
- 5-year change in share of households earning less than $25,000: -0.2 ppt.(8.4% in 2023, 8.6% in 2019)
- 5-year change in share of households earning at least $200,000: +6.5 ppt.(15.7% in 2023, 9.2% in 2019)
- 5-year change in median household income: +$14,511 ($97,187 in 2023, $82,676 in 2019)
- 5-year change in poverty rate: +0.7 ppt.(7.7% in 2023, 7.0% in 2019)
12. Fort Smith, Arkansas
- 5-year change in Gini index score: +3.65 points (52.36 in 2023, 48.71 in 2019)
- 5-year change in share of households earning less than $25,000: -7.4 ppt.(20.5% in 2023, 27.9% in 2019)
- 5-year change in share of households earning at least $200,000: +2.6 ppt.(5.6% in 2023, 3.0% in 2019)
- 5-year change in median household income: +$10,968 ($52,692 in 2023, $41,724 in 2019)
- 5-year change in poverty rate: -2.7 ppt.(18.3% in 2023, 21.0% in 2019)
11. Kirkland, Washington
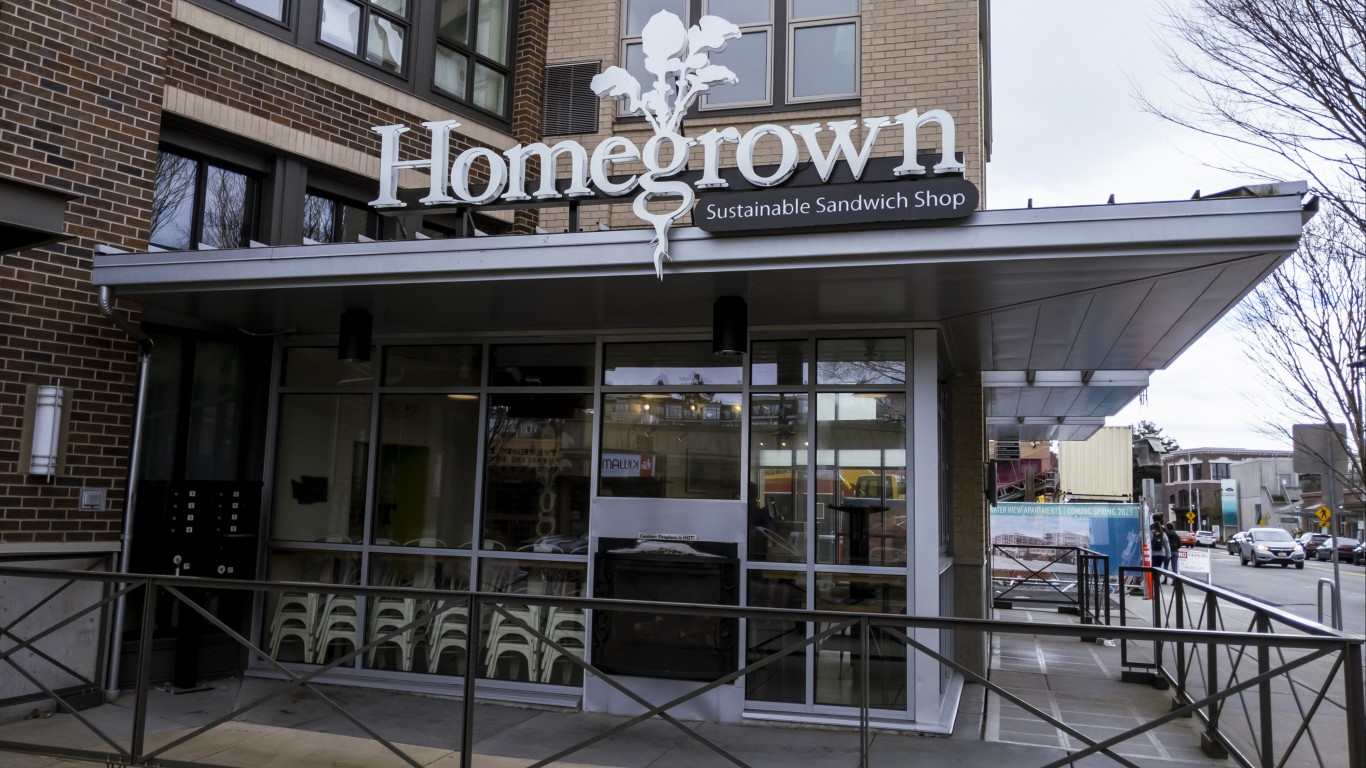
- 5-year change in Gini index score: +3.69 points (48.74 in 2023, 45.05 in 2019)
- 5-year change in share of households earning less than $25,000: -1.0 ppt.(7.3% in 2023, 8.3% in 2019)
- 5-year change in share of households earning at least $200,000: +13.2 ppt.(35.5% in 2023, 22.3% in 2019)
- 5-year change in median household income: +$26,343 ($143,533 in 2023, $117,190 in 2019)
- 5-year change in poverty rate: -0.1 ppt.(6.0% in 2023, 6.1% in 2019)
10. Mount Pleasant, South Carolina

- 5-year change in Gini index score: +3.83 points (47.84 in 2023, 44.01 in 2019)
- 5-year change in share of households earning less than $25,000: +0.8 ppt.(9.5% in 2023, 8.7% in 2019)
- 5-year change in share of households earning at least $200,000: +7.1 ppt.(27.0% in 2023, 19.9% in 2019)
- 5-year change in median household income: +$18,132 ($121,364 in 2023, $103,232 in 2019)
- 5-year change in poverty rate: +1.2 ppt.(5.8% in 2023, 4.6% in 2019)
9. Vista, California
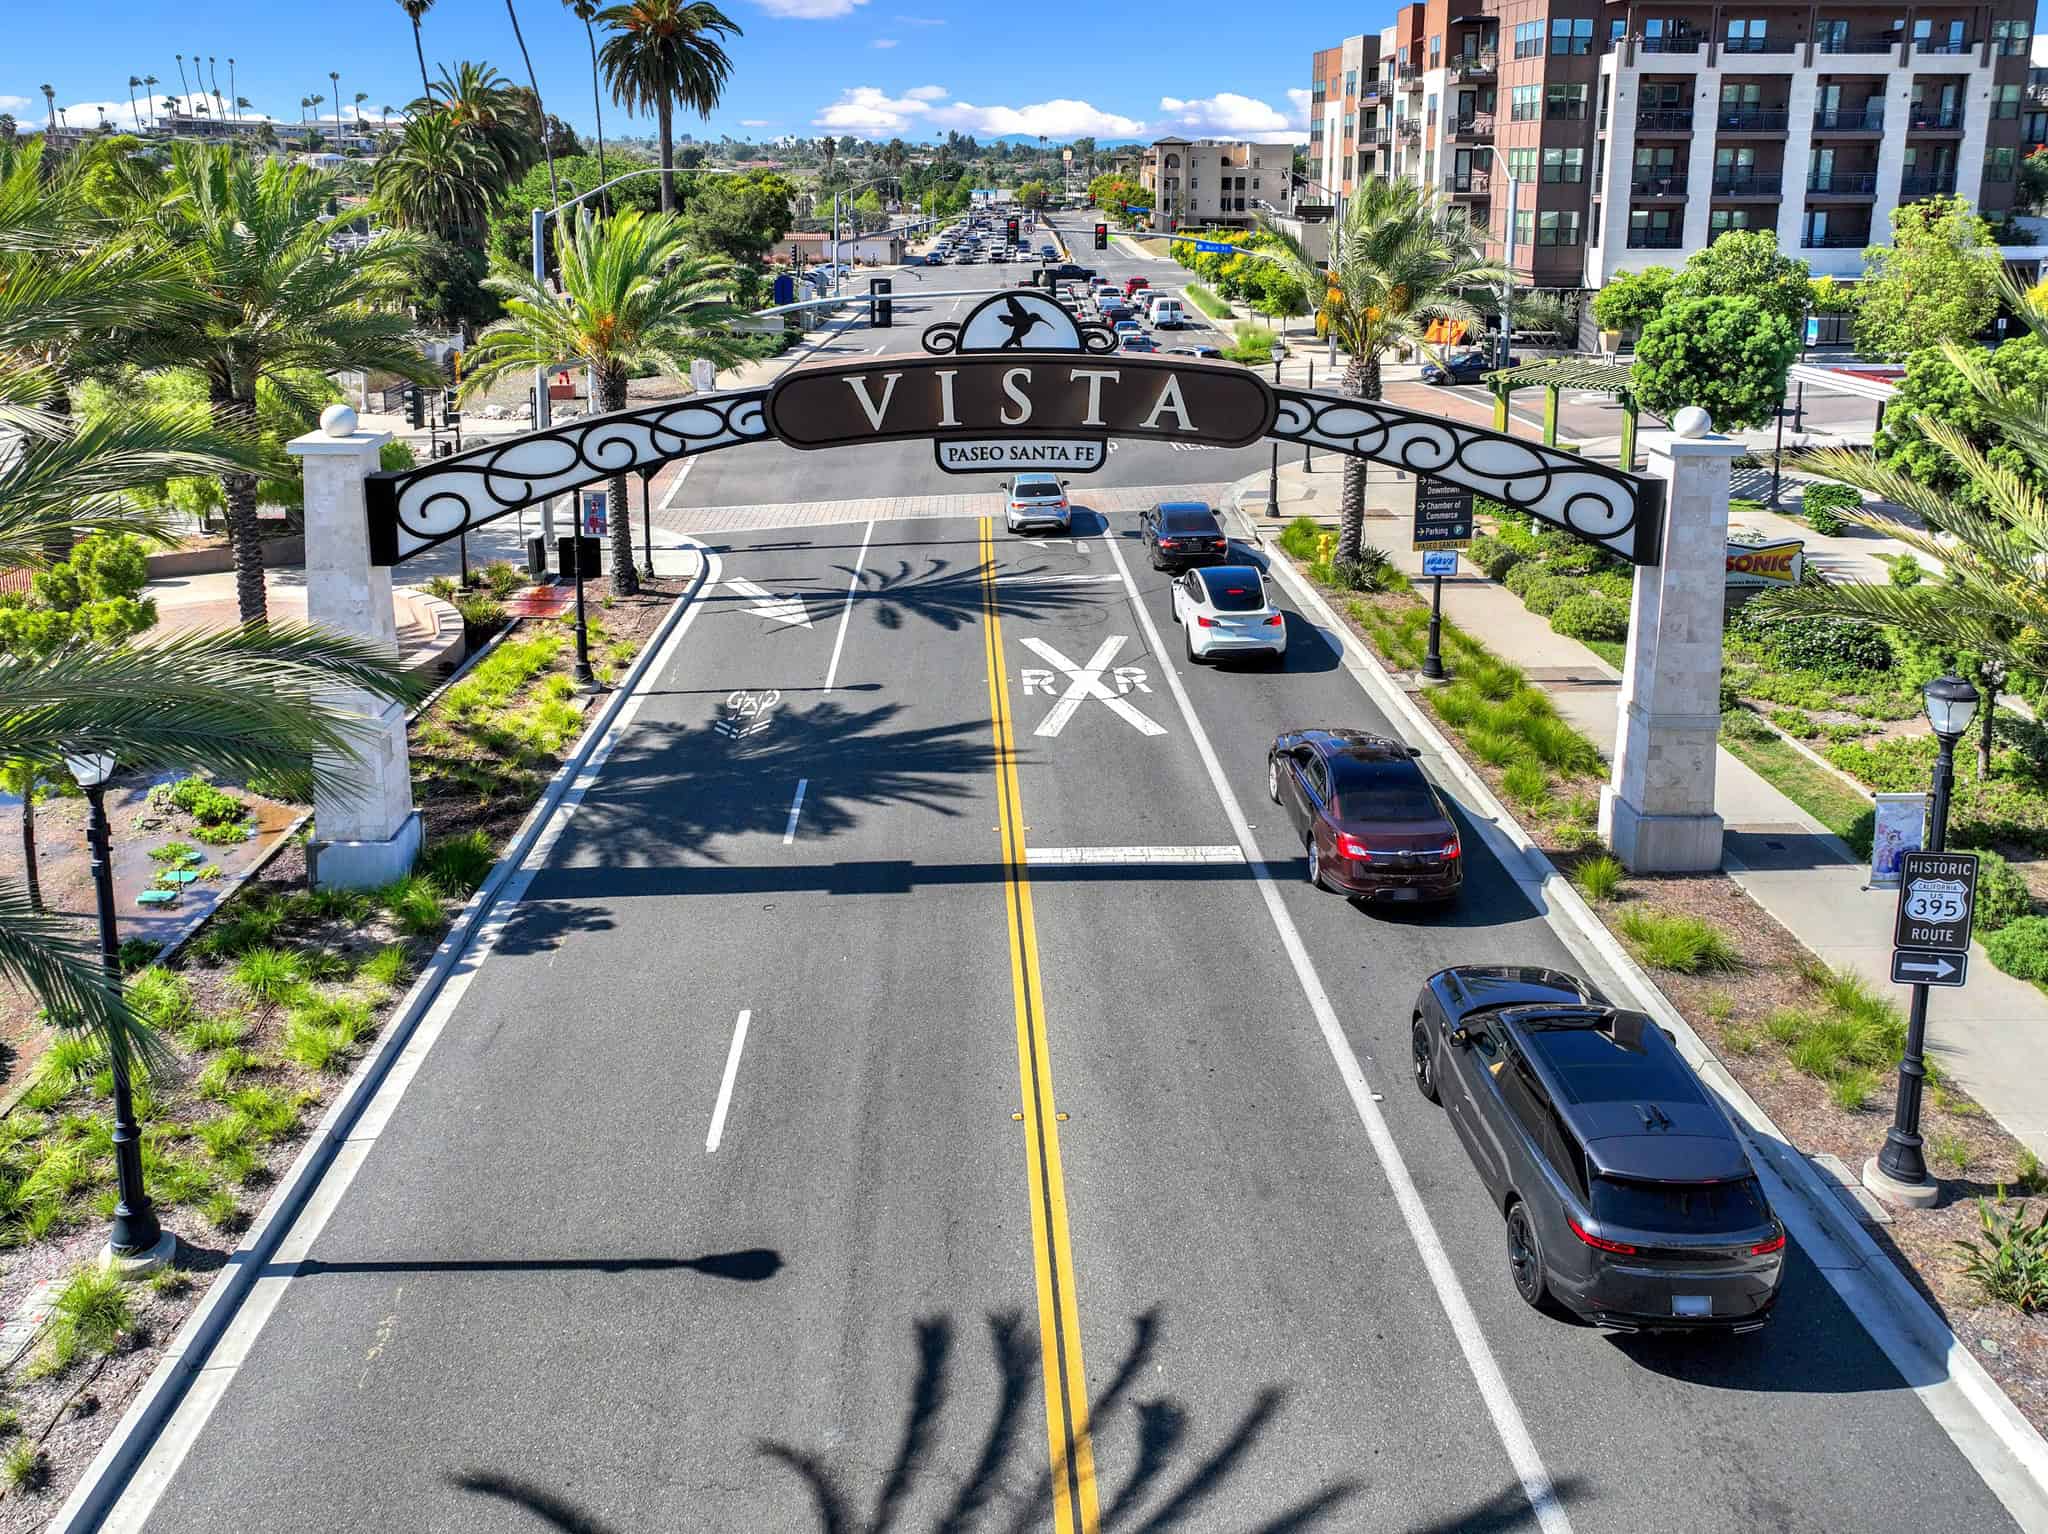
- 5-year change in Gini index score: +3.90 points (43.85 in 2023, 39.95 in 2019)
- 5-year change in share of households earning less than $25,000: -3.2 ppt.(8.8% in 2023, 12.0% in 2019)
- 5-year change in share of households earning at least $200,000: +9.4 ppt.(15.3% in 2023, 5.9% in 2019)
- 5-year change in median household income: +$19,729 ($91,854 in 2023, $72,125 in 2019)
- 5-year change in poverty rate: -2.2 ppt.(10.2% in 2023, 12.4% in 2019)
8. Schenectady, New York

- 5-year change in Gini index score: +3.92 points (47.75 in 2023, 43.83 in 2019)
- 5-year change in share of households earning less than $25,000: -3.8 ppt.(23.9% in 2023, 27.7% in 2019)
- 5-year change in share of households earning at least $200,000: +2.5 ppt.(4.1% in 2023, 1.6% in 2019)
- 5-year change in median household income: +$10,960 ($56,398 in 2023, $45,438 in 2019)
- 5-year change in poverty rate: +3.7 ppt.(23.1% in 2023, 19.4% in 2019)
7. Trenton, New Jersey

- 5-year change in Gini index score: +3.92 points (55.57 in 2023, 51.65 in 2019)
- 5-year change in share of households earning less than $25,000: -8.2 ppt.(30.3% in 2023, 38.5% in 2019)
- 5-year change in share of households earning at least $200,000: +3.3 ppt.(5.2% in 2023, 1.9% in 2019)
- 5-year change in median household income: +$11,700 ($47,102 in 2023, $35,402 in 2019)
- 5-year change in poverty rate: -4.0 ppt.(24.7% in 2023, 28.7% in 2019)
6. Palm Coast, Florida

- 5-year change in Gini index score: +4.25 points (44.27 in 2023, 40.02 in 2019)
- 5-year change in share of households earning less than $25,000: -5.1 ppt.(12.5% in 2023, 17.6% in 2019)
- 5-year change in share of households earning at least $200,000: +5.5 ppt.(7.8% in 2023, 2.3% in 2019)
- 5-year change in median household income: +$17,480 ($71,840 in 2023, $54,360 in 2019)
- 5-year change in poverty rate: -2.8 ppt.(9.5% in 2023, 12.3% in 2019)
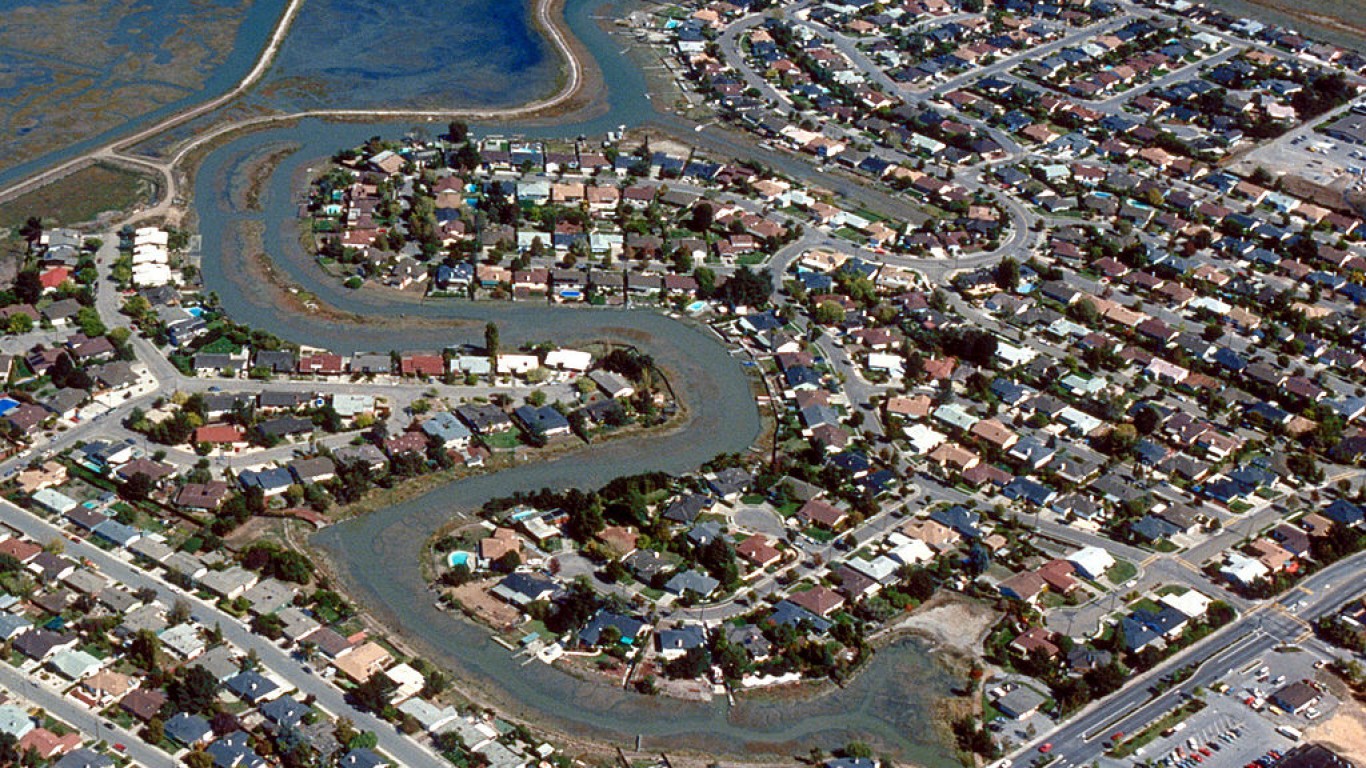
5. Union City, California

- 5-year change in Gini index score: +4.34 points (41.88 in 2023, 37.54 in 2019)
- 5-year change in share of households earning less than $25,000: +1.4 ppt.(8.5% in 2023, 7.1% in 2019)
- 5-year change in share of households earning at least $200,000: +12.8 ppt.(33.4% in 2023, 20.6% in 2019)
- 5-year change in median household income: +$22,513 ($137,194 in 2023, $114,681 in 2019)
- 5-year change in poverty rate: +2.0 ppt.(7.0% in 2023, 5.0% in 2019)
4. Victorville, California
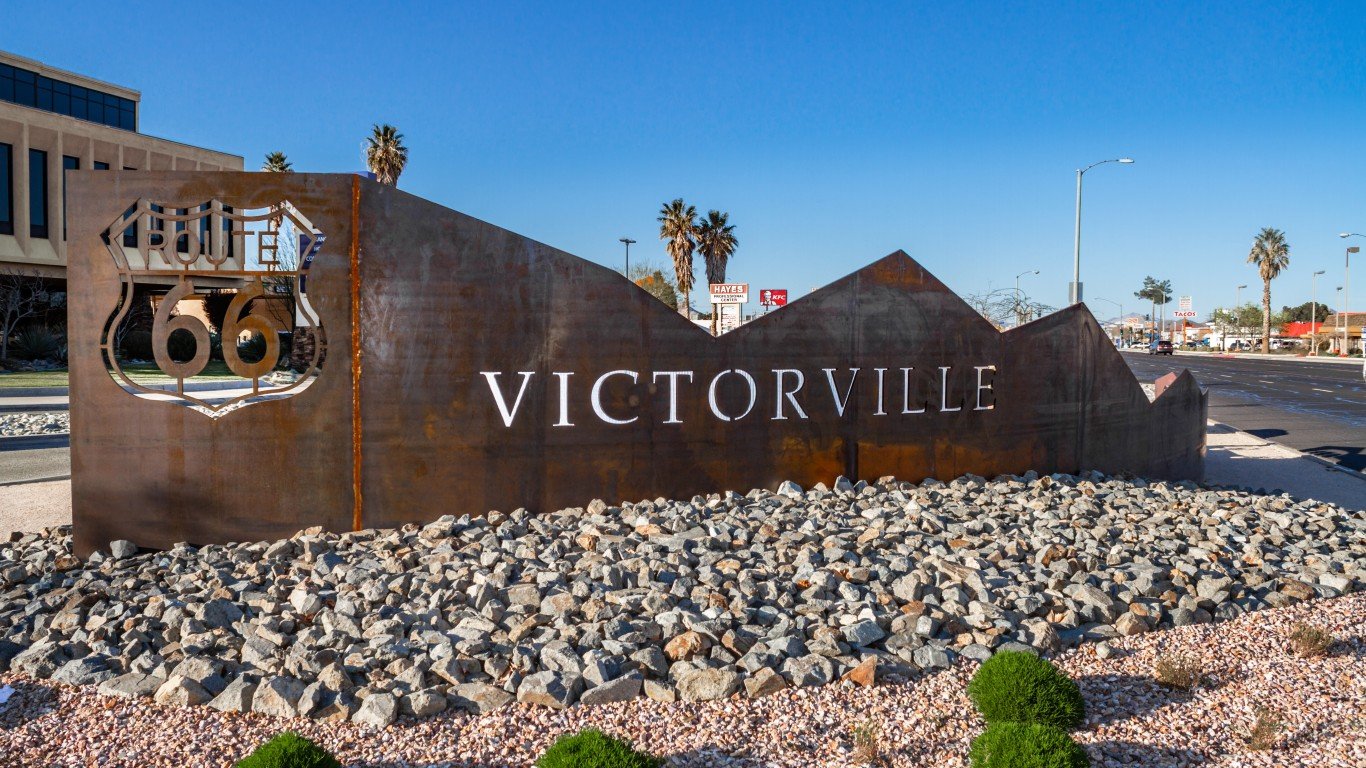
- 5-year change in Gini index score: +4.72 points (47.95 in 2023, 43.23 in 2019)
- 5-year change in share of households earning less than $25,000: -3.6 ppt.(17.6% in 2023, 21.2% in 2019)
- 5-year change in share of households earning at least $200,000: +4.1 ppt.(6.6% in 2023, 2.5% in 2019)
- 5-year change in median household income: +$16,706 ($70,663 in 2023, $53,957 in 2019)
- 5-year change in poverty rate: -0.2 ppt.(19.9% in 2023, 20.1% in 2019)
3. Palm Bay, Florida

- 5-year change in Gini index score: +5.73 points (45.65 in 2023, 39.92 in 2019)
- 5-year change in share of households earning less than $25,000: -7.1 ppt.(13.1% in 2023, 20.2% in 2019)
- 5-year change in share of households earning at least $200,000: +3.9 ppt.(5.9% in 2023, 2.0% in 2019)
- 5-year change in median household income: +$16,113 ($67,521 in 2023, $51,408 in 2019)
- 5-year change in poverty rate: -1.5 ppt.(11.5% in 2023, 13.0% in 2019)
2. Madera, California
- 5-year change in Gini index score: +6.08 points (49.44 in 2023, 43.36 in 2019)
- 5-year change in share of households earning less than $25,000: -5.2 ppt.(19.2% in 2023, 24.4% in 2019)
- 5-year change in share of households earning at least $200,000: +3.9 ppt.(5.7% in 2023, 1.8% in 2019)
- 5-year change in median household income: +$18,456 ($63,619 in 2023, $45,163 in 2019)
- 5-year change in poverty rate: -0.8 ppt.(26.0% in 2023, 26.8% in 2019)
1. Appleton, Wisconsin

- 5-year change in Gini index score: +6.44 points (50.20 in 2023, 43.76 in 2019)
- 5-year change in share of households earning less than $25,000: -6.4 ppt.(11.3% in 2023, 17.7% in 2019)
- 5-year change in share of households earning at least $200,000: +4.0 ppt.(8.2% in 2023, 4.2% in 2019)
- 5-year change in median household income: +$19,338 ($77,450 in 2023, $58,112 in 2019)
- 5-year change in poverty rate: -2.3 ppt.(8.5% in 2023, 10.8% in 2019)
The post In These U.S. Cities, Income Inequality is Getting Worse appeared first on 24/7 Wall St..