Gun Tracing Data Revealed America’s Unexpected Gun Crime Capital
According to Moms Demand Action, a subset of the gun violence prevention organization Everytown for Gun Safety, gun violence has become the leading cause of death for college-aged individuals (between 18 to 25 years old) within the United States. In reporting from Al Jazeera, Politifact’s Loreben Tuquero breaks down this statement to determine how true […] The post Gun Tracing Data Revealed America’s Unexpected Gun Crime Capital appeared first on 24/7 Wall St..

According to Moms Demand Action, a subset of the gun violence prevention organization Everytown for Gun Safety, gun violence has become the leading cause of death for college-aged individuals (between 18 to 25 years old) within the United States. In reporting from Al Jazeera, Politifact’s Loreben Tuquero breaks down this statement to determine how true it is — and the results are shocking. Ultimately, Politifact determines that the statement is true, though gun-related homicides are not really on the top of the list of gun crime or gun violence leading to death. When gun-related homicides occur in this age group, a portion of these do occur on school grounds, though not all of them. What Politifact found is that a majority of gun-related deaths within this age range are usually suicides or accidents, which may occur when cleaning a gun or playing around with it. Given that guns are involved in a significant amount of college-aged deaths, it’s no surprise that gun crime and gun control are two of the biggest topics in American discourse. (In this southern state, firearm theft is becoming a major problem.)
As gun control legislation has weakened in several states under President Donald Trump, other states have implemented stricter regulations to reduce gun crime and violence. Several areas also have grassroots initiatives to stop violence, such as marching for community action in Hartsville, South Carolina or “Chop It Up” discussions in Montgomery, Alabama designed to reduce youth gun crime rates. Despite these efforts, several cities still struggle with a gun crime epidemic. Here, 24/7 Wall St. determined the top 55 cities across the United States with the highest gun crime rates. To do so, we used firearms trace data from the Bureau of Alcohol, Tobacco, Firearms and Explosives (the ATF) from 2023, the most up-to-date information available at this time. We included information on the total firearms traced by the ATF in 2023, as well as population sizes and poverty levels sourced from the U.S. Census Bureau’s 2023 American Community Survey and independently verified online. While we determined the estimated gun crime rate per 10,000 people, it’s important to understand that gun tracings only provide an approximation of crimes that occurred. Not all traced guns are linked to crimes, and not all guns used in crimes are traced. However, we attempted to make the numbers as accurate as possible given the data we had.
This previously published article was updated in April 2025 to provide adjusted data for five cities and to take a deeper look at some of the efforts to combat gun crime throughout the country.
Why Gun Crime is an Urgent Issue

The Bureau of Alcohol, Tobacco, Firearms, and Explosives traced over 400,000 firearms across the 50 states in 2023, suggesting a gun crime rate of about 12.3 incidents for every 10,000 people. Among wealthy, highly developed countries, criminal use of firearms is a uniquely American problem — and according to the ATF, the most common gun-related offenses include robbery, aggravated assault, burglary, and homicide. These, as well as other gun crimes, are especially common in certain parts of the country. Gun homicide is also increasingly worrying in the U.S. — 20 people have been killed in Memphis in just a two-week period; 12 people were just shot in Myrtle Beach, South Carolina; and a shooting at a North Carolina university left six people injured and one dead. Unfortunately, these stories have become par for the course in the United States — and many people no longer bat an eye when hearing about gun violence. If this gun violence is allowed to continue and solutions are now found, many of the cities on this list will most likely suffer from less people moving to the area, less businesses, and more poverty.
Here are the 55 cities nationwide with the highest gun crime rates:
55. Rochester, New York

- Est. gun crime rate in Rochester; 2023: 39.1 for every 10,000 people
- Total firearms traced by the ATF in Rochester; 2023: 812
- Rochester population: 207,274
- Poverty rate: 26.6%
54. Washington, D.C.

- Est. gun crime rate in Washington, D.C.; 2023: 45.8 for every 10,000 people
- Total firearms traced by the ATF in Washington, D.C.; 2023: 3,106
- Washington, D.C. population: 678,972
- Poverty rate: 14.0%
53. Gulfport, Mississippi

- Est. gun crime rate in Gulfport; 2023: 48.8 for every 10,000 people
- Total firearms traced by the ATF in Gulfport; 2023: 356
- Gulfport population: 72,823
- Poverty rate: 24.3%
52. Houston, Texas

- Est. gun crime rate in Houston; 2023: 54.7 for every 10,000 people
- Total firearms traced by the ATF in Houston; 2023: 12,586
- Houston population: 2,314,157
- Poverty rate: 19.7%
51. Fort Smith, Arkansas
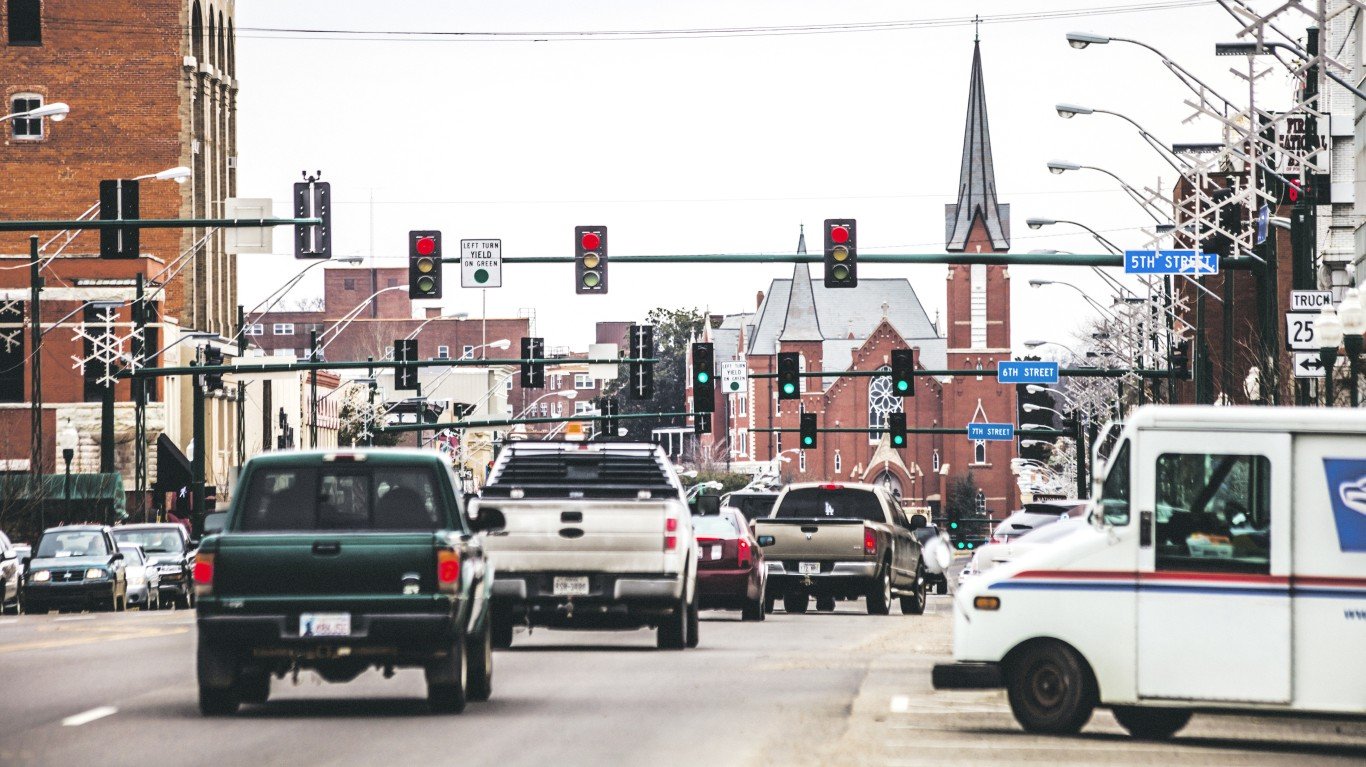
- Est. gun crime rate in Fort Smith; 2023: 54.9 for every 10,000 people
- Total firearms traced by the ATF in Fort Smith; 2023: 493
- Fort Smith population: 89,770
- Poverty rate: 18.3%
50. Augusta, Georgia

- Est. gun crime rate in Augusta; 2023: 55.7 for every 10,000 people
- Total firearms traced by the ATF in Augusta; 2023: 1,119
- Augusta population: 200,884
- Poverty rate: 21.1%
49. Topeka, Kansas

- Est. gun crime rate in Topeka; 2023: 55.9 for every 10,000 people
- Total firearms traced by the ATF in Topeka; 2023: 705
- Topeka population: 126,103
- Poverty rate: 15.6%
48. Miami, Florida

- Est. gun crime rate in Miami; 2023: 56.0 for every 10,000 people
- Total firearms traced by the ATF in Miami; 2023: 2,501
- Miami population: 446,663
- Poverty rate: 19.2%
47. Rapid City, South Dakota

- Est. gun crime rate in Rapid City; 2023: 56.2 for every 10,000 people
- Total firearms traced by the ATF in Rapid City; 2023: 432
- Rapid City population: 76,836
- Poverty rate: 13.3%
46. Camden, New Jersey

- Est. gun crime rate in Camden; 2023: 56.8 for every 10,000 people
- Total firearms traced by the ATF in Camden; 2023: 406
- Camden population: 71,471
- Poverty rat: 28.5%
45. Wilmington, Delaware

- Est. gun crime rate in Wilmington; 2023: 57.4 for every 10,000 people
- Total firearms traced by the ATF in Wilmington; 2023: 408
- Wilmington population: 71,124
- Poverty rate: 23.2%
44. Indianapolis, Indiana

- Est. gun crime rate in Indianapolis; 2023: 57.6 for every 10,000 people
- Total firearms traced by the ATF in Indianapolis; 2023: 5,082
- Indianapolis population: 882,043
- Poverty rate: 15.7%
43. Macon, Georgia

- Est. gun crime rate in Macon; 2023: 57.9 for every 10,000 people
- Total firearms traced by the ATF in Macon; 2023: 906
- Macon population: 156,543
- Poverty rate: 24.8%
42. Mesquite, Texas

- Est. gun crime rate in Mesquite; 2023: 58.7 for every 10,000 people
- Total firearms traced by the ATF in Mesquite; 2023: 873
- Mesquite population: 148,848
- Poverty rate: 12.4%
41. Wilmington, North Carolina

- Est. gun crime rate in Wilmington; 2023: 60.7 for every 10,000 people
- Total firearms traced by the ATF in Wilmington; 2023: 720
- Wilmington population: 118,578
- Poverty rate: 16.3%
40. Newport News, Virginia

- Est. gun crime rate in Newport News; 2023: 61.2 for every 10,000 people
- Total firearms traced by the ATF in Newport News; 2023: 1,131
- Newport News population: 184,774
- Poverty rate: 15.1%
39. Winston-Salem, North Carolina

- Est. gun crime rate in Winston-Salem; 2023: 62.6 for every 10,000 people
- Total firearms traced by the ATF in Winston-Salem; 2023: 1,571
- Winston-Salem population: 250,887
- Poverty rate: 17.9%
38. Greensboro, North Carolina

- Est. gun crime rate in Greensboro; 2023: 62.8 for every 10,000 people
- Total firearms traced by the ATF in Greensboro; 2023: 1,874
- Greensboro population: 298,564
- Poverty rate: 18.4%
37. Hoover, Alabama

- Est. gun crime rate in Hoover; 2023: 63.2 for every 10,000 people
- Total firearms traced by the ATF in Hoover; 2023: 584
- Hoover population: 92,401
- Poverty rate: 5.3%
36. Milwaukee, Wisconsin

- Est. gun crime rate in Milwaukee; 2023: 66.4 for every 10,000 people
- Total firearms traced by the ATF in Milwaukee; 2023: 3,781
- Milwaukee population: 569,756
- Poverty rate: 23.3%
35. Tampa, Florida

- Est. gun crime rate in Tampa; 2023: 67.1 for every 10,000 people
- Total firearms traced by the ATF in Tampa; 2023: 2,638
- Tampa population: 393,389
- Poverty rate: 15.9%
34. Chattanooga, Tennessee

- Est. gun crime rate in Chattanooga; 2023: 67.2 for every 10,000 people
- Total firearms traced by the ATF in Chattanooga; 2023: 1,229
- Chattanooga population: 182,832
- Poverty rate: 17.6%
33. Las Vegas, Nevada

- Est. gun crime rate in Las Vegas; 2023: 67.5 for every 10,000 people
- Total firearms traced by the ATF in Las Vegas; 2023: 4,395
- Las Vegas population: 650,873
- Poverty rate: 14.2%
32. San Bernardino, California

- Est. gun crime rate in San Bernardino; 2023: 68.5 for every 10,000 people
- Total firearms traced by the ATF in San Bernardino; 2023: 1,519
- San Bernardino population: 221,774
- Poverty rate: 19.5%
31. Huntsville, Alabama

- Est. gun crime rate in Huntsville; 2023: 69.1 for every 10,000 people
- Total firearms traced by the ATF in Huntsville; 2023: 1,513
- Huntsville population: 218,814
- Poverty rate: 13.8%
30. Cleveland, Ohio

- Est. gun crime rate in Cleveland; 2023: 69.4 for every 10,000 people
- Total firearms traced by the ATF in Cleveland; 2023: 2,551
- Cleveland population: 367,523
- Poverty rate: 30.8%
29. Shreveport, Louisiana

- Est. gun crime rate in Shreveport; 2023: 70.1 for every 10,000 people
- Total firearms traced by the ATF in Shreveport; 2023: 1,287
- Shreveport population: 183,483
- Poverty rate: 23.6%
28. Gary, Indiana
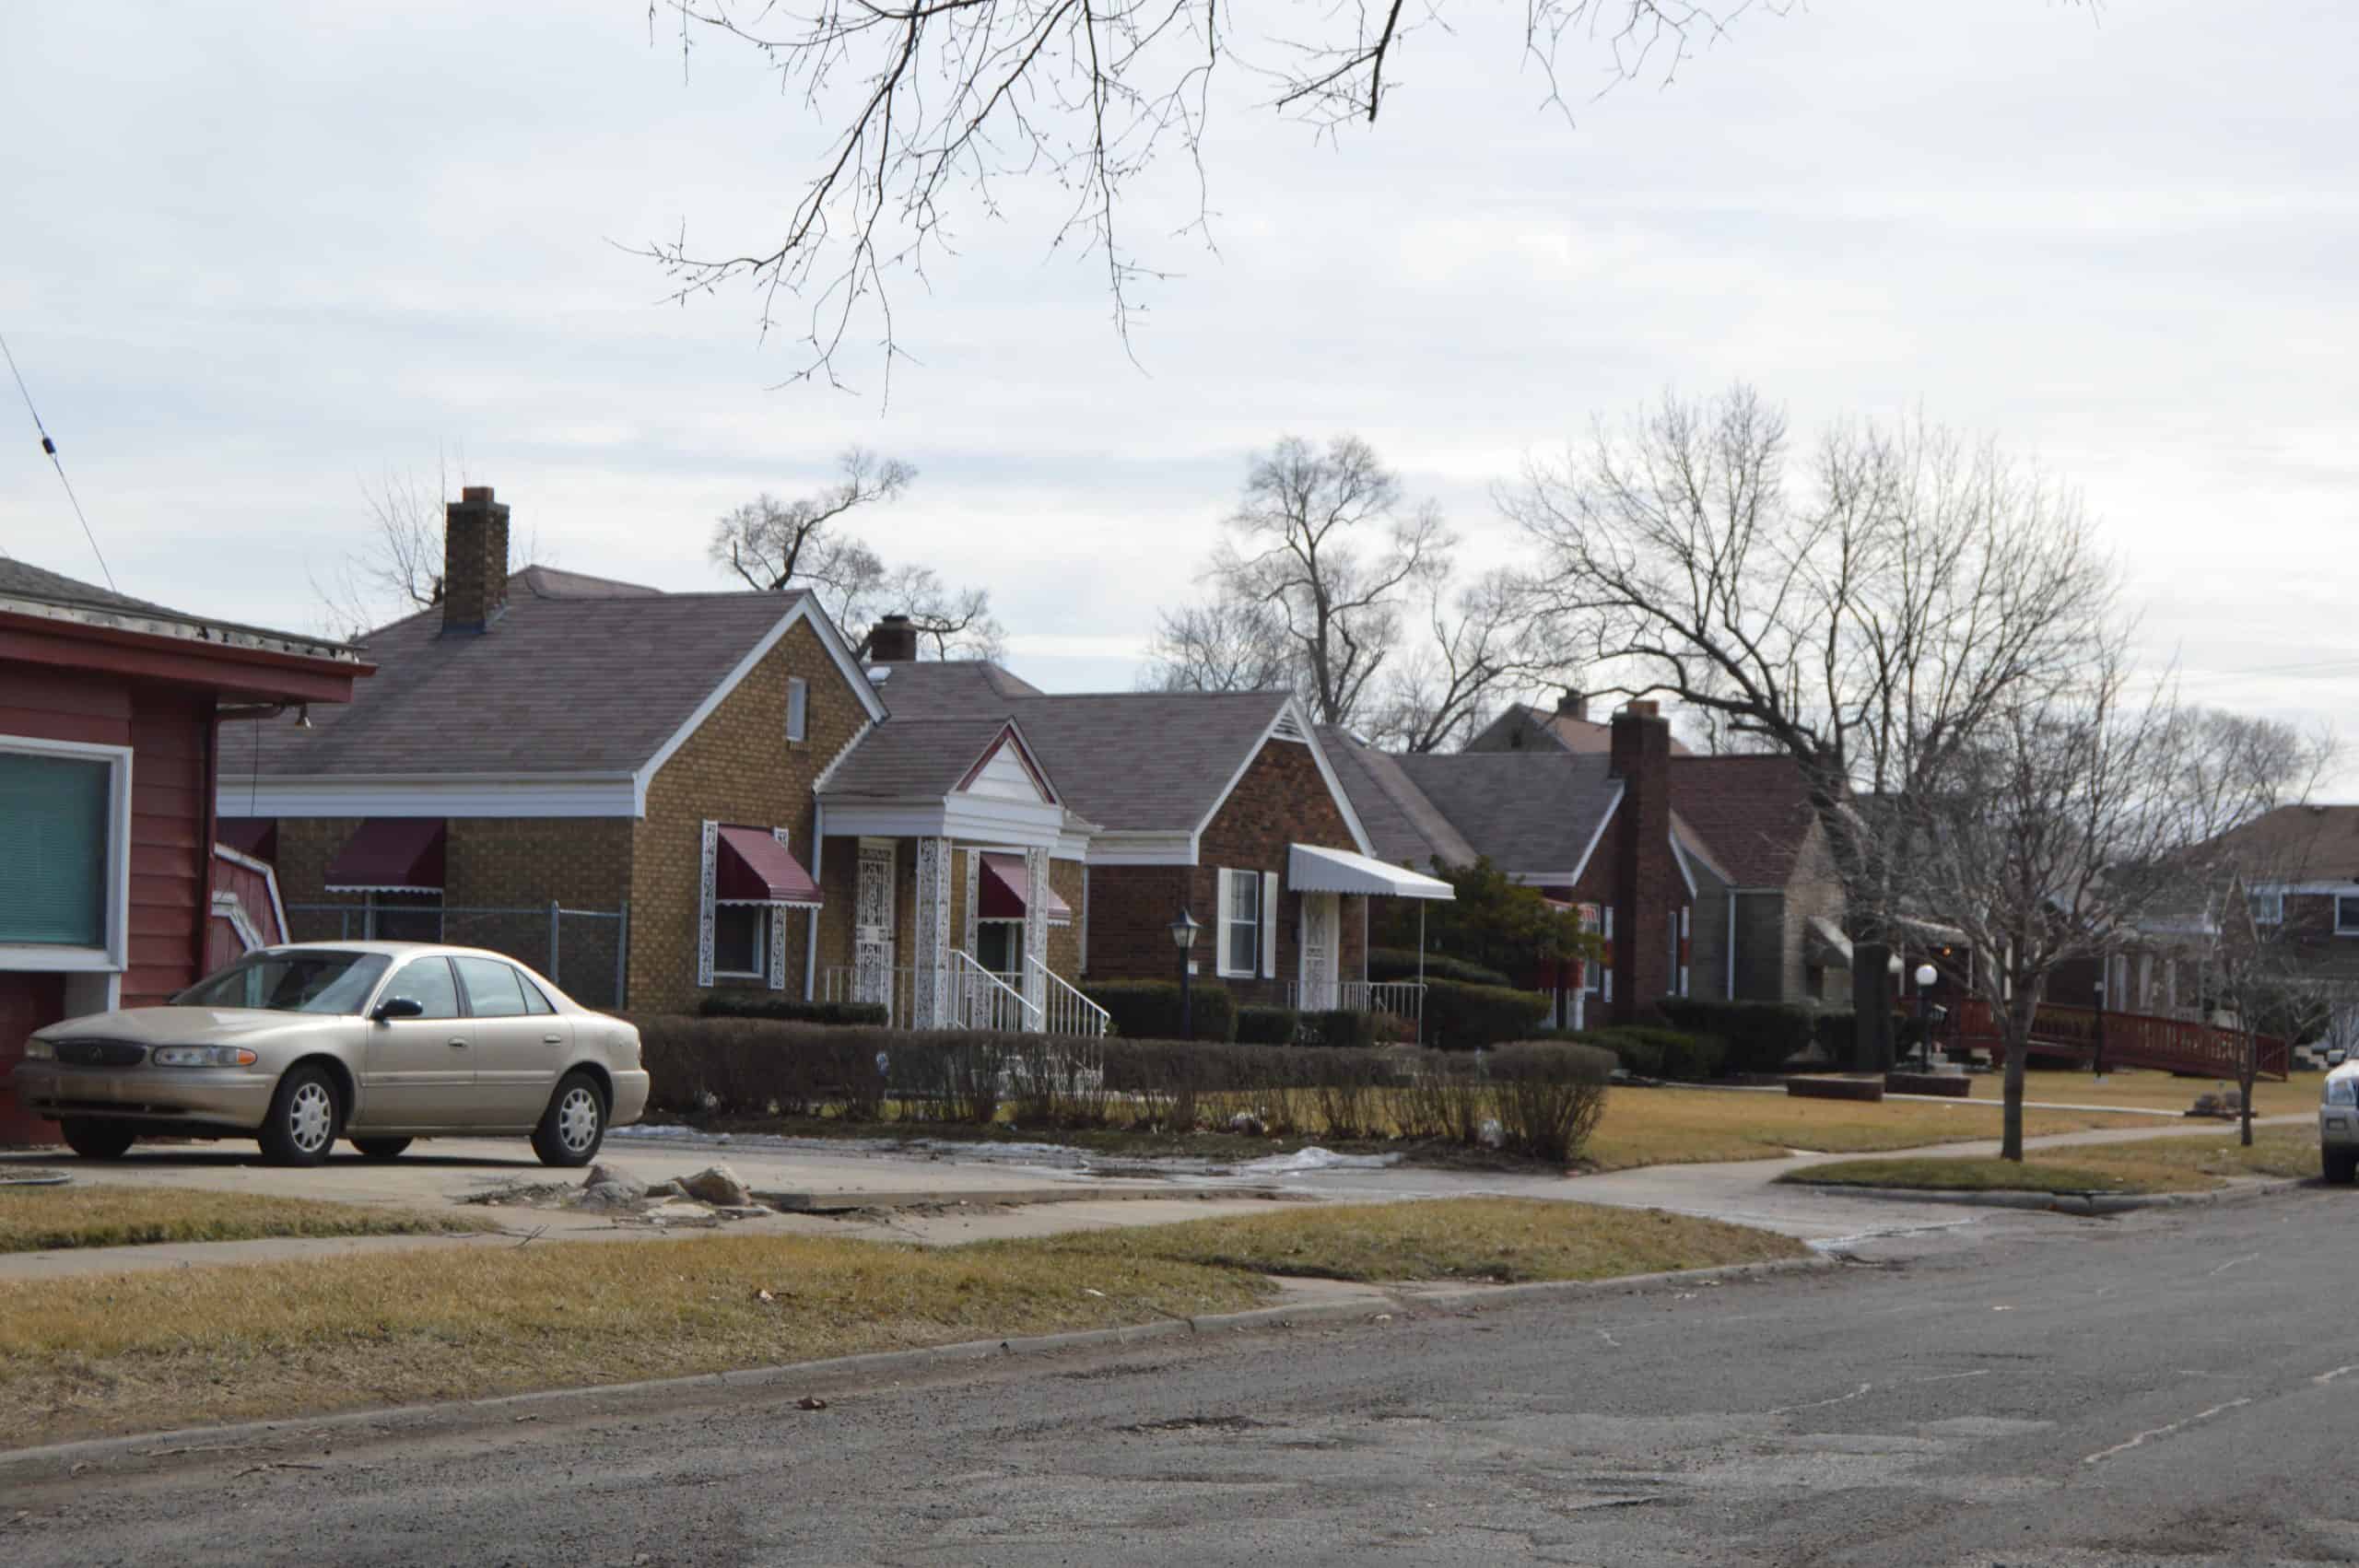
- Est. gun crime rate in Gary; 2023: 72.2 for every 10,000 people
- Total firearms traced by the ATF in Gary; 2023: 495
- Gary population: 68,604
- Poverty rate: 32.9%
27. Baton Rouge, Louisiana

- Est. gun crime rate in Baton Rouge; 2023: 72.7 for every 10,000 people
- Total firearms traced by the ATF in Baton Rouge; 2023: 1,627
- Baton Rouge population: 223,699
- Poverty rate: 25.0%
26. Lake Charles, Louisiana

- Est. gun crime rate in Lake Charles; 2023: 73.2 for every 10,000 people
- Total firearms traced by the ATF in Lake Charles; 2023: 598
- Lake Charles population: 81,679
- Poverty rate: 23.2%
25. Richmond, Virginia

- Est. gun crime rate in Richmond; 2023: 73.3 for every 10,000 people
- Total firearms traced by the ATF in Richmond; 2023: 1,668
- Richmond population: 227,595
- Poverty rate: 18.8%
24. South Bend, Indiana

- Est. gun crime rate in South Bend; 2023: 75.0 for every 10,000 people
- Total firearms traced by the ATF in South Bend; 2023: 772
- South Bend population: 102,866
- Poverty rate: 22.6%
23. Mobile, Alabama

- Est. gun crime rate in Mobile; 2023: 75.5 for every 10,000 people
- Total firearms traced by the ATF in Mobile; 2023: 1,398
- Mobile population: 185,097
- Poverty rate: 18.9%
22. Knoxville, Tennessee

- Est. gun crime rate in Knoxville; 2023: 76.9 for every 10,000 people
- Total firearms traced by the ATF in Knoxville; 2023: 1,490
- Knoxville population: 193,721
- Poverty rate: 20.5%
21. Cincinnati, Ohio

- Est. gun crime rate in Cincinnati; 2023: 76.9 for every 10,000 people
- Total firearms traced by the ATF in Cincinnati; 2023: 2,383
- Cincinnati population: 309,595
- Poverty rate: 24.5%
20. New Orleans, Louisiana

- Est. gun crime rate in New Orleans; 2023: 77.5 for every 10,000 people
- Total firearms traced by the ATF in New Orleans; 2023: 2,915
- New Orleans population: 376,035
- Poverty rate: 22.6%
19. Southaven, Mississippi

- Est. gun crime rate in Southaven; 2023: 77.9 for every 10,000 people
- Total firearms traced by the ATF in Southaven; 2023: 433
- Fort Myers population: 55,531
- Poverty rate: 12.3%
18. Fort Myers, Florida

- Est. gun crime rate in Fort Myers; 2023: 78.2 for every 10,000 people
- Total firearms traced by the ATF in Fort Myers; 2023: 717
- Fort Myers population: 91,730
- Poverty rate: 16.8%
17. Atlanta, Georgia

- Est. gun crime rate in Atlanta; 2023: 81.7 for every 10,000 people
- Total firearms traced by the ATF in Atlanta; 2023: 4,080
- Atlanta population: 499,287
- Poverty rate: 17.9%
16. Birmingham, Alabama

- Est. gun crime rate in Birmingham; 2023: 84.4 for every 10,000 people
- Total firearms traced by the ATF in Birmingham; 2023: 1,682
- Birmingham population: 199,322
- Poverty rate: 25.2%
15. Chino Hills, California

- Est. gun crime rate in Chino Hills; 2023: 85.4 for every 10,000 people
- Total firearms traced by the ATF in Chino Hills; 2023: 666
- Chino Hills population: 78,024
- Poverty rate: 6.9%
14. West Palm Beach, Florida

- Est. gun crime rate in West Palm Beach; 2023: 85.5 for every 10,000 people
- Total firearms traced by the ATF in West Palm Beach; 2023: 1,022
- West Palm Beach population: 119,508
- Poverty rate: 14.8%
13. Fargo, North Dakota

- Est. gun crime rate in Fargo; 2023: 86.3 for every 10,000 people
- Total firearms traced by the ATF in Fargo; 2023: 1,114
- Fargo population: 129,064
- Poverty rate: 12.8%
12. Memphis, Tennessee

- Est. gun crime rate in Memphis; 2023: 91.6 for every 10,000 people
- Total firearms traced by the ATF in Memphis; 2023: 5,760
- Memphis population: 629,063
- Poverty rate: 22.5%
11. Flint, Michigan

- Est. gun crime rate in Flint; 2023: 93.0 for every 10,000 people
- Total firearms traced by the ATF in Flint; 2023: 752
- Flint population: 80,835
- Poverty rate: 34.4%
10. Greenville, North Carolina

- Est. gun crime rate in Greenville; 2023: 95.9 for every 10,000 people
- Total firearms traced by the ATF in Greenville; 2023: 849
- Greenville population: 88,540
- Poverty rate: 24.5%
9. Dayton, Ohio
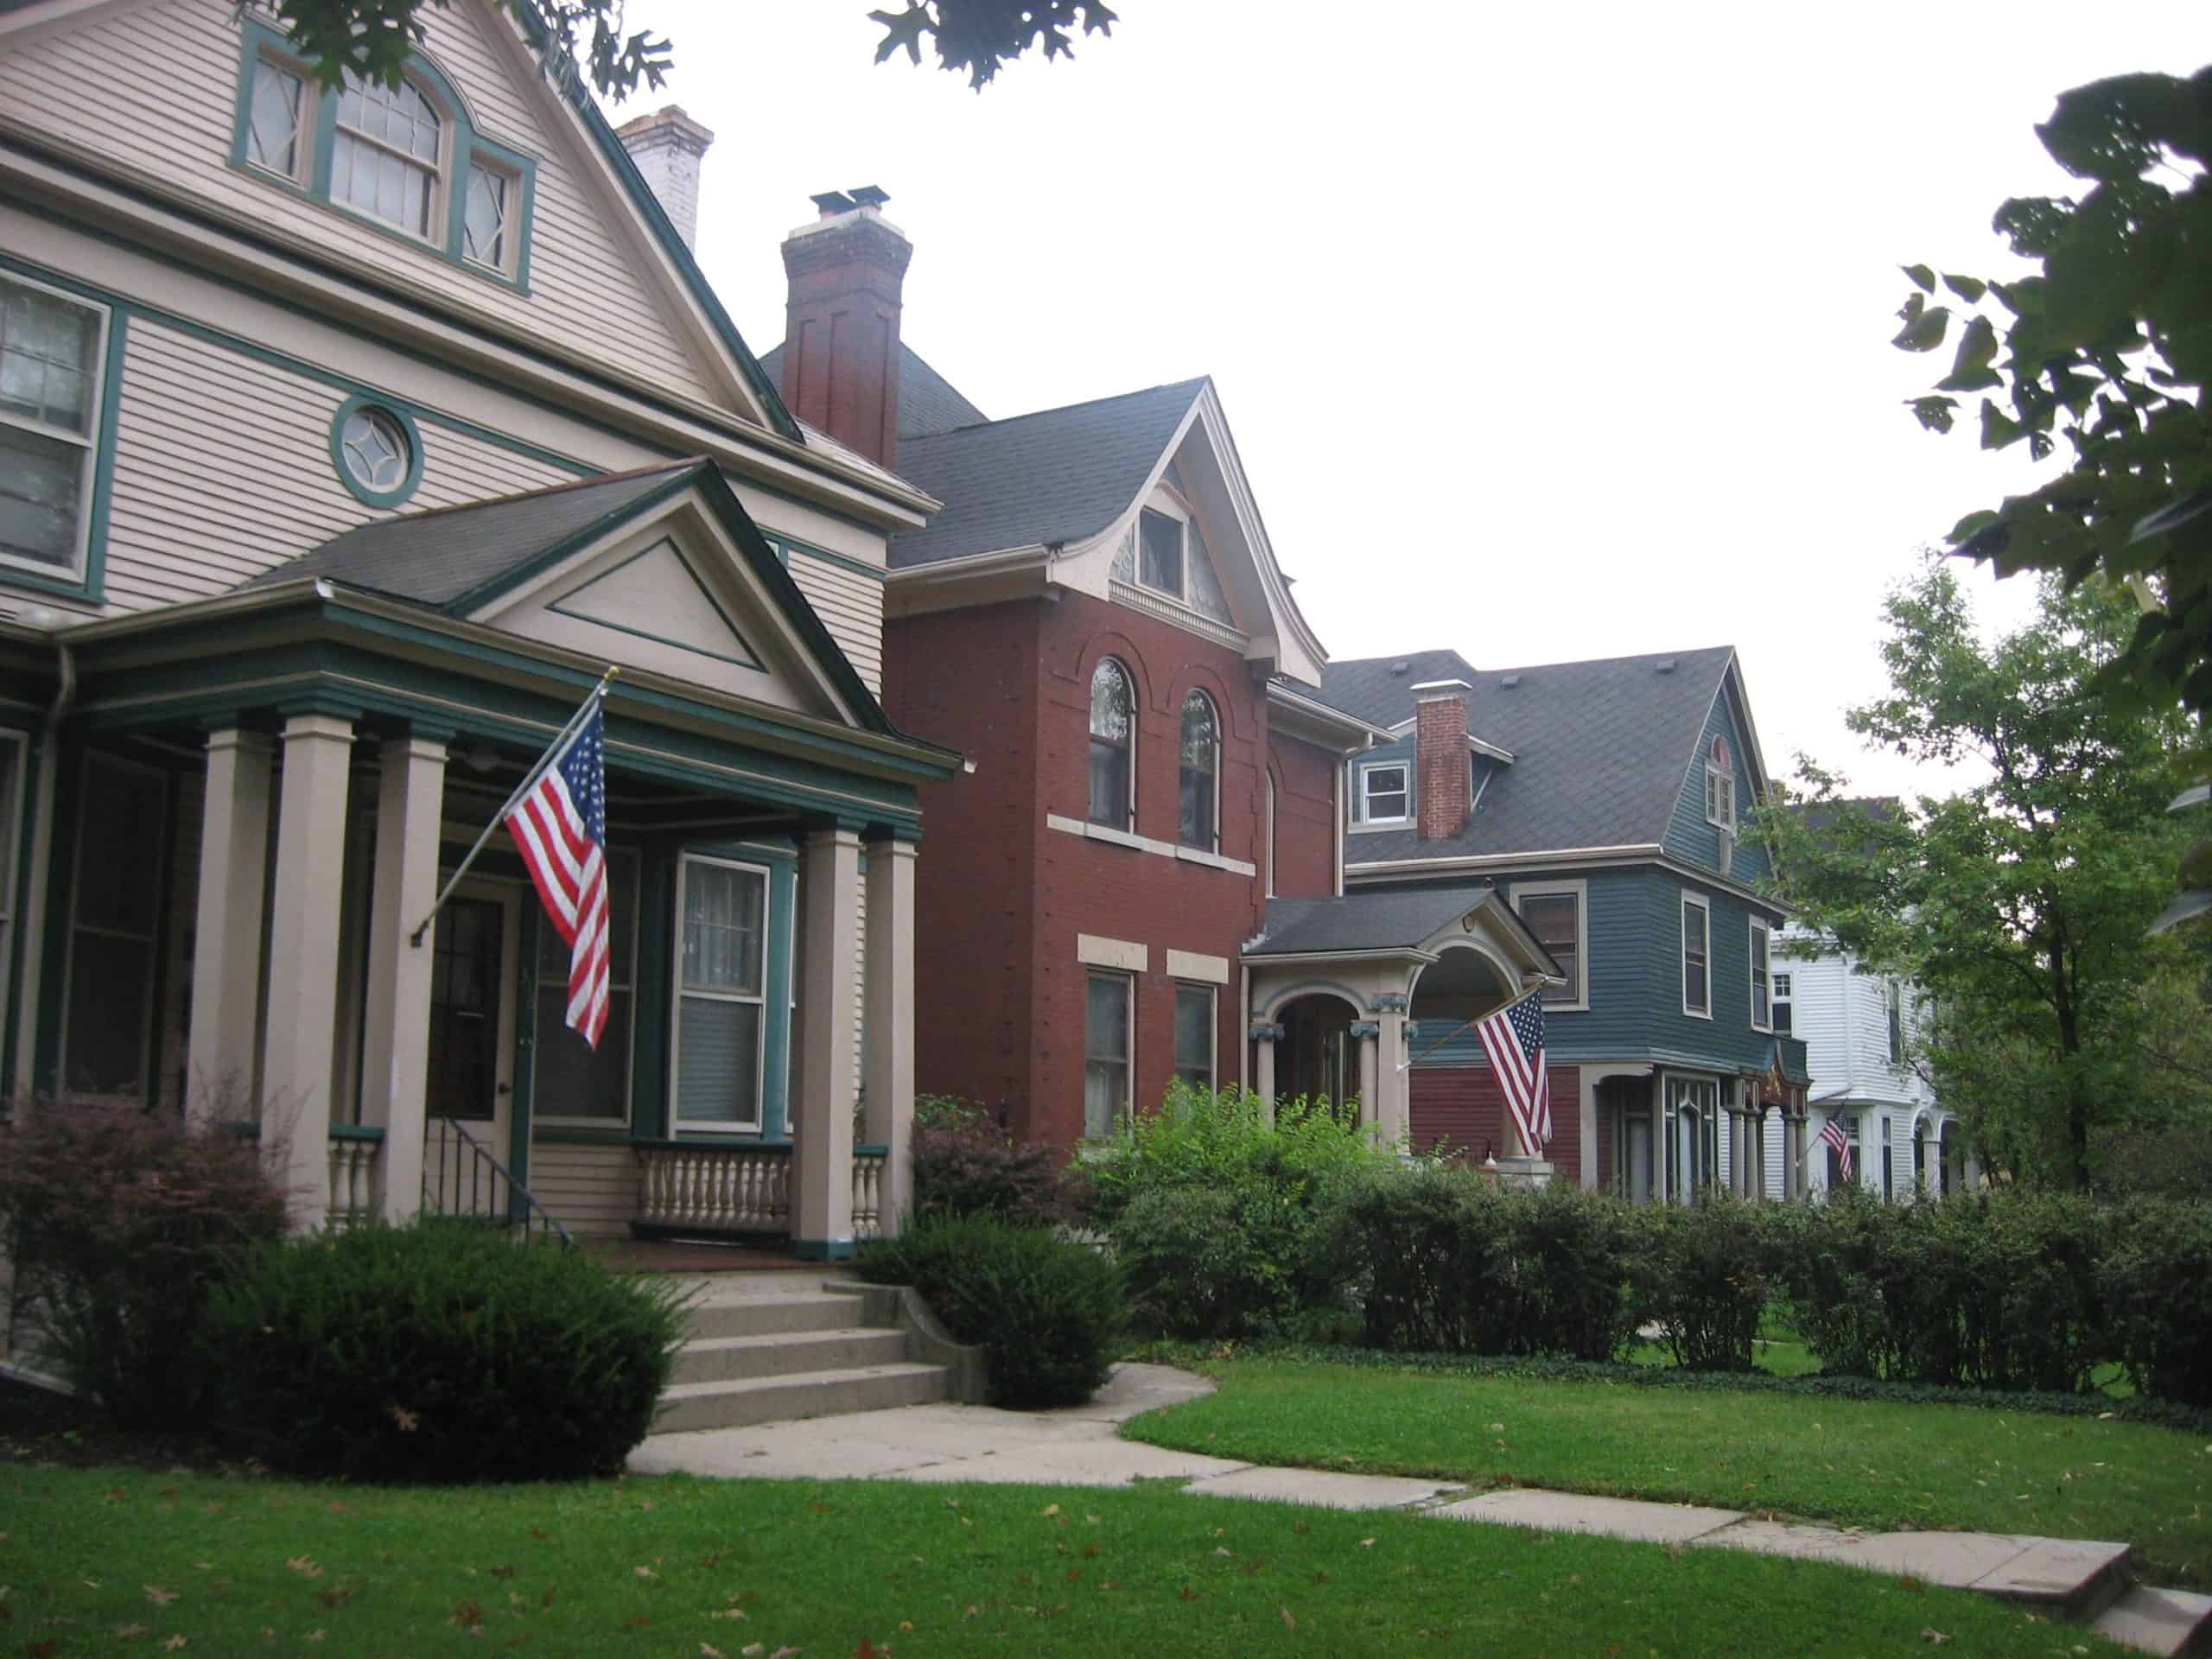
- Est. gun crime rate in Dayton; 2023: 96.8 for every 10,000 people
- Total firearms traced by the ATF in Dayton; 2023: 1,324
- Dayton population: 136,741
- Poverty rate: 27.1%
8. Detroit, Michigan

- Est. gun crime rate in Detroit; 2023: 97.4 for every 10,000 people
- Total firearms traced by the ATF in Detroit; 2023: 6,200
- Detroit population: 636,644
- Poverty rate: 31.5%
7. North Charleston, South Carolina

- Est. gun crime rate in North Charleston; 2023: 104.4 for every 10,000 people
- Total firearms traced by the ATF in North Charleston; 2023: 1,226
- North Charleston population: 117,460
- Poverty rate: 15.5%
6. Saint Louis, Missouri

- Est. gun crime rate in Saint Louis; 2023: 115.7 for every 10,000 people
- Total firearms traced by the ATF in Saint Louis; 2023: 3,392
- Saint Louis population: 293,109
- Poverty rate: 19.8%
5. Orlando, Florida

- Est. gun crime rate in Orlando; 2023: 122.6 for every 10,000 people
- Total firearms traced by the ATF in Orlando; 2023: 3,822
- Orlando population: 311,732
- Poverty rate: 15.5%
4. Muncie, Indiana

- Est. gun crime rate in Muncie; 2023: 137.7 for every 10,000 people
- Total firearms traced by the ATF in Muncie; 2023: 896
- Muncie population: 65,081
- Poverty rate: 29.6%
3. Columbia, South Carolina

- Est. gun crime rate in Columbia; 2023: 146.1 for every 10,000 people
- Total firearms traced by the ATF in Columbia; 2023: 2,080
- Columbia population: 142,416
- Poverty rate: 23.3%
2. Marietta, Georgia

- Est. gun crime rate in Marietta; 2023: 160.9 for every 10,000 people
- Total firearms traced by the ATF in Marietta; 2023: 1,010
- Marietta population: 62,769
- Poverty rate: 12.7%
1. Myrtle Beach, SC

- Est. gun crime rate in Myrtle Beach; 2023: 177.6 for every 10,000 people
- Total firearms traced by the ATF in Myrtle Beach; 2023: 705
- Myrtle Beach population: 39,697
- Poverty rate: 16.9%
The post Gun Tracing Data Revealed America’s Unexpected Gun Crime Capital appeared first on 24/7 Wall St..


