


Government Spending Is Out of Control! LOL
Calculation: BEA Table 3.1 Line 20 (Current Expenditures) divided by Table 1.1.5 Line 1 (GDP). Alternatively, Item #2 below divided by GDP. “If you torture data long enough, it will confess to anything.” –Ronald Coase Hey, it’s @TBPInvictus. Let’s delve into a case in point of Coase’s theorem: If you wanted to peddle… Read More The post Government Spending Is Out of Control! LOL appeared first on The Big Picture.
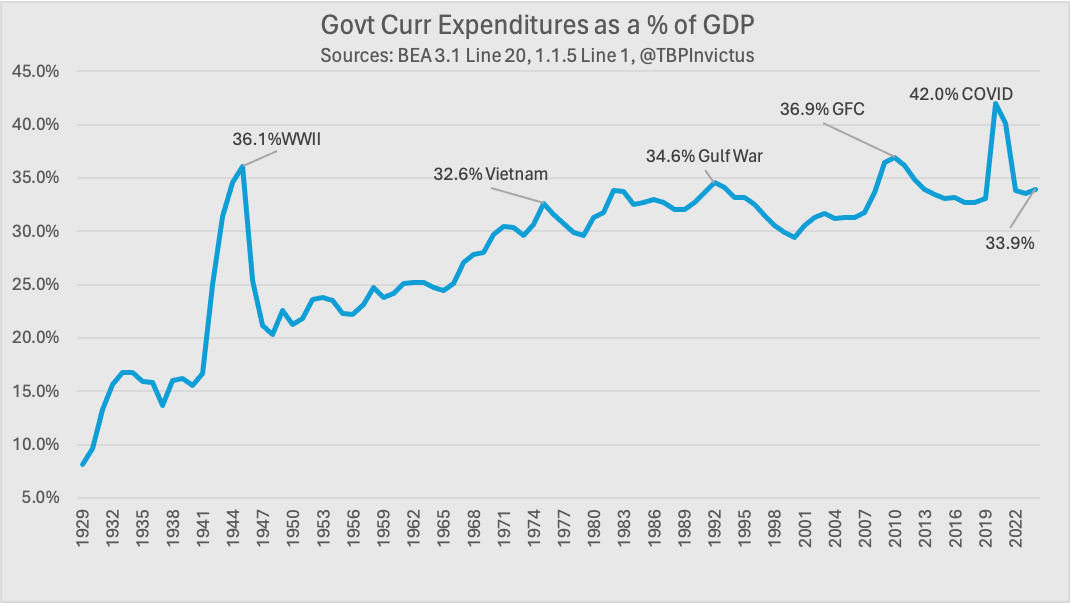
Calculation: BEA Table 3.1 Line 20 (Current Expenditures) divided by Table 1.1.5 Line 1 (GDP). Alternatively, Item #2 below divided by GDP.
“If you torture data long enough, it will confess to anything.” –Ronald Coase
Hey, it’s @TBPInvictus. Let’s delve into a case in point of Coase’s theorem:
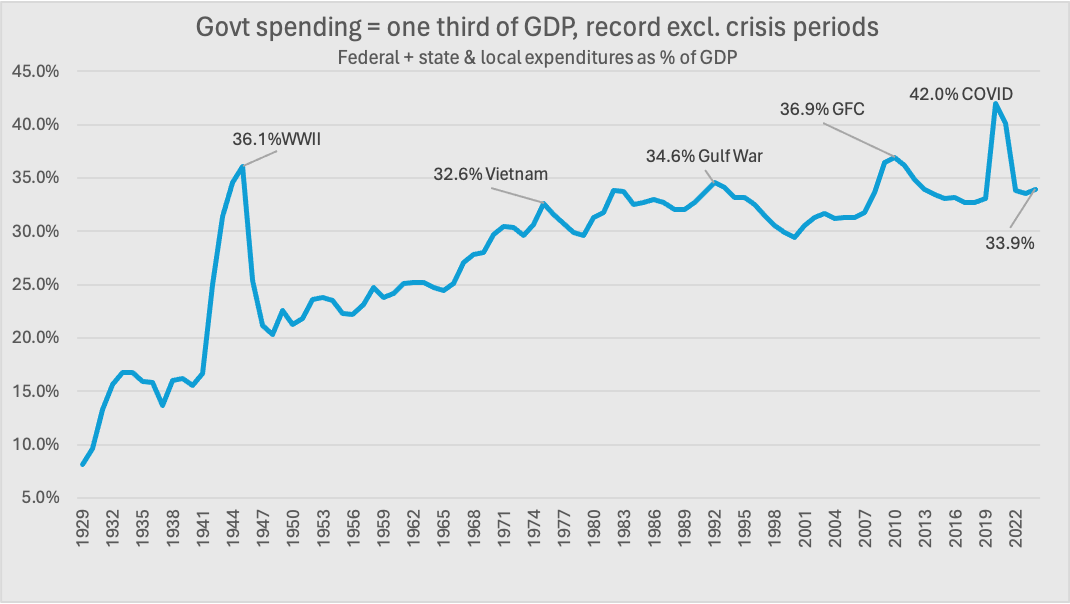
If you wanted to peddle the narrative that government spending is out of control, you might present a chart like the one above, which is an exact replica of a chart that appeared recently in a piece of research from a major Wall St. investment firm. I have painstakingly replicated it instead of doing a copy and paste so as to avoid directly identifying the offending firm (for reasons that will become apparent).
After looking at that chart, you’d be forgiven for believing that government spending was out of control. 34% of GDP during a period of relative stability! As high now as during the Gulf War, higher than during Vietnam, and damn near as high as World War II. How can this be? Maybe my animus toward DOGE is misplaced.
The text accompanying that chart reads: “Consumption: in 2024, one third of GDP came from government spending, a record high excluding periods of war or crisis; this was financed by 6-7% budget deficits, another unwelcome peacetime record.”
It goes without saying that politics should have no place in any reputable firm’s Research department (see Why Politics and Investing do not mix). That has been the case over decades of reading everything. And it is possible that this is an honest error because, after all, there’s a ton of data out there and it’s very easy to make an occasional mistake. Been there, done that.
~~~
Now, on the other hand, what might you think about government spending if you saw the chart below:
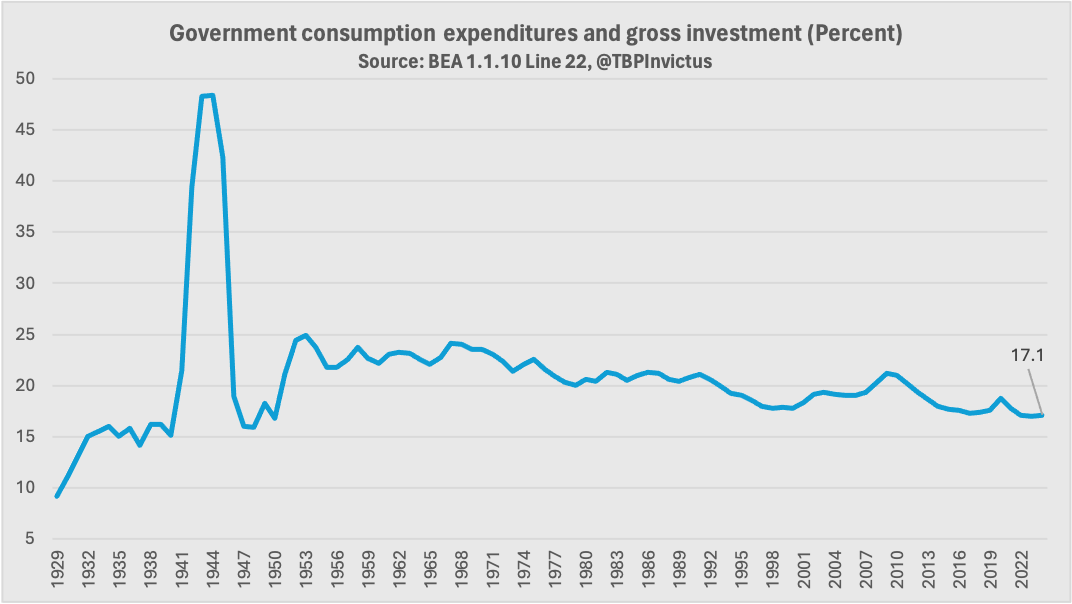
Alternatively, Item #1 below divided by GDP, as it should be properly be done to focus on consumption and investment.
You would probably think government spending is not, in fact, out of control and DOGE may just be a big waste of time (or serving some other purpose).
As Paul Krugman recently wrote on his excellent Substack, using a chart identical to the one immediately above (Paul used FRED):
“People may imagine that government is a bigger part of the economy than it is because of all the money we spend supporting retired Americans, covering their health bills, and so on [Chart 1]. But that kind of spending isn’t counted as part of GDP — the total value of goods and services produced in America — because Social Security and other benefits are simply transfers of income between Americans. Only spending by Social Security recipients counts toward GDP. The only government spending that directly affects GDP — the spending Bessent says needs to fall — is spending that directly buys goods and services.” [Chart 2].
What is the difference between the two charts? Which one is telling us the truth?
The first chart is incorrect and terribly misleading, and here’s why: The denominator of both charts is GDP. The difference lies with the numerator. The scary (top) chart has as its numerator Current Expenditures, BEA Table 3.1, Line 20, currently $9.9071 trillion. Divided by current GDP of $29.1838 million gives us a quotient of 33.9%. Here’s the problem with that: That $9.9071 trillion numerator is way, way over-inflated for the stated claim, i.e. “consumption.” By about 2x over-inflated. BEA has an excellent FAQ on government spending that resides here. It breaks down government spending as follows (emphasis mine): Government consumption expenditures and gross investment: This is a measure of government spending on goods and services that are included in GDP. Consumption expenditures include what government spends on its work force and for goods and services, such as fuel for military jets and rent for government buildings and other structures. Gross investment includes what government spends on structures, equipment, and software, such as new highways, schools, and computers. Government current expenditures: Total spending by government is much larger than the spending included in GDP. Current expenditures measures all spending by government on current-period activities, and consists not only of government consumption expenditures, but also current transfer payments, interest payments, and subsidies (and removes wage accruals less disbursements). Payments such as transfer payments and interest payments are excluded from the calculation of GDP because these payments do not represent purchases of goods and services, though income from transfer and interest payments may fund consumption expenditures or investment in other sectors of the economy. Total government expenditures: In addition to the transactions that are included in current expenditures, this measure includes gross investment (as defined earlier), and other capital-type expenditures that affect future-period activities, such as capital transfer payments and net purchases of nonproduced assets (for example, land). Total expenditures exclude consumption of fixed capital (CFC), which is a noncash charge.
The $9.9071 trillion numerator includes “current transfer payments, interest payments, and subsidies (and removes wage accruals less disbursements),” none of which belong when analyzing “Consumption.”
“Transfer Payments,” for the uninitiated, include such things as Social Security benefits. The more appropriate number — Gov’t Consumption Expenditures and Gross Investment — is $4.9893T ($4.9893/$29.1838 = 17.1%). Both the Wall St. shop involved and Scott Bessent surely know this, but the second chart is useless in advancing a government-spending-is-out-of-control-and-DOGE-will-put-an-end-to-it narrative.
Barry likes to remind us of the great Joan Robinson quote, and its utterly appropriate here:
“The purpose of studying economics is not to acquire a set of ready-made answers to economic questions, but to learn how to avoid being deceived by economists.”
Things are often not what they seem, and often not as you’re told. Pay attention.
The post Government Spending Is Out of Control! LOL appeared first on The Big Picture.