


Getting Around Is Getting More Expensive — Especially in These States
24/7 Wall St. Insights Americans spent $1,842 per capita on transportation services in 2023. Spending on travel varies widely from state to state, ranging from $851 to $2,805. While transportation spending correlates with overall cost of living, several outliers persist throughout the country. Also: Discover the next Nvidia From plane tickets to bus fare, the […] The post Getting Around Is Getting More Expensive — Especially in These States appeared first on 24/7 Wall St..

24/7 Wall St. Insights
- Americans spent $1,842 per capita on transportation services in 2023.
- Spending on travel varies widely from state to state, ranging from $851 to $2,805.
- While transportation spending correlates with overall cost of living, several outliers persist throughout the country.
- Also: Discover the next Nvidia
From plane tickets to bus fare, the cost of getting from Point A to Point B is climbing fast. Americans are spending more than ever on transportation services — and in some states, mobility comes at a much steeper price.
In 2023, Americans spent $616.6 billion on transportation services — like public transit, air travel, taxis, ride shares, trains, and intercity bus services — up 35.2% from 2018. Adjusted for population, Americans spent an average of $1,842 per capita on transportation services in 2023. Per capita transportation spending varies widely across the country, ranging from just $851 in the lowest spending state to $2,805 in the highest. A closer look at the data reveals the states where people spend the most on travel.
To determine the states spending the most on travel, 24/7 Wall St. reviewed data on personal consumption expenditures from the Bureau of Economic Analysis. States were ranked based on annual personal expenditure on transportation services per capita in 2023. Expenditure totals were adjusted for population using data from the U.S. Census Bureau.
50. West Virginia

- Personal transportation services expenditure, adjusted for population: $851 per capita
- Cost of living: -10.2% less than national average
- Total transportation services expenditure: $1.5 billion
- Total population: 1.8 million
- Other major spending categories: Health care, gasoline and other energy goods, groceries, motor vehicles and parts, financial services and insurance, housing and utilities
49. Arkansas
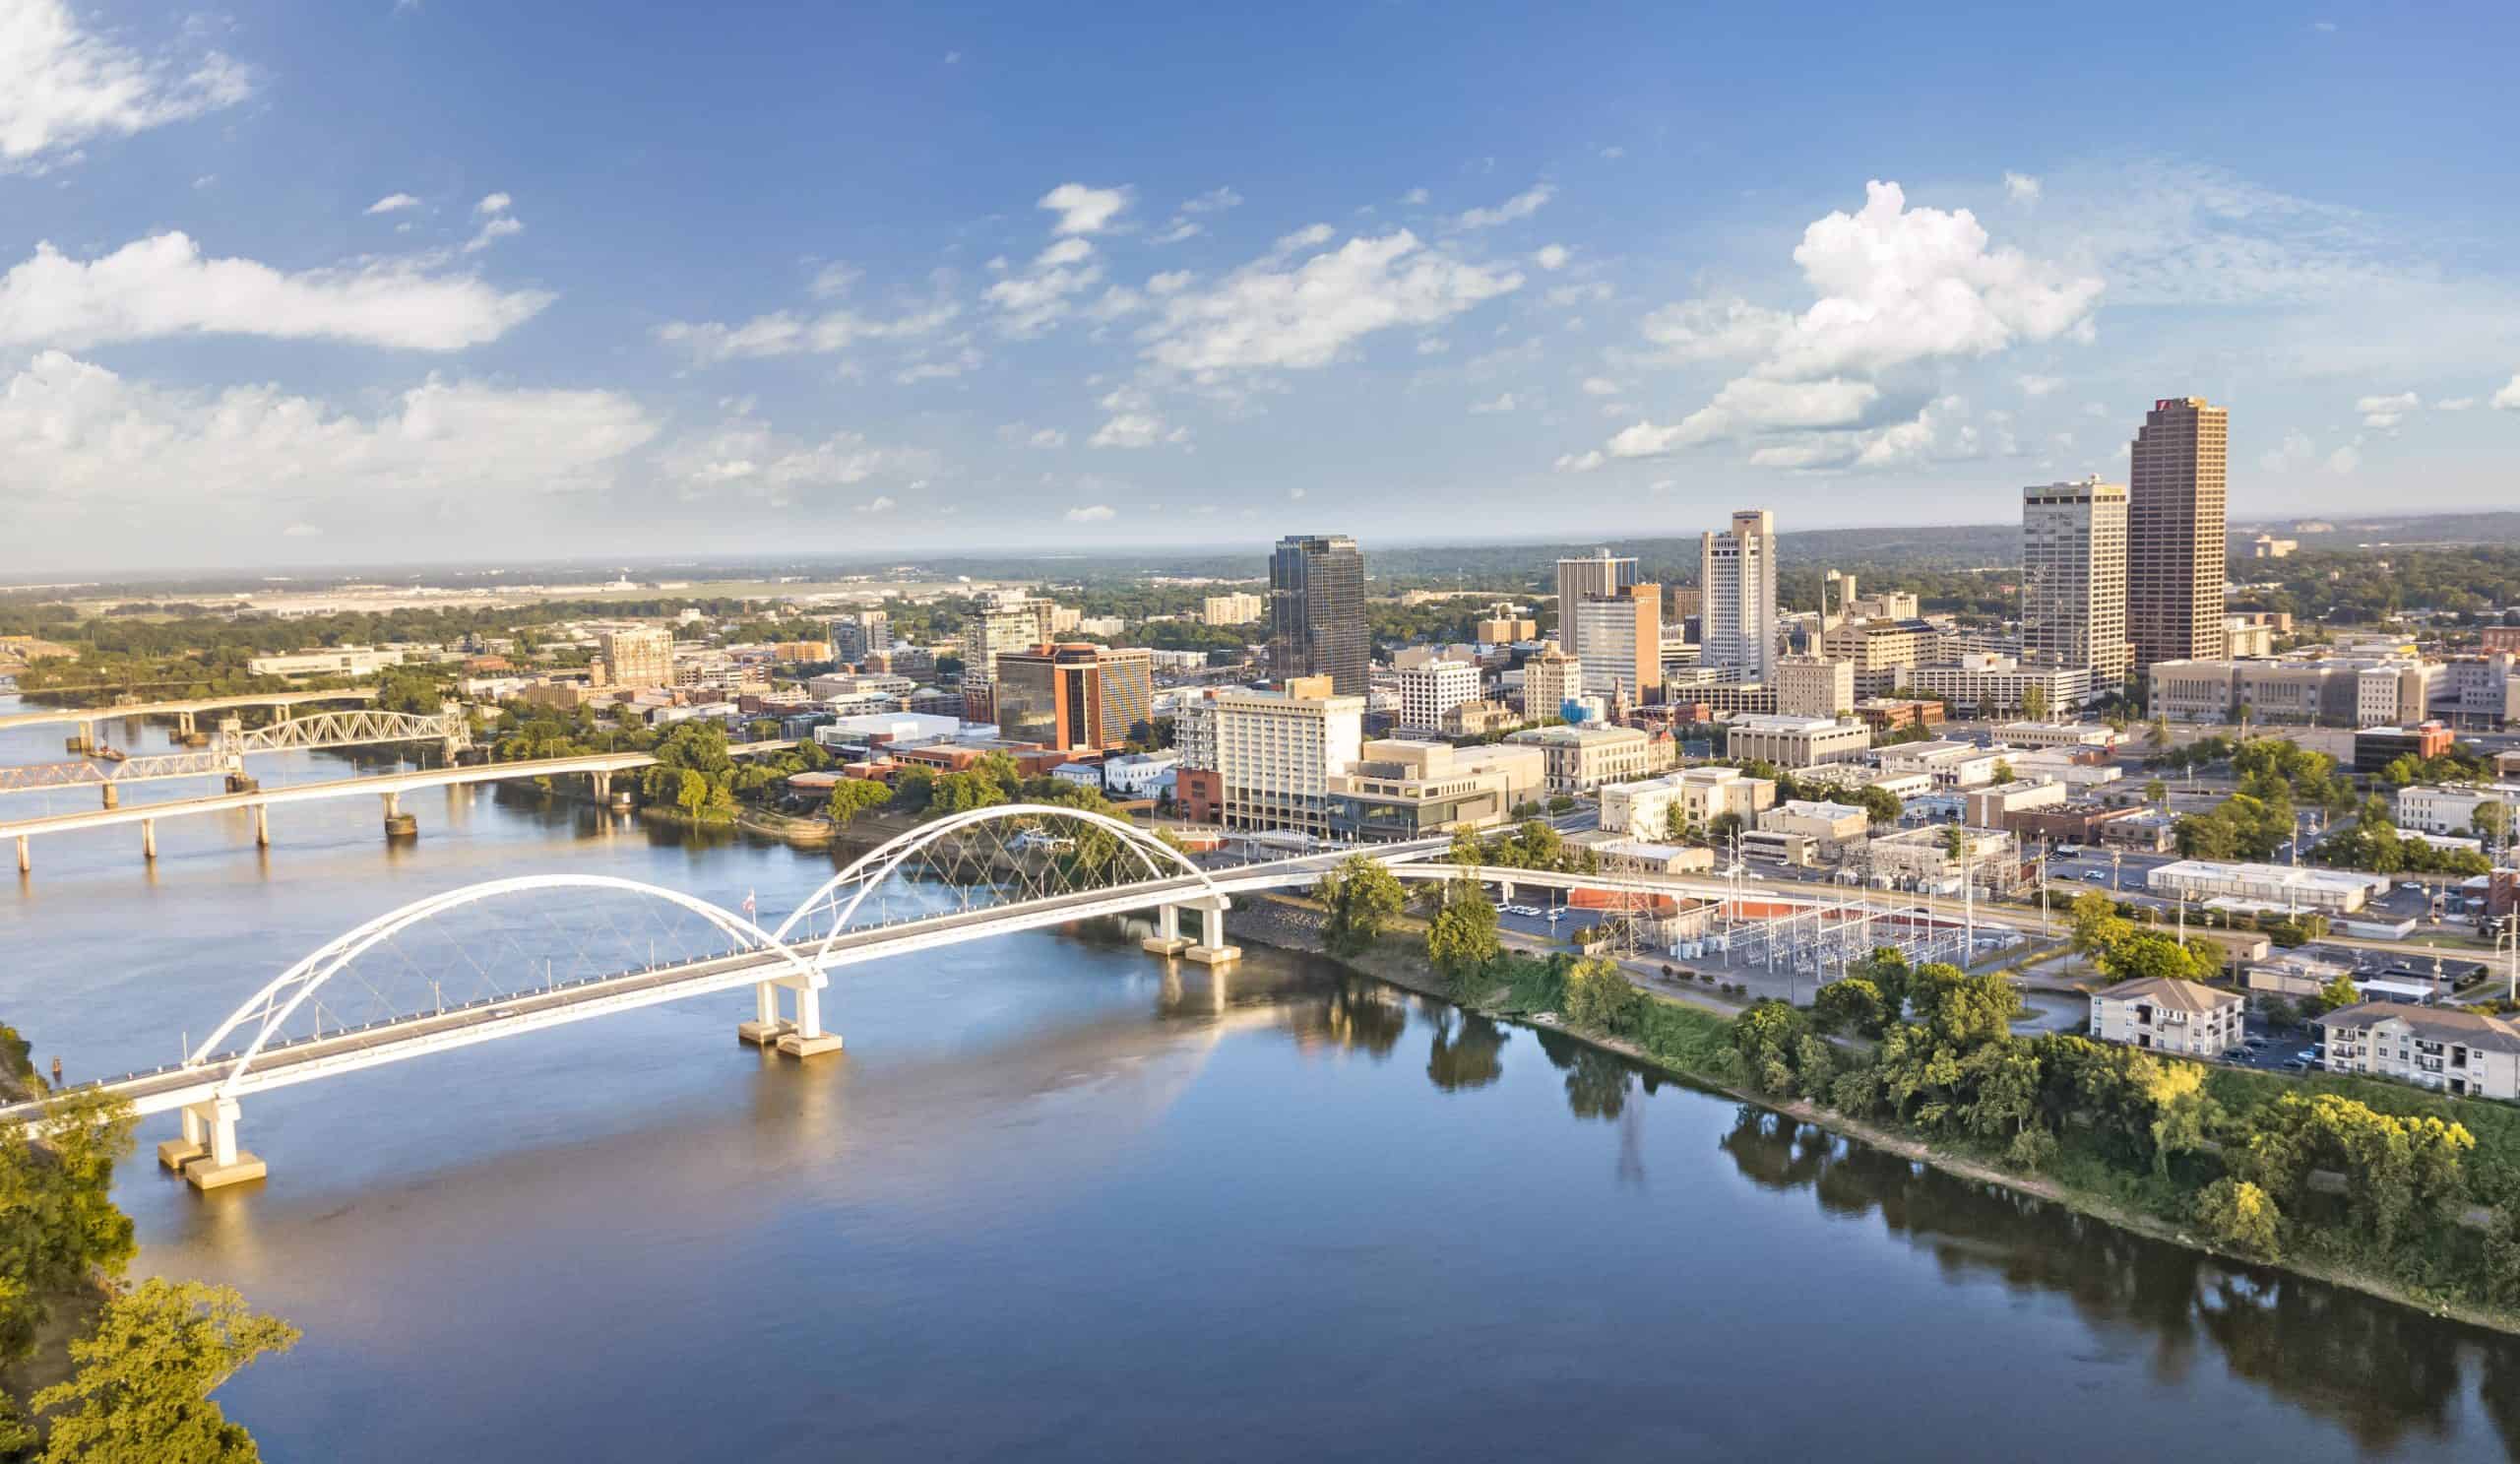
- Personal transportation services expenditure, adjusted for population: $988 per capita
- Cost of living: -13.5% less than national average
- Total transportation services expenditure: $3.0 billion
- Total population: 3.1 million
- Other major spending categories: Gasoline and other energy goods, financial services and insurance, clothing and footwear, furnishings and durable household equipment, recreational goods and vehicles, health care
48. Mississippi
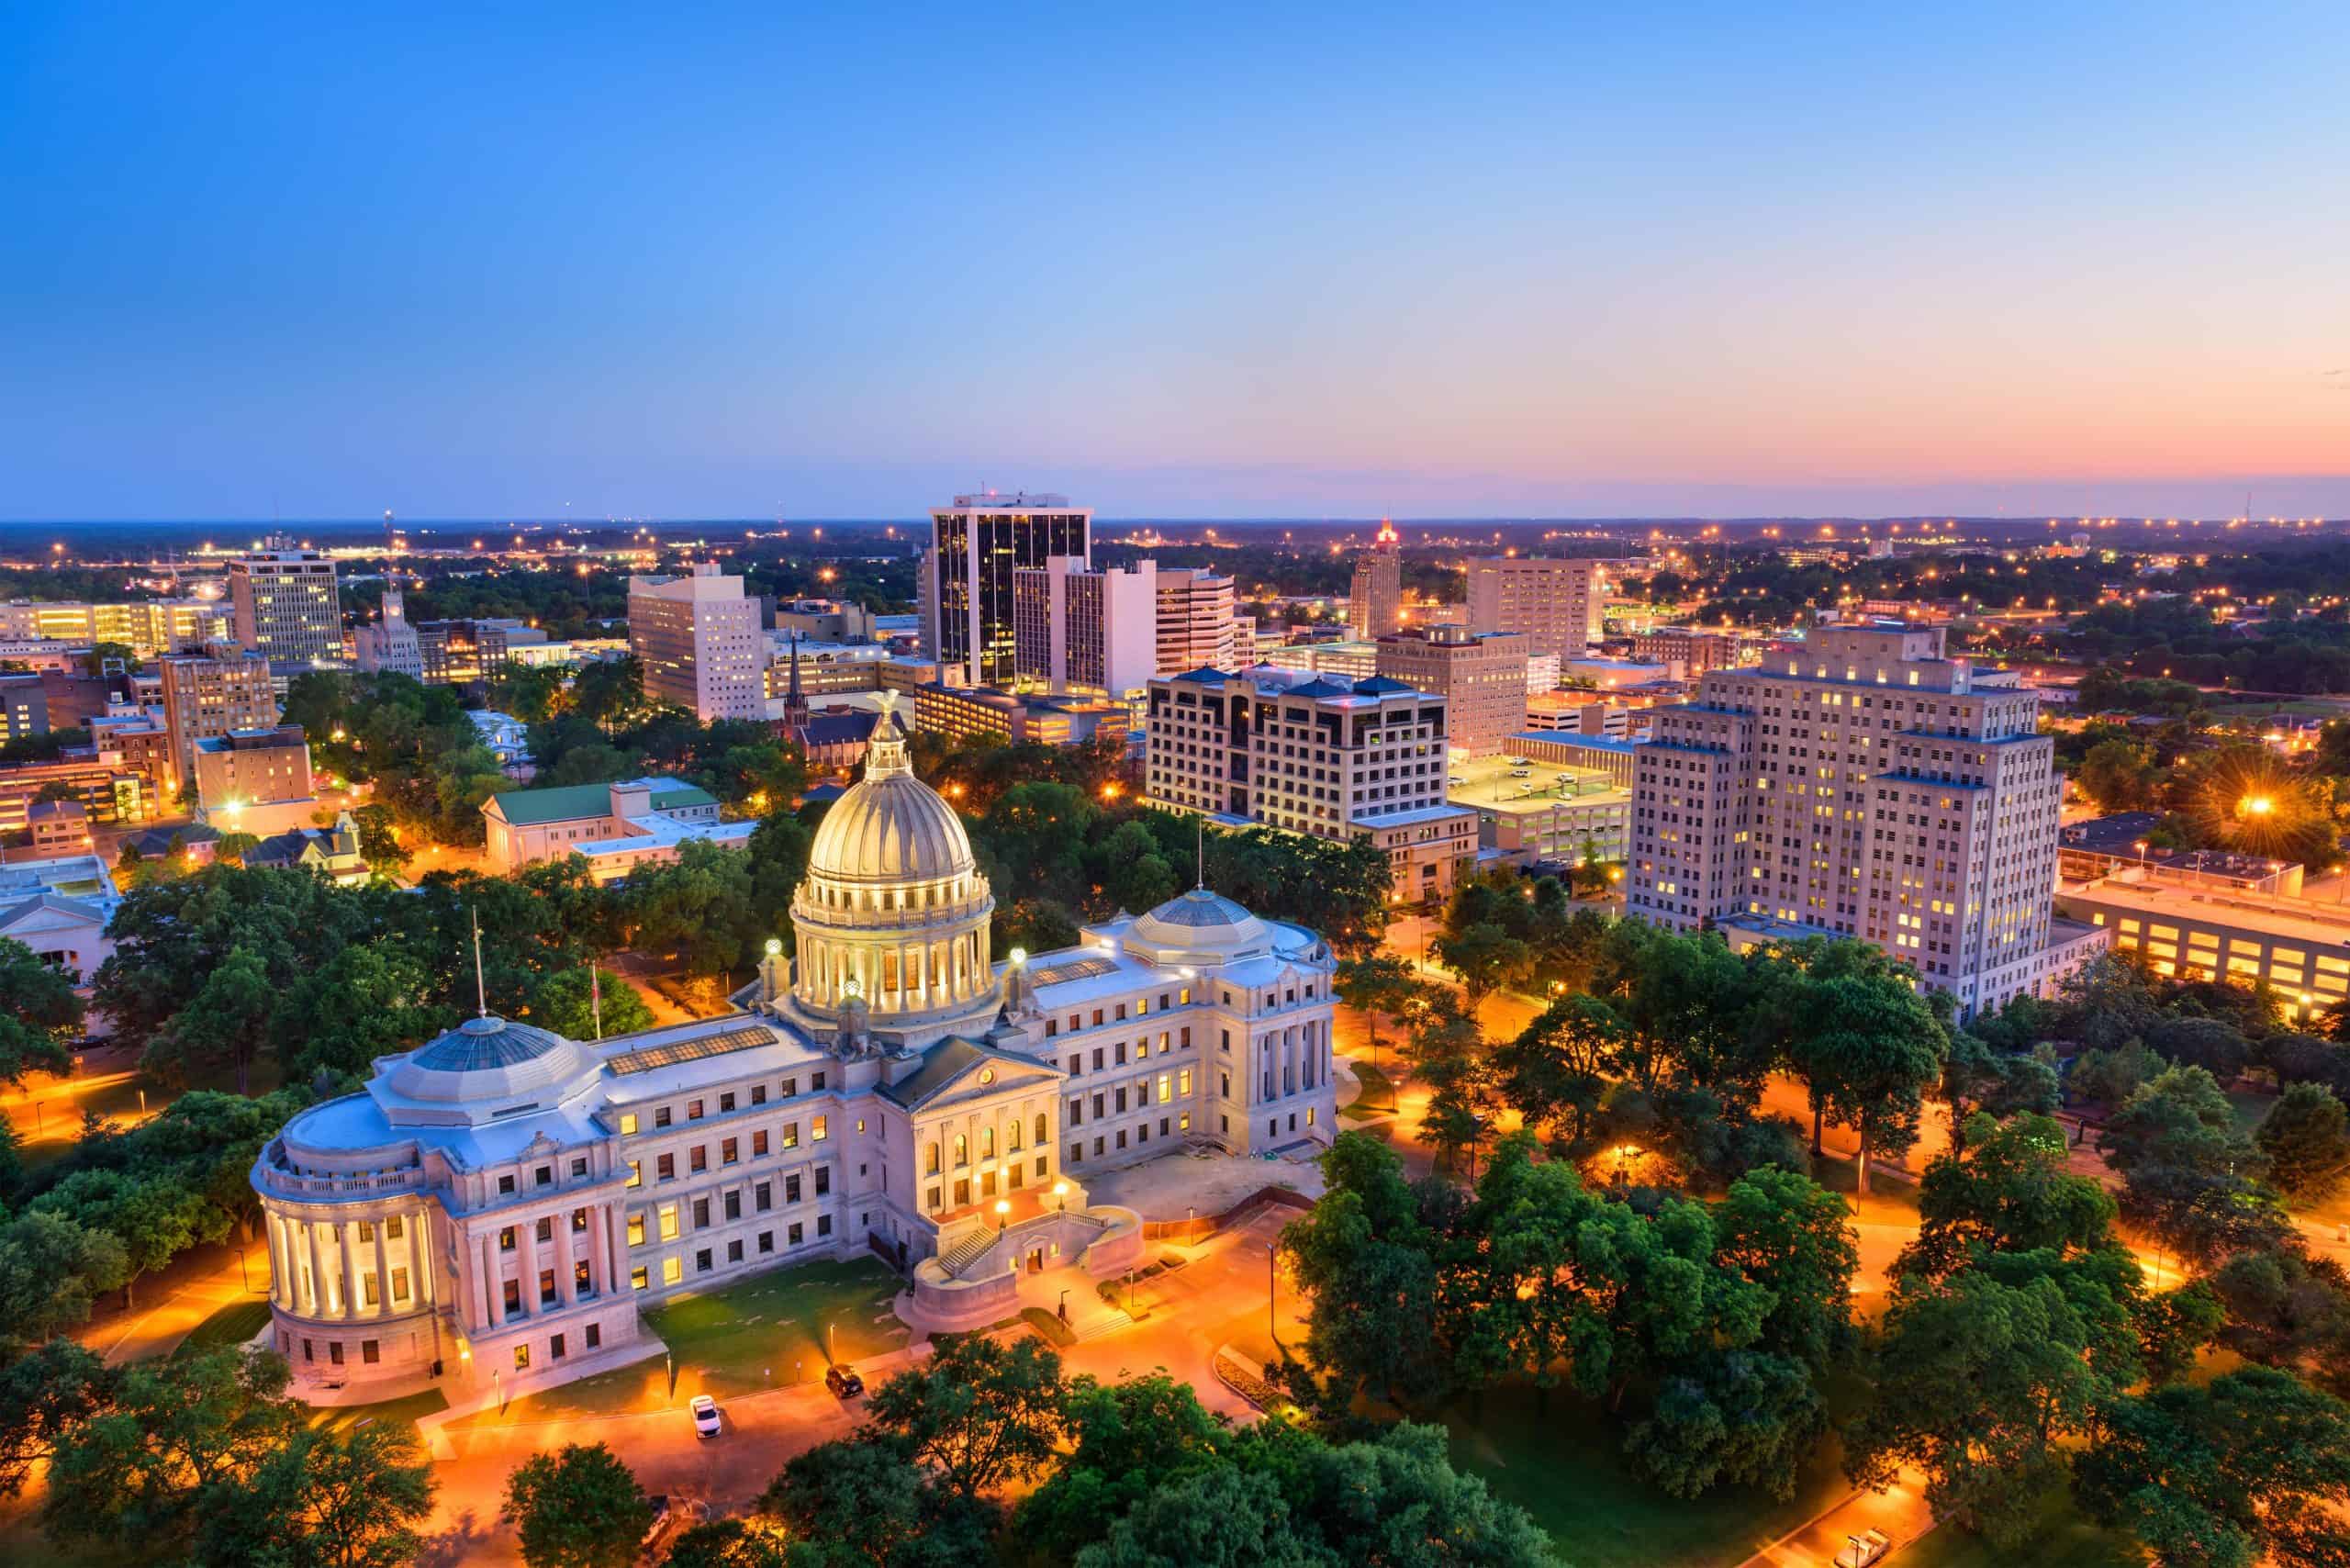
- Personal transportation services expenditure, adjusted for population: $1,018 per capita
- Cost of living: -12.7% less than national average
- Total transportation services expenditure: $3.0 billion
- Total population: 2.9 million
- Other major spending categories: Gasoline and other energy goods, clothing and footwear, motor vehicles and parts, groceries, health care, food services and accommodations
47. Alabama
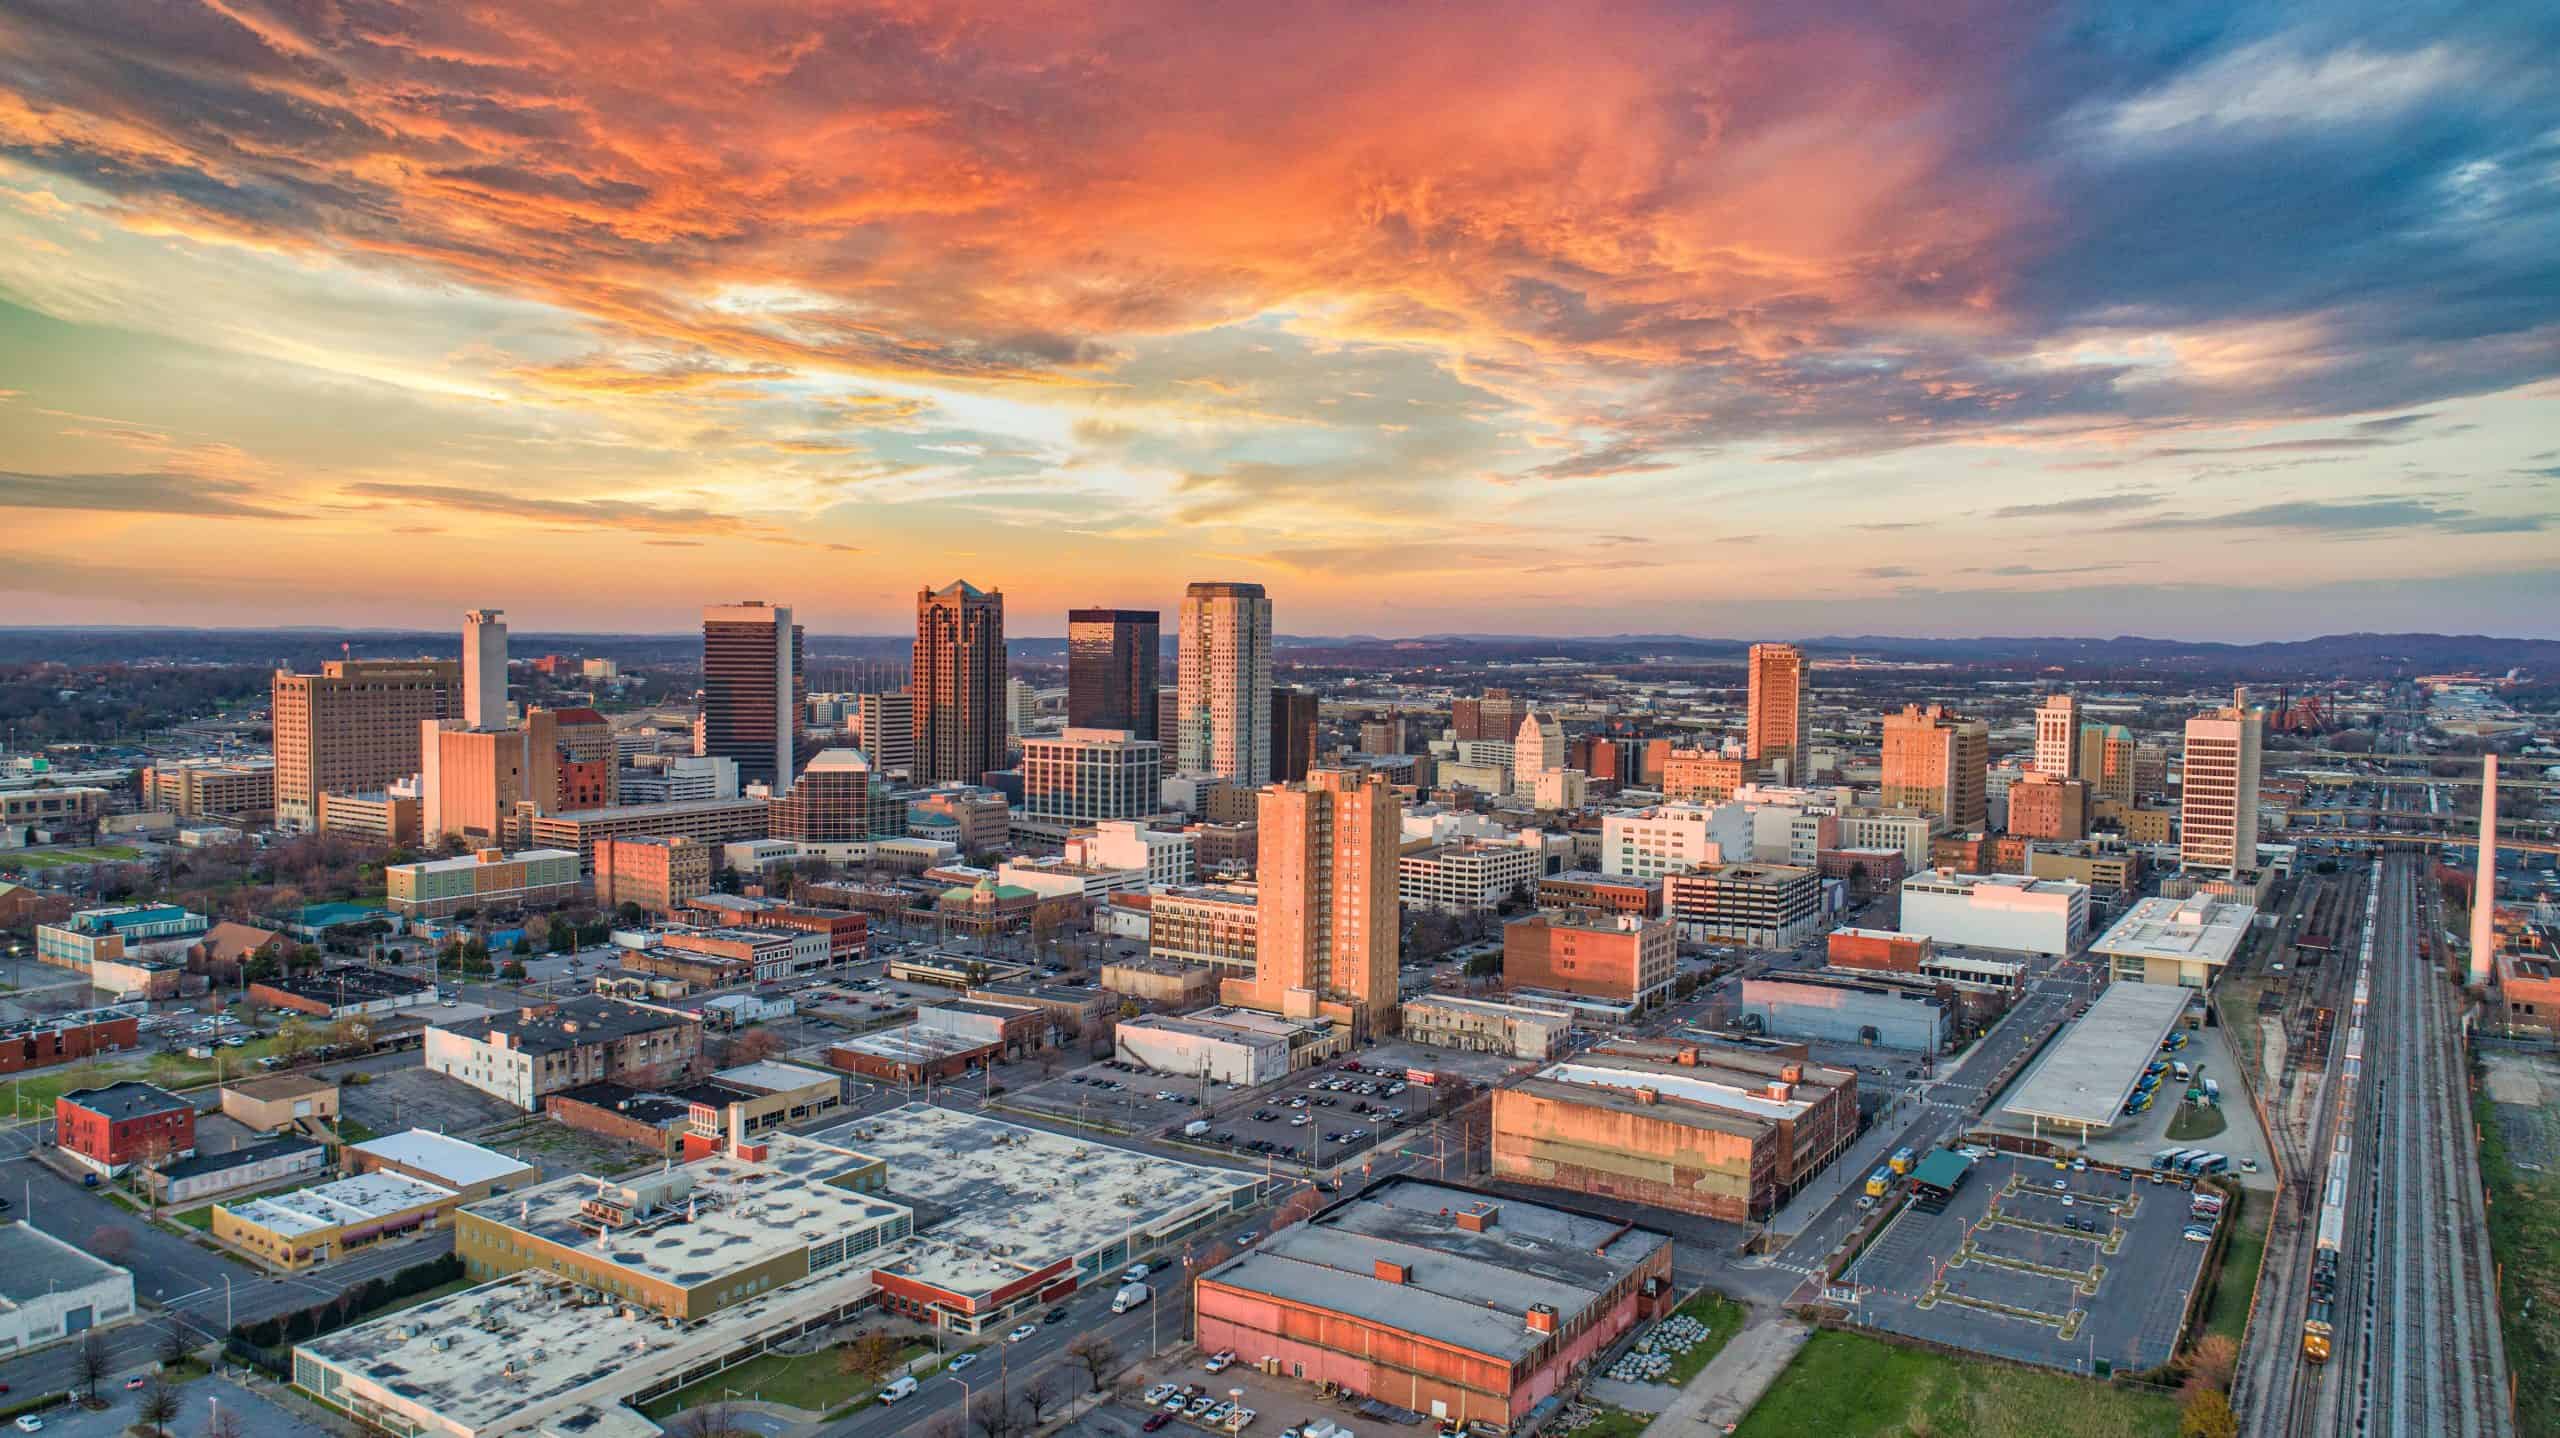
- Personal transportation services expenditure, adjusted for population: $1,073 per capita
- Cost of living: -10.0% less than national average
- Total transportation services expenditure: $5.5 billion
- Total population: 5.1 million
- Other major spending categories: Motor vehicles and parts, gasoline and other energy goods, clothing and footwear, recreational goods and vehicles, groceries, furnishings and durable household equipment
46. Louisiana
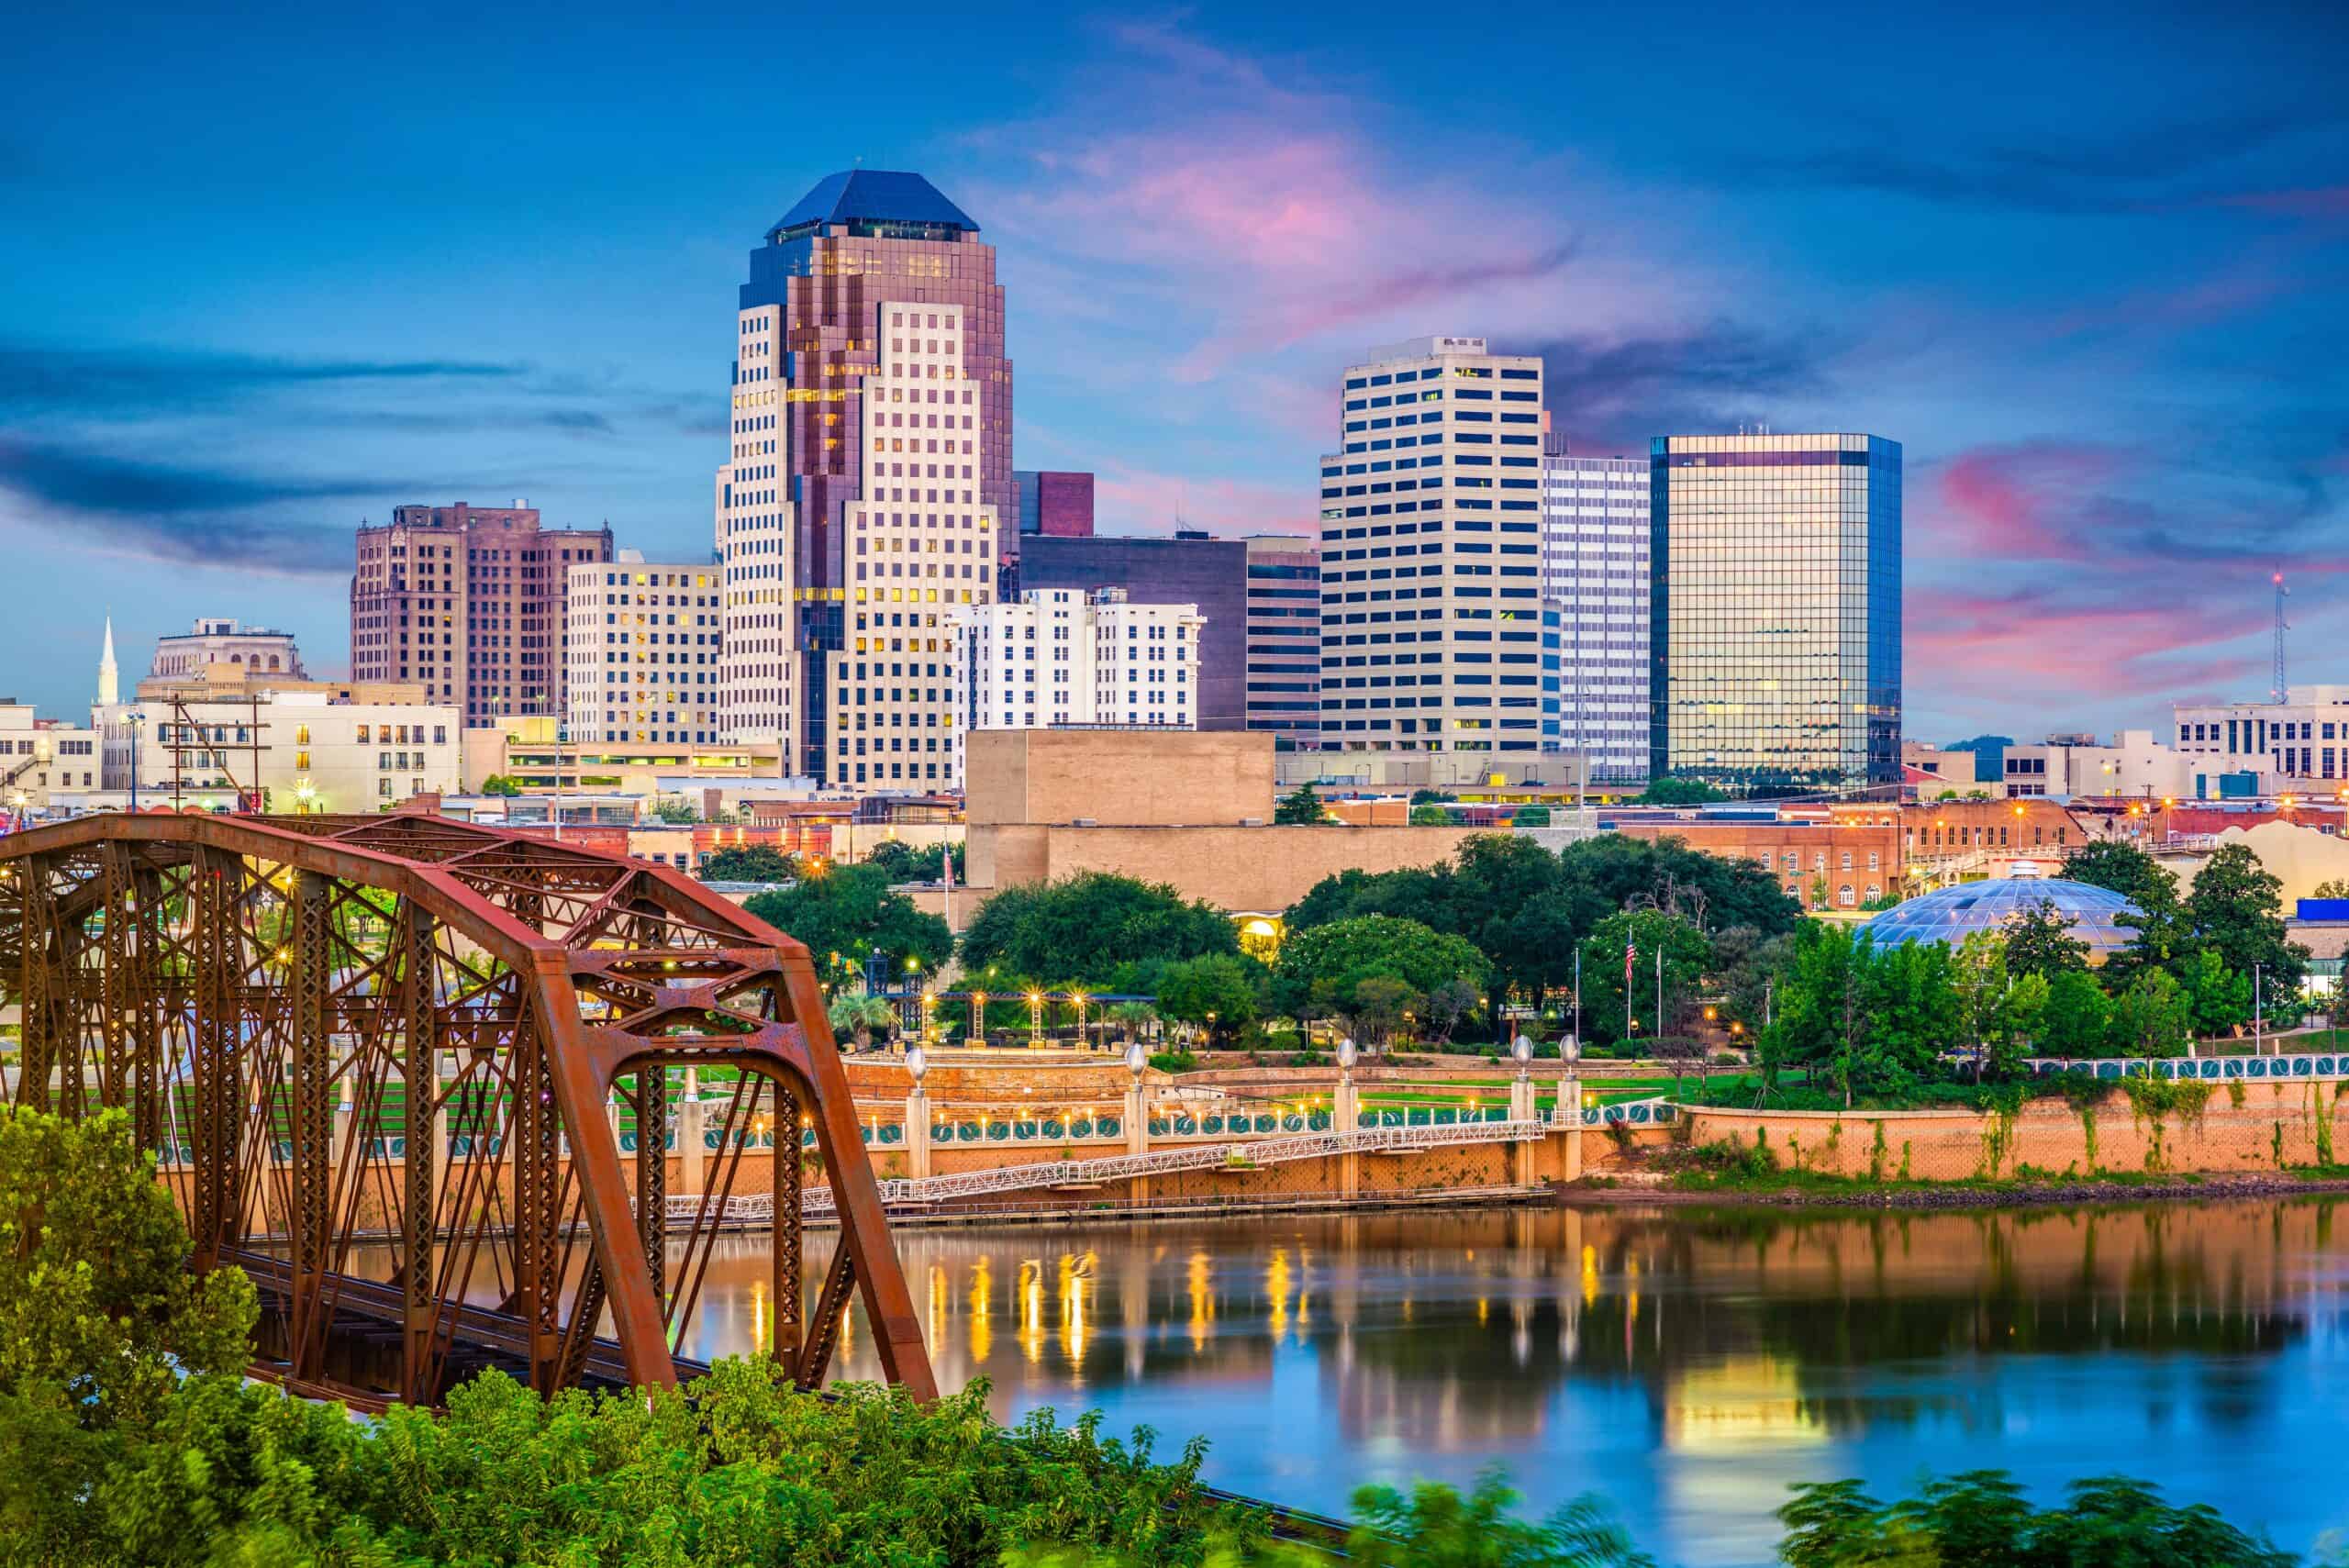
- Personal transportation services expenditure, adjusted for population: $1,086 per capita
- Cost of living: -11.7% less than national average
- Total transportation services expenditure: $5.0 billion
- Total population: 4.6 million
- Other major spending categories: Motor vehicles and parts, health care, gasoline and other energy goods, clothing and footwear, food services and accommodations, financial services and insurance
45. Kentucky
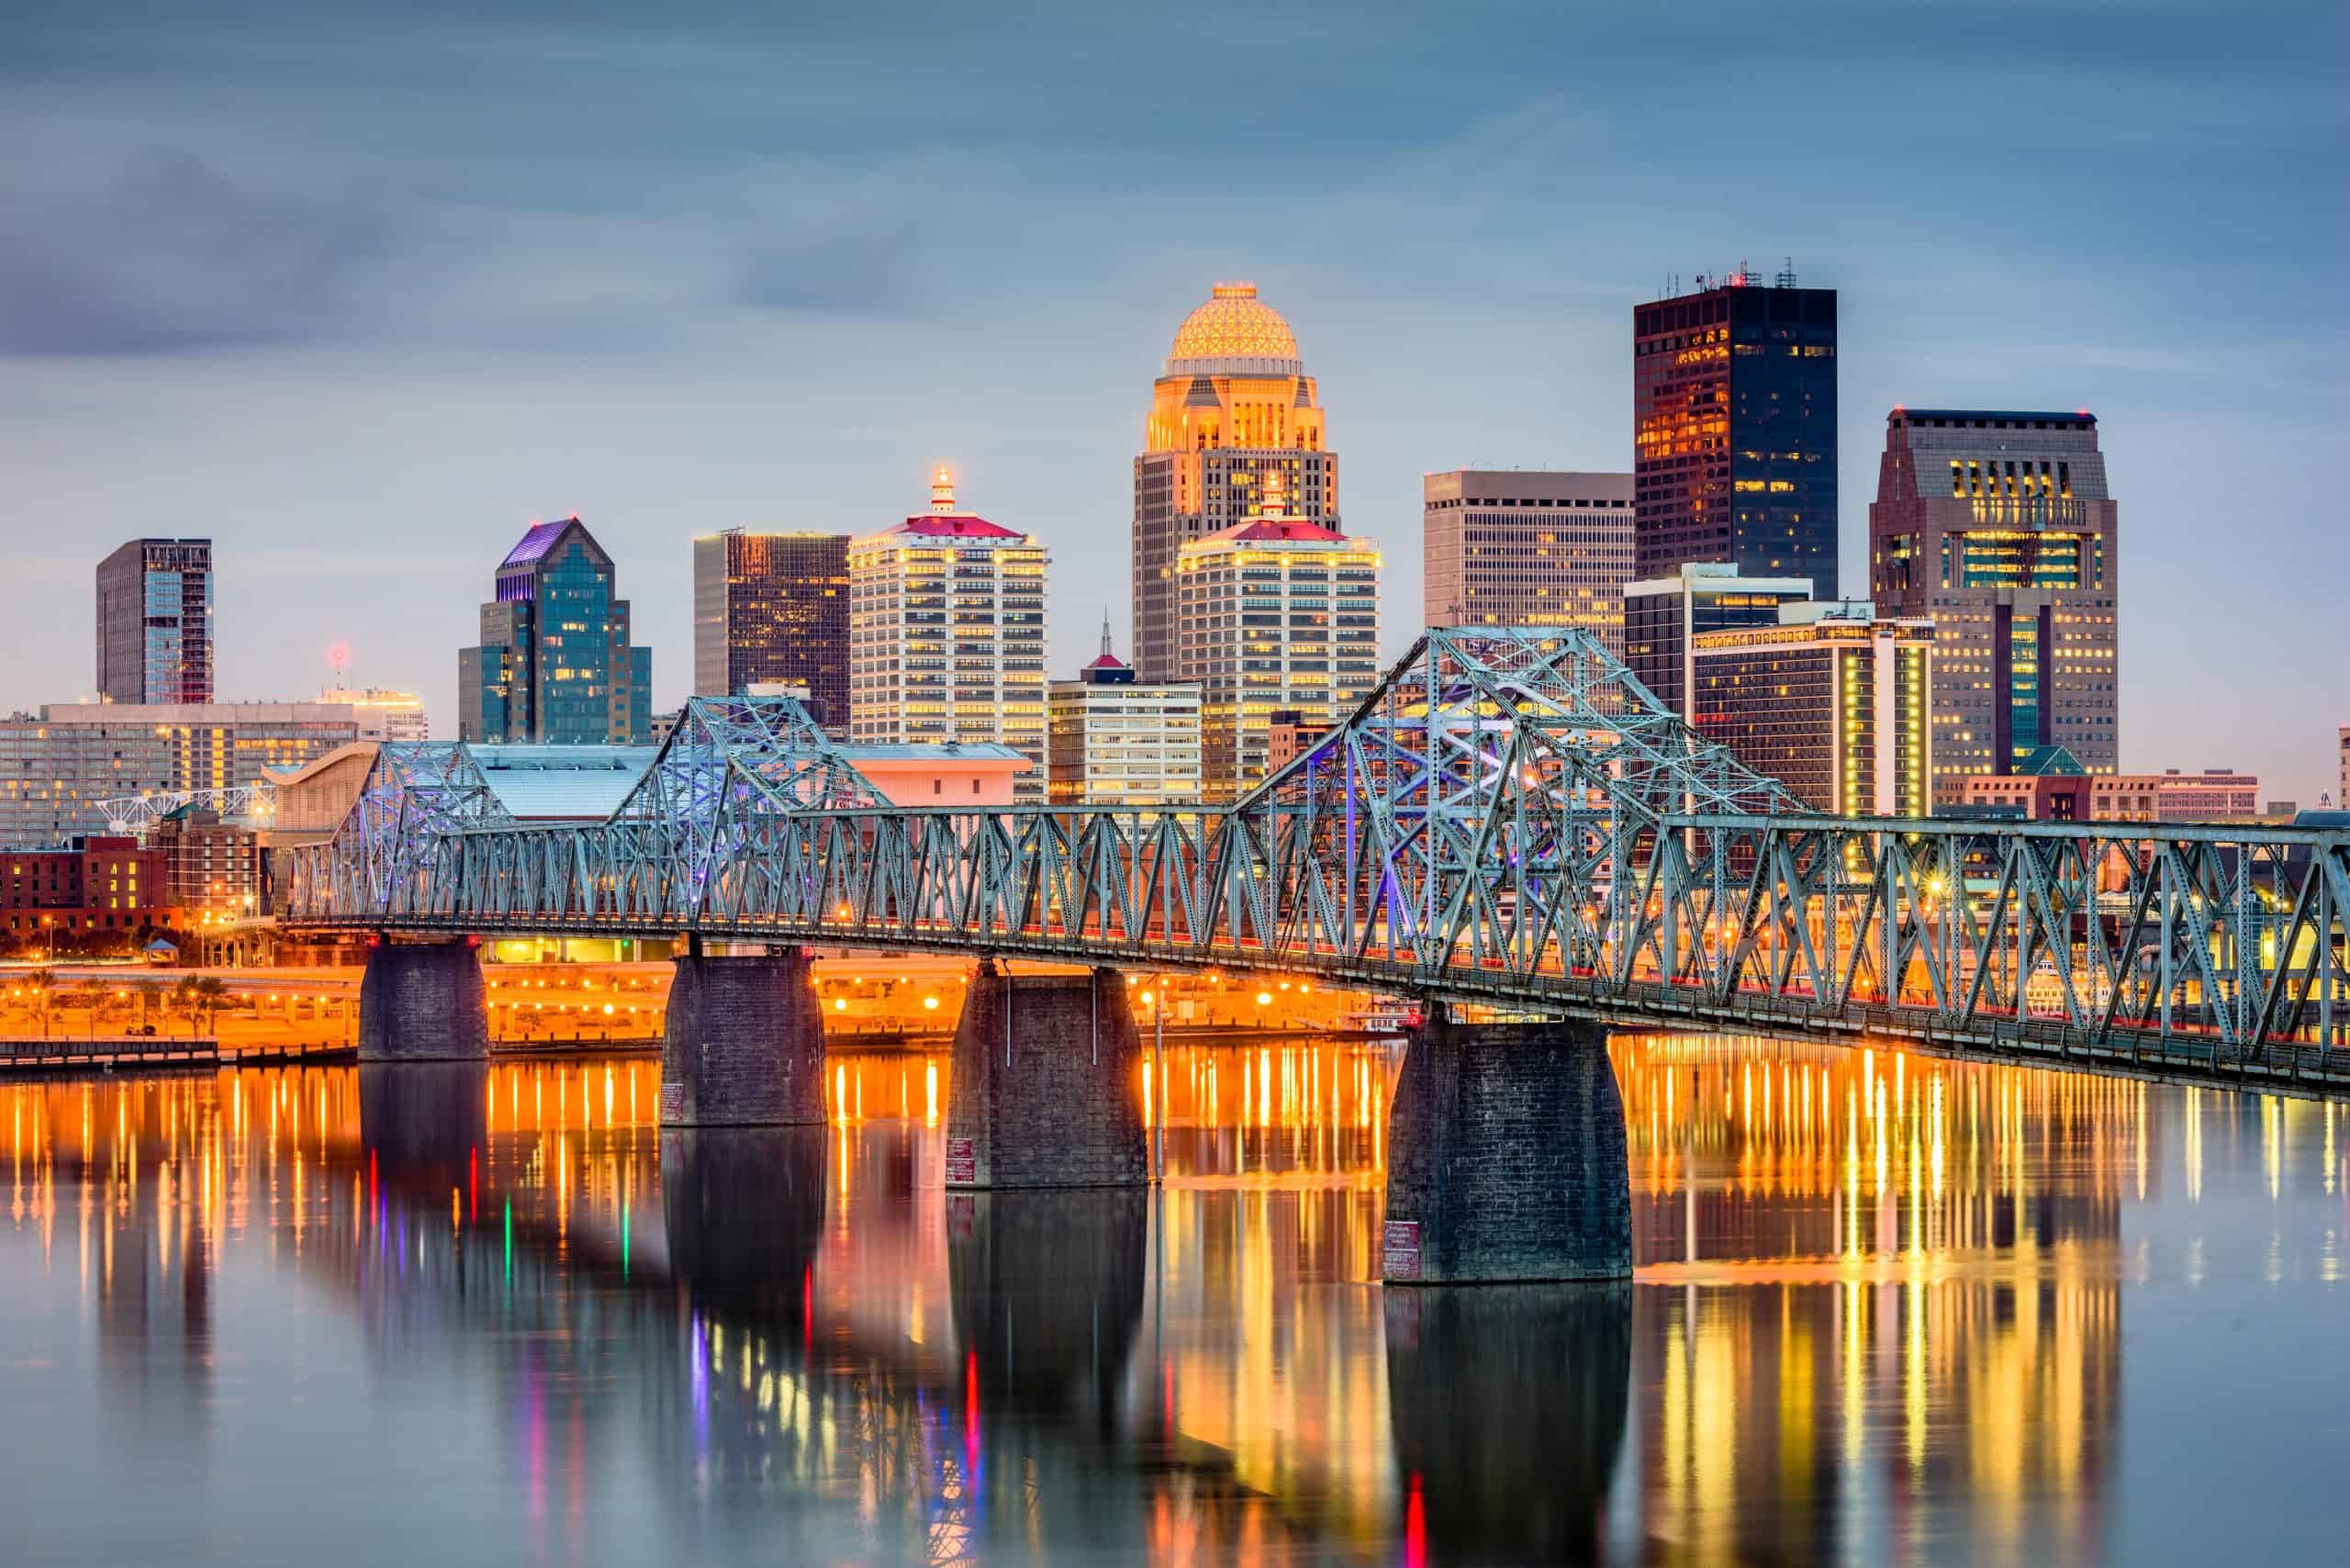
- Personal transportation services expenditure, adjusted for population: $1,126 per capita
- Cost of living: -9.5% less than national average
- Total transportation services expenditure: $5.1 billion
- Total population: 4.5 million
- Other major spending categories: Gasoline and other energy goods, health care, groceries, motor vehicles and parts, recreation services, food services and accommodations
44. Oklahoma

- Personal transportation services expenditure, adjusted for population: $1,134 per capita
- Cost of living: -11.7% less than national average
- Total transportation services expenditure: $4.6 billion
- Total population: 4.1 million
- Other major spending categories: Motor vehicles and parts, gasoline and other energy goods, clothing and footwear, food services and accommodations, health care, recreational goods and vehicles
43. New Mexico
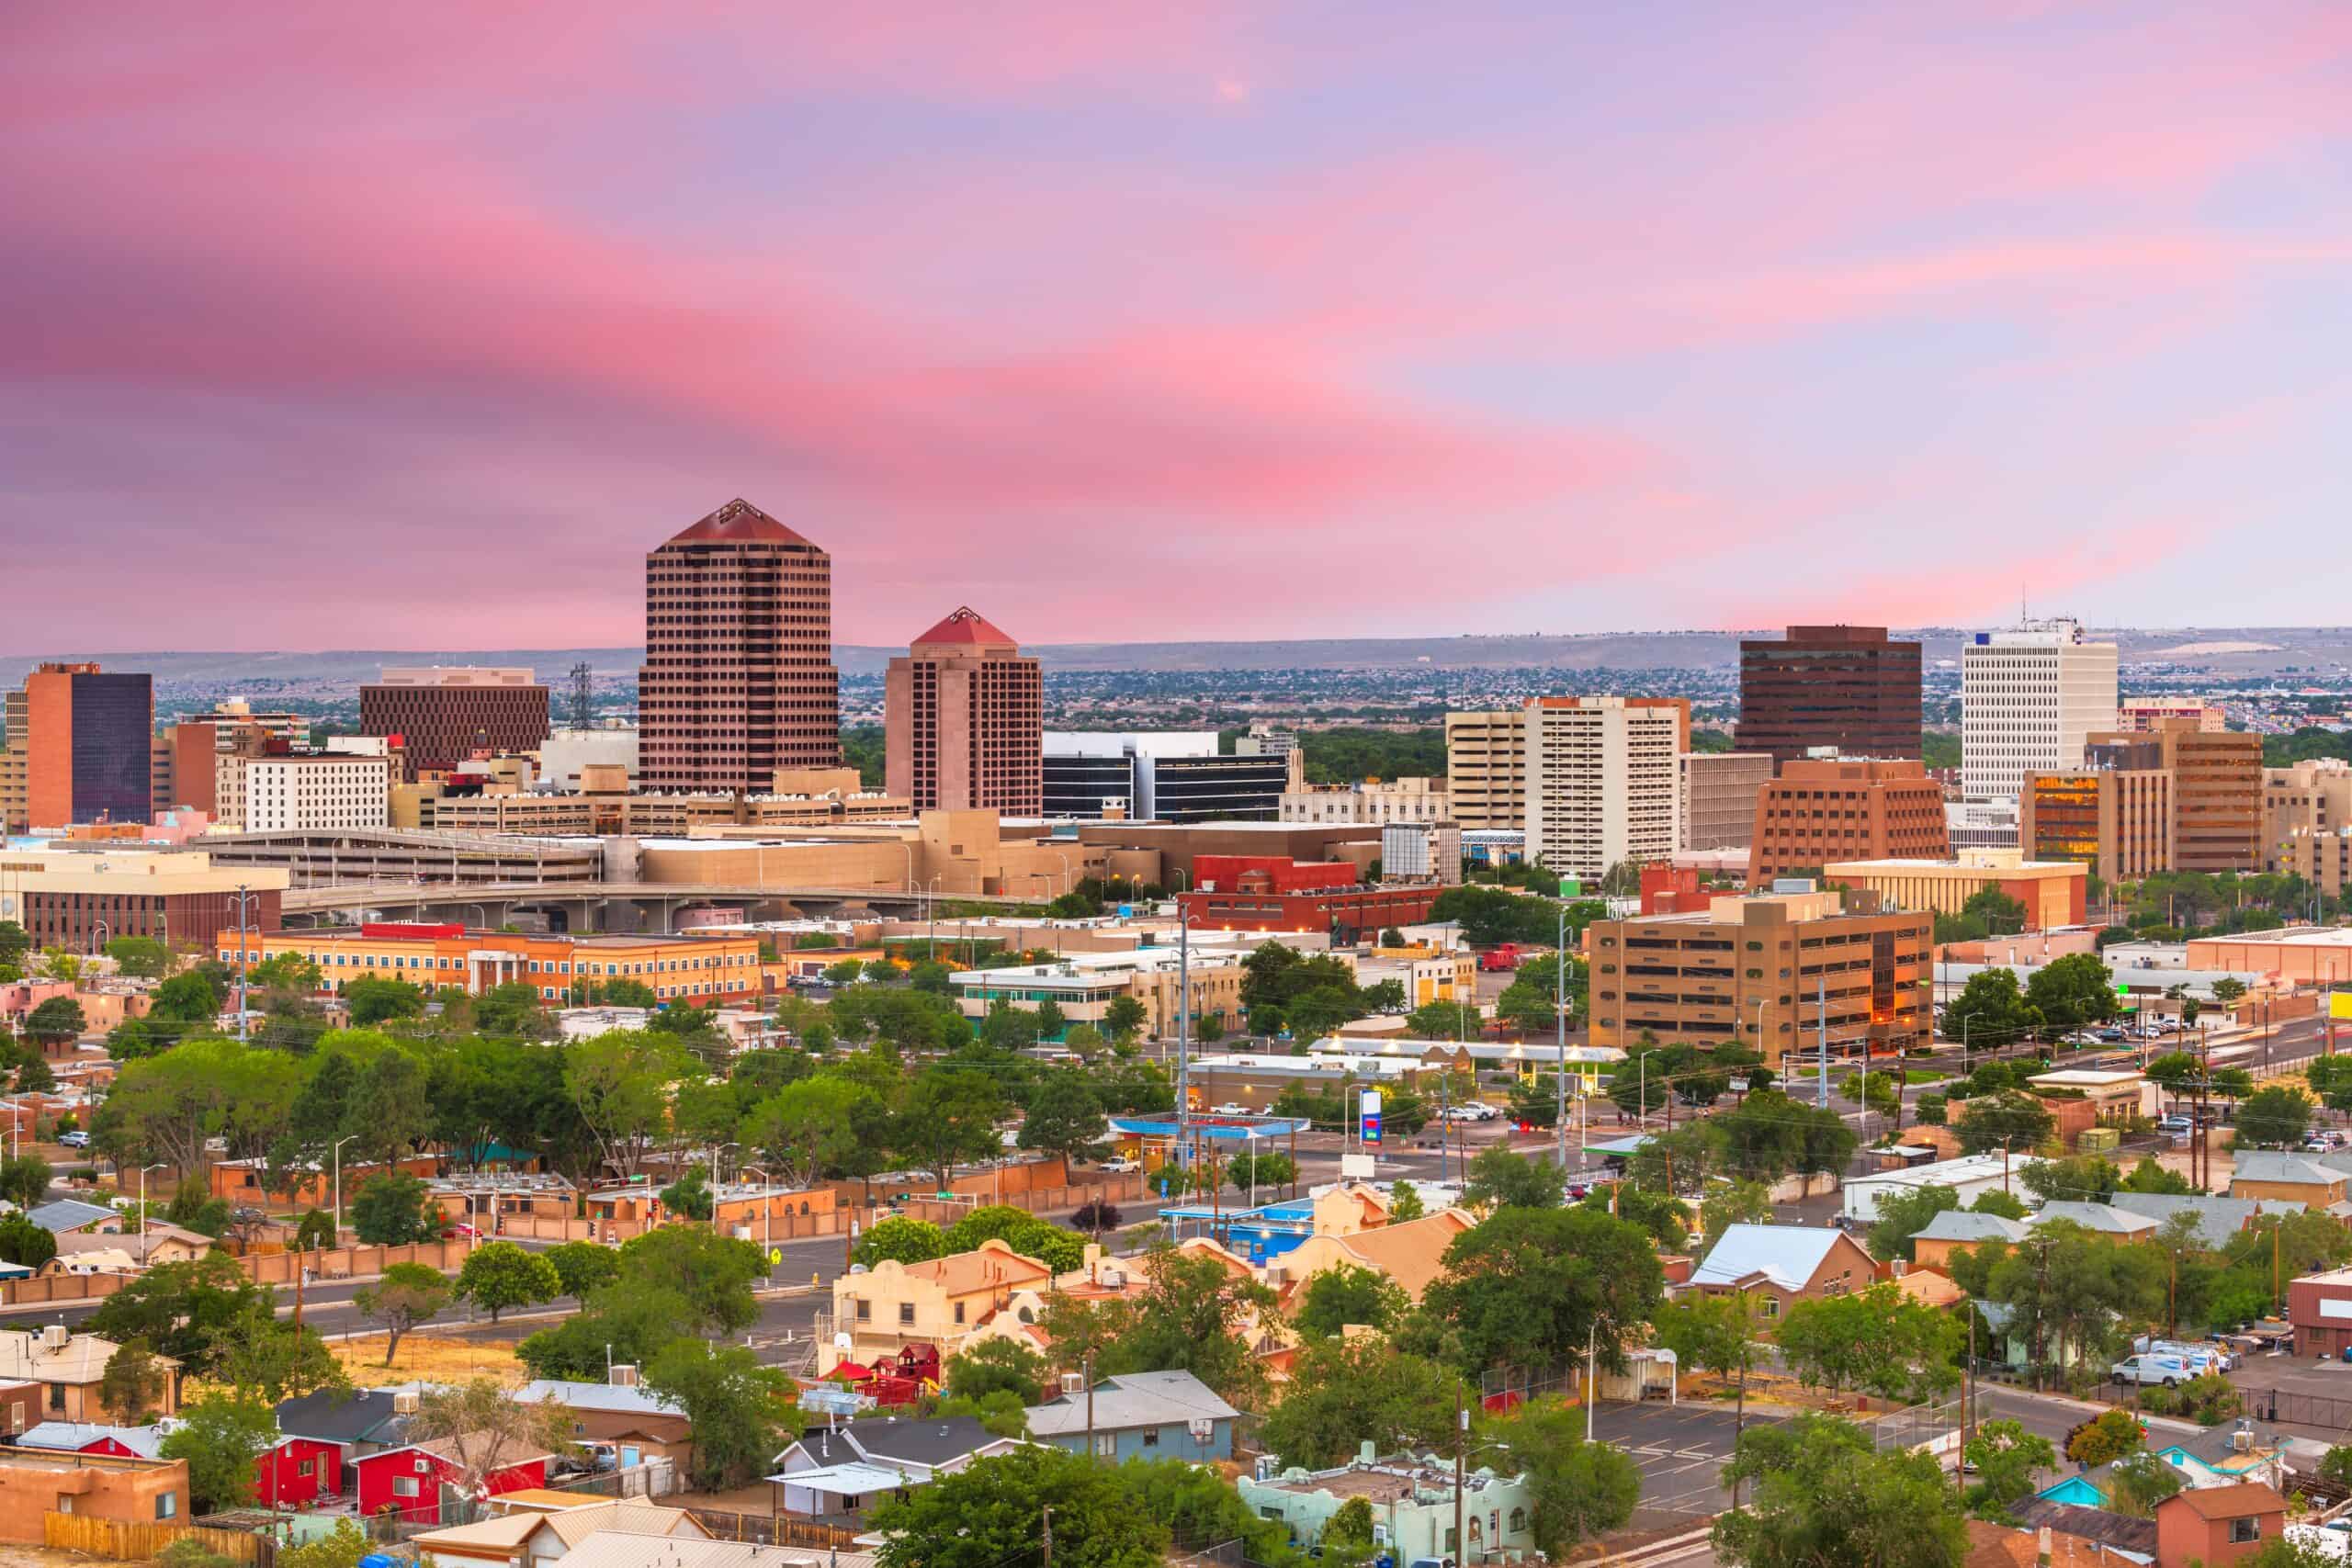
- Personal transportation services expenditure, adjusted for population: $1,163 per capita
- Cost of living: -9.6% less than national average
- Total transportation services expenditure: $2.5 billion
- Total population: 2.1 million
- Other major spending categories: Gasoline and other energy goods, food services and accommodations, motor vehicles and parts, groceries, housing and utilities, health care
42. Ohio
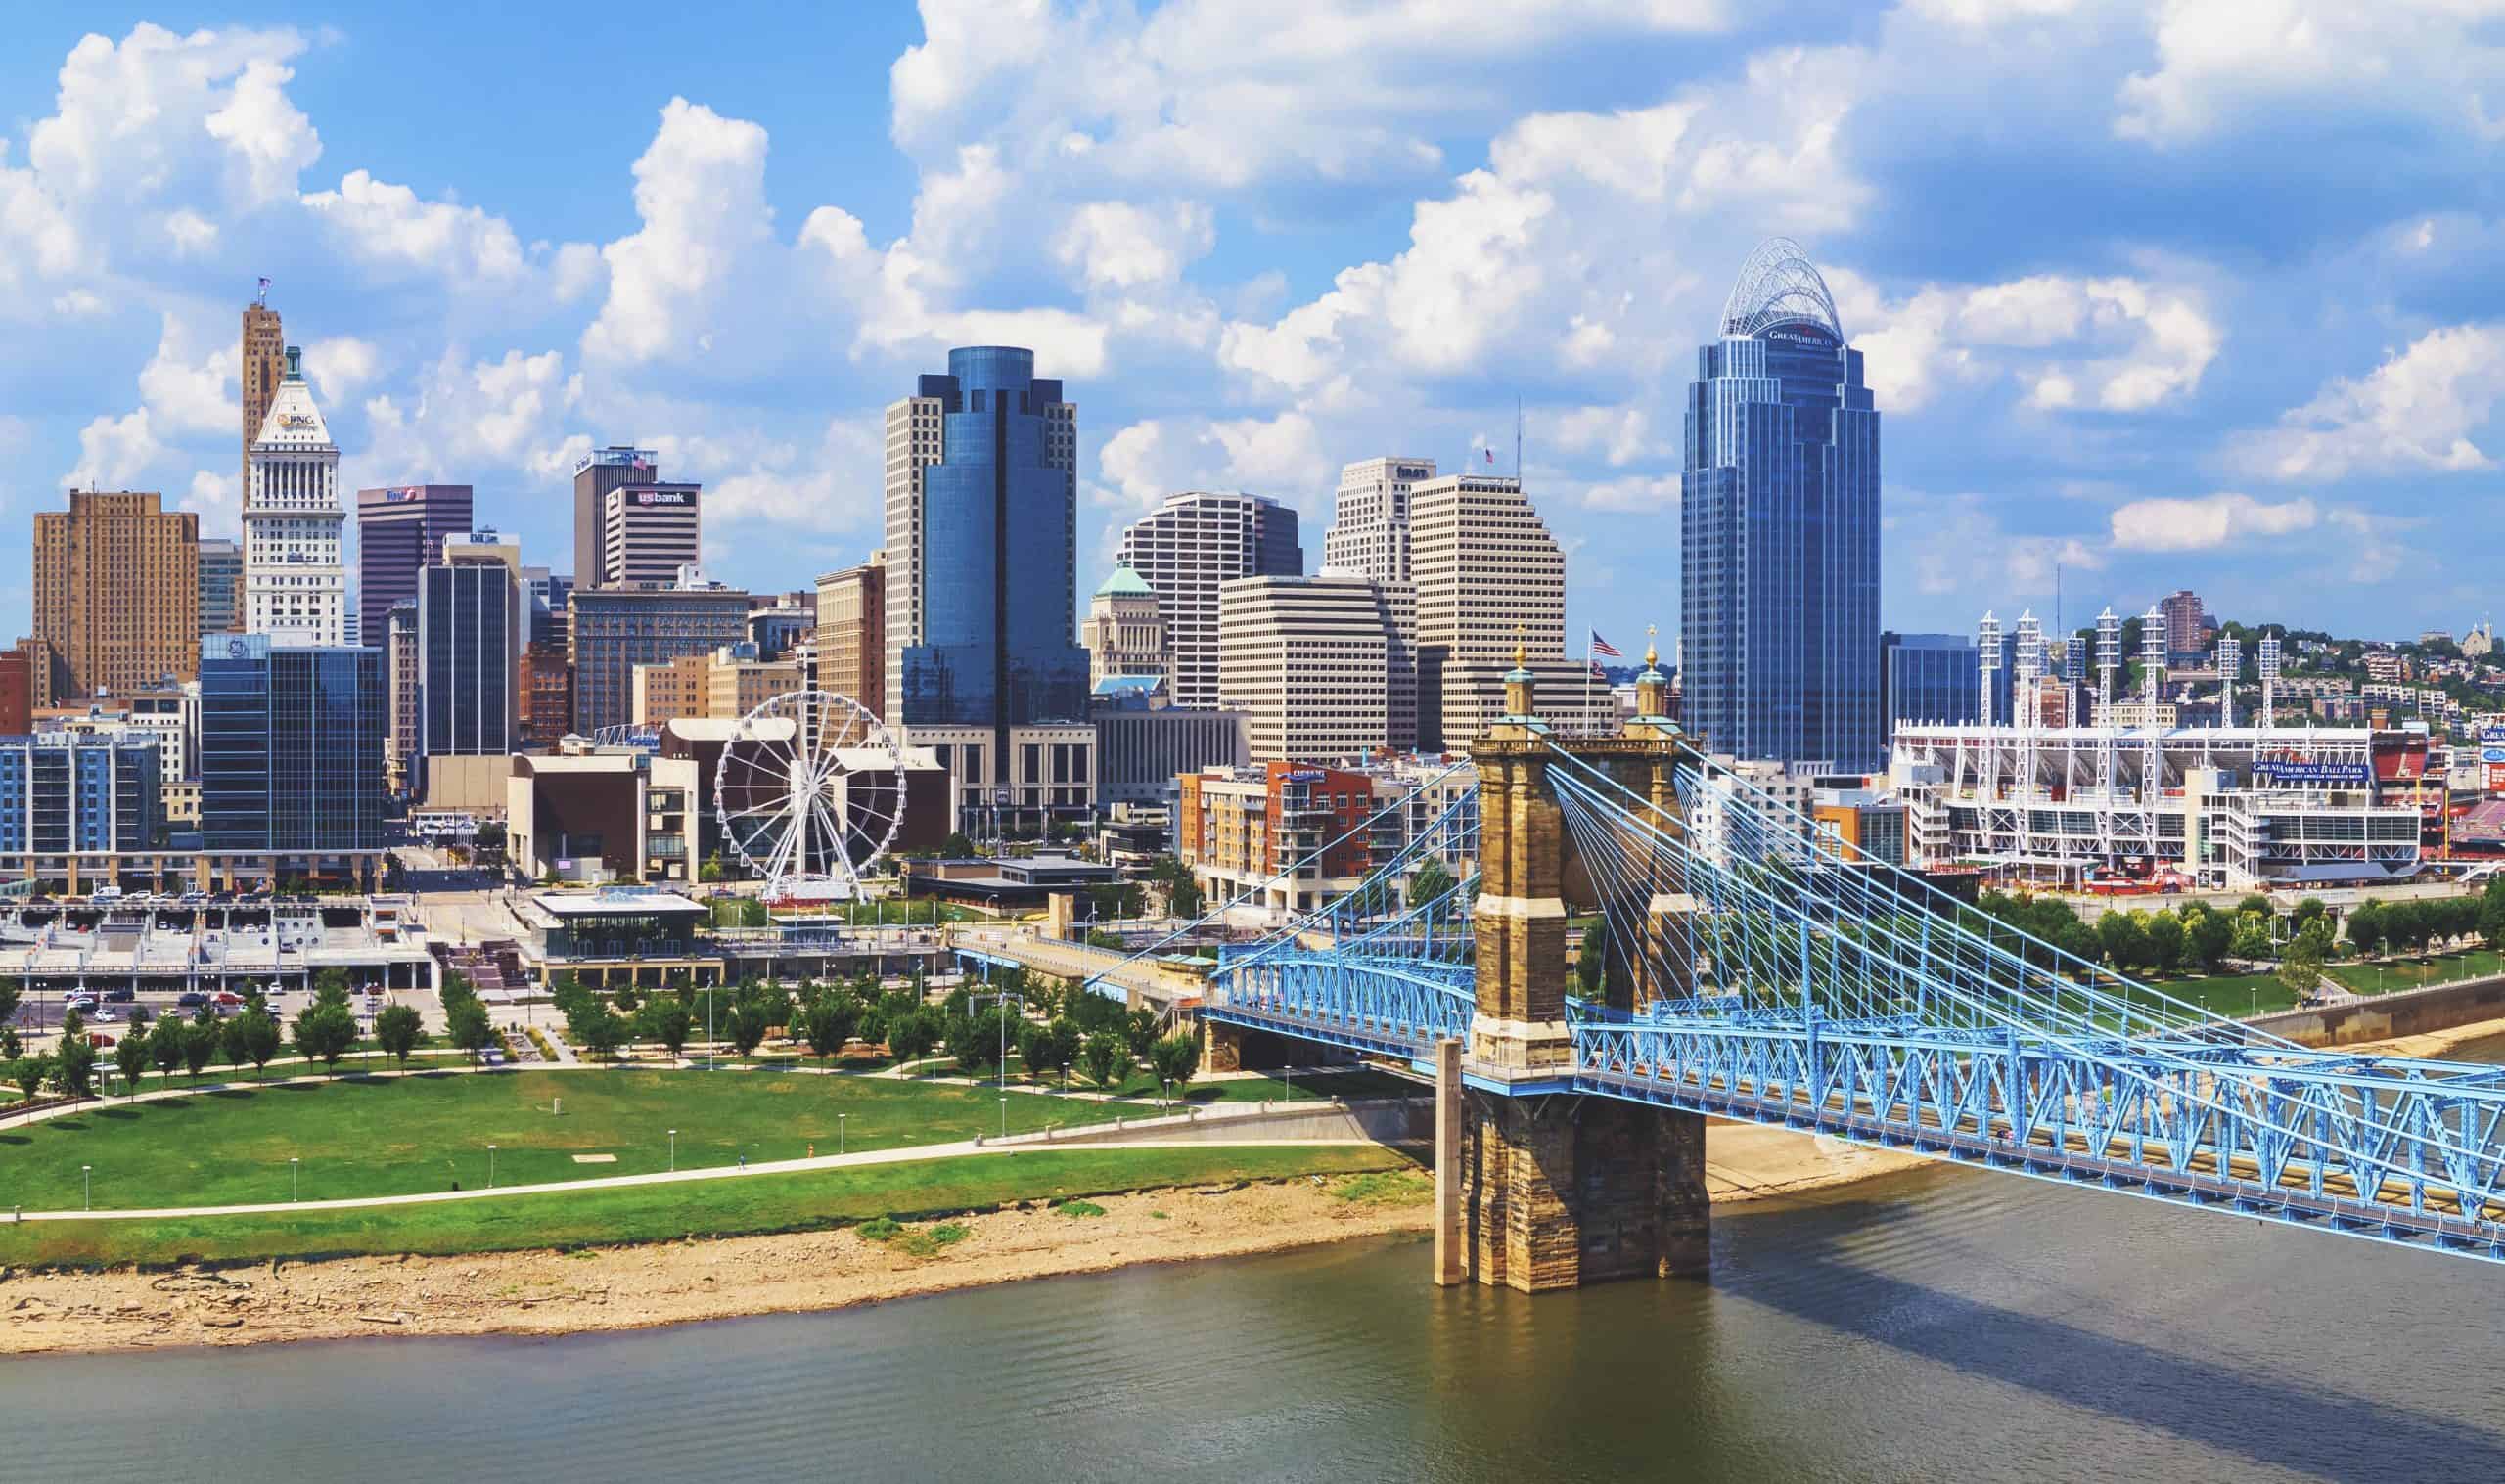
- Personal transportation services expenditure, adjusted for population: $1,208 per capita
- Cost of living: -8.2% less than national average
- Total transportation services expenditure: $14.2 billion
- Total population: 11.8 million
- Other major spending categories: Health care, recreational goods and vehicles, groceries, gasoline and other energy goods, recreation services, furnishings and durable household equipment
41. South Carolina

- Personal transportation services expenditure, adjusted for population: $1,301 per capita
- Cost of living: -6.8% less than national average
- Total transportation services expenditure: $7.0 billion
- Total population: 5.4 million
- Other major spending categories: Gasoline and other energy goods, motor vehicles and parts, clothing and footwear, groceries, housing and utilities, food services and accommodations
40. Wisconsin

- Personal transportation services expenditure, adjusted for population: $1,350 per capita
- Cost of living: -6.9% less than national average
- Total transportation services expenditure: $8.0 billion
- Total population: 5.9 million
- Other major spending categories: Gasoline and other energy goods, motor vehicles and parts, recreational goods and vehicles, financial services and insurance, health care, furnishings and durable household equipment
39. Indiana
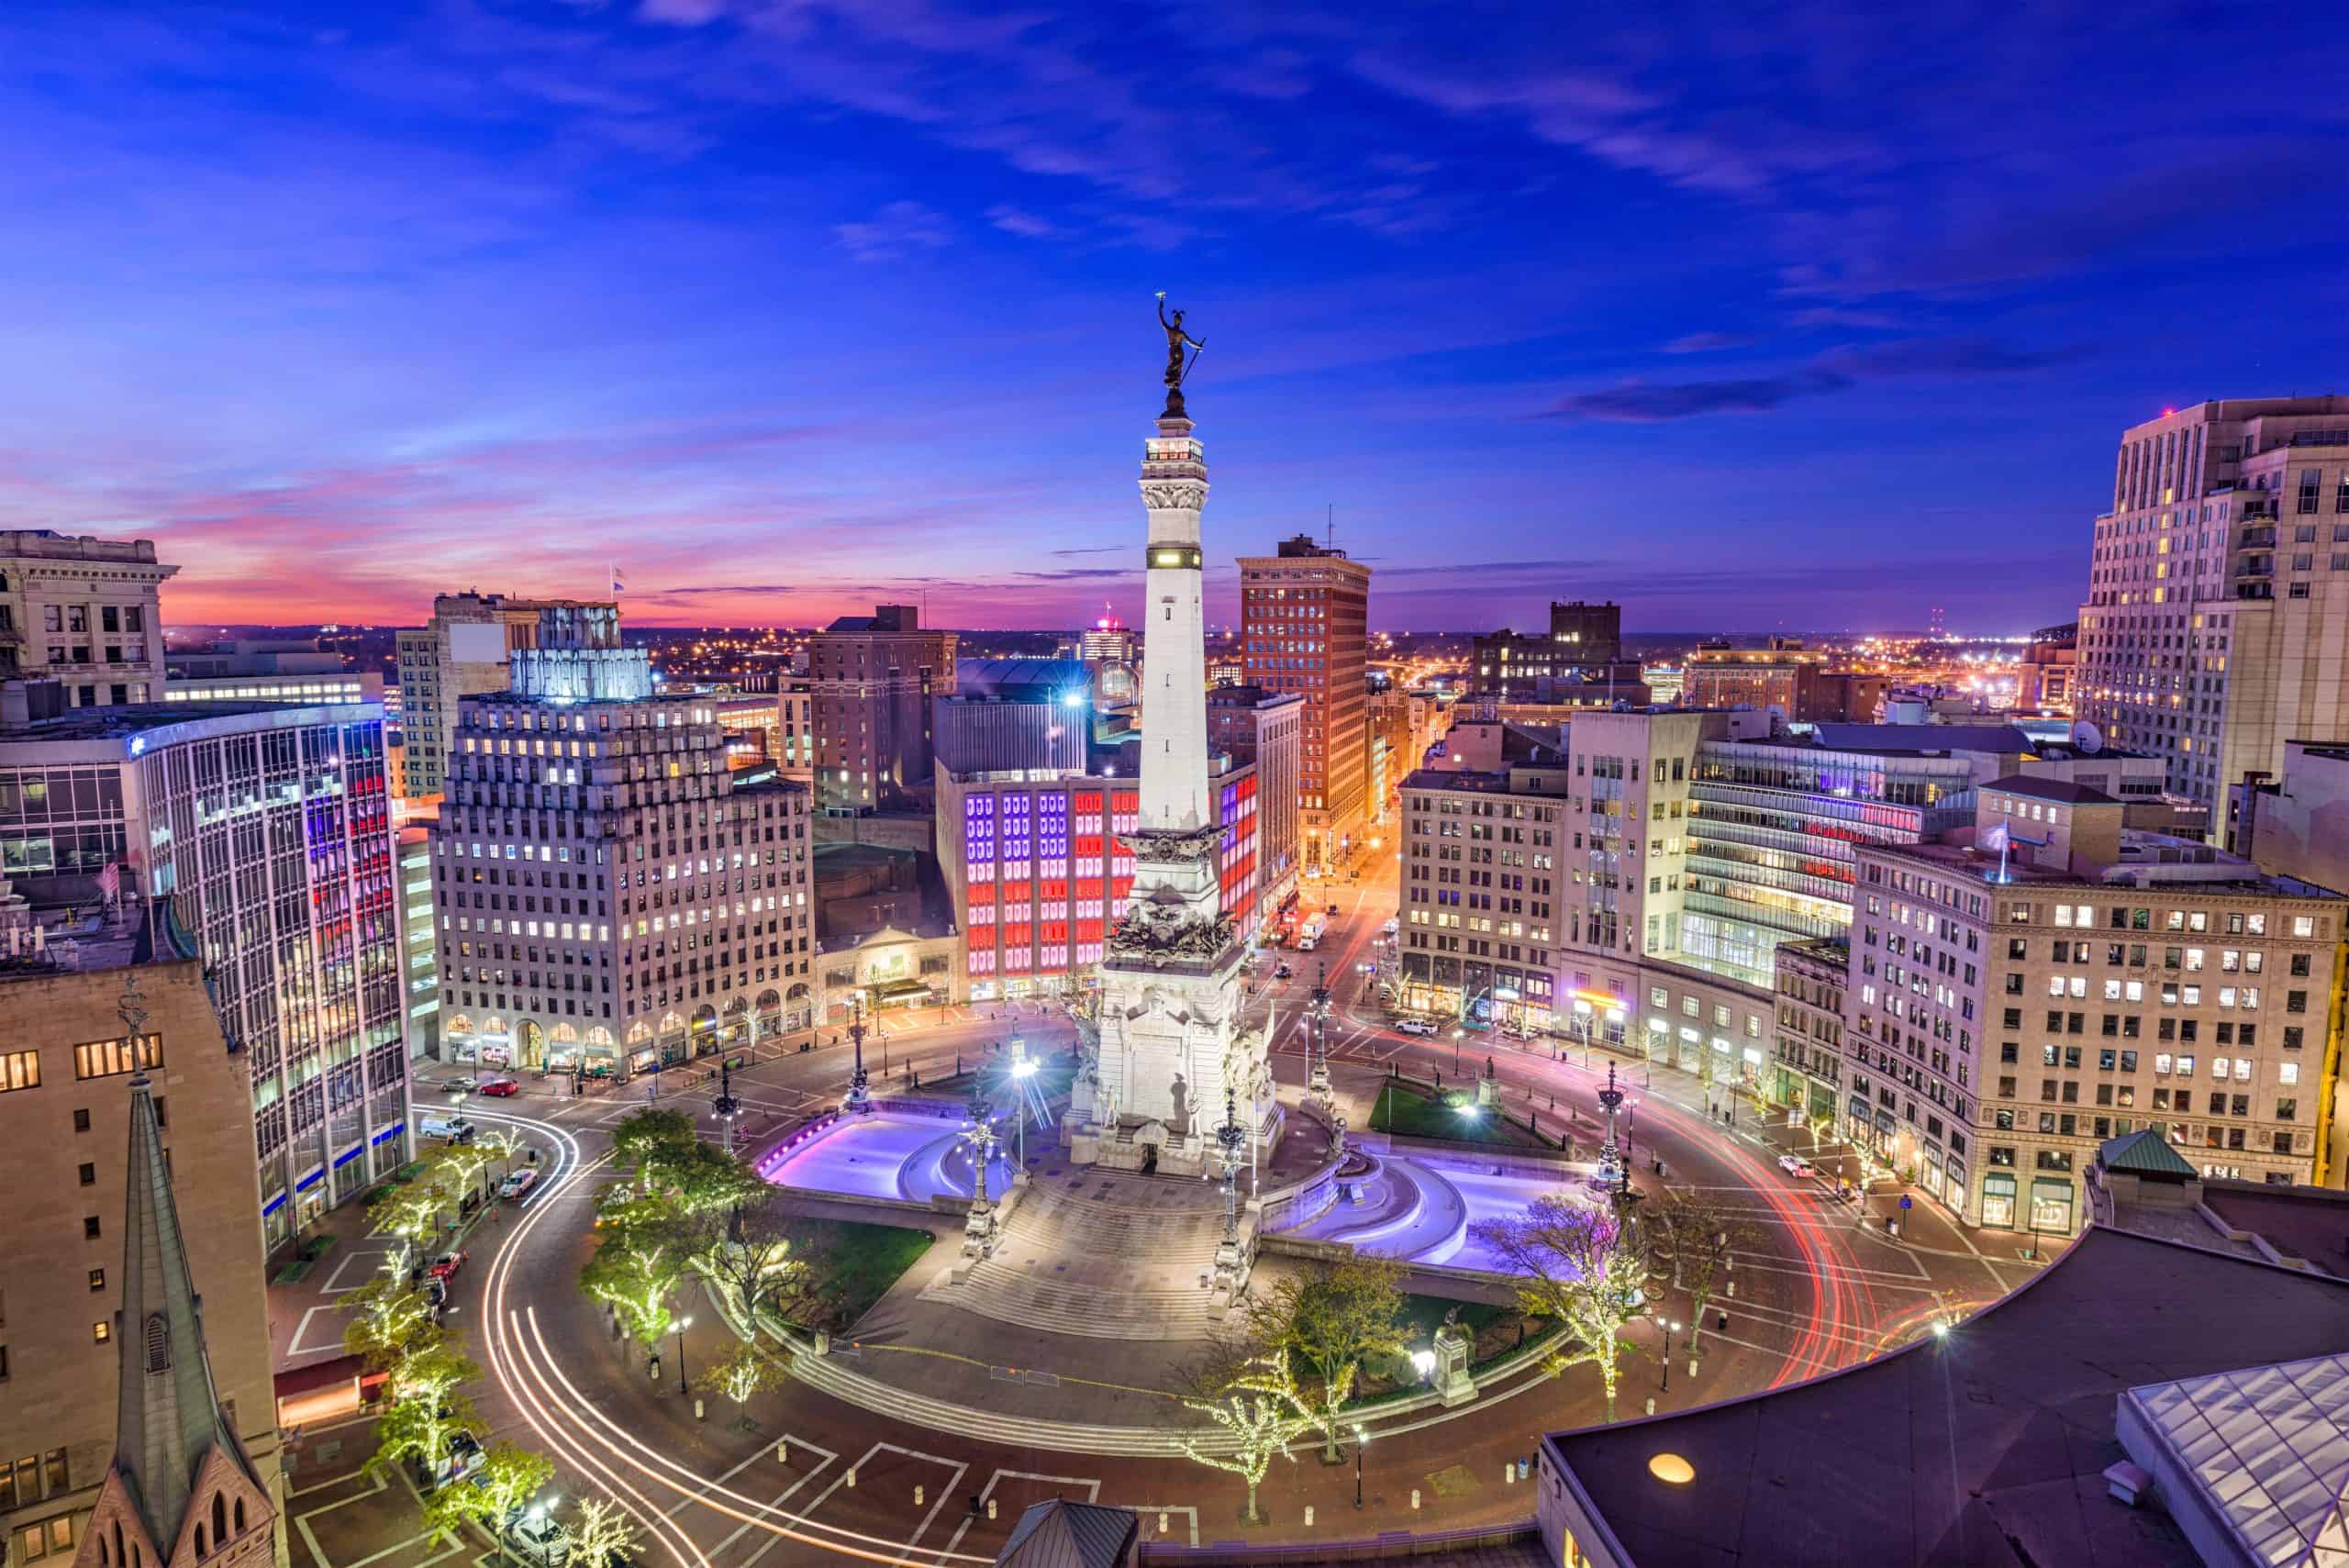
- Personal transportation services expenditure, adjusted for population: $1,360 per capita
- Cost of living: -7.8% less than national average
- Total transportation services expenditure: $9.3 billion
- Total population: 6.9 million
- Other major spending categories: Health care, gasoline and other energy goods, motor vehicles and parts, recreational goods and vehicles, groceries, furnishings and durable household equipment
38. North Carolina

- Personal transportation services expenditure, adjusted for population: $1,396 per capita
- Cost of living: -5.9% less than national average
- Total transportation services expenditure: $15.1 billion
- Total population: 10.8 million
- Other major spending categories: Recreational goods and vehicles, furnishings and durable household equipment, motor vehicles and parts, clothing and footwear, groceries, recreation services
37. Michigan
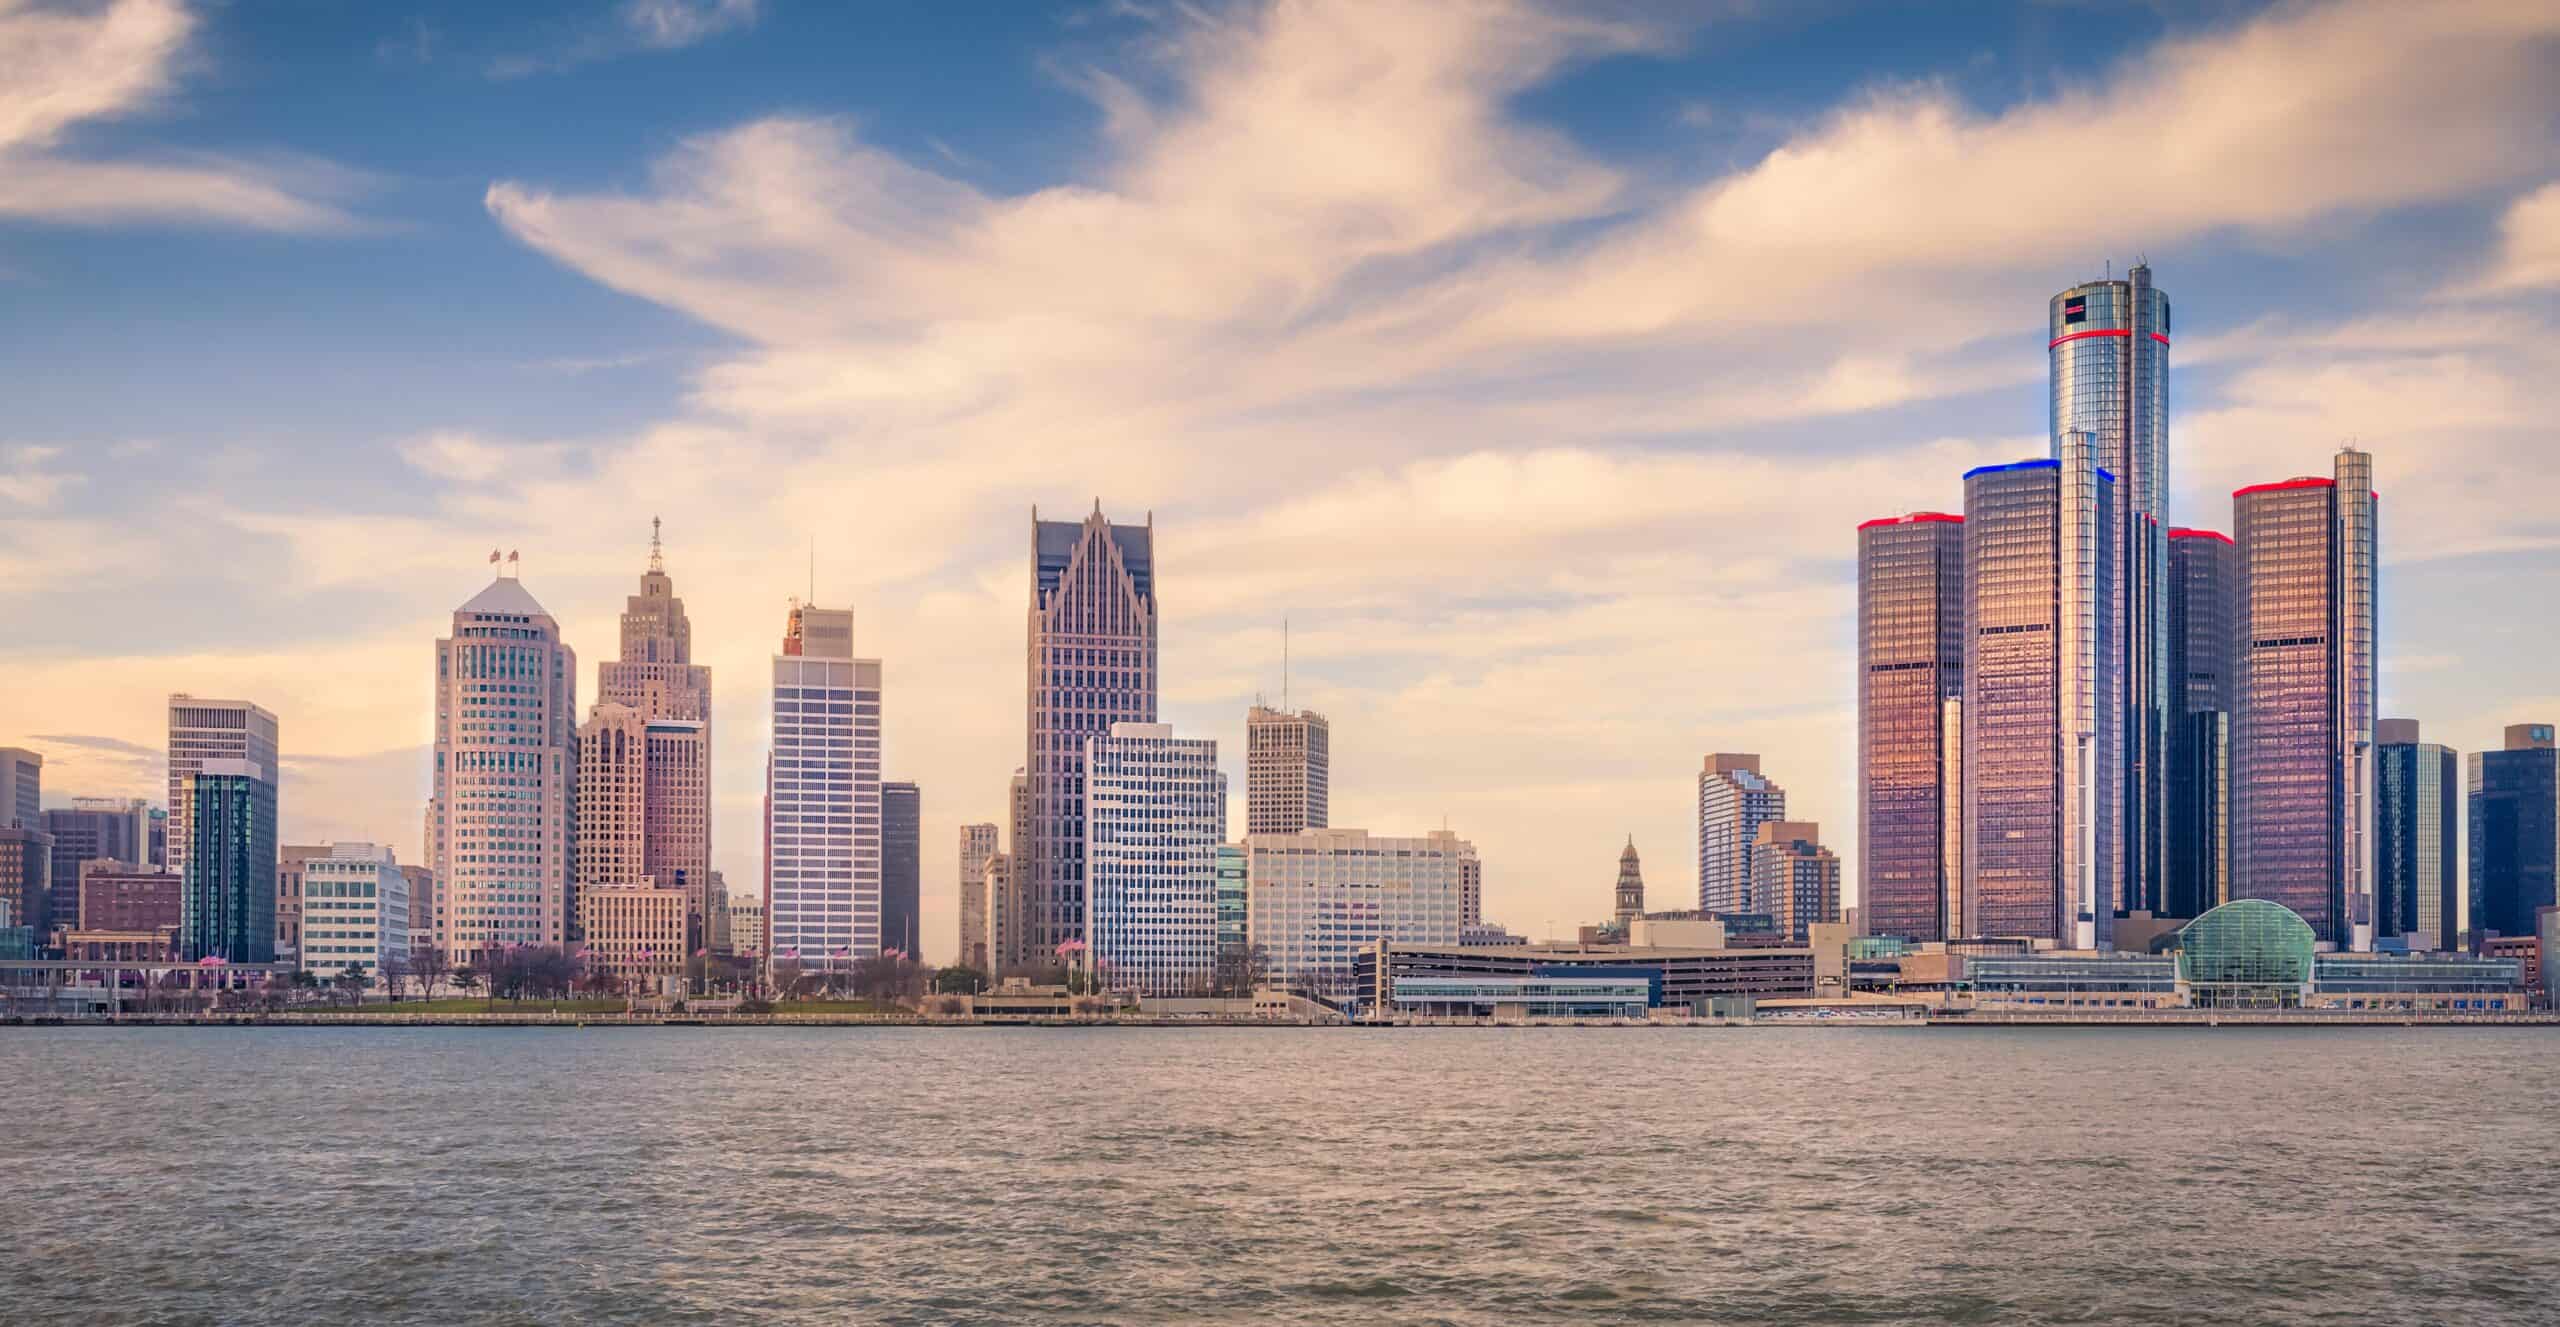
- Personal transportation services expenditure, adjusted for population: $1,419 per capita
- Cost of living: -5.8% less than national average
- Total transportation services expenditure: $14.2 billion
- Total population: 10.0 million
- Other major spending categories: Financial services and insurance, gasoline and other energy goods, recreational goods and vehicles, groceries, clothing and footwear, housing and utilities
36. Idaho
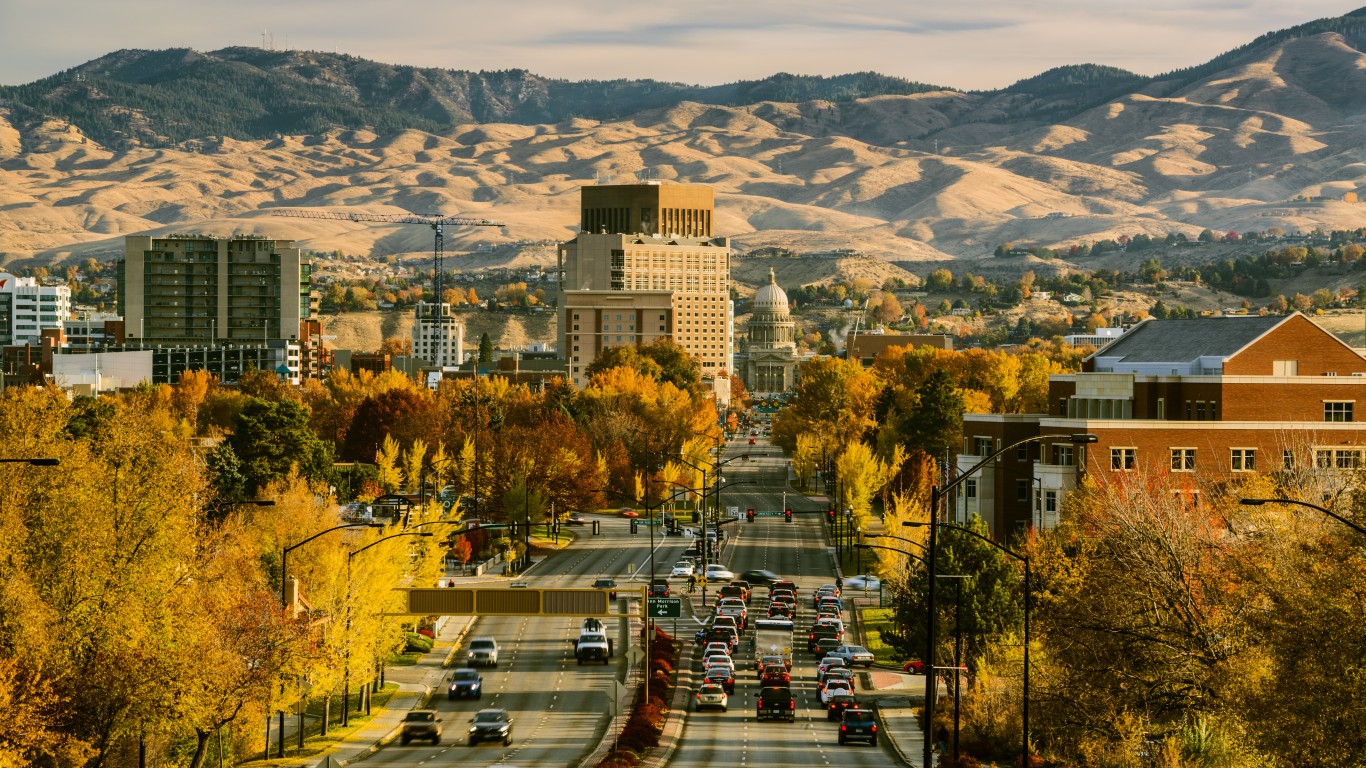
- Personal transportation services expenditure, adjusted for population: $1,468 per capita
- Cost of living: -8.6% less than national average
- Total transportation services expenditure: $2.9 billion
- Total population: 2.0 million
- Other major spending categories: Recreational goods and vehicles, gasoline and other energy goods, motor vehicles and parts, housing and utilities, furnishings and durable household equipment
35. Iowa
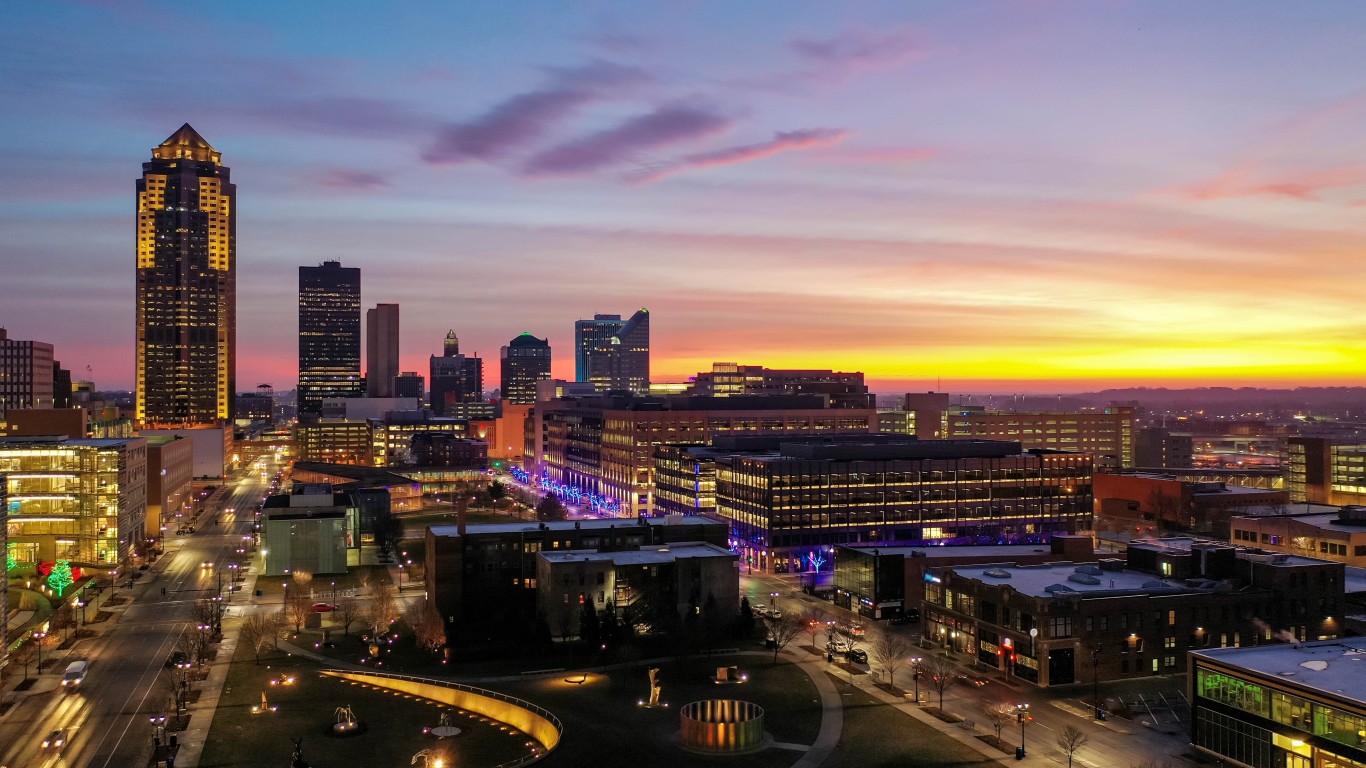
- Personal transportation services expenditure, adjusted for population: $1,478 per capita
- Cost of living: -11.2% less than national average
- Total transportation services expenditure: $4.7 billion
- Total population: 3.2 million
- Other major spending categories: Gasoline and other energy goods, motor vehicles and parts, groceries, recreational goods and vehicles, health care
34. Kansas
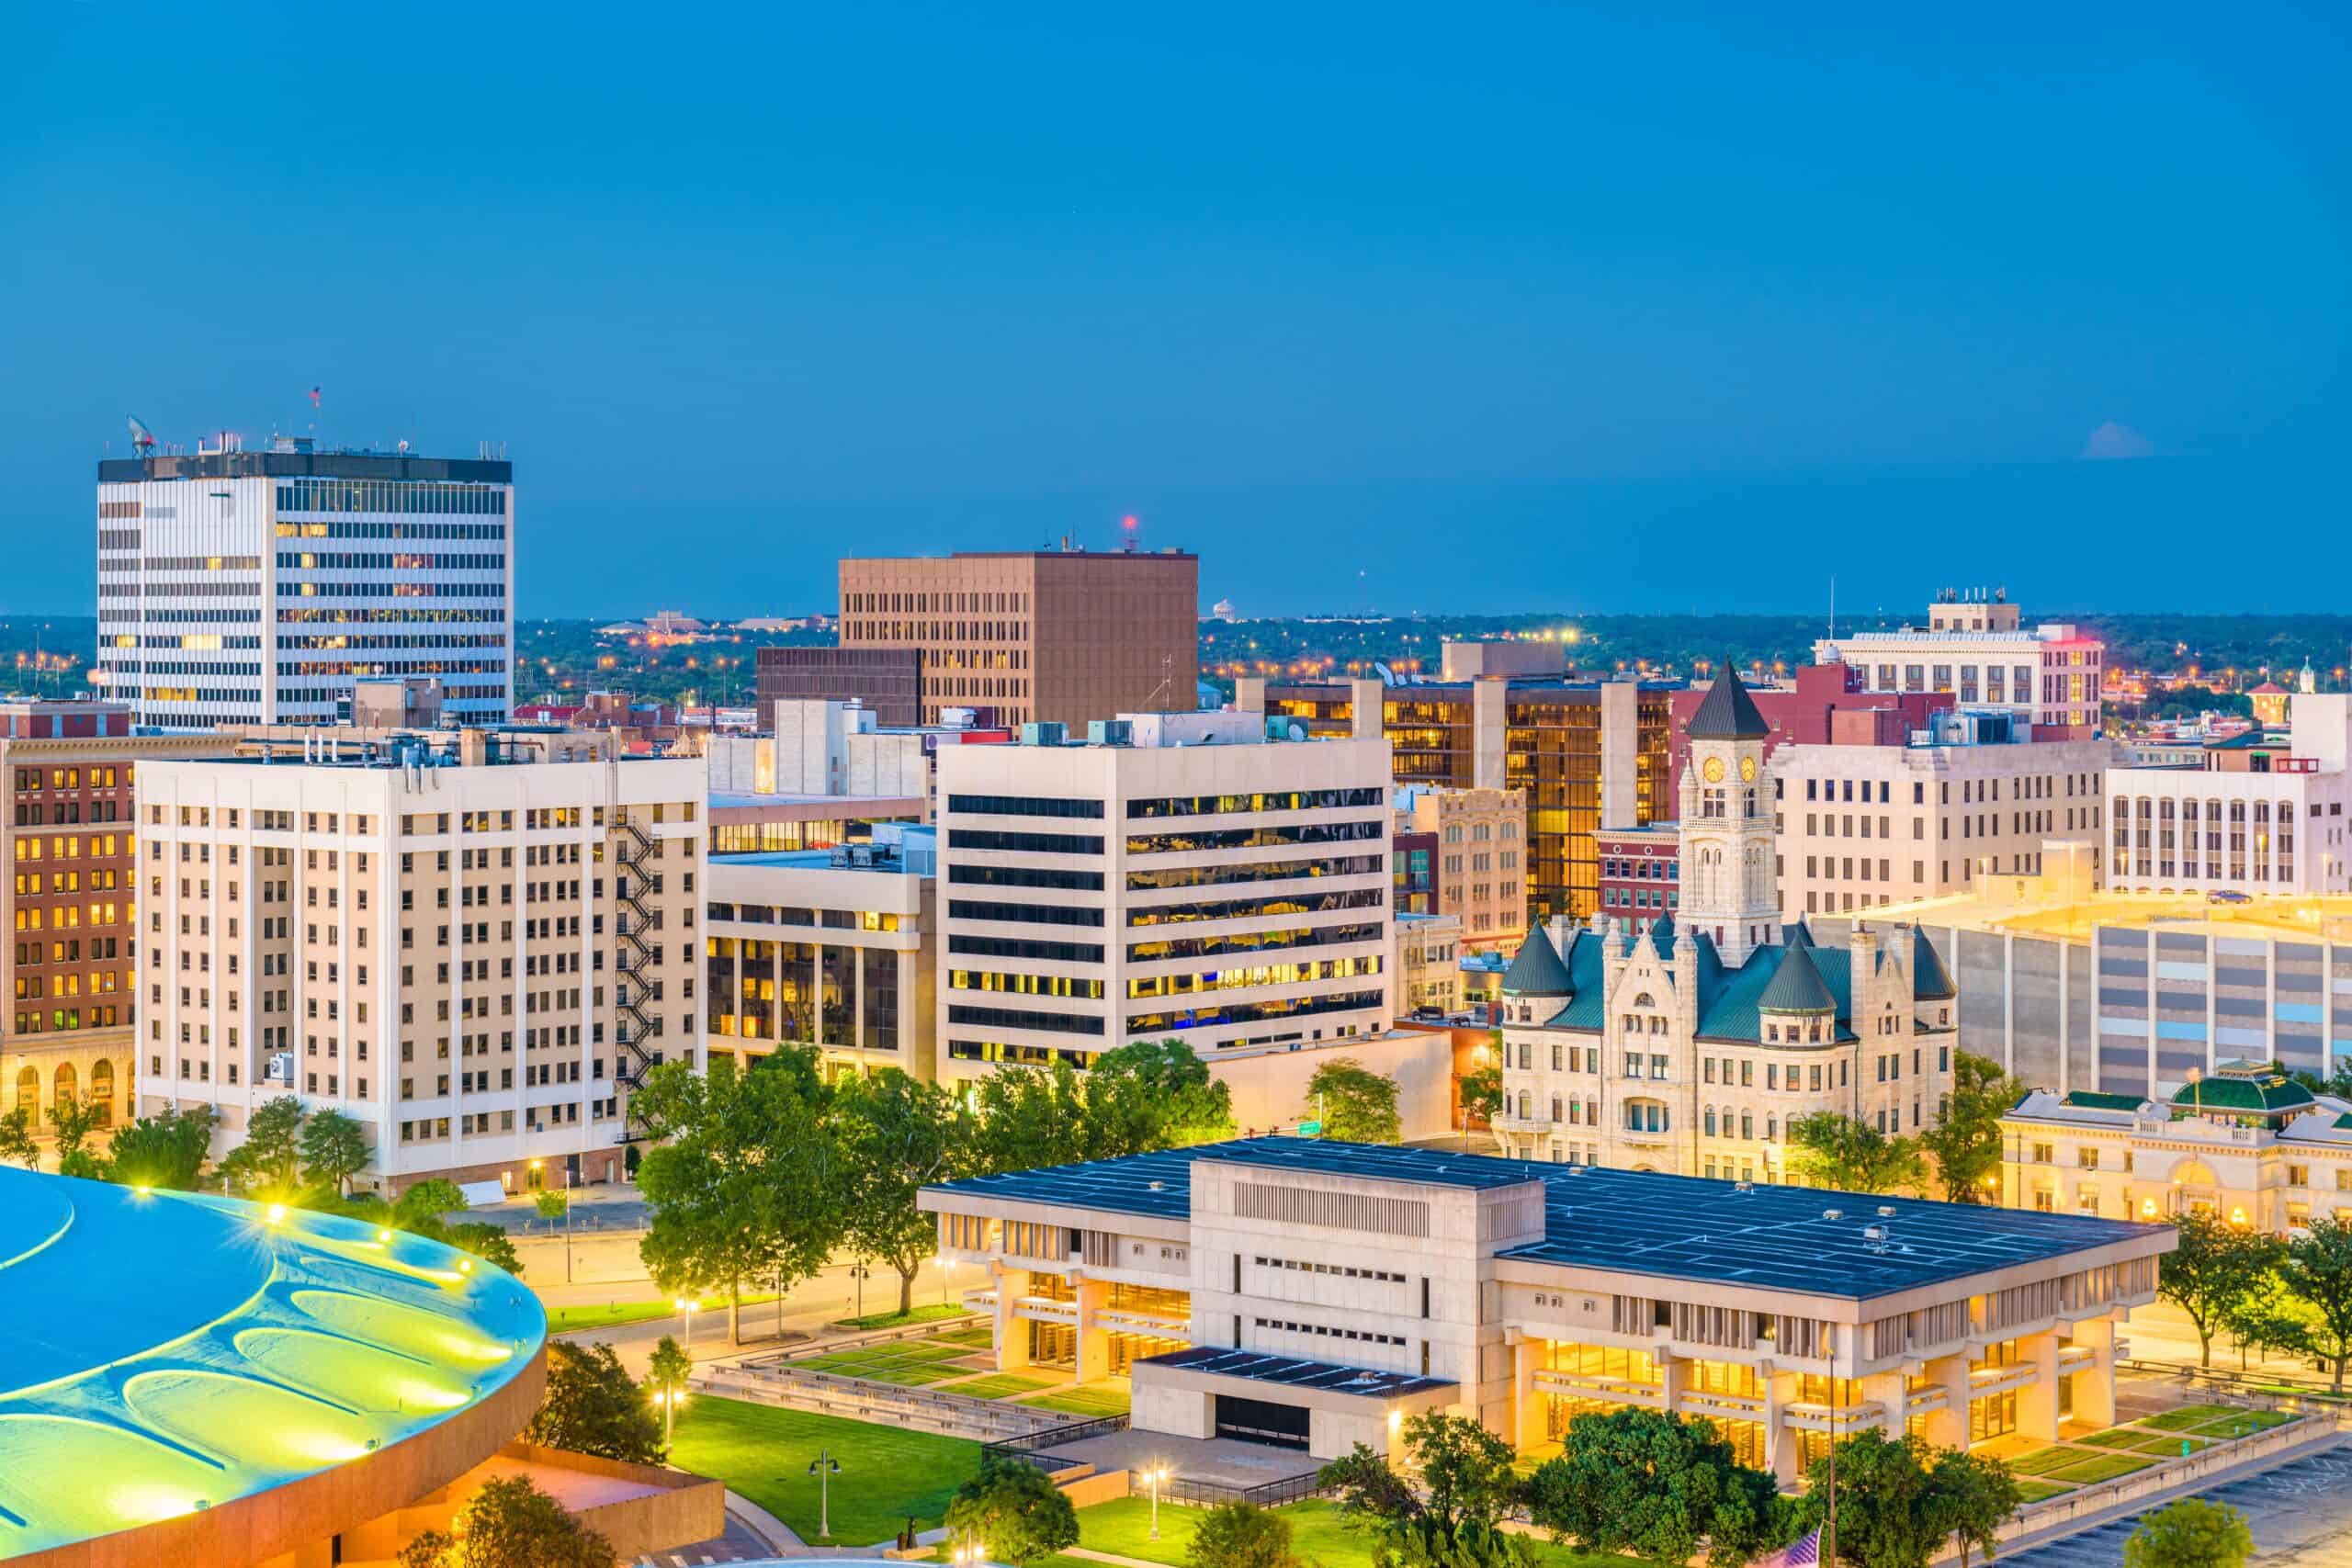
- Personal transportation services expenditure, adjusted for population: $1,486 per capita
- Cost of living: -10.0% less than national average
- Total transportation services expenditure: $4.4 billion
- Total population: 2.9 million
- Other major spending categories: Groceries, motor vehicles and parts, financial services and insurance, furnishings and durable household equipment, health care, gasoline and other energy goods
33. Tennessee

- Personal transportation services expenditure, adjusted for population: $1,516 per capita
- Cost of living: -7.5% less than national average
- Total transportation services expenditure: $10.8 billion
- Total population: 7.1 million
- Other major spending categories: Clothing and footwear, food services and accommodations, financial services and insurance, gasoline and other energy goods, motor vehicles and parts, furnishings and durable household equipment
32. Delaware
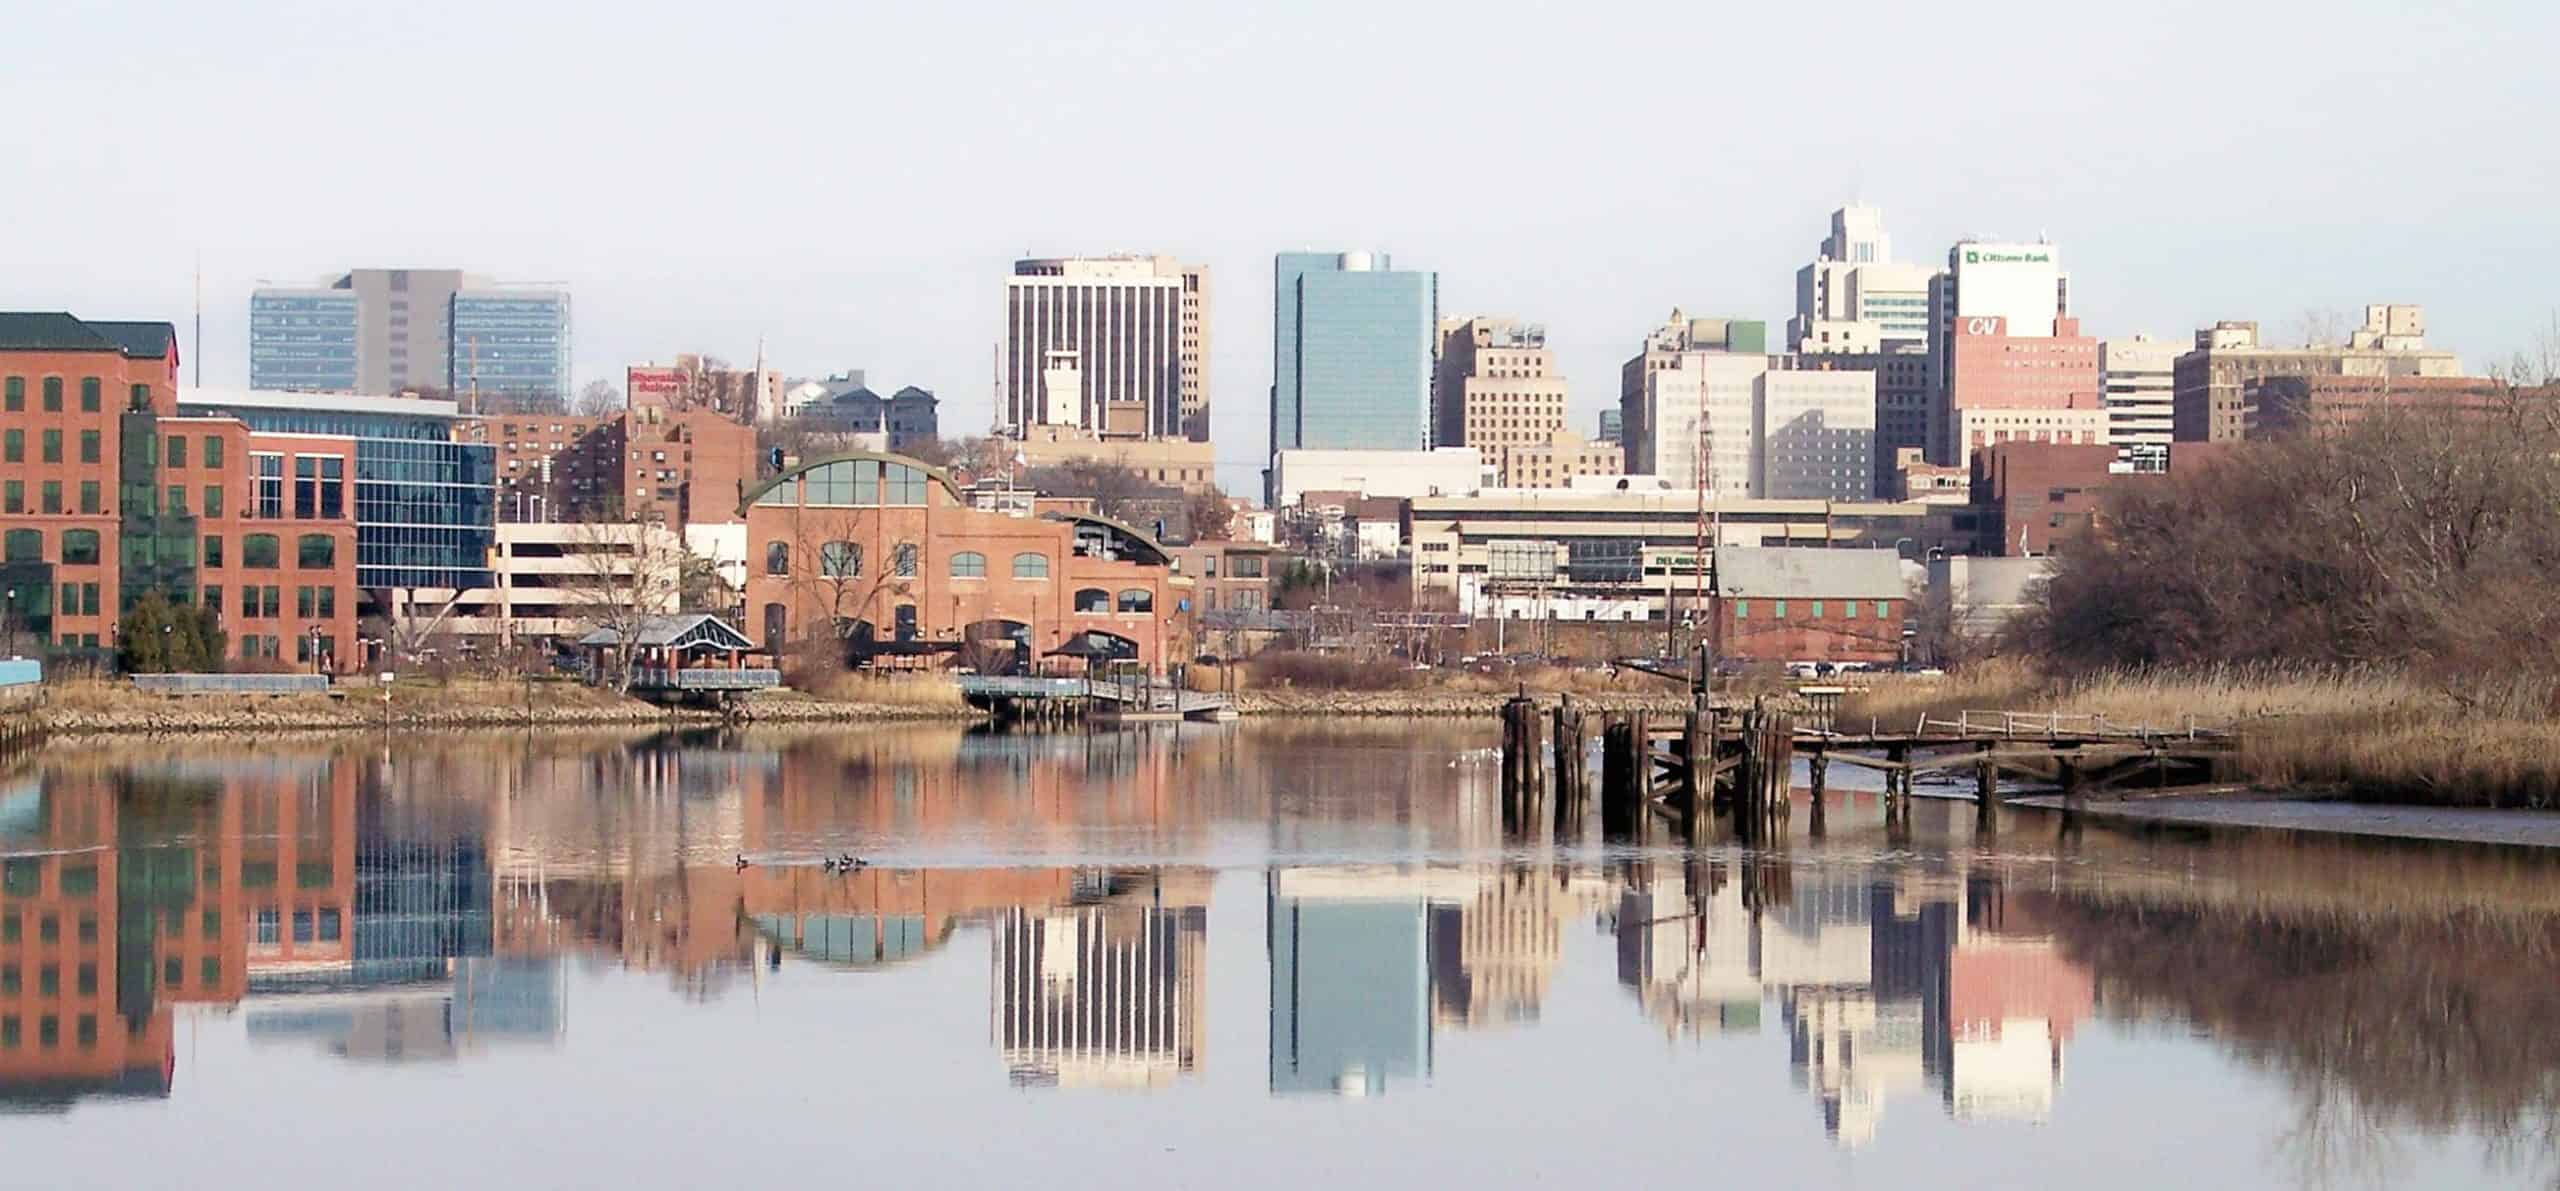
- Personal transportation services expenditure, adjusted for population: $1,520 per capita
- Cost of living: -0.7% less than national average
- Total transportation services expenditure: $1.6 billion
- Total population: 1.0 million
- Other major spending categories: Health care, furnishings and durable household equipment, food services and accommodations, gasoline and other energy goods, housing and utilities, clothing and footwear
31. Pennsylvania
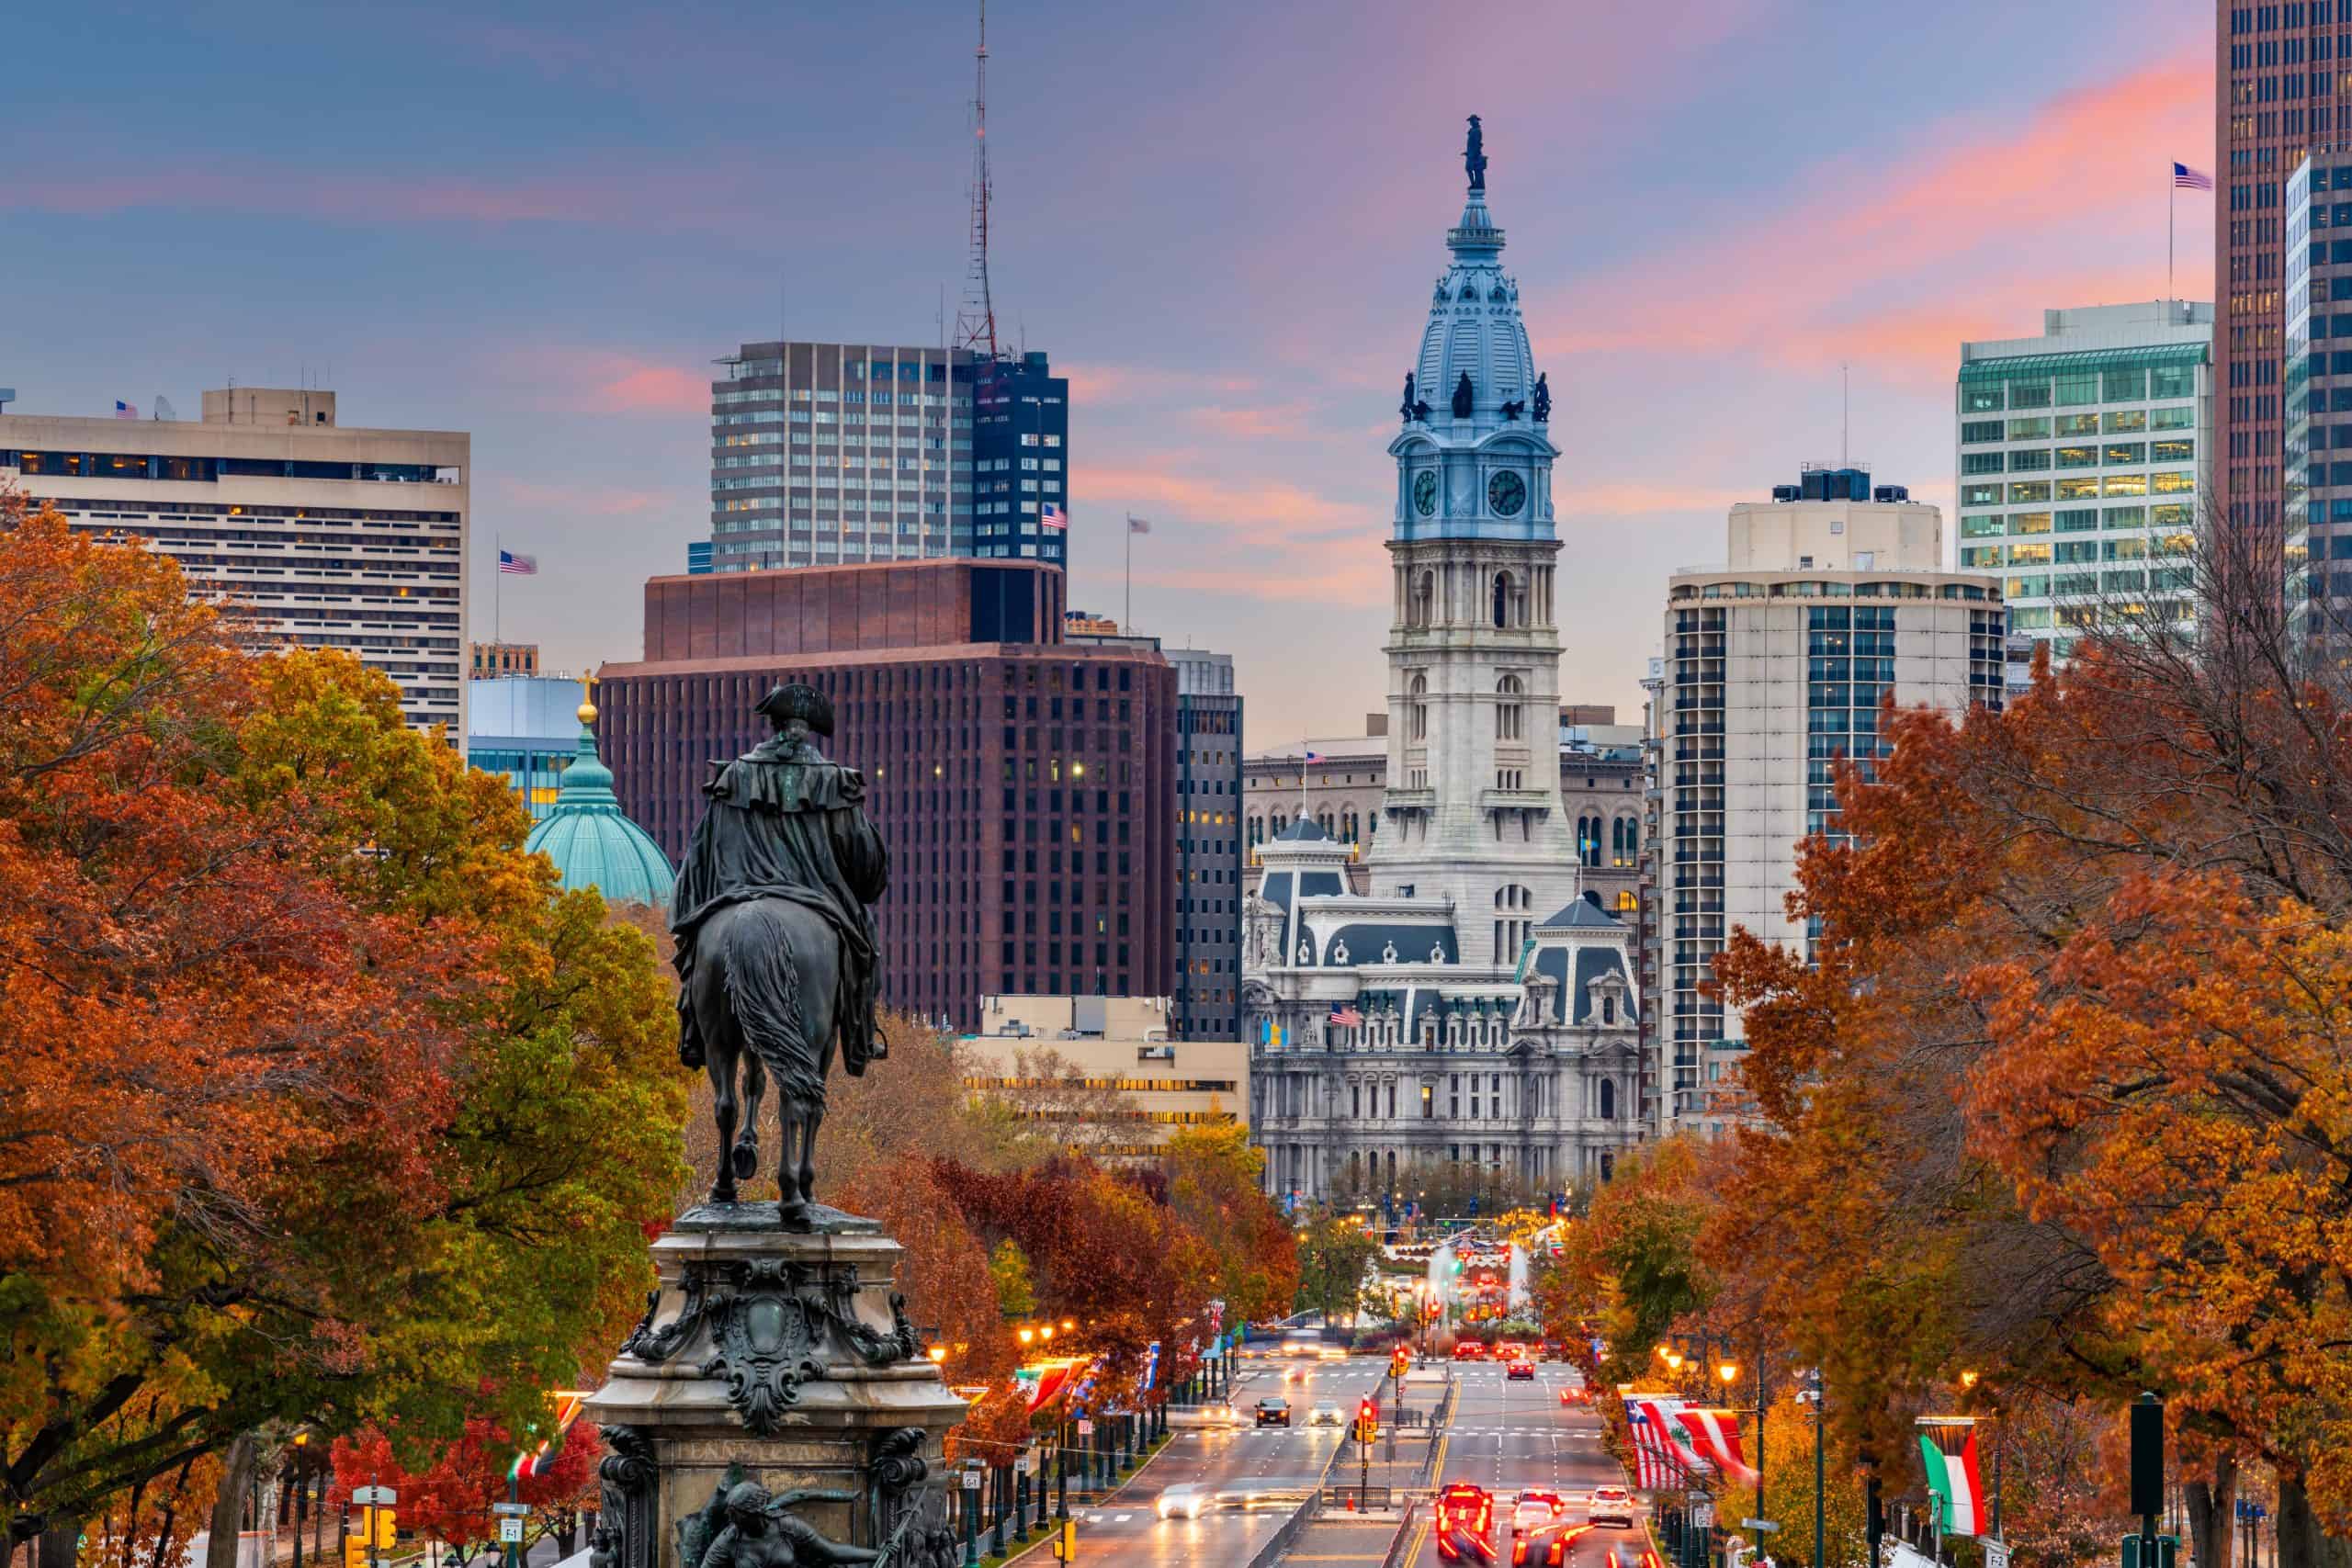
- Personal transportation services expenditure, adjusted for population: $1,580 per capita
- Cost of living: -2.5% less than national average
- Total transportation services expenditure: $20.5 billion
- Total population: 13.0 million
- Other major spending categories: Recreational goods and vehicles, financial services and insurance, health care, furnishings and durable household equipment, gasoline and other energy goods, clothing and footwear
30. Nevada
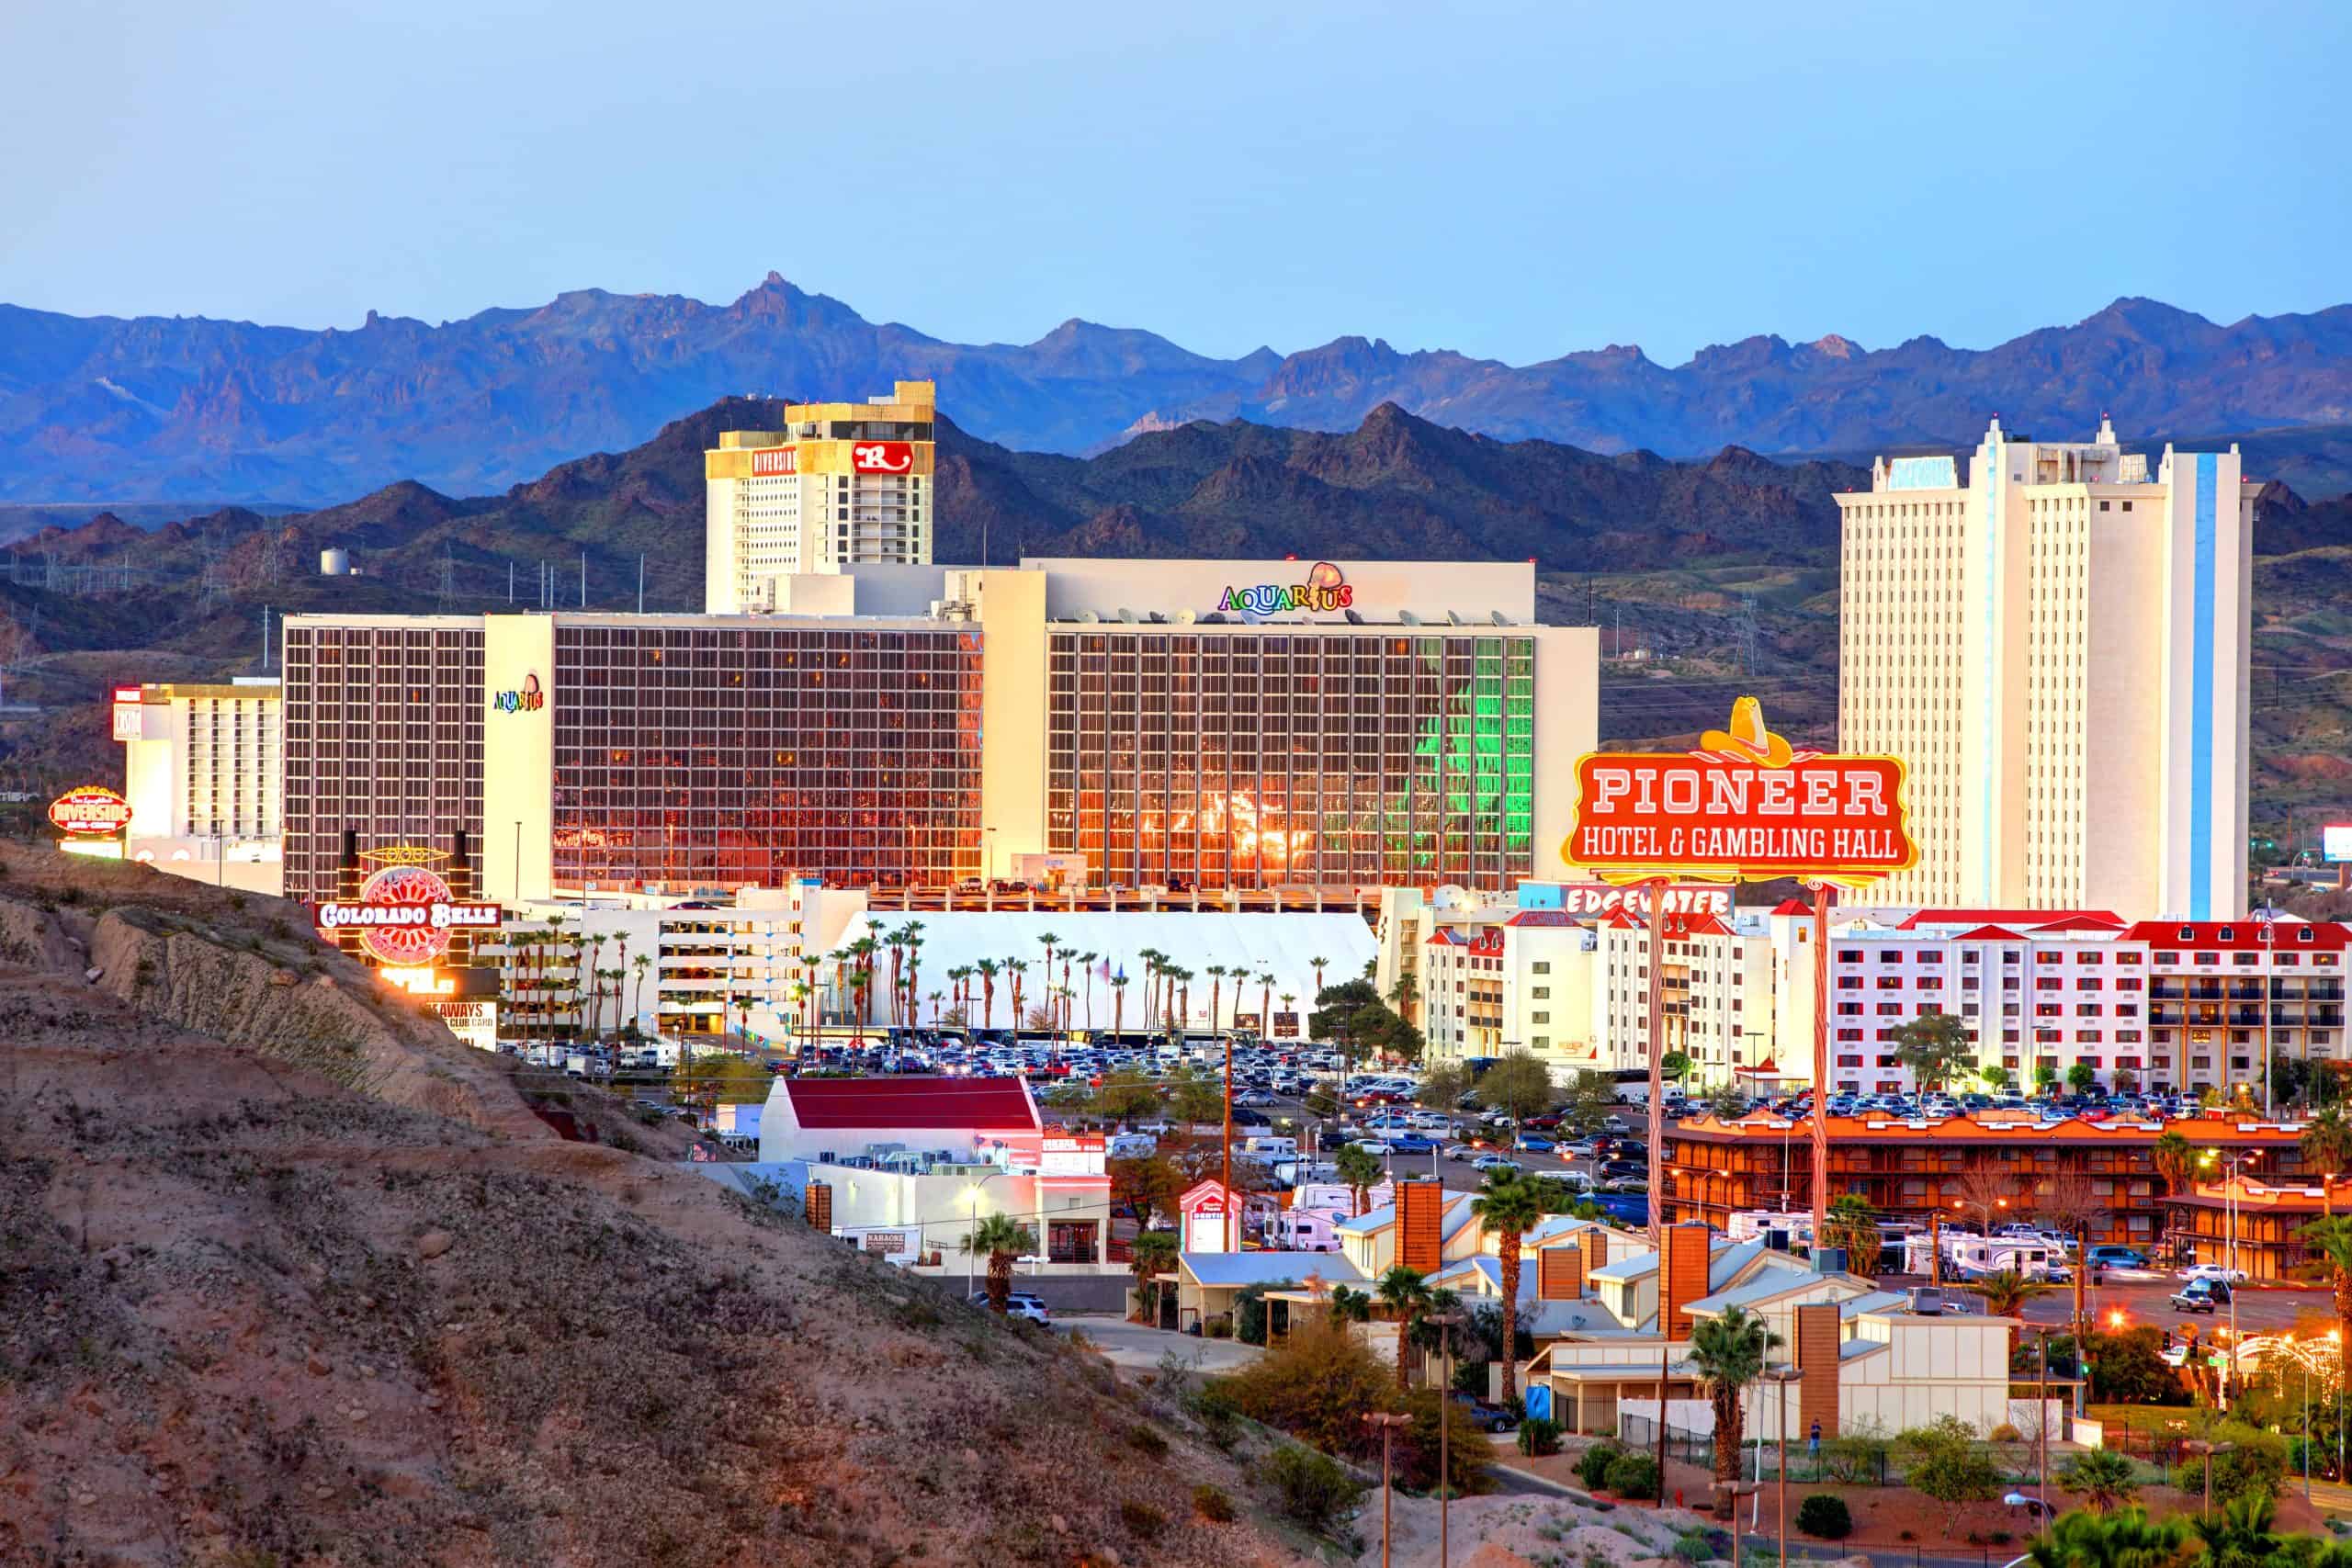
- Personal transportation services expenditure, adjusted for population: $1,580 per capita
- Cost of living: -3.0% less than national average
- Total transportation services expenditure: $5.0 billion
- Total population: 3.2 million
- Other major spending categories: Furnishings and durable household equipment, groceries, recreation services, housing and utilities, food services and accommodations, financial services and insurance
29. Texas

- Personal transportation services expenditure, adjusted for population: $1,594 per capita
- Cost of living: -2.8% less than national average
- Total transportation services expenditure: $48.6 billion
- Total population: 30.5 million
- Other major spending categories: Motor vehicles and parts, clothing and footwear, recreation services, financial services and insurance, food services and accommodations, recreational goods and vehicles
28. Missouri
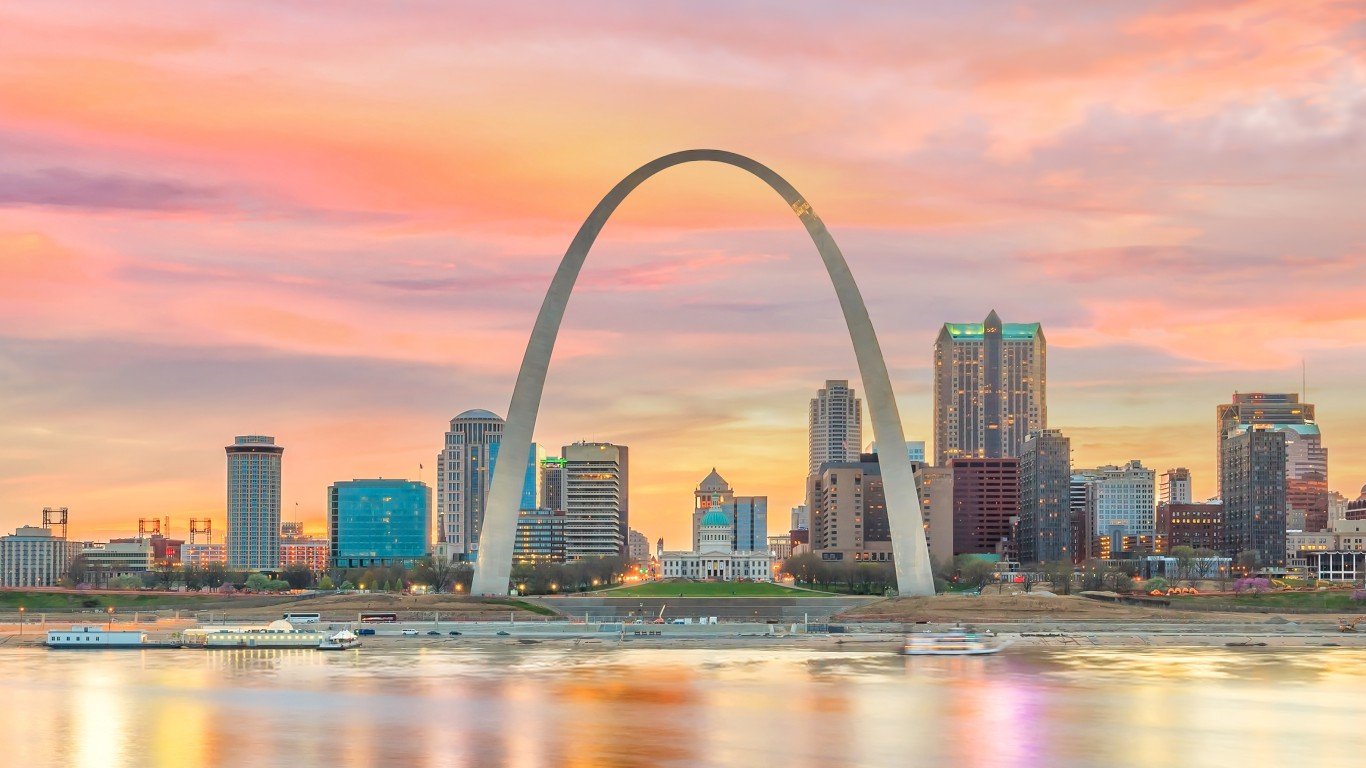
- Personal transportation services expenditure, adjusted for population: $1,618 per capita
- Cost of living: -8.2% less than national average
- Total transportation services expenditure: $10.0 billion
- Total population: 6.2 million
- Other major spending categories: Gasoline and other energy goods, motor vehicles and parts, financial services and insurance, health care, recreation services
27. South Dakota
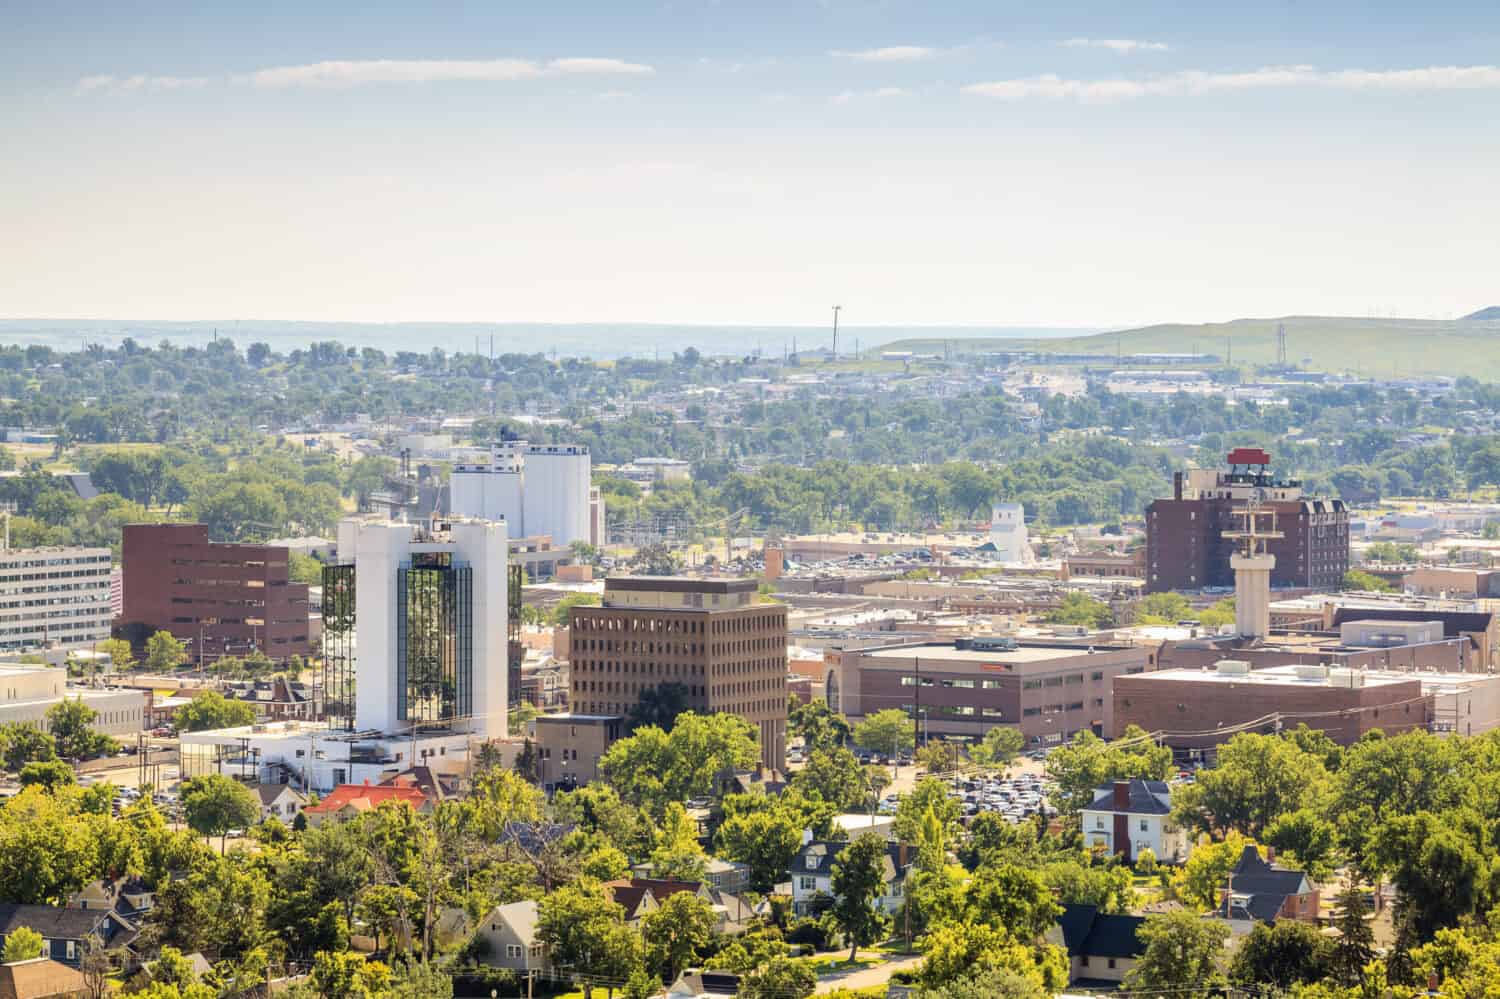
- Personal transportation services expenditure, adjusted for population: $1,618 per capita
- Cost of living: -11.9% less than national average
- Total transportation services expenditure: $1.5 billion
- Total population: 919,318
- Other major spending categories: Health care, furnishings and durable household equipment, recreation services, clothing and footwear, food services and accommodations
26. Maine
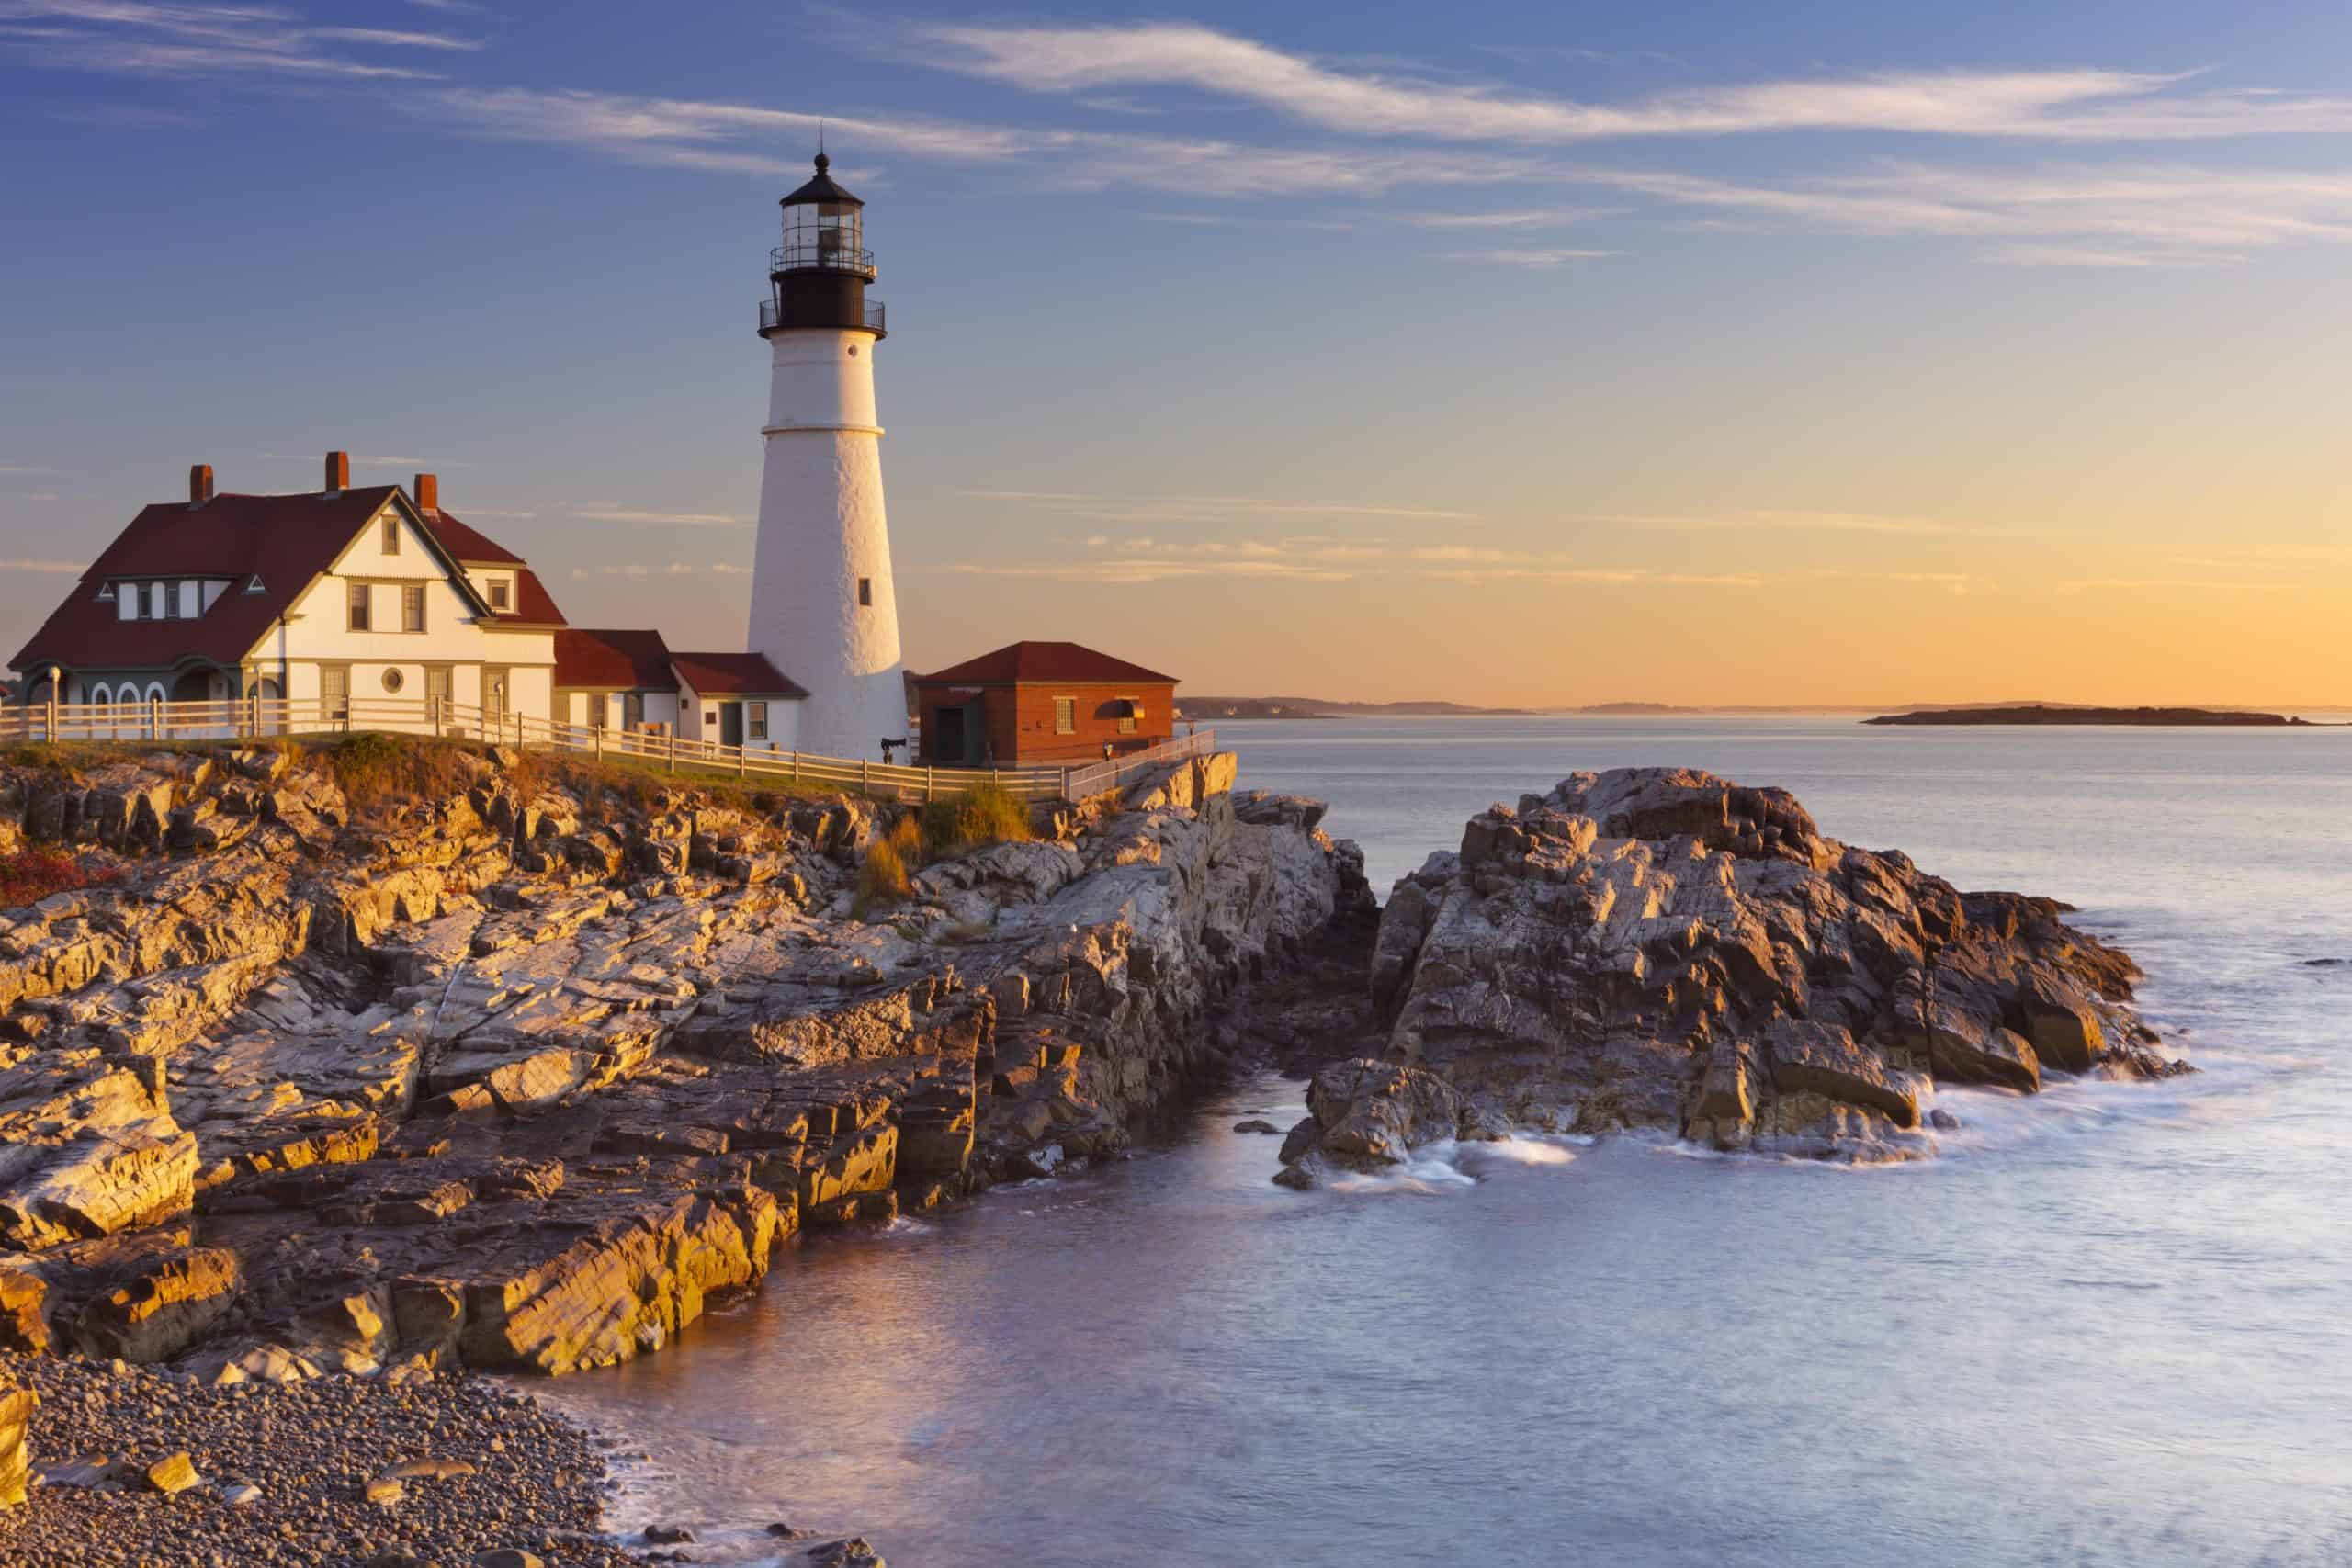
- Personal transportation services expenditure, adjusted for population: $1,625 per capita
- Cost of living: -2.9% less than national average
- Total transportation services expenditure: $2.3 billion
- Total population: 1.4 million
- Other major spending categories: Groceries, gasoline and other energy goods, recreation services, food services and accommodations, motor vehicles and parts, health care
25. Virginia

- Personal transportation services expenditure, adjusted for population: $1,635 per capita
- Cost of living: +0.7% more than national average
- Total transportation services expenditure: $14.3 billion
- Total population: 8.7 million
- Other major spending categories: Recreation services, clothing and footwear, housing and utilities, recreational goods and vehicles, groceries, food services and accommodations
24. Nebraska
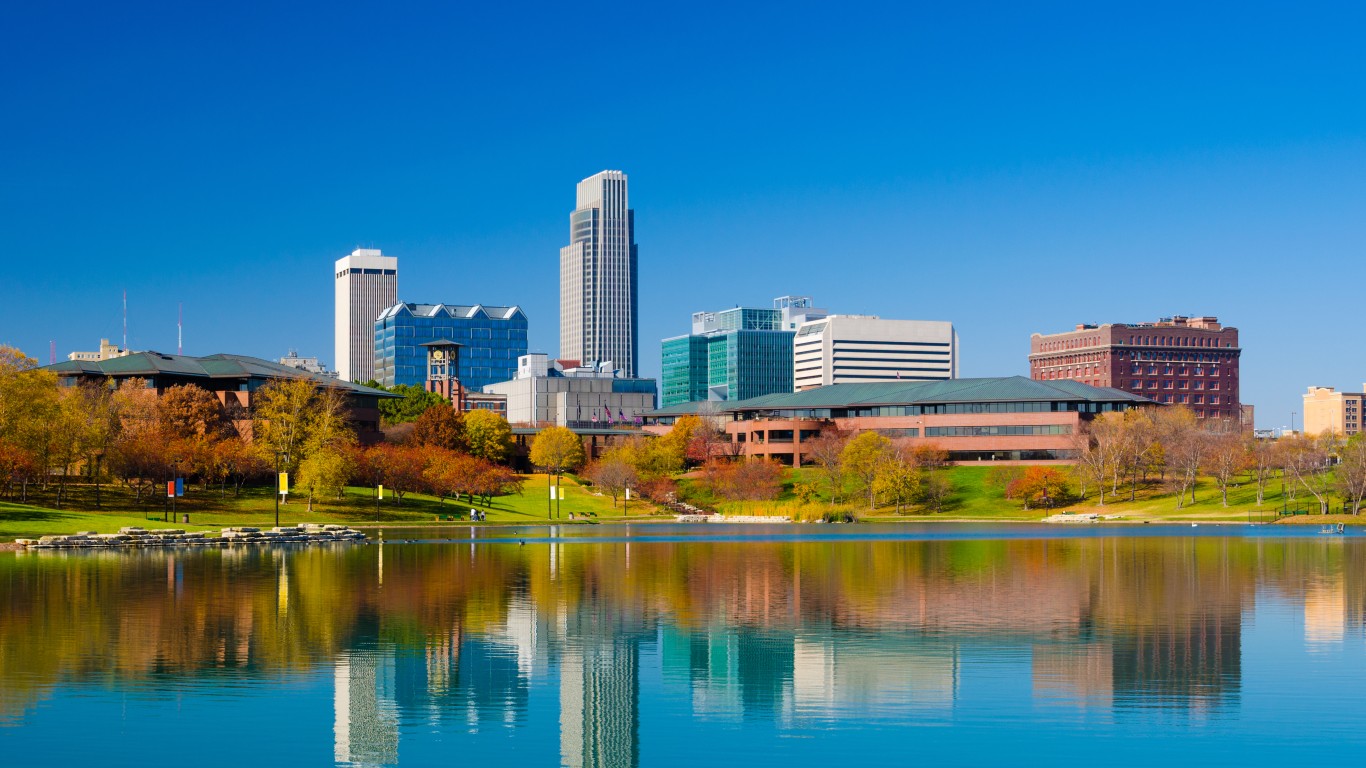
- Personal transportation services expenditure, adjusted for population: $1,716 per capita
- Cost of living: -9.6% less than national average
- Total transportation services expenditure: $3.4 billion
- Total population: 2.0 million
- Other major spending categories: Motor vehicles and parts, gasoline and other energy goods, financial services and insurance, health care, recreational goods and vehicles
23. Minnesota
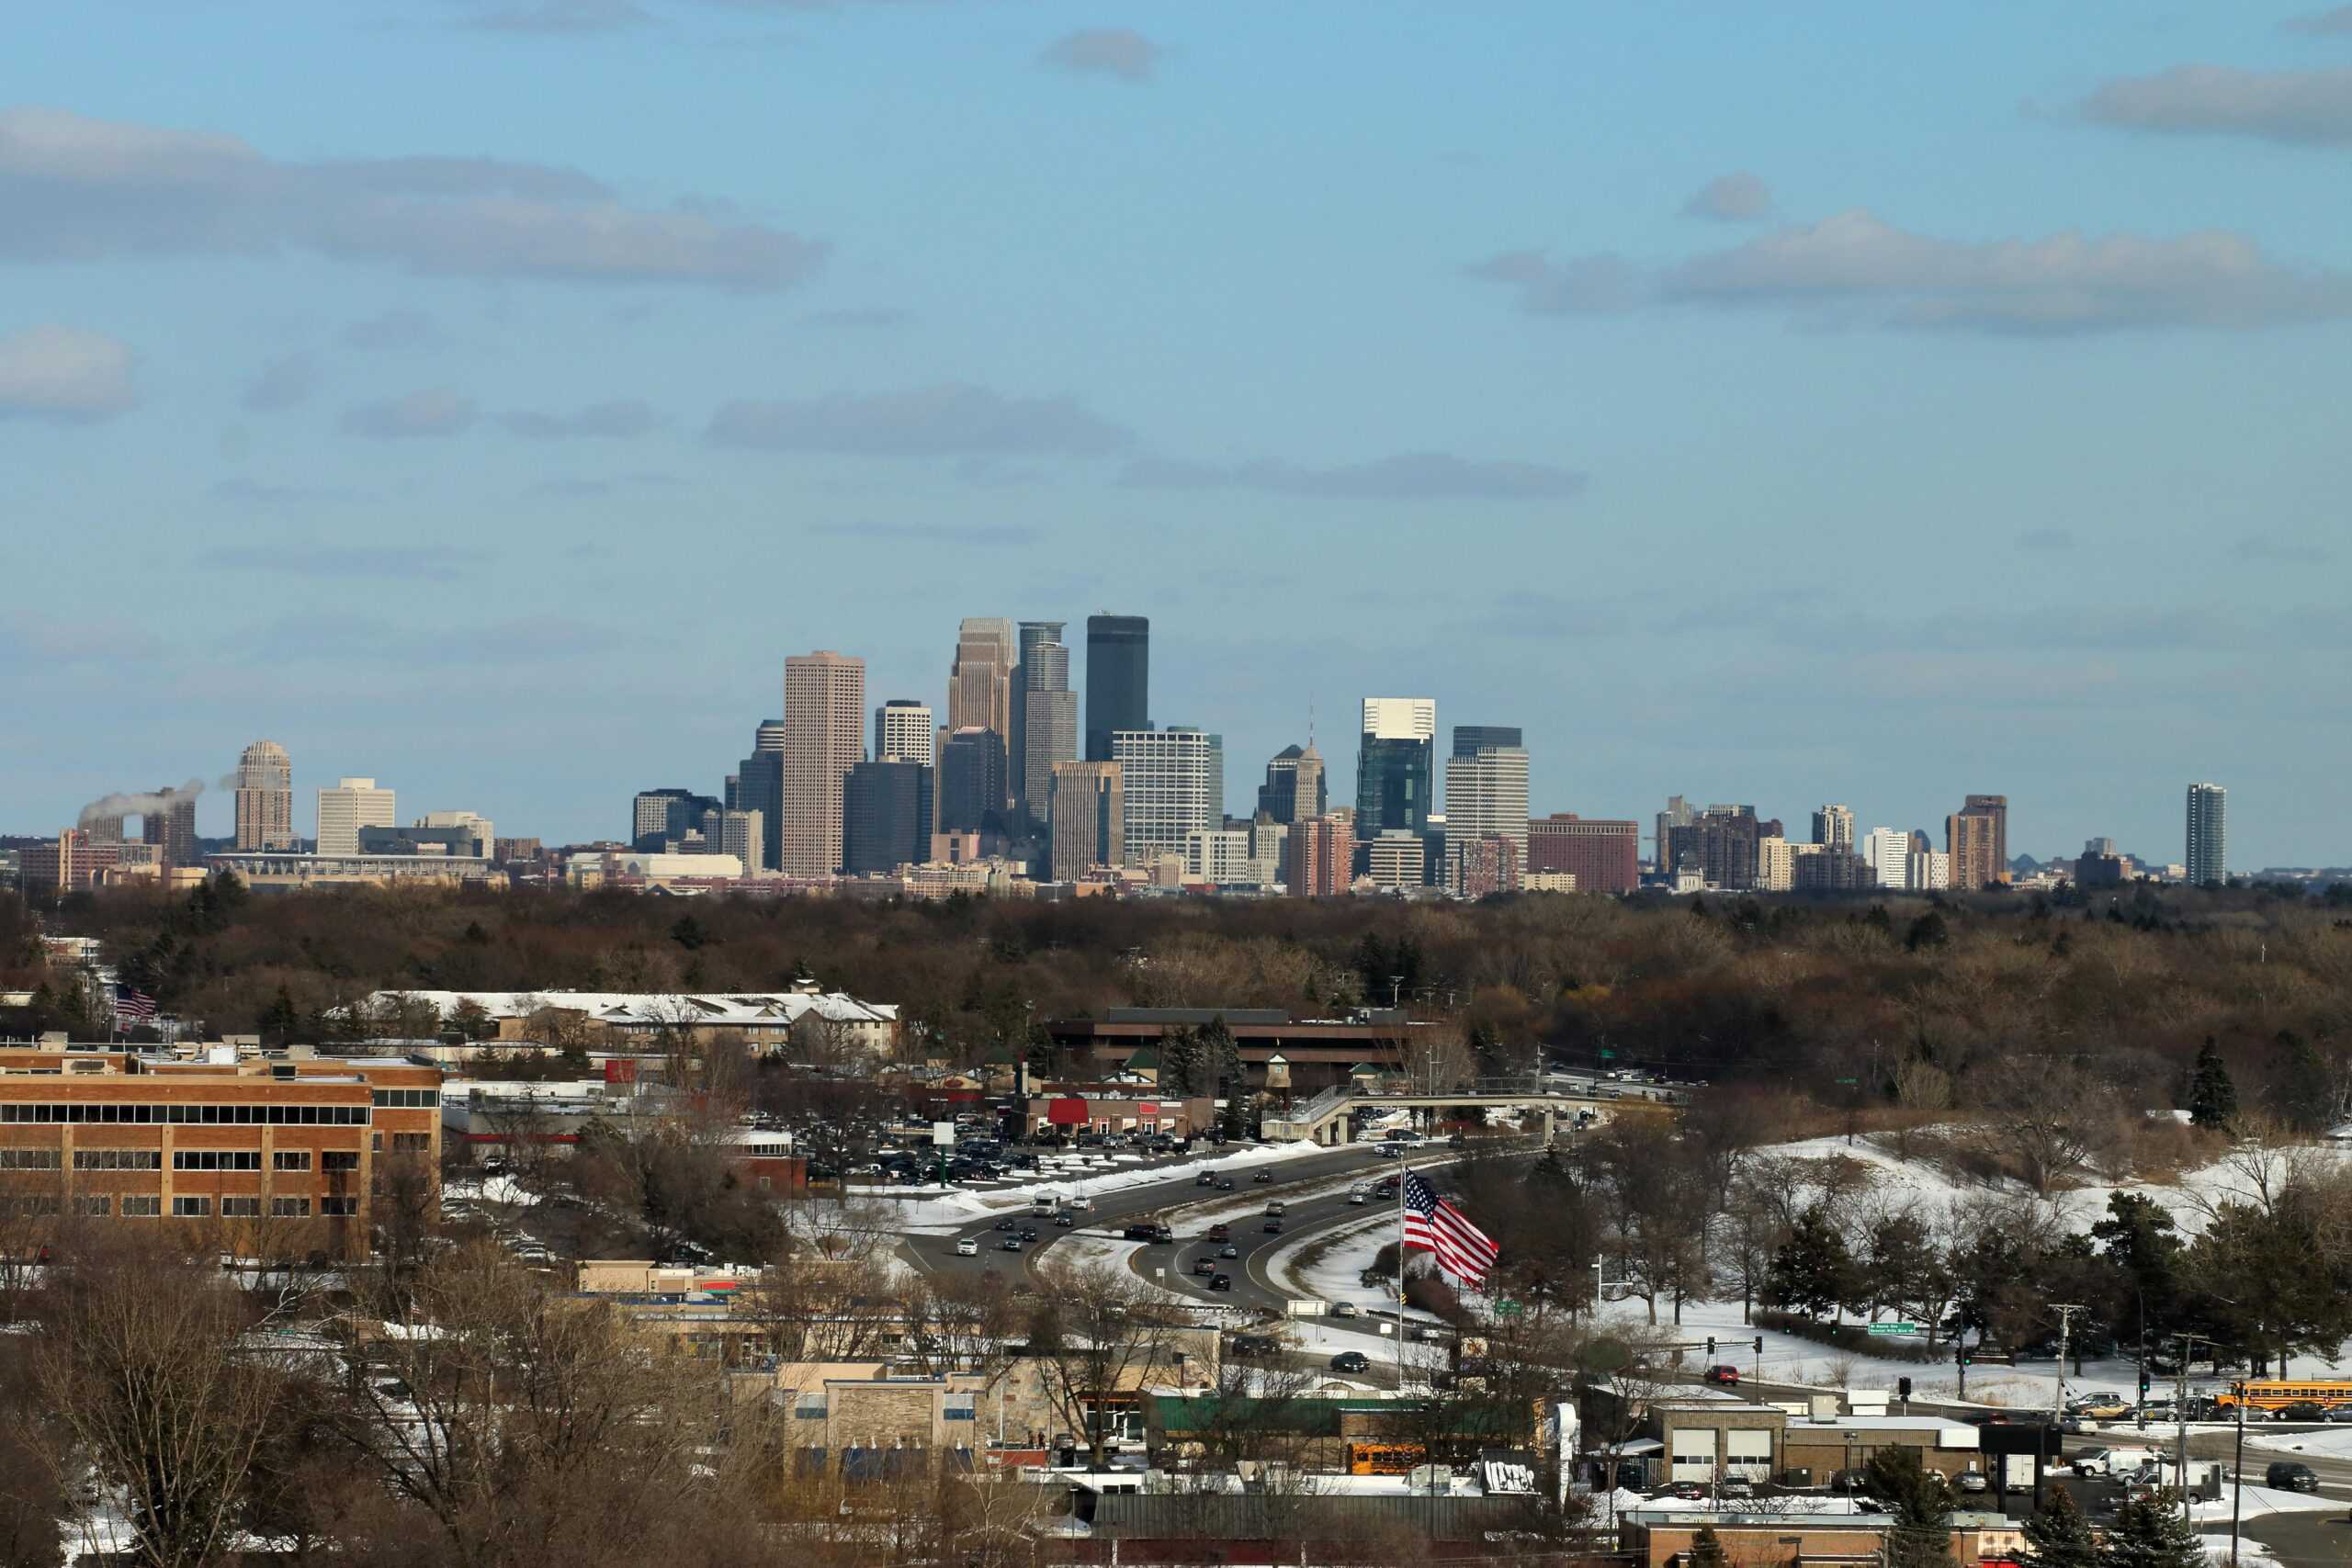
- Personal transportation services expenditure, adjusted for population: $1,741 per capita
- Cost of living: -1.6% less than national average
- Total transportation services expenditure: $10.0 billion
- Total population: 5.7 million
- Other major spending categories: Recreational goods and vehicles, motor vehicles and parts, financial services and insurance, health care, gasoline and other energy goods, clothing and footwear
22. Utah
- Personal transportation services expenditure, adjusted for population: $1,763 per capita
- Cost of living: -5.0% less than national average
- Total transportation services expenditure: $6.0 billion
- Total population: 3.4 million
- Other major spending categories: Recreational goods and vehicles, furnishings and durable household equipment, motor vehicles and parts, gasoline and other energy goods, housing and utilities
21. Maryland

- Personal transportation services expenditure, adjusted for population: $1,780 per capita
- Cost of living: +4.0% more than national average
- Total transportation services expenditure: $11.0 billion
- Total population: 6.2 million
- Other major spending categories: Clothing and footwear, housing and utilities, recreation services, recreational goods and vehicles, food services and accommodations
20. Oregon
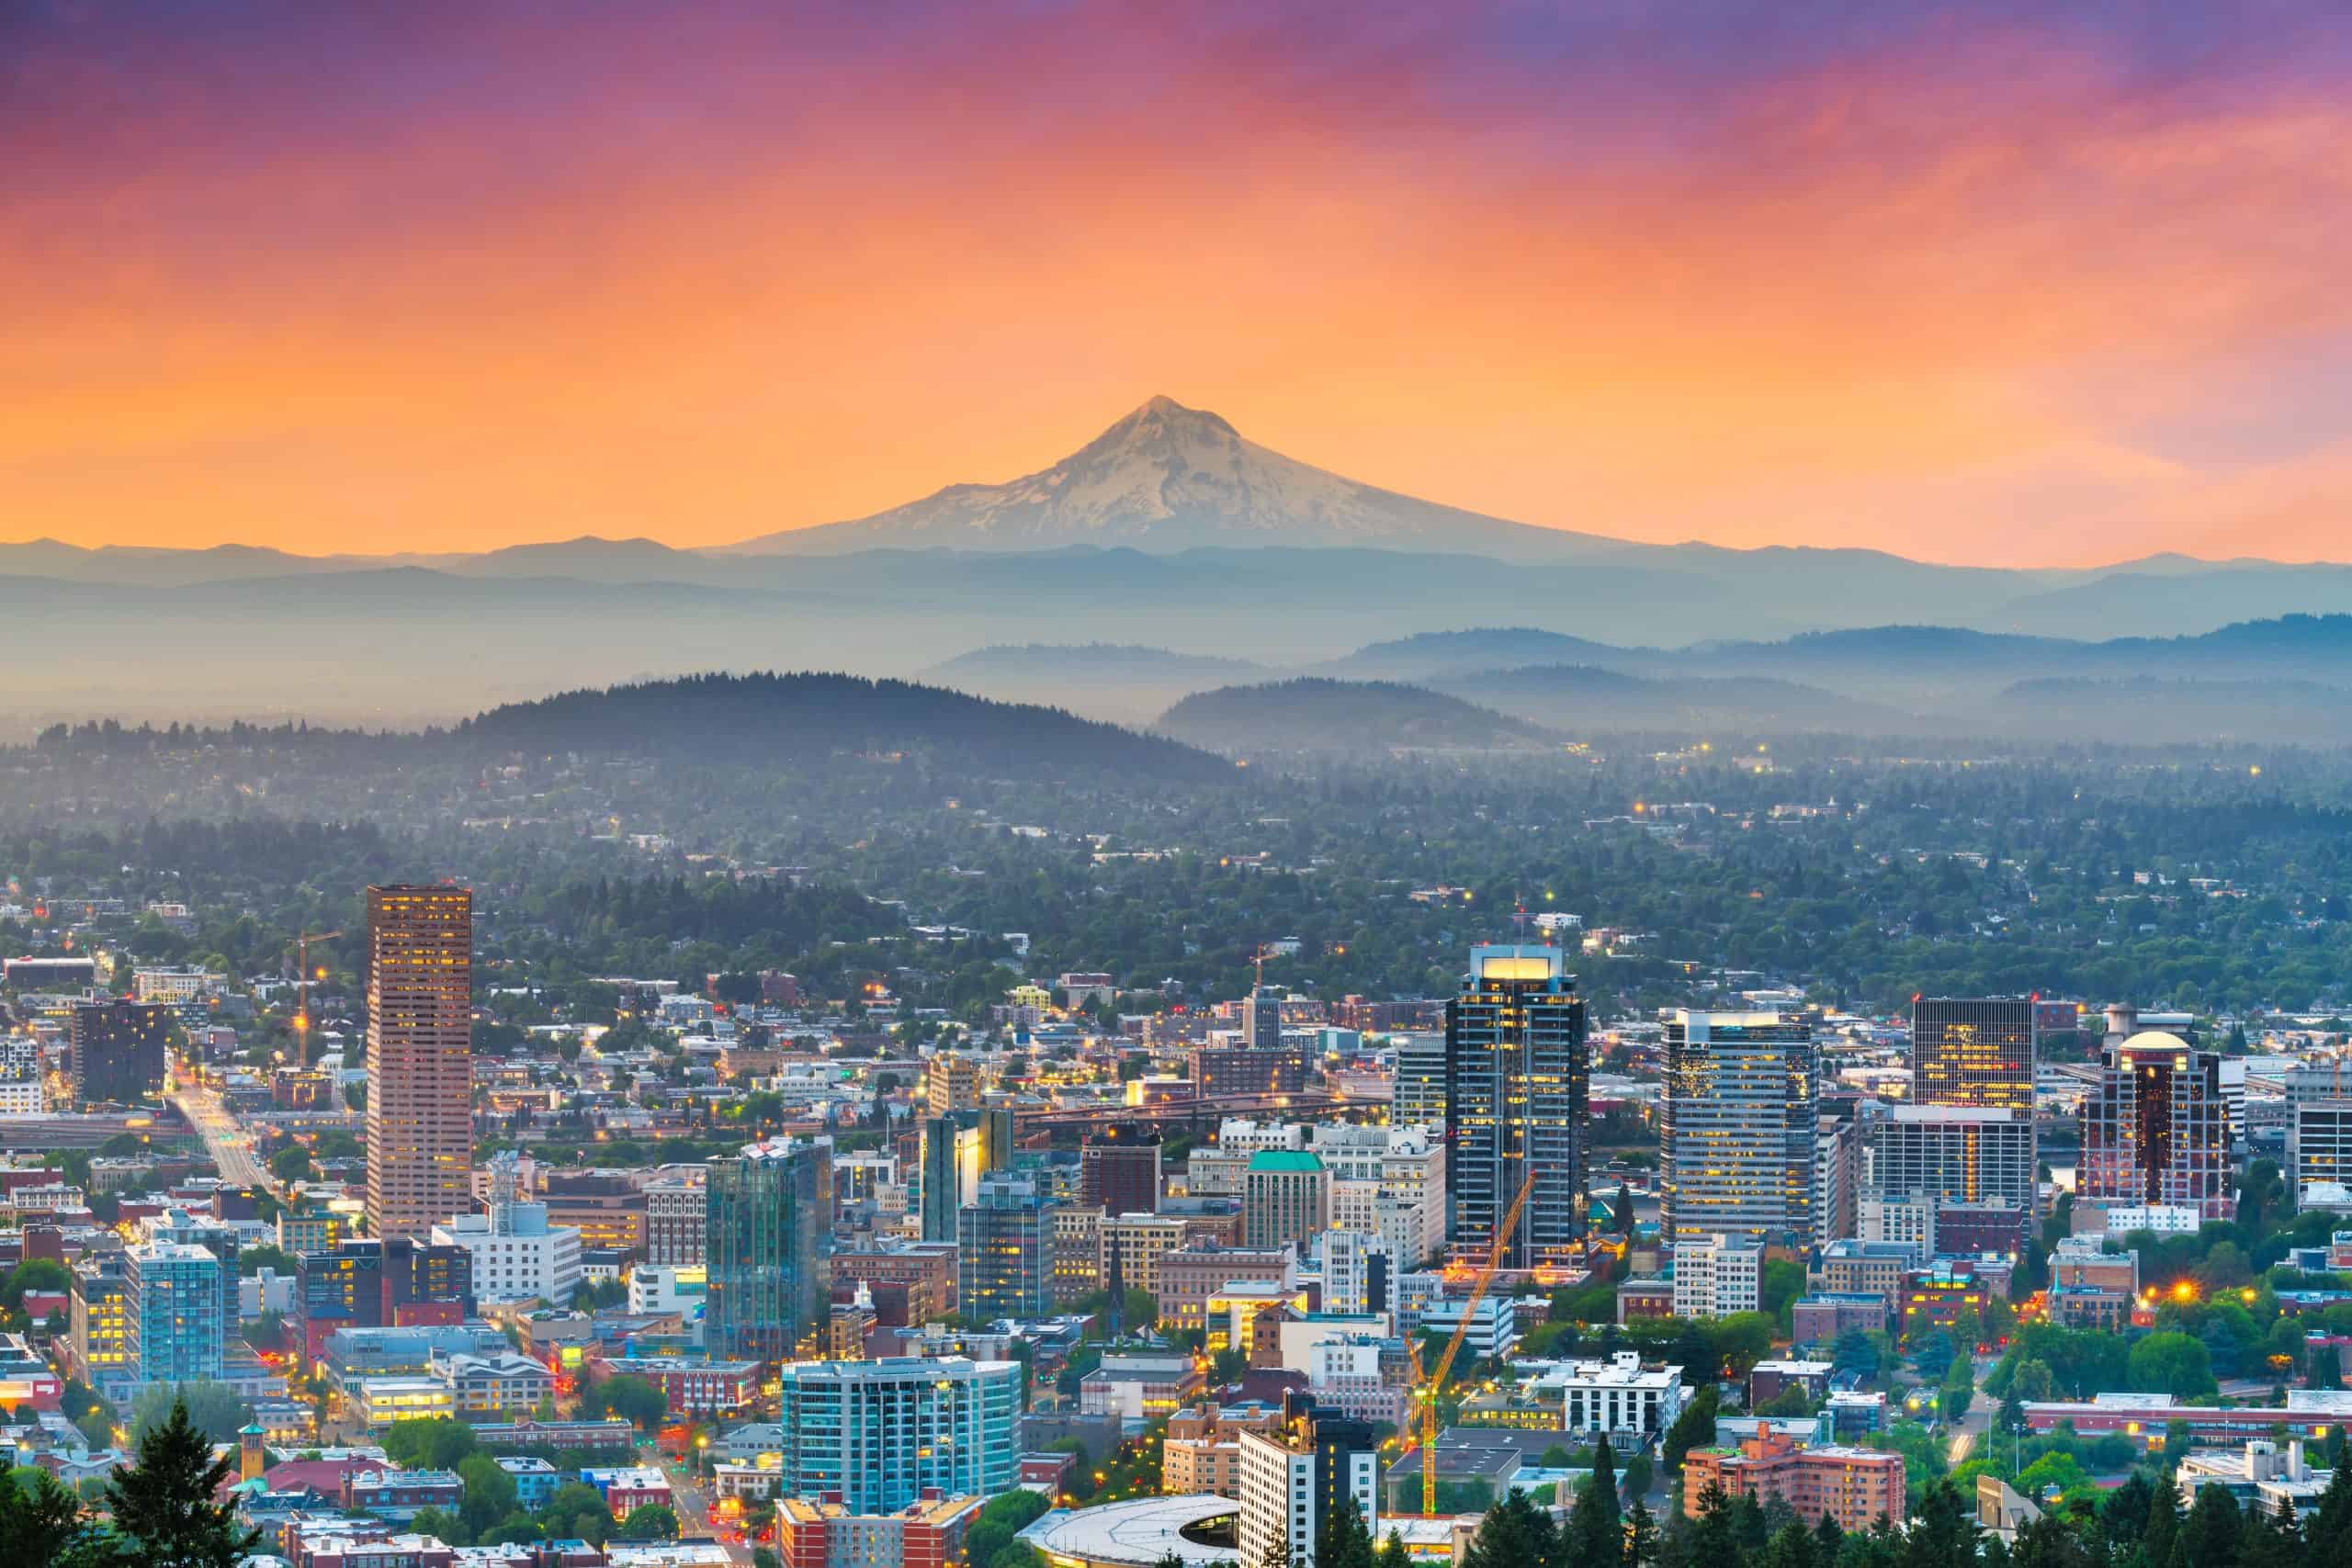
- Personal transportation services expenditure, adjusted for population: $1,808 per capita
- Cost of living: +4.7% more than national average
- Total transportation services expenditure: $7.7 billion
- Total population: 4.2 million
- Other major spending categories: Furnishings and durable household equipment, recreational goods and vehicles, groceries, clothing and footwear, food services and accommodations, housing and utilities
19. North Dakota
- Personal transportation services expenditure, adjusted for population: $1,822 per capita
- Cost of living: -11.4% less than national average
- Total transportation services expenditure: $1.4 billion
- Total population: 783,926
- Other major spending categories: Recreational goods and vehicles, health care, financial services and insurance, motor vehicles and parts, clothing and footwear, furnishings and durable household equipment
18. Vermont
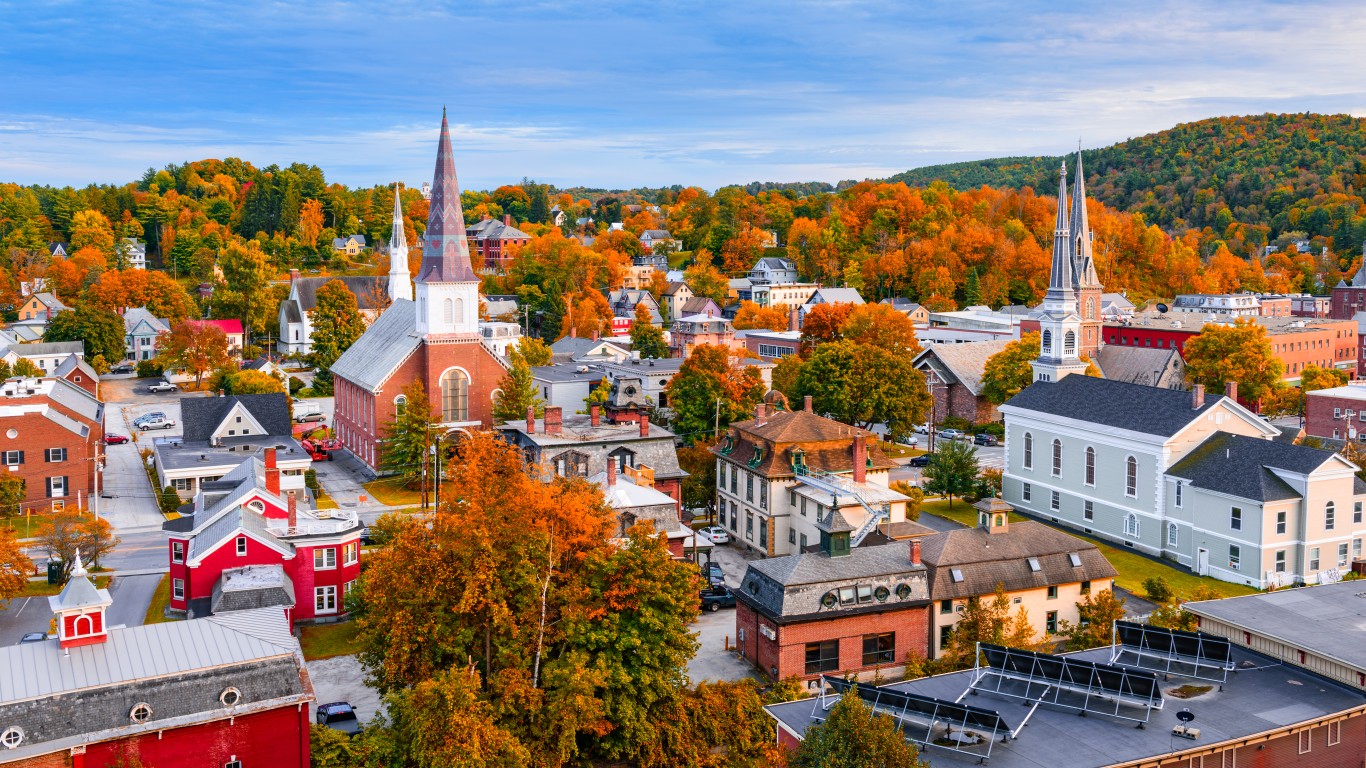
- Personal transportation services expenditure, adjusted for population: $1,824 per capita
- Cost of living: -3.4% less than national average
- Total transportation services expenditure: $1.2 billion
- Total population: 647,464
- Other major spending categories: Groceries, motor vehicles and parts, health care, food services and accommodations, recreation services, gasoline and other energy goods
17. New Jersey
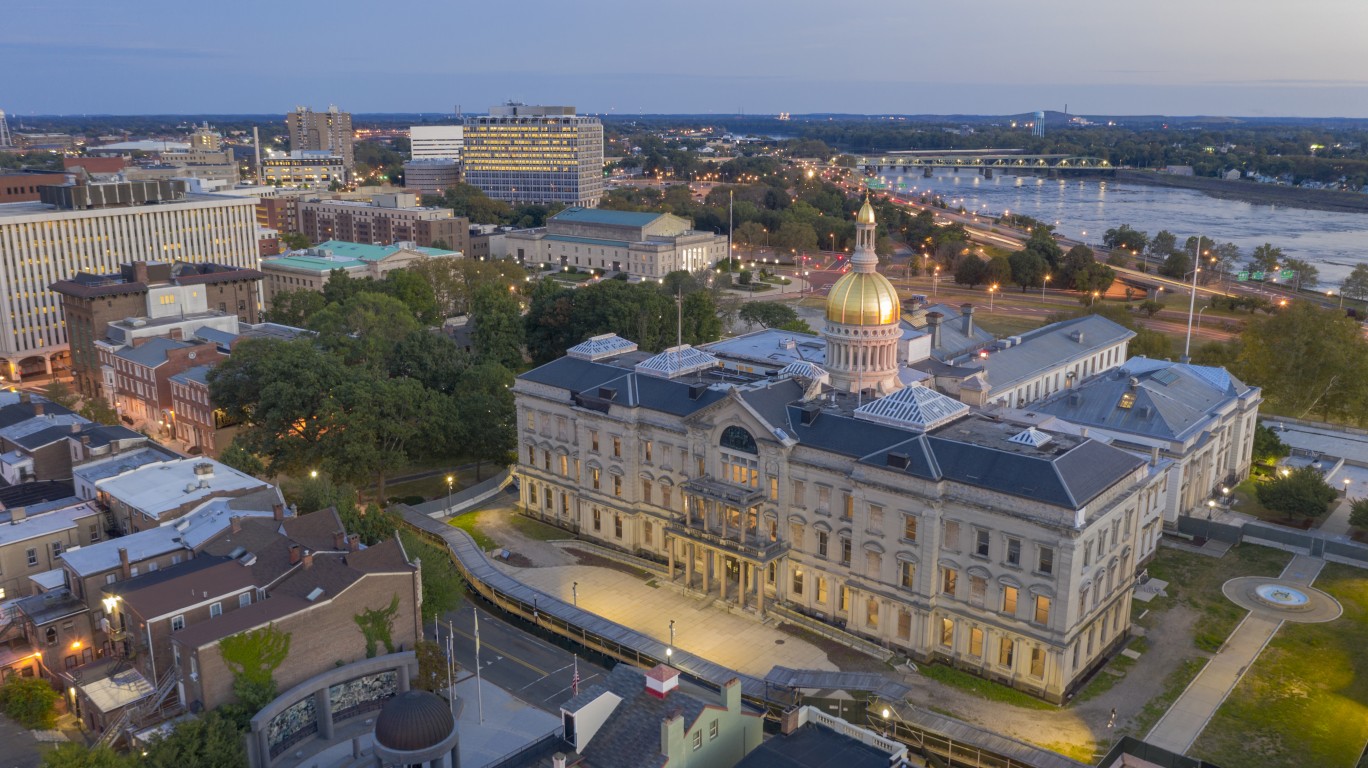
- Personal transportation services expenditure, adjusted for population: $1,857 per capita
- Cost of living: +8.9% more than national average
- Total transportation services expenditure: $17.3 billion
- Total population: 9.3 million
- Other major spending categories: Clothing and footwear, furnishings and durable household equipment, housing and utilities, financial services and insurance, recreation services, health care
16. Georgia
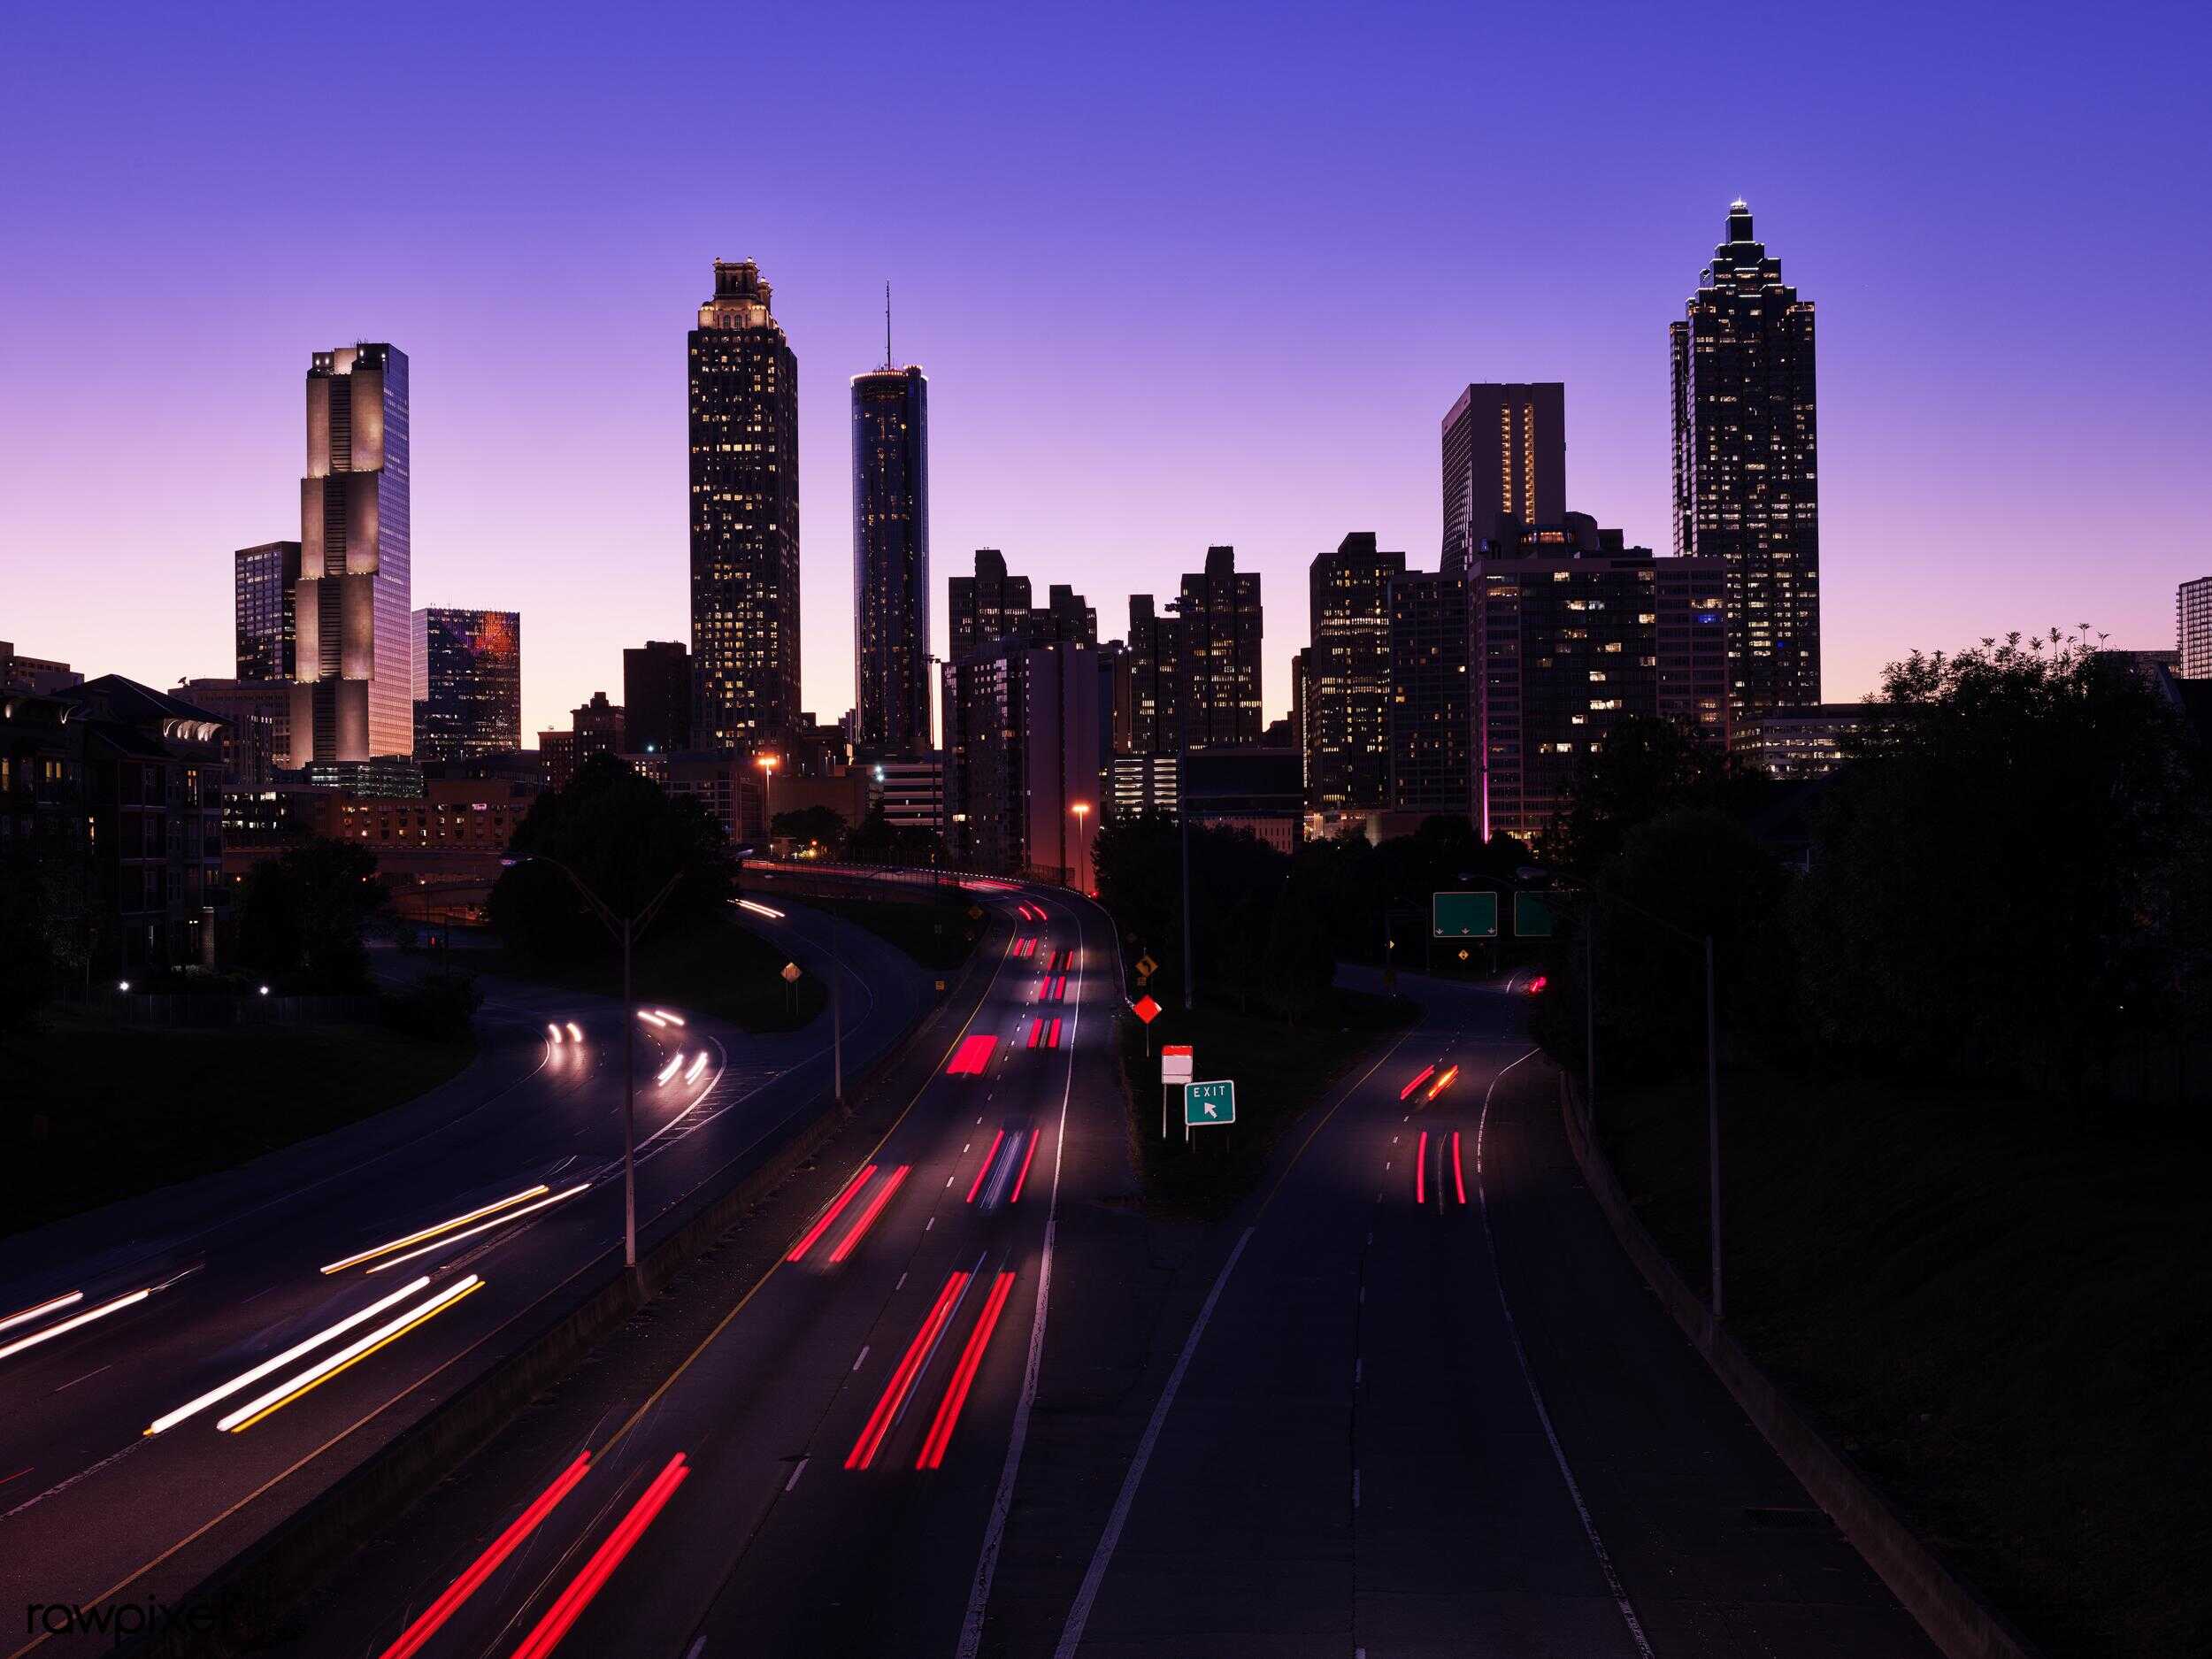
- Personal transportation services expenditure, adjusted for population: $1,895 per capita
- Cost of living: -3.3% less than national average
- Total transportation services expenditure: $20.9 billion
- Total population: 11.0 million
- Other major spending categories: Clothing and footwear, groceries, motor vehicles and parts, gasoline and other energy goods, recreation services
15. New Hampshire

- Personal transportation services expenditure, adjusted for population: $1,917 per capita
- Cost of living: +5.3% more than national average
- Total transportation services expenditure: $2.7 billion
- Total population: 1.4 million
- Other major spending categories: Motor vehicles and parts, groceries, furnishings and durable household equipment, financial services and insurance, housing and utilities, clothing and footwear
14. Florida
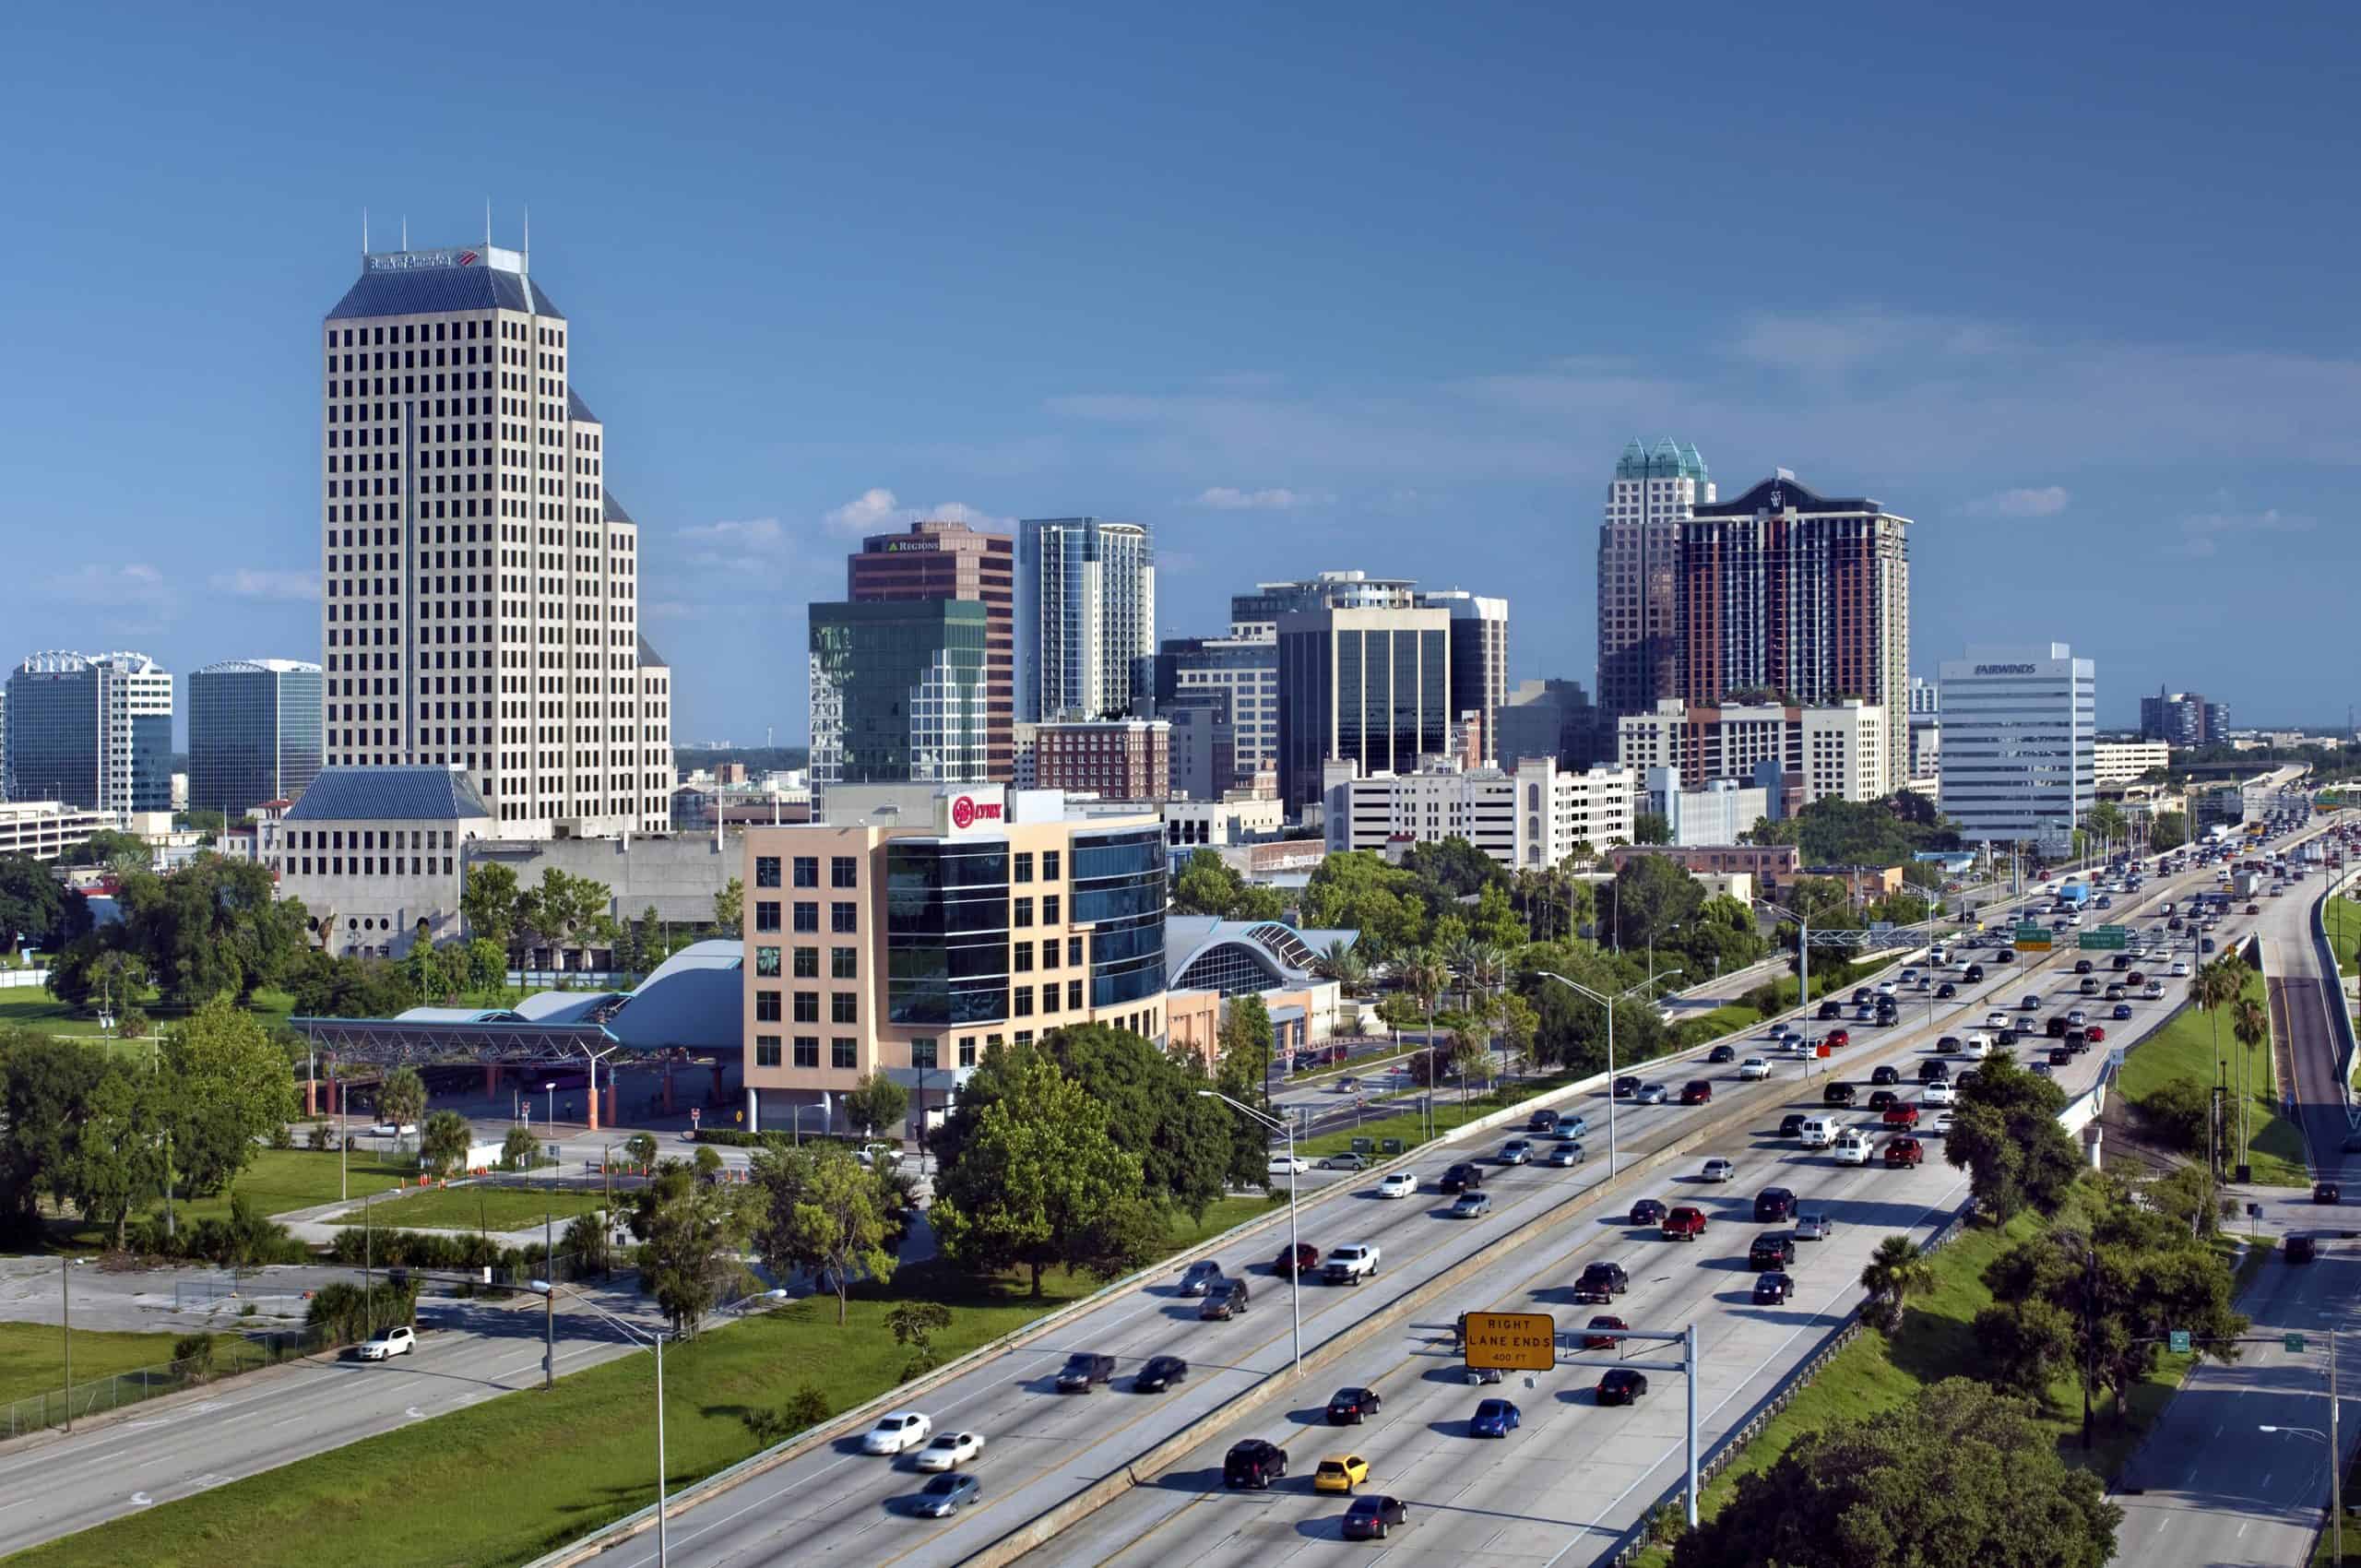
- Personal transportation services expenditure, adjusted for population: $2,055 per capita
- Cost of living: +3.5% more than national average
- Total transportation services expenditure: $46.5 billion
- Total population: 22.6 million
- Other major spending categories: Furnishings and durable household equipment, housing and utilities, financial services and insurance, food services and accommodations, recreational goods and vehicles, groceries
13. Montana
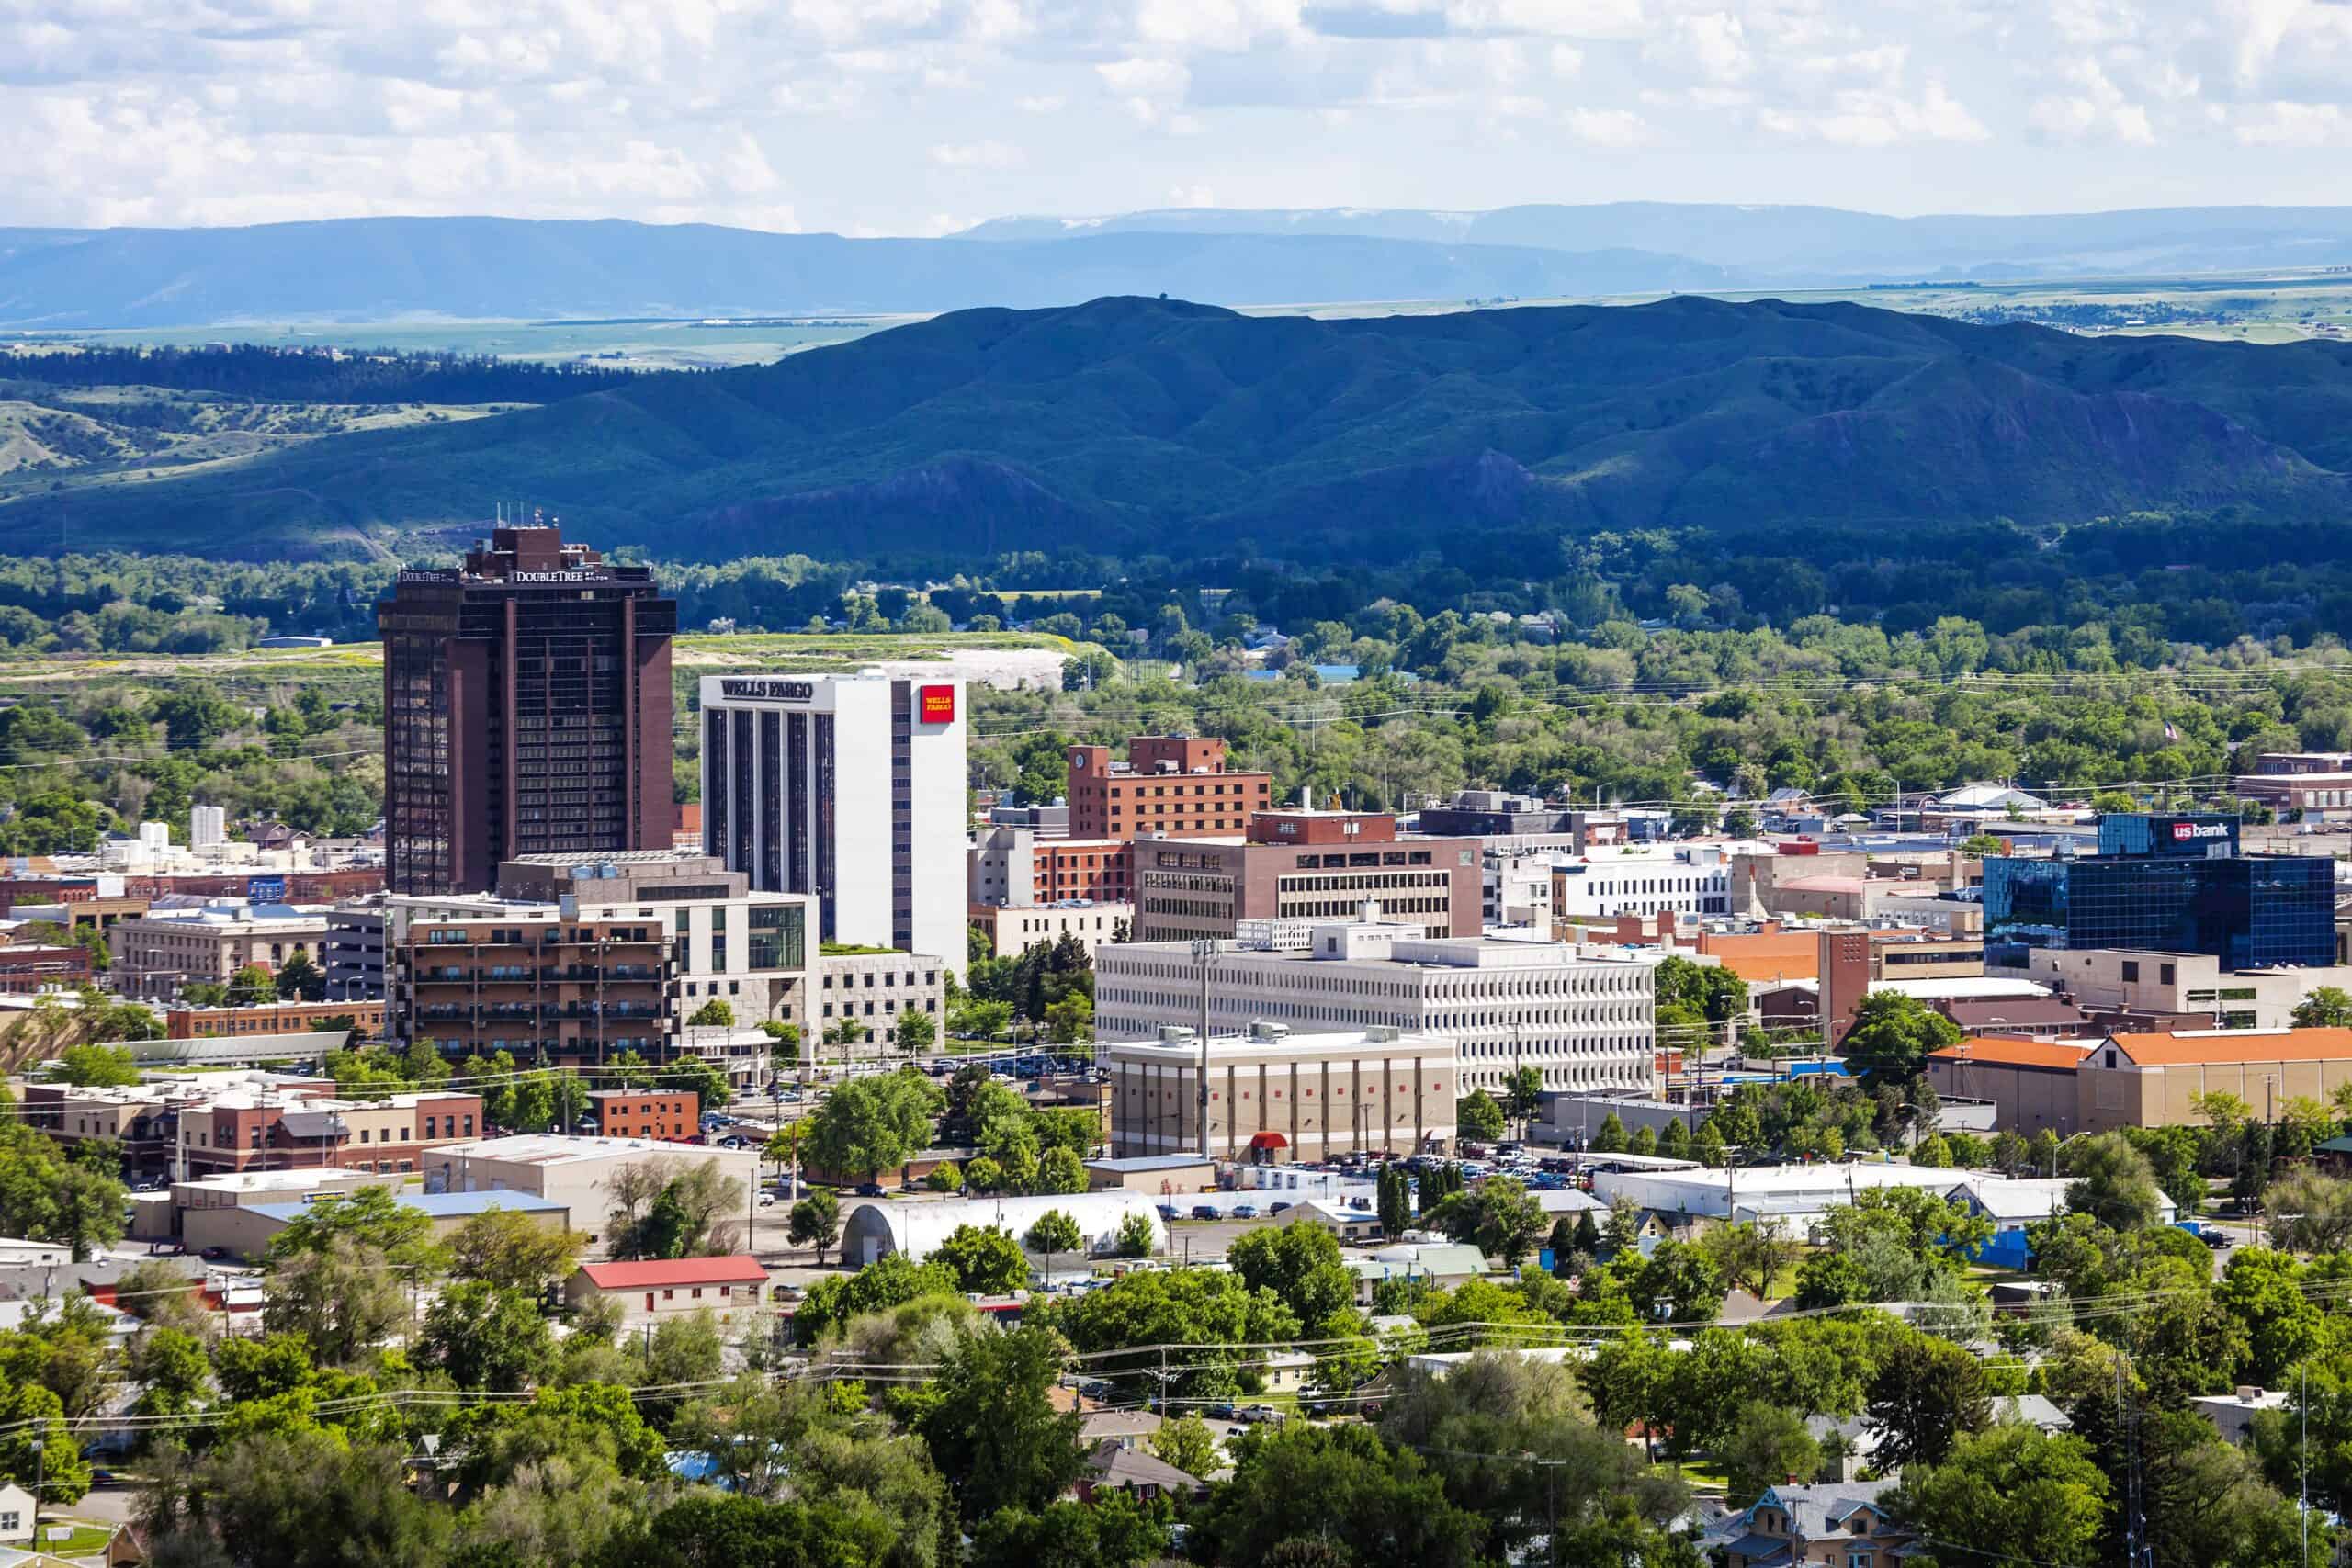
- Personal transportation services expenditure, adjusted for population: $2,114 per capita
- Cost of living: -9.8% less than national average
- Total transportation services expenditure: $2.4 billion
- Total population: 1.1 million
- Other major spending categories: Motor vehicles and parts, groceries, recreation services, gasoline and other energy goods, recreational goods and vehicles
12. Wyoming

- Personal transportation services expenditure, adjusted for population: $2,130 per capita
- Cost of living: -9.2% less than national average
- Total transportation services expenditure: $1.2 billion
- Total population: 584,057
- Other major spending categories: Financial services and insurance, clothing and footwear, motor vehicles and parts, gasoline and other energy goods, groceries
11. Arizona
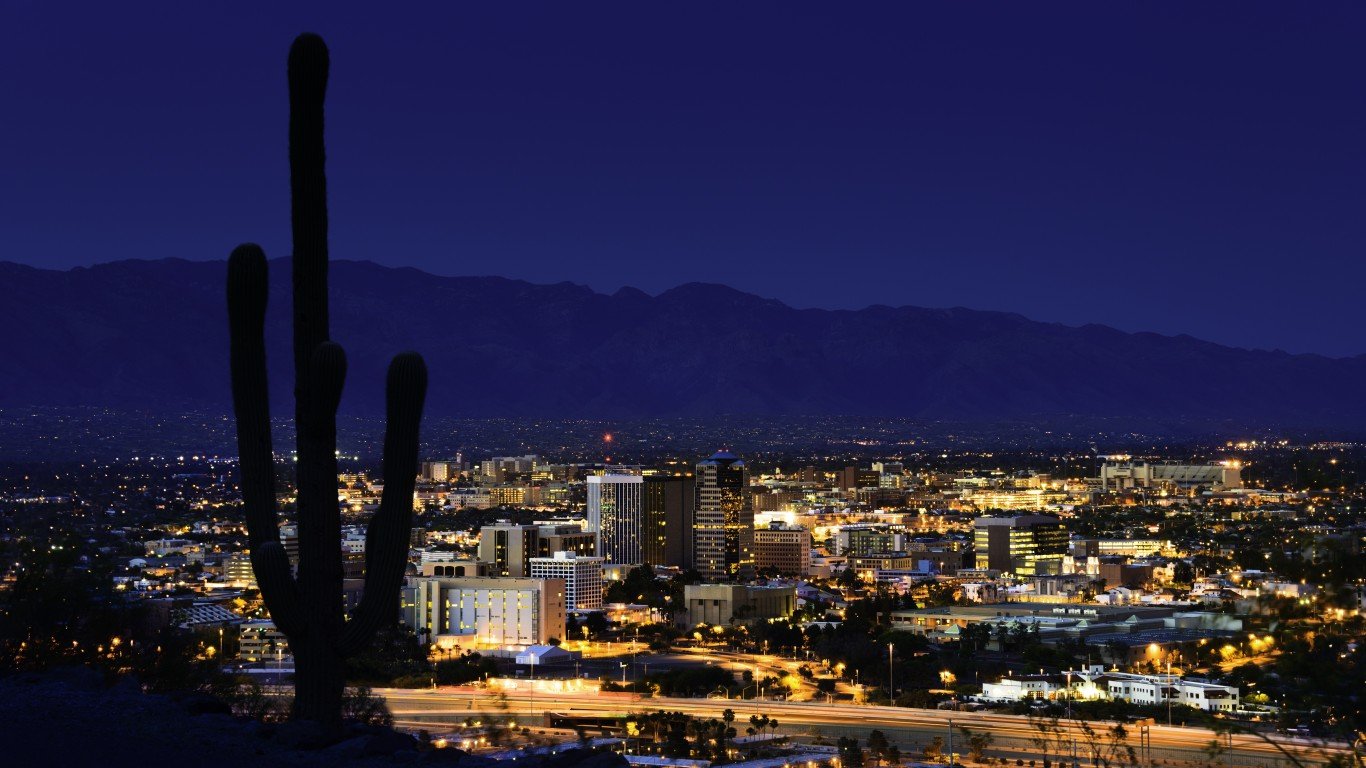
- Personal transportation services expenditure, adjusted for population: $2,195 per capita
- Cost of living: +1.1% more than national average
- Total transportation services expenditure: $16.3 billion
- Total population: 7.4 million
- Other major spending categories: Housing and utilities, food services and accommodations, furnishings and durable household equipment, motor vehicles and parts, recreation services
10. Hawaii

- Personal transportation services expenditure, adjusted for population: $2,225 per capita
- Cost of living: +8.6% more than national average
- Total transportation services expenditure: $3.2 billion
- Total population: 1.4 million
- Other major spending categories: Groceries, food services and accommodations, housing and utilities, recreation services, clothing and footwear
9. New York

- Personal transportation services expenditure, adjusted for population: $2,295 per capita
- Cost of living: +7.6% more than national average
- Total transportation services expenditure: $44.9 billion
- Total population: 19.6 million
- Other major spending categories: Clothing and footwear, health care, financial services and insurance, food services and accommodations, housing and utilities
8. Illinois

- Personal transportation services expenditure, adjusted for population: $2,328 per capita
- Cost of living: -1.1% less than national average
- Total transportation services expenditure: $29.2 billion
- Total population: 12.5 million
- Other major spending categories: Clothing and footwear, recreational goods and vehicles, financial services and insurance, food services and accommodations, furnishings and durable household equipment
7. Rhode Island

- Personal transportation services expenditure, adjusted for population: $2,328 per capita
- Cost of living: +1.4% more than national average
- Total transportation services expenditure: $2.6 billion
- Total population: 1.1 million
- Other major spending categories: Food services and accommodations, recreation services, groceries, housing and utilities, health care
6. Colorado

- Personal transportation services expenditure, adjusted for population: $2,372 per capita
- Cost of living: +1.4% more than national average
- Total transportation services expenditure: $13.9 billion
- Total population: 5.9 million
- Other major spending categories: Furnishings and durable household equipment, recreation services, housing and utilities, food services and accommodations, recreational goods and vehicles, clothing and footwear
5. Connecticut

- Personal transportation services expenditure, adjusted for population: $2,393 per capita
- Cost of living: +3.7% more than national average
- Total transportation services expenditure: $8.7 billion
- Total population: 3.6 million
- Other major spending categories: Financial services and insurance, furnishings and durable household equipment, recreation services, housing and utilities, clothing and footwear
4. California
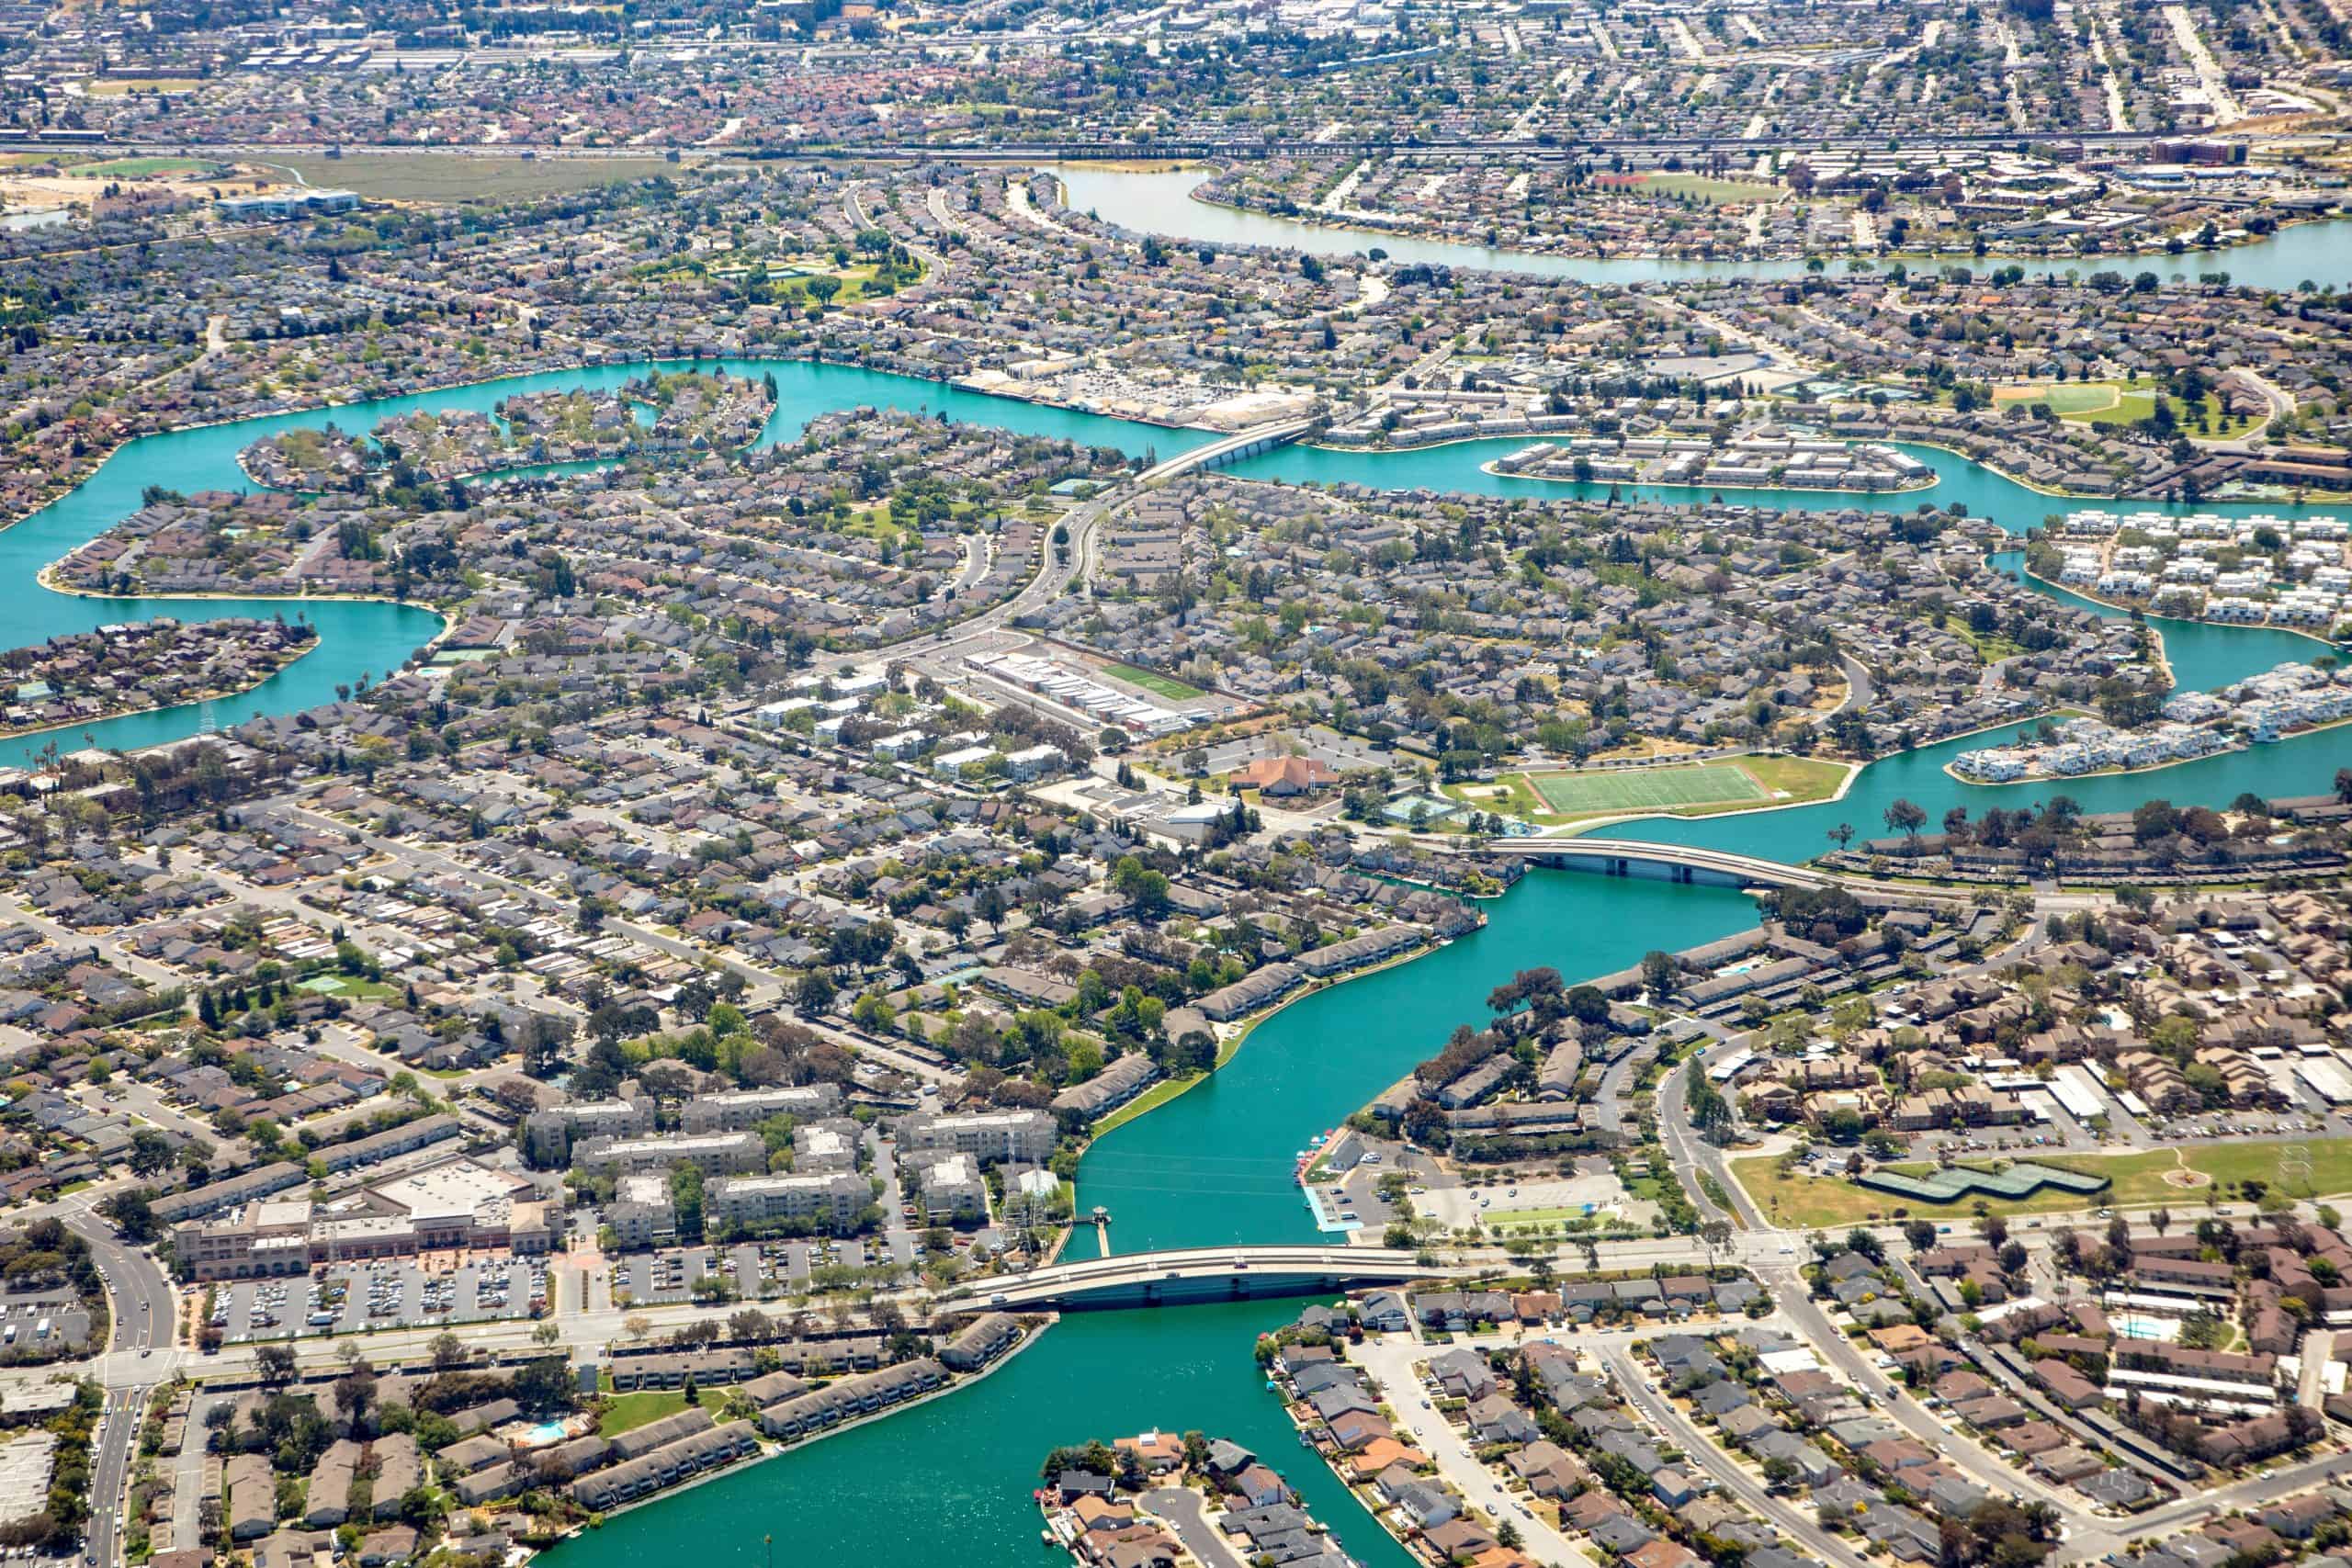
- Personal transportation services expenditure, adjusted for population: $2,464 per capita
- Cost of living: +12.6% more than national average
- Total transportation services expenditure: $96.0 billion
- Total population: 39.0 million
- Other major spending categories: Clothing and footwear, recreation services, food services and accommodations, housing and utilities, health care
3. Alaska
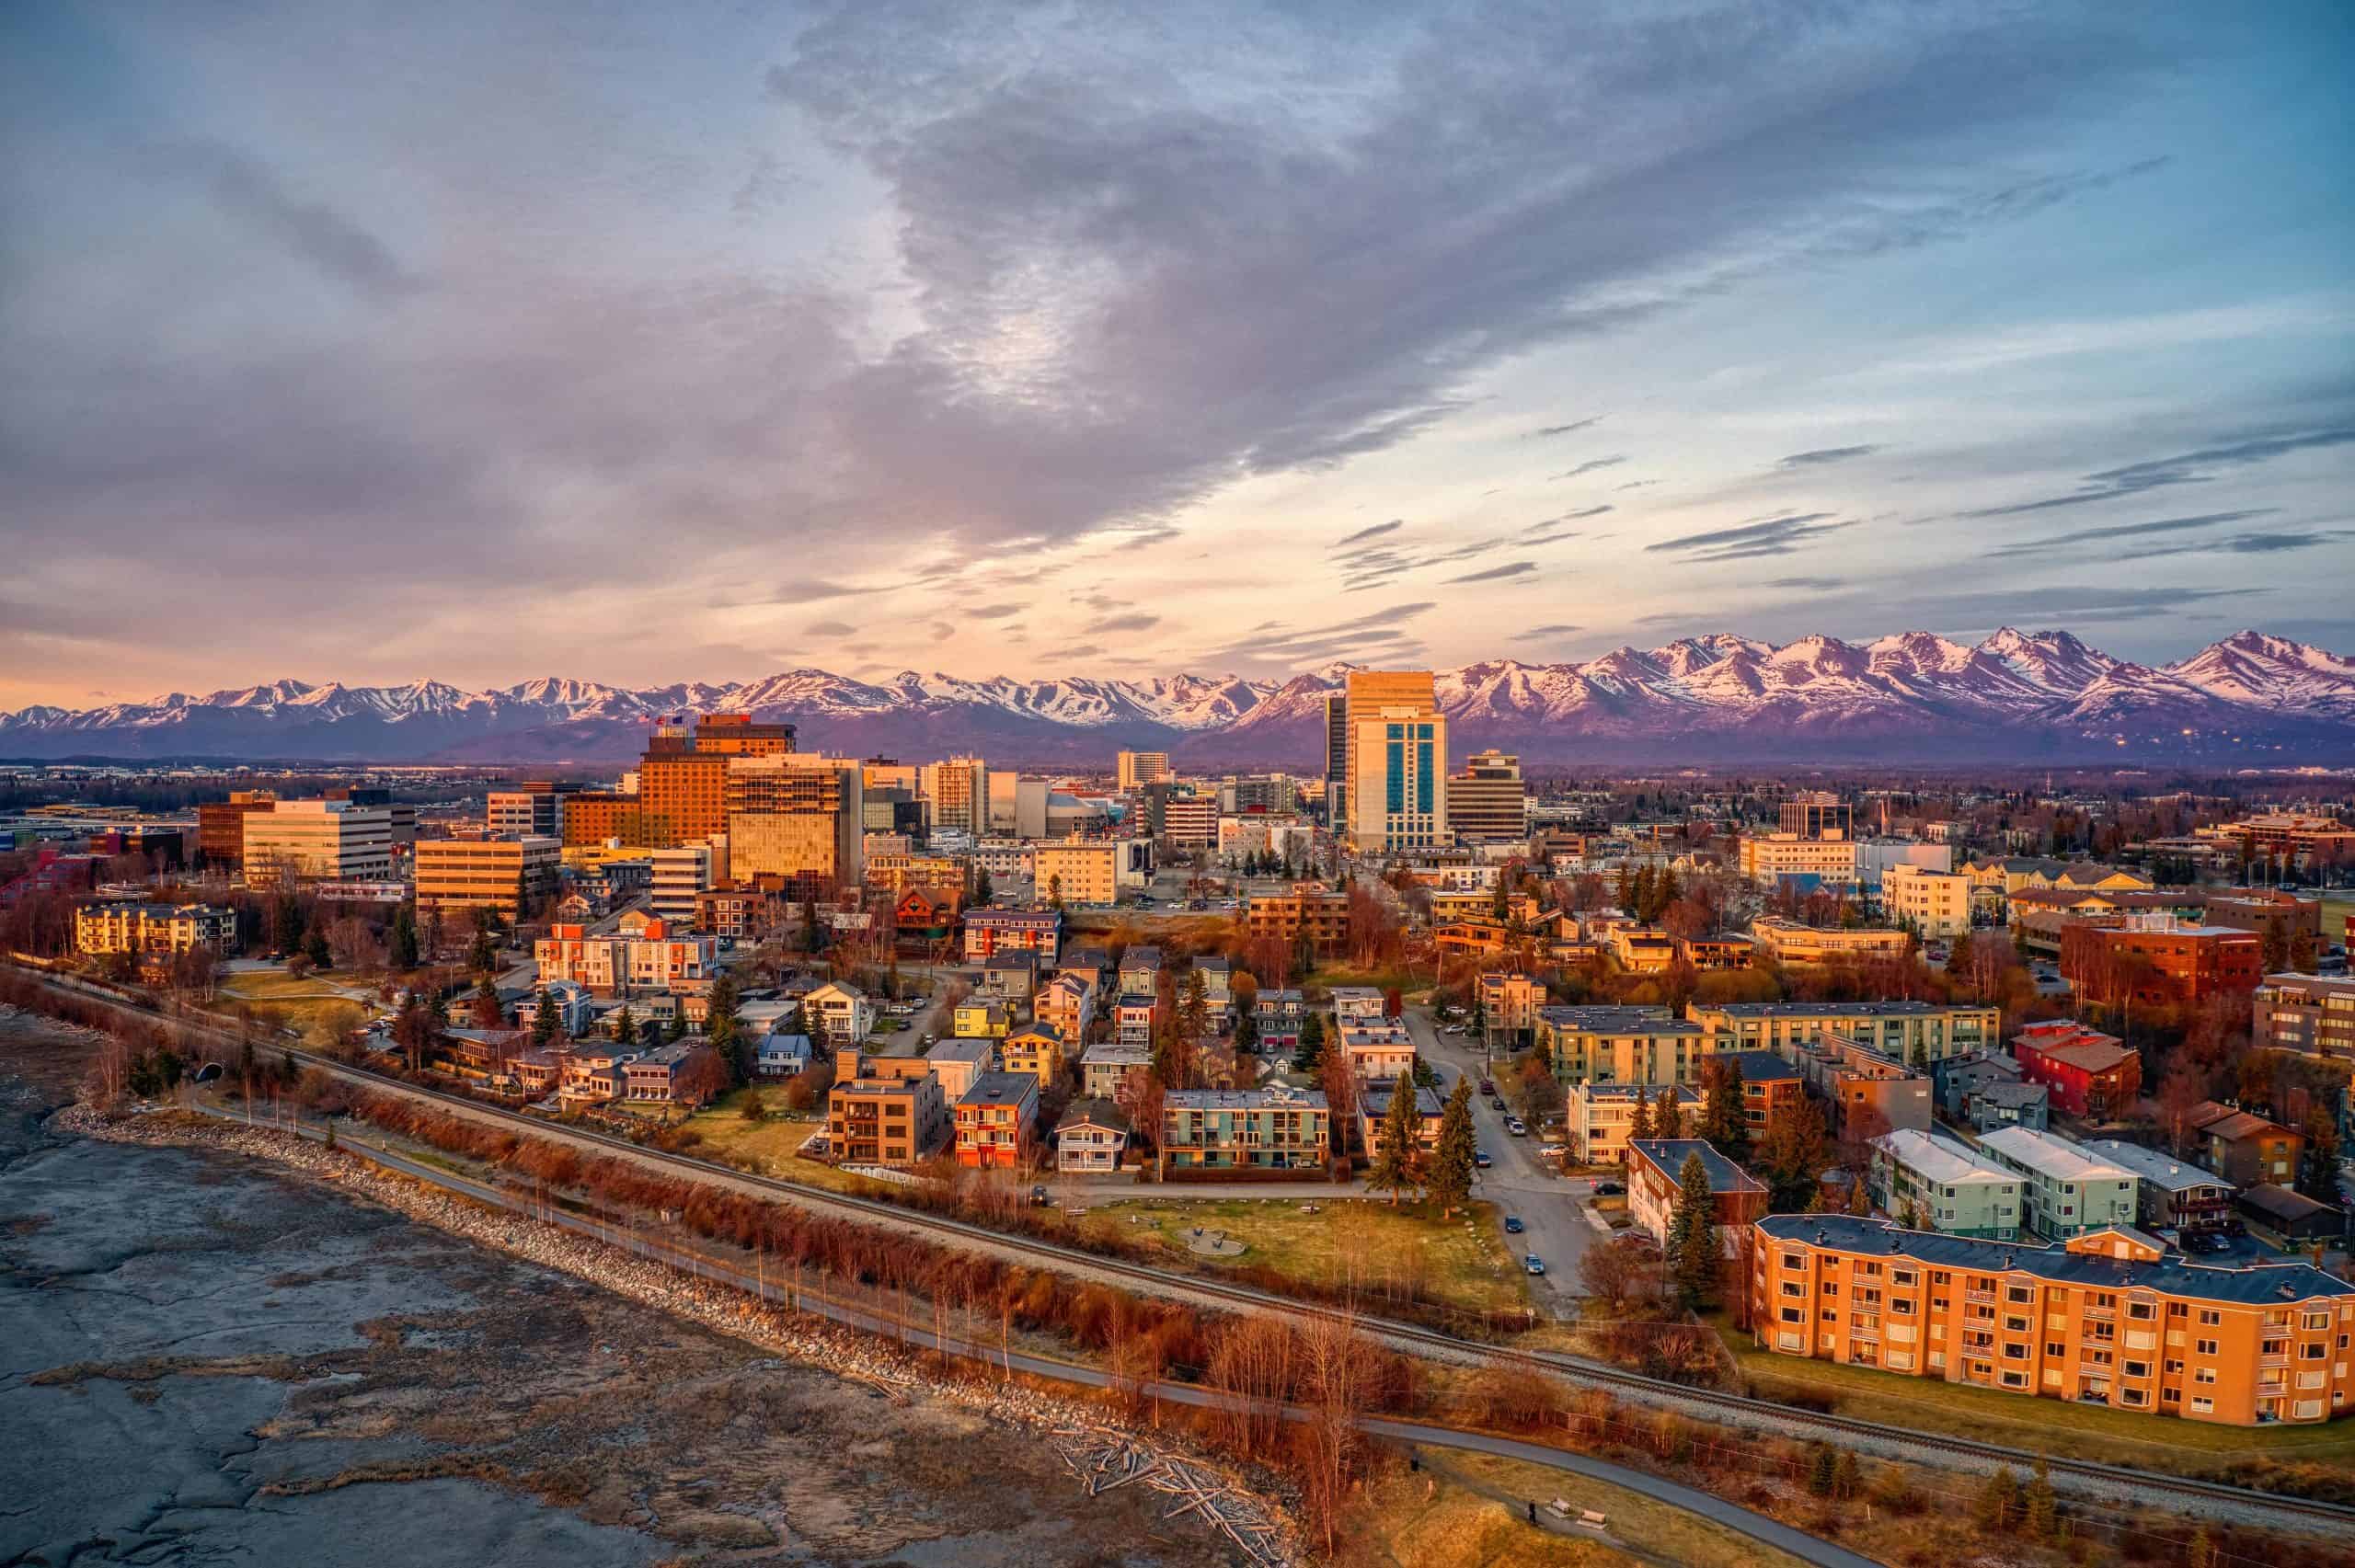
- Personal transportation services expenditure, adjusted for population: $2,662 per capita
- Cost of living: +1.7% more than national average
- Total transportation services expenditure: $2.0 billion
- Total population: 733,406
- Other major spending categories: Health care, recreation services, recreational goods and vehicles, food services and accommodations, furnishings and durable household equipment
2. Washington
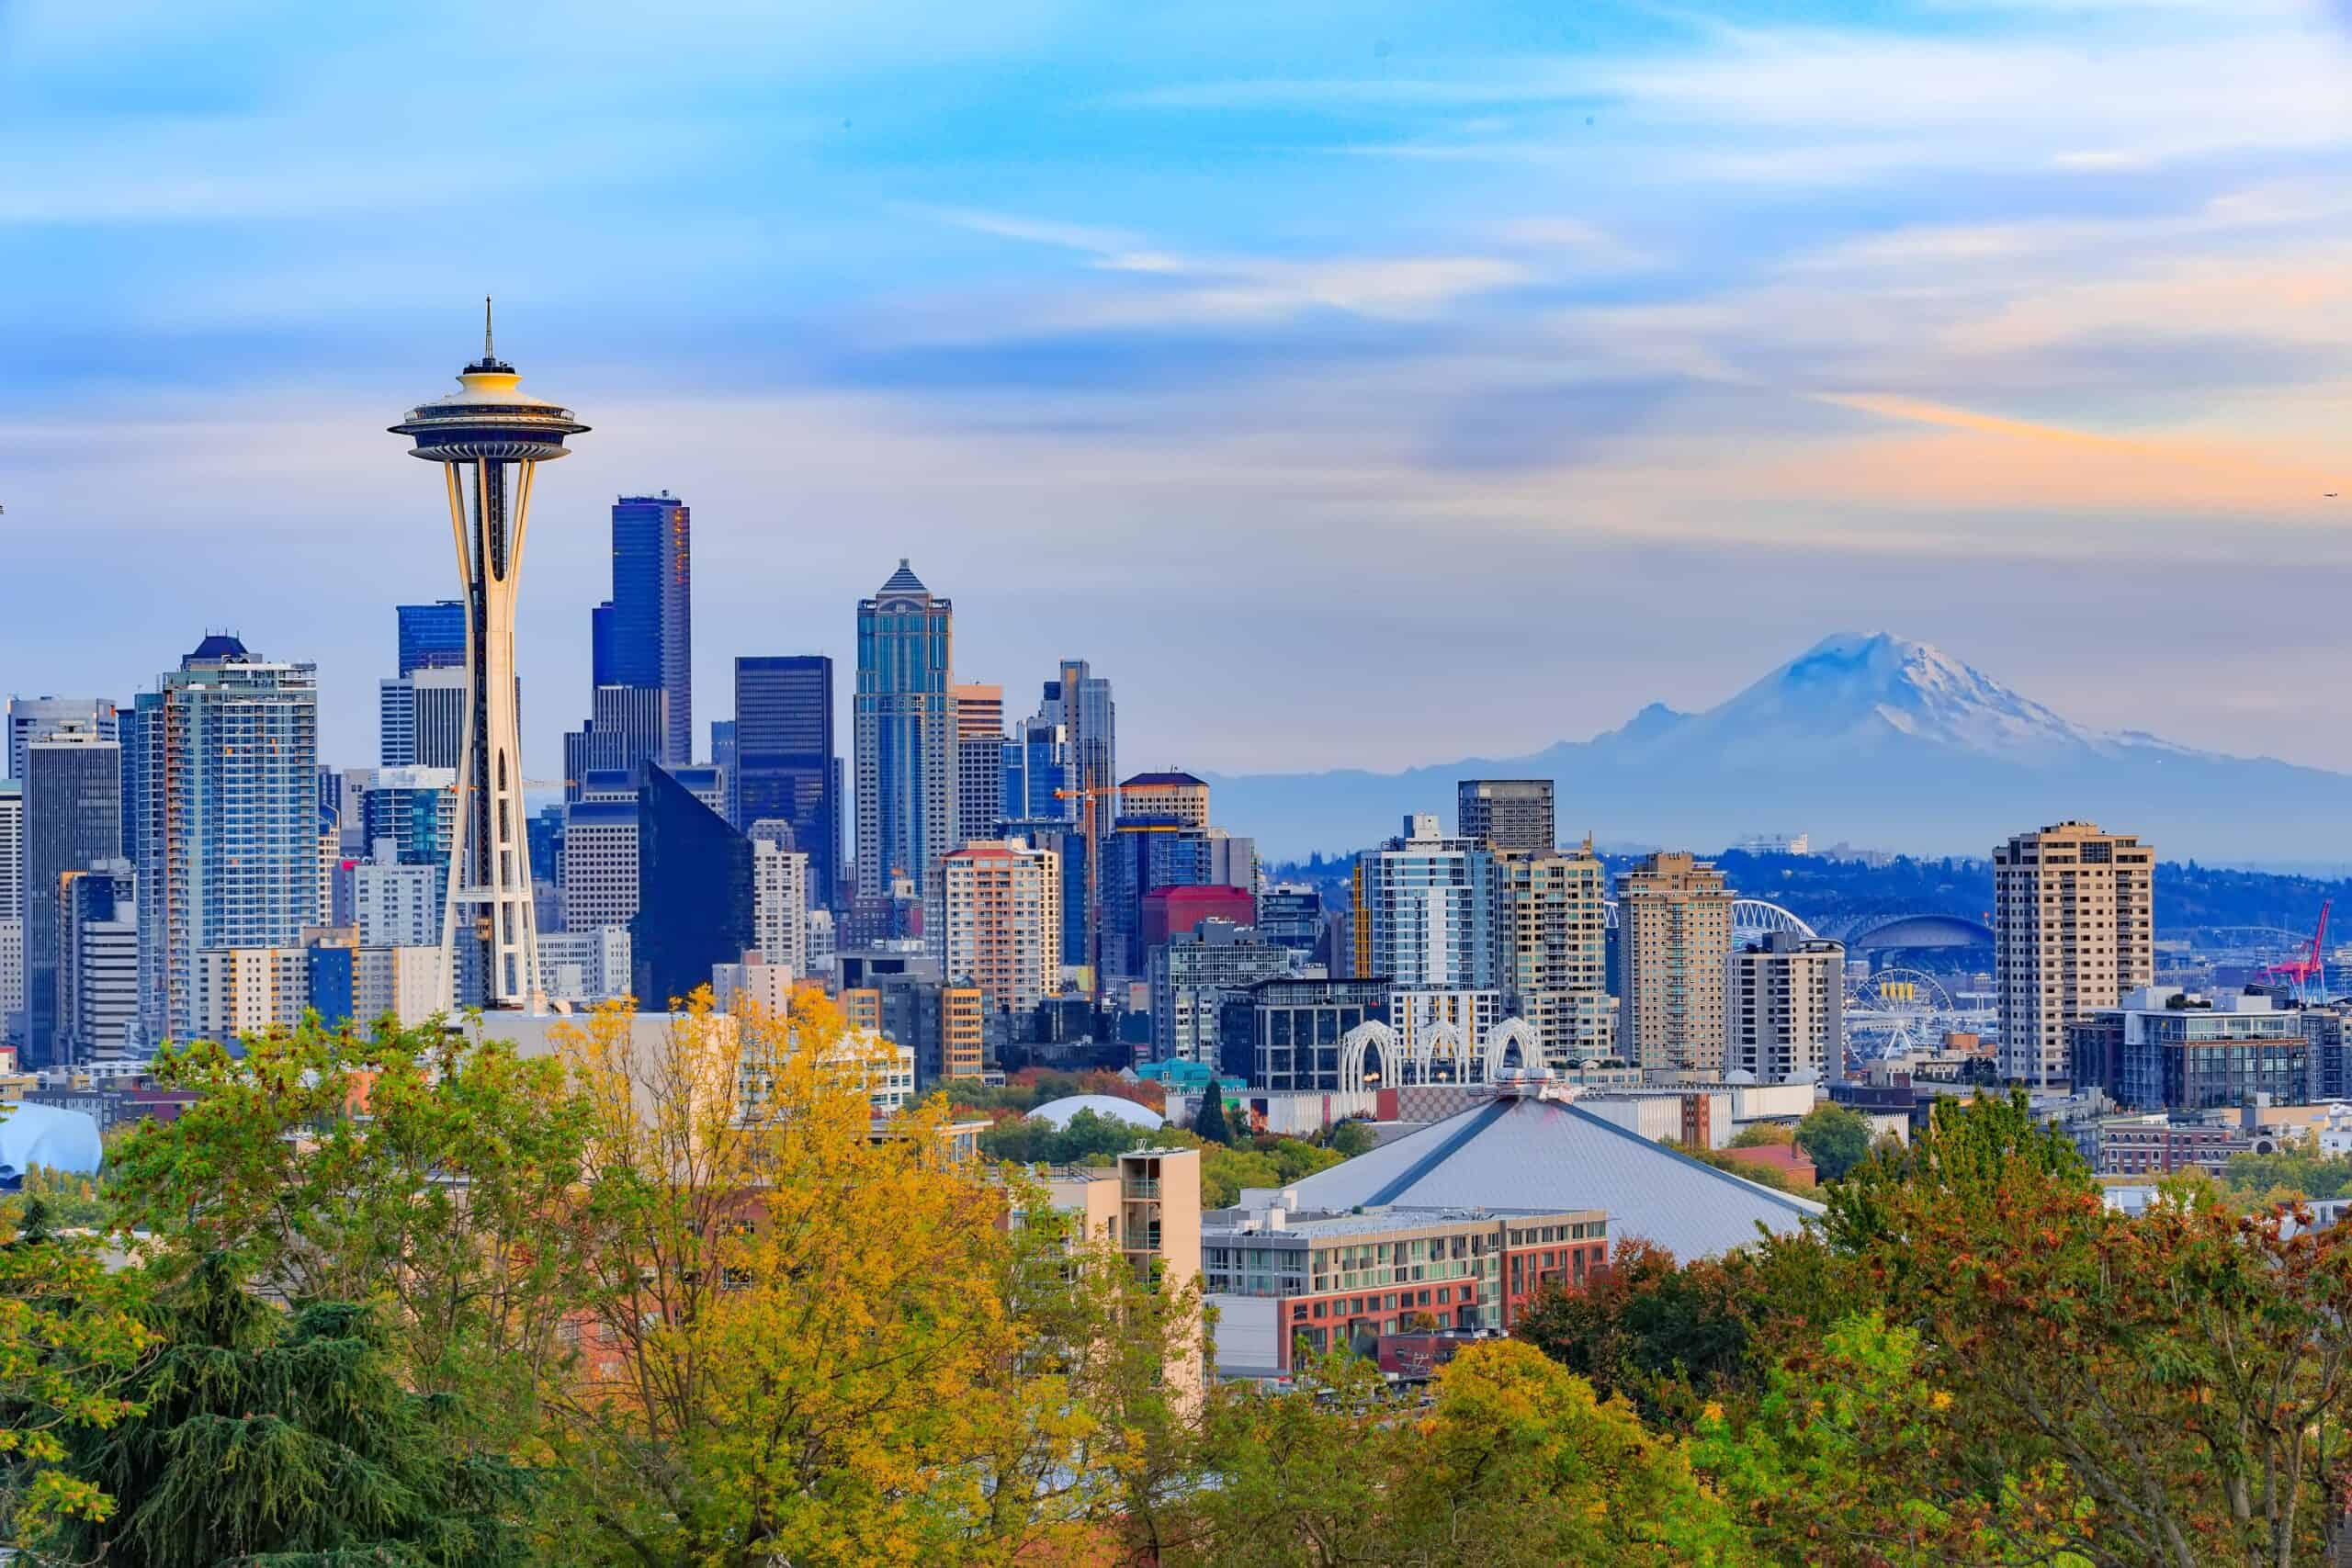
- Personal transportation services expenditure, adjusted for population: $2,793 per capita
- Cost of living: +8.6% more than national average
- Total transportation services expenditure: $21.8 billion
- Total population: 7.8 million
- Other major spending categories: Recreational goods and vehicles, recreation services, housing and utilities, furnishings and durable household equipment, groceries
1. Massachusetts
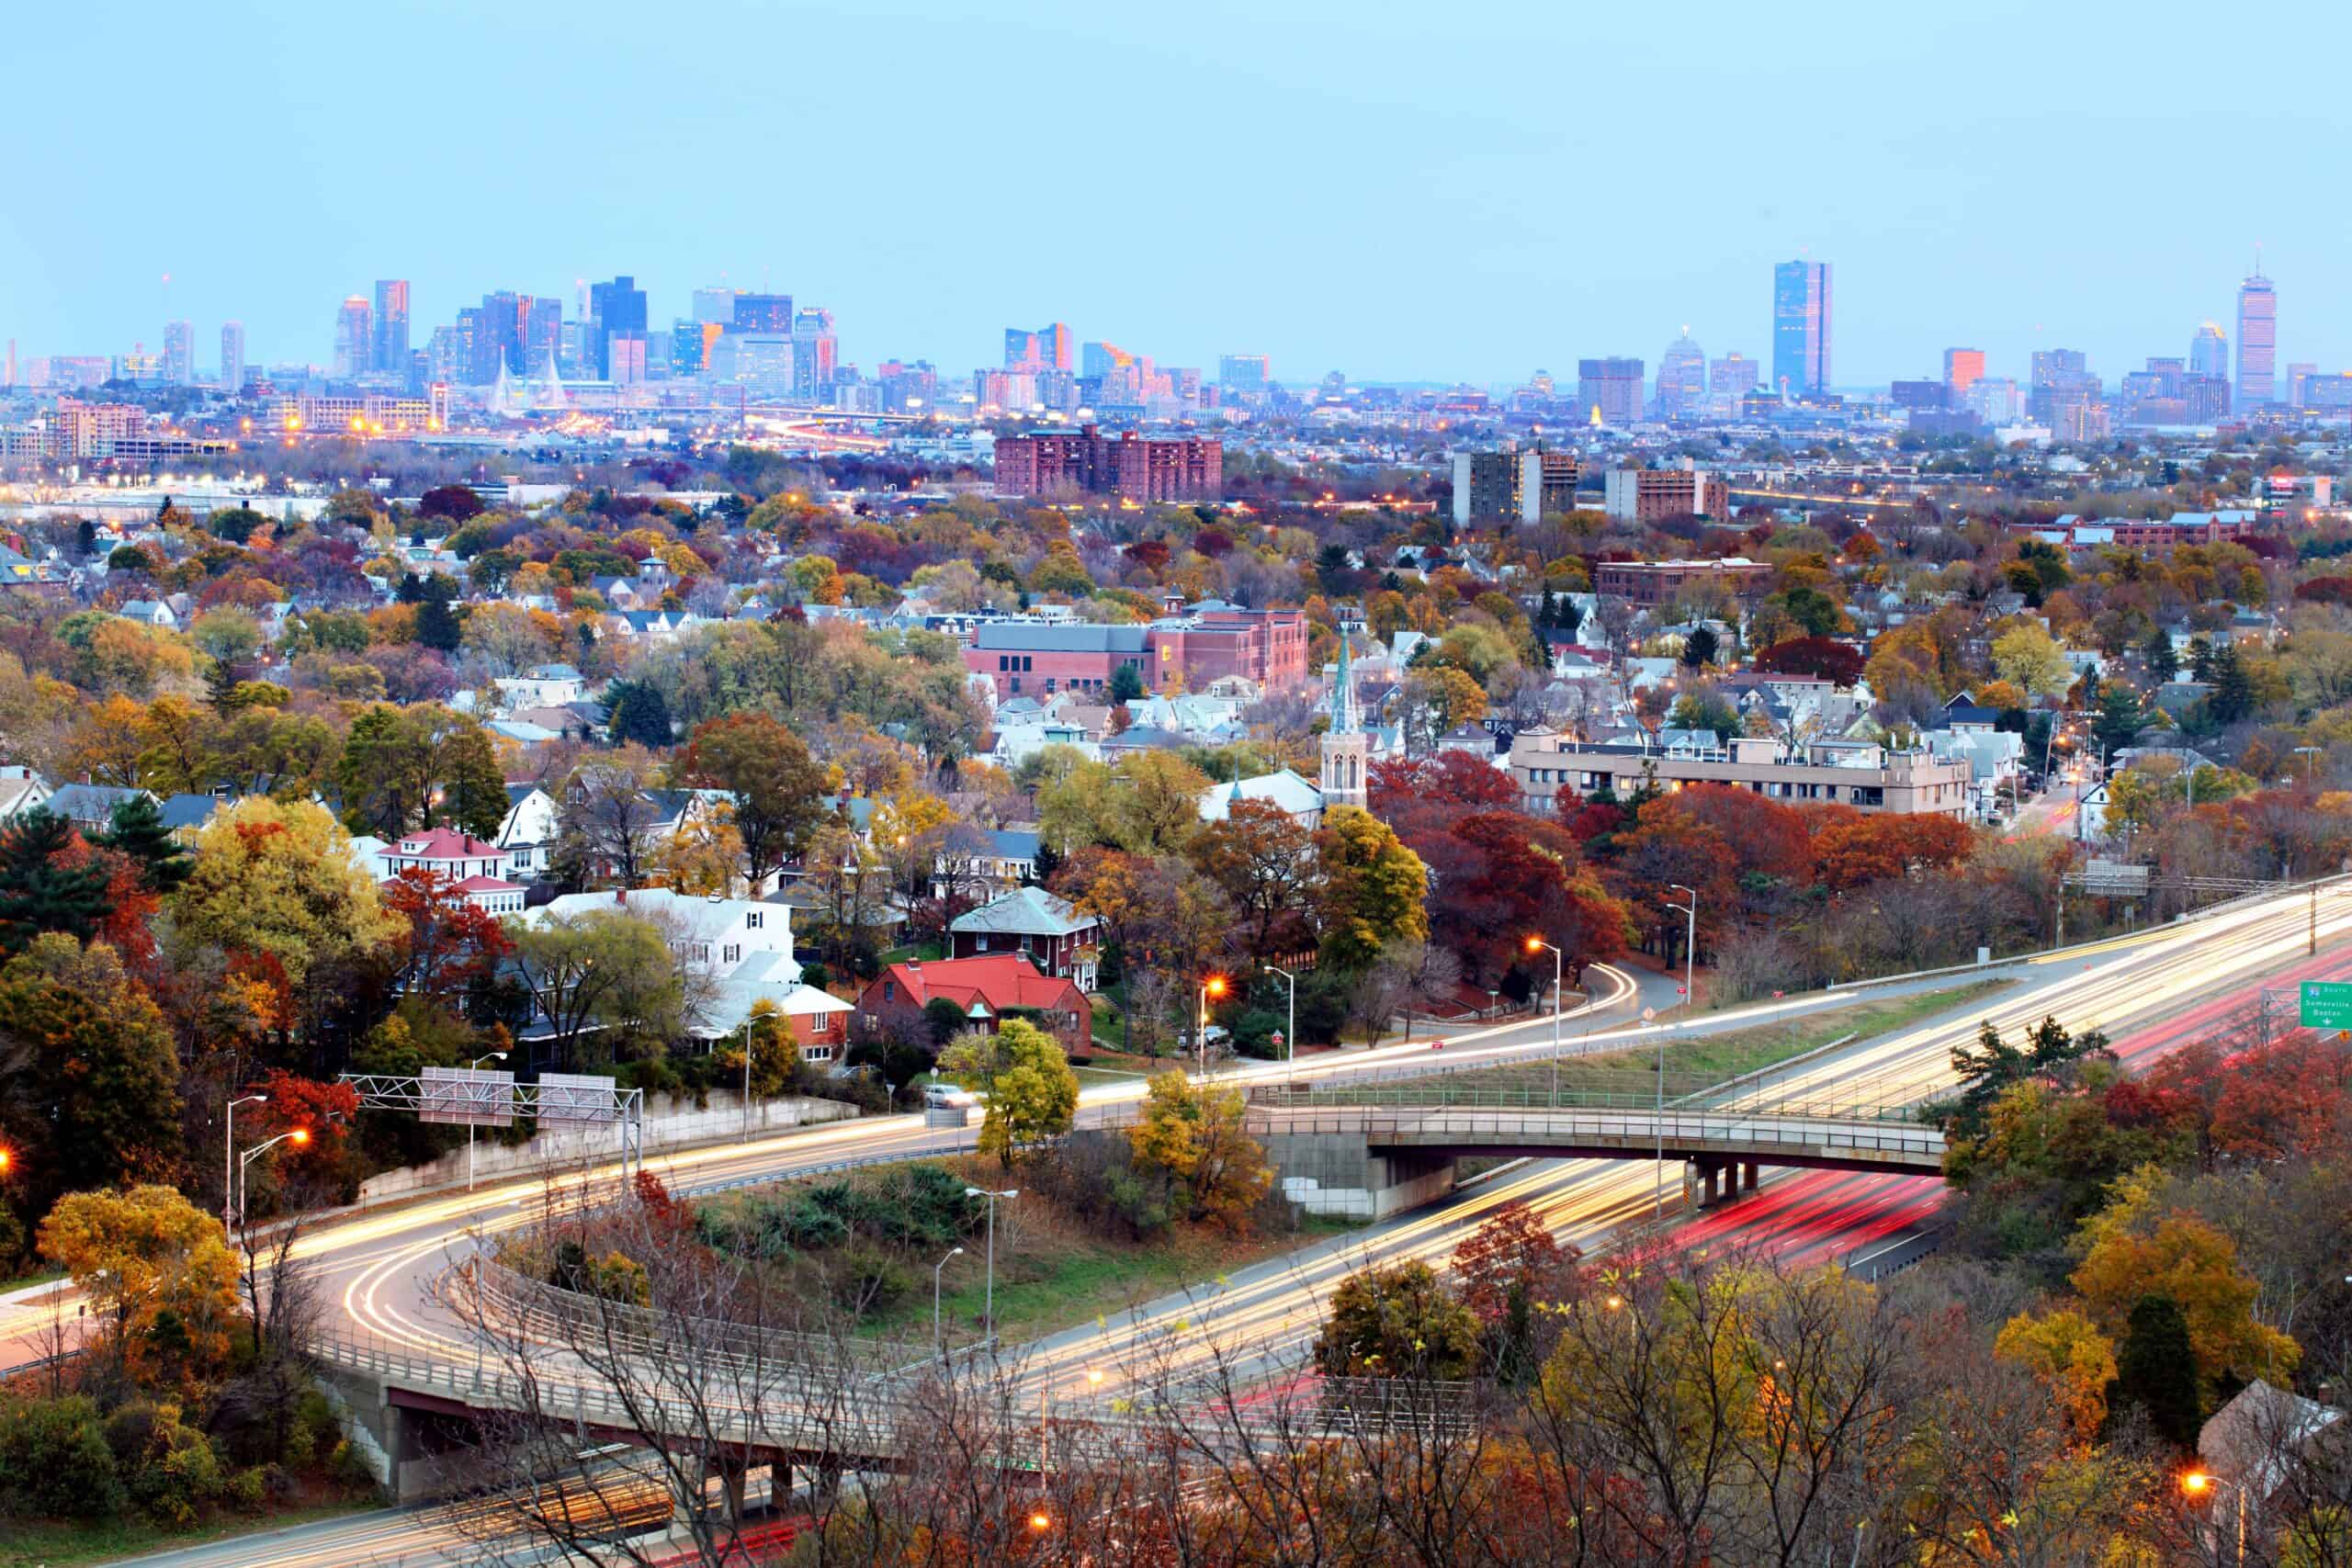
- Personal transportation services expenditure, adjusted for population: $2,805 per capita
- Cost of living: +8.2% more than national average
- Total transportation services expenditure: $19.6 billion
- Total population: 7.0 million
- Other major spending categories: Housing and utilities, financial services and insurance, health care, recreation services, food services and accommodations
The post Getting Around Is Getting More Expensive — Especially in These States appeared first on 24/7 Wall St..