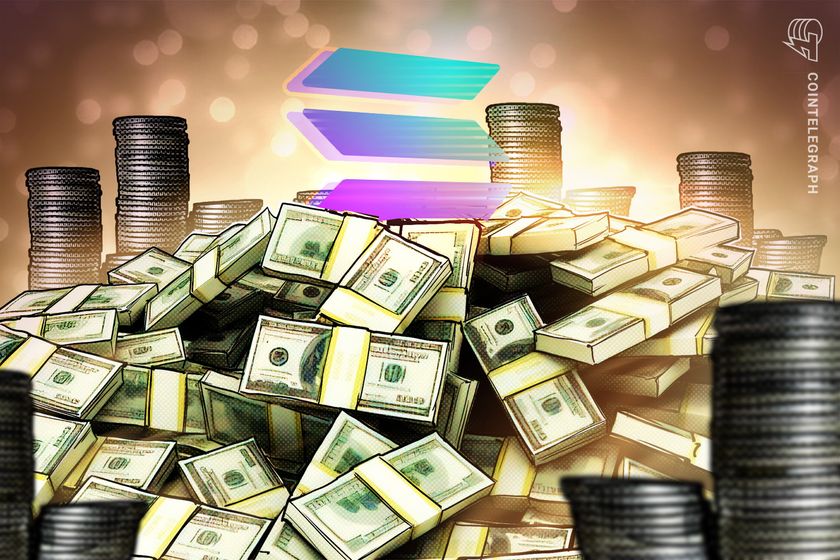


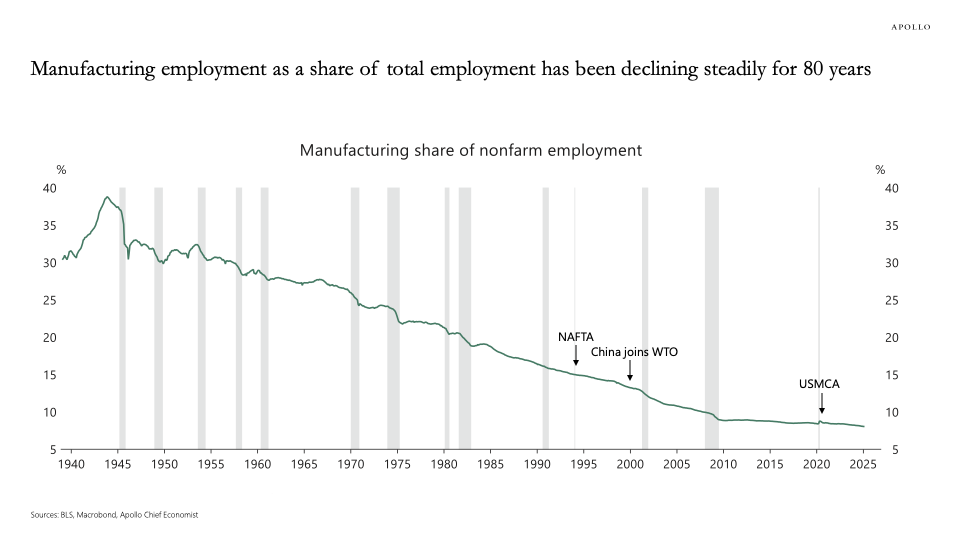


Ethereum price has several reasons to break $2,000 next
Key takeaways:Ether’s price was rejected at $1,860, but $1,800 must hold for a $2,000 breakout.Strong Ethereum ETF inflows signal high institutional demand.Ethereum’s $51.8B TVL and 30% DEX weekly volume rise show robust network strength.A bull flag pattern on the ETH’s four-hour chart targets $2,100.Ether’s (ETH) price rose to a new range high at $1,860 on April 28, its highest value since April 2.Several analysts argue that the ETH price needs to hold above $1,800 to increase the chances of rising higher.“Once ETH confirms this 4H close above resistance [$1,800], Ether and altcoins will finally get their time to shine,” trader Kiran Gadakh said in an April 29 post on X. “I can feel it in my bones, $2,000 ETH coming fast.” ETH/USD 12-hour chart. Source: Kiran GadakPopular analyst Nebraskangooner opined that if ETH faces high volume rejection from the $1,800 level, it might drop to test support levels around $1,600.Source: NebraskangoonerEthereum ETF demand returnsSeveral data metrics suggest that Ether is well-positioned to break out toward $2,000 in the following days or weeks.One factor supporting Ether's bull case is resurgent institutional demand, reflected by significant inflows into spot Ethereum exchange-traded funds (ETFs).On April 28, Ethereum ETFs saw a net inflow totaling $64.1 million. This followed inflows totalling $151.7 million during the week ending April 25, the highest since February 2025. Spot Ethereum ETF netflows. Source: SoSoValueThe increase in institutional demand was reinforced by net inflows of $183 million into Ethereum investment products last week, ending an eight-week streak of outflows, as reported by CoinShares. This trend reflects growing confidence among traditional finance players, as observed by market analysts like CoinShares' head of research, James Butterfill, who noted:“We believe concerns over the tariff impact on corporate earnings and the dramatic weakening of the US dollar are why investors have turned toward digital assets, which are being seen as an emerging safe haven.”Institutional buying creates sustained upward pressure on Ether’s price by absorbing the available supply.Strong Ethereum onchain activity is backEthereum remains the undisputed top layer-1 blockchain with more than $51.8 billion in total value locked (TVL) on the network, according to data from DefiLlama. The chart below shows that Ethereum's TVL has increased by approximately 16% over the last seven days.Ethereum TVL and daily DEX volumes. Source: DefiLlamaAave was among the strongest performers in Ethereum deposits, with the TVL rising 13.5% over seven days. Other notable increases included Lido (12%), EigenLayer (13%), and Ether.fi (12%).Compared to other top-layer networks, the Ethereum network towers above its rivals in terms of TVL growth in the daily and weekly time frames, except SUI, which has seen a 47% increase in its TVL over the last seven days.Ethereum’s daily DEX volumes have increased by more than 30% over the last week, to $1.65 billion. However, this is significantly lower than the 78% and 44% increases on SUI and Solana, respectively. Related: Ethereum Foundation shuffles leadership, splits board and managementETH price bull flags targets $2,100The ETH/USD pair has a good chance of resuming its upward momentum despite the rejection at $1,860, as the chart shows a classic bullish pattern.Ether’s price action over the past week has led to a bull flag pattern on the four-hour chart, as shown in the figure below. A four-hour candlestick close above the flag’s upper boundary at $1,800 on April 29 suggests the start of an upward move.The flagpole’s height sets the target, which projects Ether’s price ascent to $2,100 or approximately a 15% increase from the current price.ETH/USD 4-hour chart w/ bull flag pattern. Source: Cointelegraph/TradingViewAnother bullish indicator is the relative strength index, which is moving within the positive region at 60, suggesting that the market conditions still favor the upside.As Cointelegraph reported, increased demand from the $1,700 area (at the 20-day SMA) should serve as a solid foundation for ETH price to reach the $2,110 level, eventually topping out at $2,500.This article does not contain investment advice or recommendations. Every investment and trading move involves risk, and readers should conduct their own research when making a decision.


Key takeaways:
Ether’s price was rejected at $1,860, but $1,800 must hold for a $2,000 breakout.
Strong Ethereum ETF inflows signal high institutional demand.
Ethereum’s $51.8B TVL and 30% DEX weekly volume rise show robust network strength.
A bull flag pattern on the ETH’s four-hour chart targets $2,100.
Ether’s (ETH) price rose to a new range high at $1,860 on April 28, its highest value since April 2.
Several analysts argue that the ETH price needs to hold above $1,800 to increase the chances of rising higher.
“Once ETH confirms this 4H close above resistance [$1,800], Ether and altcoins will finally get their time to shine,” trader Kiran Gadakh said in an April 29 post on X.
“I can feel it in my bones, $2,000 ETH coming fast.”

Popular analyst Nebraskangooner opined that if ETH faces high volume rejection from the $1,800 level, it might drop to test support levels around $1,600.

Ethereum ETF demand returns
Several data metrics suggest that Ether is well-positioned to break out toward $2,000 in the following days or weeks.
One factor supporting Ether's bull case is resurgent institutional demand, reflected by significant inflows into spot Ethereum exchange-traded funds (ETFs).
On April 28, Ethereum ETFs saw a net inflow totaling $64.1 million. This followed inflows totalling $151.7 million during the week ending April 25, the highest since February 2025.

The increase in institutional demand was reinforced by net inflows of $183 million into Ethereum investment products last week, ending an eight-week streak of outflows, as reported by CoinShares.
This trend reflects growing confidence among traditional finance players, as observed by market analysts like CoinShares' head of research, James Butterfill, who noted:
“We believe concerns over the tariff impact on corporate earnings and the dramatic weakening of the US dollar are why investors have turned toward digital assets, which are being seen as an emerging safe haven.”
Institutional buying creates sustained upward pressure on Ether’s price by absorbing the available supply.
Strong Ethereum onchain activity is back
Ethereum remains the undisputed top layer-1 blockchain with more than $51.8 billion in total value locked (TVL) on the network, according to data from DefiLlama. The chart below shows that Ethereum's TVL has increased by approximately 16% over the last seven days.

Aave was among the strongest performers in Ethereum deposits, with the TVL rising 13.5% over seven days. Other notable increases included Lido (12%), EigenLayer (13%), and Ether.fi (12%).
Compared to other top-layer networks, the Ethereum network towers above its rivals in terms of TVL growth in the daily and weekly time frames, except SUI, which has seen a 47% increase in its TVL over the last seven days.
Ethereum’s daily DEX volumes have increased by more than 30% over the last week, to $1.65 billion. However, this is significantly lower than the 78% and 44% increases on SUI and Solana, respectively.
Related: Ethereum Foundation shuffles leadership, splits board and management
ETH price bull flags targets $2,100
The ETH/USD pair has a good chance of resuming its upward momentum despite the rejection at $1,860, as the chart shows a classic bullish pattern.
Ether’s price action over the past week has led to a bull flag pattern on the four-hour chart, as shown in the figure below. A four-hour candlestick close above the flag’s upper boundary at $1,800 on April 29 suggests the start of an upward move.
The flagpole’s height sets the target, which projects Ether’s price ascent to $2,100 or approximately a 15% increase from the current price.

Another bullish indicator is the relative strength index, which is moving within the positive region at 60, suggesting that the market conditions still favor the upside.
As Cointelegraph reported, increased demand from the $1,700 area (at the 20-day SMA) should serve as a solid foundation for ETH price to reach the $2,110 level, eventually topping out at $2,500.
This article does not contain investment advice or recommendations. Every investment and trading move involves risk, and readers should conduct their own research when making a decision.