


Check Out Every State’s Wealthiest Counties
On March 8, 2025, residents of the Hamptons, one of New York’s wealthiest areas, were forced to flee as fast-traveling wildfires threatened Long Island real estate. One local evacuee admitted, “We almost didn’t know if we were gonna get out of there.” Dozens of fire departments arrived in Suffolk County to fight flames from engulfing […] The post Check Out Every State’s Wealthiest Counties appeared first on 24/7 Wall St..
On March 8, 2025, residents of the Hamptons, one of New York’s wealthiest areas, were forced to flee as fast-traveling wildfires threatened Long Island real estate. One local evacuee admitted, “We almost didn’t know if we were gonna get out of there.” Dozens of fire departments arrived in Suffolk County to fight flames from engulfing expensive houses along this beautiful coastal setting.
Though the wealthiest areas of the world, both in the US and beyond, are not exempt from such traumatic events, they do feature certain characteristics not seen in poorer regions. For example, the world’s wealthiest nations share a high GDP, advanced educational institutions, access to technology, and an above average standard of living. Citizens of these countries often enjoy a stable political climate, alongside a high quality of life. Two such countries are Norway and Switzerland, both of which consistently rank among the world’s richest countries. The United States is also at the top of this list, thanks to its collection of various industries and a successful economy.
Within America itself, certain areas stand out as wealthier than others. In fact, some specific locations are excessively wealthy, characterized by high-dollar homes and soaring income levels. These wealthy regions tend to be located on the coasts, with the East Coast’s New York City and the West Coast’s Silicon Valley being prime examples. However, no region is completely without wealthy hubs; they are sprinkled throughout the entirety of the United States. And within every state, you can find specific counties that are much richer than surrounding counties.
To identify the wealthiest county (or parish, in the case of Louisiana) in each state, 24/7 Wall St. reviewed median household incomes from the U.S. Census Burau’s 2022 American Community Survey. Supplemental data on poverty, home values, and educational attainment are also from the ACS, and unemployment rates are from the Bureau of Labor Statistics. Additional data on cost of living is from the Bureau of Economic Analysis and the U.S. Department of Commerce. Only counties with populations of at least 1,000 were considered. Due to recent changes in county distinctions, ACS data for Connecticut is current as of 2021.
(This article was updated on March 14, 2025 to reflect recent events)
Why It Matters
Though it can be interesting and intriguing to review the wealthiest counties in America, it also sheds light on the income inequality that continues to grow in the United States. The space between the richest individuals and the poorest individuals is significantly wider today that at any other time in our history. The communities of America’s super wealthy are in some ways evidence of this ever-expanding gap in income and resources. While residents of the following counties enjoy access to education and healthcare, many of our nation’s poorest citizens do not.
Alabama: Shelby County
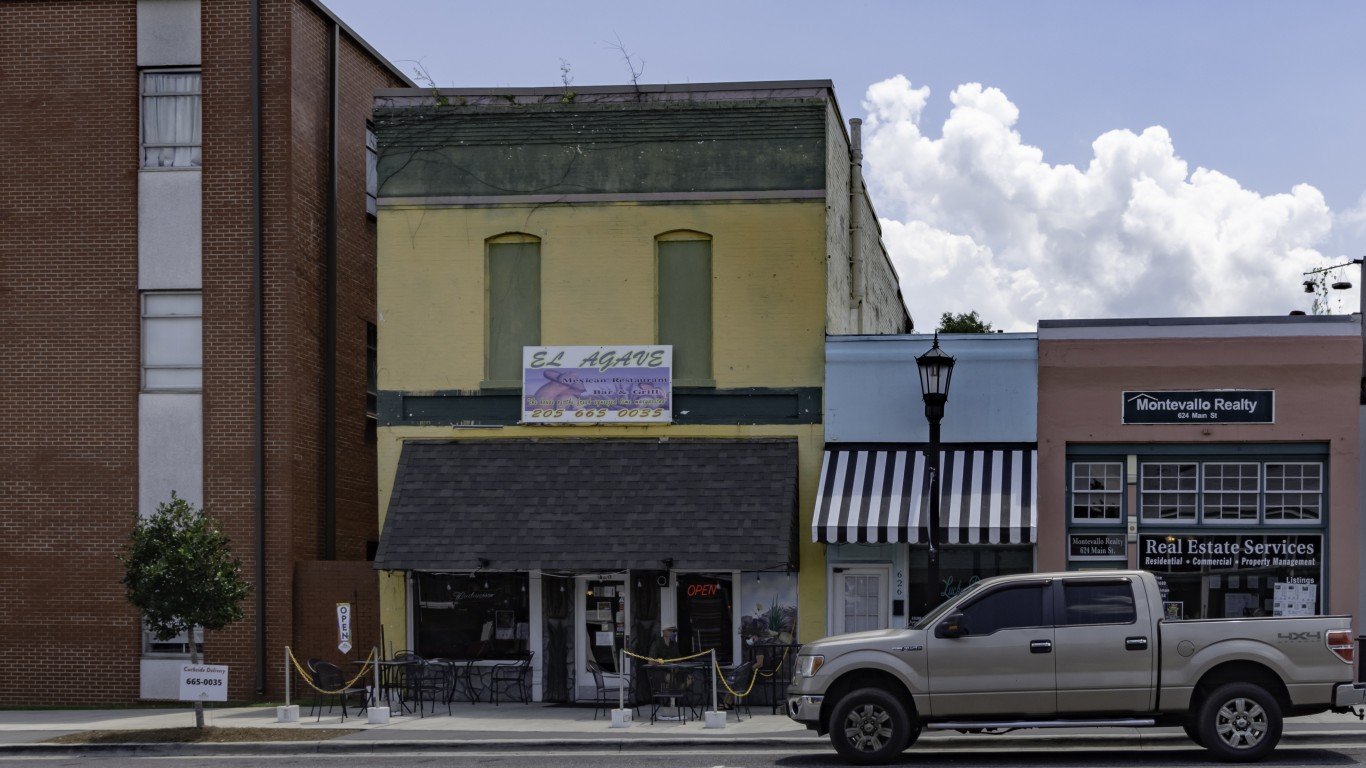
- Median household income: $90,618 ($59,609 statewide)
- Poverty rate: 6.9% (15.7% statewide)
- Median home value: $276,500 ($179,400 statewide)
- Adults with a bachelor’s degree or higher: 45.6% (27.2% statewide)
- Avg. unemployment rate in 2023: 1.8% (2.5% statewide)
- Cost of living: 6.1% less than U.S. avg. (12.2% less than U.S. avg. statewide)
- Total population: 223,916
Alaska: Aleutians West Census Area

- Median household income: $100,662 ($86,370 statewide)
- Poverty rate: 9.6% (10.5% statewide)
- Median home value: $377,100 ($318,000 statewide)
- Adults with a bachelor’s degree or higher: 15.4% (30.7% statewide)
- Avg. unemployment rate in 2023: 3.0% (4.2% statewide)
- Cost of living: 5.5% more than U.S. avg. (2.0% more than U.S. avg. statewide)
- Total population: 5,219
Arizona: Maricopa County

- Median household income: $80,675 ($72,581 statewide)
- Poverty rate: 11.5% (13.1% statewide)
- Median home value: $371,400 ($321,400 statewide)
- Adults with a bachelor’s degree or higher: 35.0% (31.8% statewide)
- Avg. unemployment rate in 2023: 3.4% (3.9% statewide)
- Cost of living: 0.4% less than U.S. avg. (0.1% less than U.S. avg. statewide)
- Total population: 4,430,871
Arkansas: Benton County
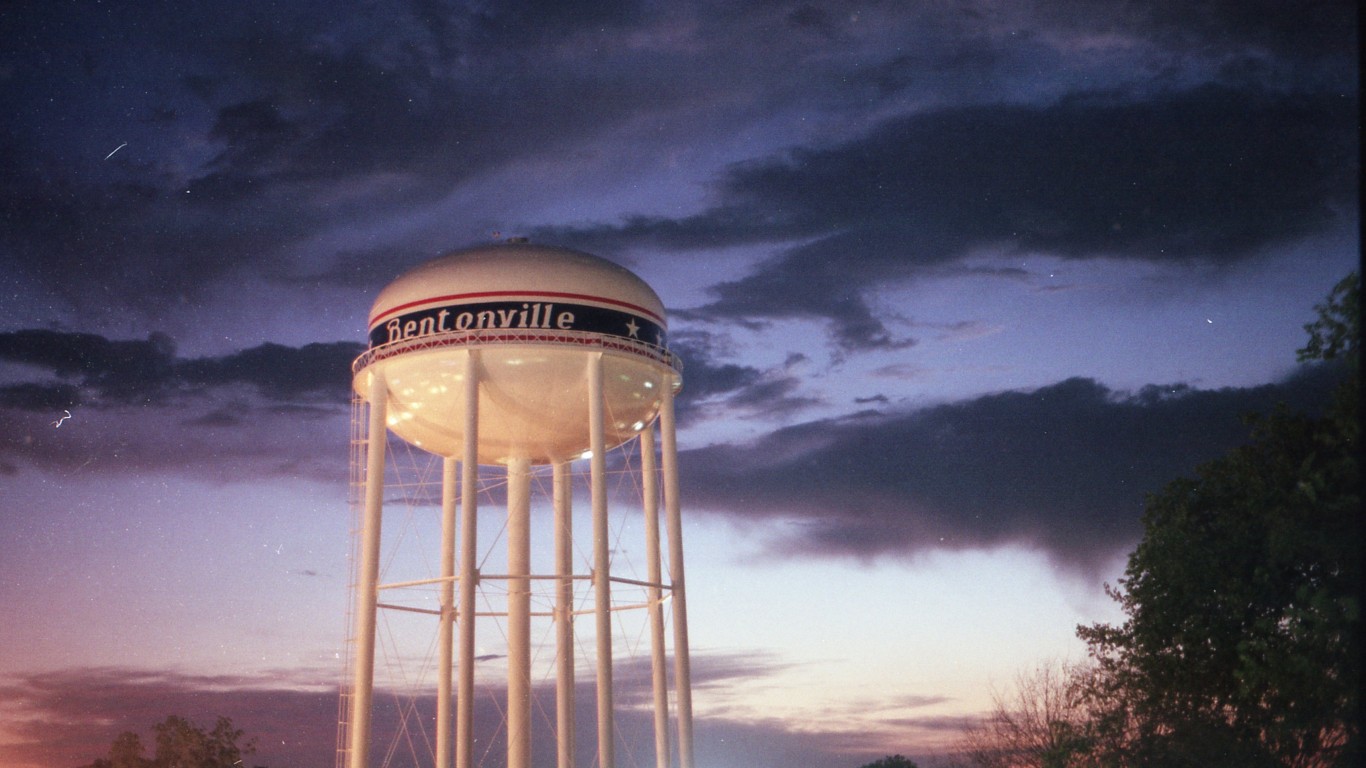
- Median household income: $85,269 ($56,335 statewide)
- Poverty rate: 7.9% (16.2% statewide)
- Median home value: $254,000 ($162,400 statewide)
- Adults with a bachelor’s degree or higher: 35.5% (24.7% statewide)
- Avg. unemployment rate in 2023: 2.4% (3.3% statewide)
- Cost of living: 6.7% less than U.S. avg. (13.4% less than U.S. avg. statewide)
- Total population: 286,528
California: Santa Clara County

- Median household income: $153,792 ($91,905 statewide)
- Poverty rate: 6.9% (12.1% statewide)
- Median home value: $1,316,800 ($659,300 statewide)
- Adults with a bachelor’s degree or higher: 55.3% (35.9% statewide)
California: Santa Clara County (continued)

- Avg. unemployment rate in 2023: 3.5% (4.8% statewide)
- Cost of living: 12.0% more than U.S. avg. (12.5% more than U.S. avg. statewide)
- Total population: 1,916,831
Colorado: Douglas County

- Median household income: $139,010 ($87,598 statewide)
- Poverty rate: 3.0% (9.6% statewide)
- Median home value: $635,100 ($465,900 statewide)
- Adults with a bachelor’s degree or higher: 60.0% (43.7% statewide)
- Avg. unemployment rate in 2023: 2.9% (3.2% statewide)
- Cost of living: 16.2% more than U.S. avg. (2.3% more than U.S. avg. statewide)
- Total population: 360,206
Connecticut: Fairfield County

- Median household income: $101,194 ($83,572 statewide)
- Poverty rate: 9.2% (10.0% statewide)
- Median home value: $443,100 ($286,700 statewide)
- Adults with a bachelor’s degree or higher: 49.2% (40.6% statewide)
- Avg. unemployment rate in 2023: 3.9% (3.8% statewide)
- Cost of living: 6.1% more than U.S. avg. (2.8% more than U.S. avg. statewide)
- Total population: 956,446
Delaware: New Castle County
- Median household income: $85,309 ($79,325 statewide)
- Poverty rate: 10.5% (11.1% statewide)
- Median home value: $312,000 ($305,200 statewide)
- Adults with a bachelor’s degree or higher: 38.3% (34.5% statewide)
- Avg. unemployment rate in 2023: 3.9% (4.0% statewide)
- Cost of living: 1.3% less than U.S. avg. (2.0% less than U.S. avg. statewide)
- Total population: 570,567
Florida: St. Johns County
- Median household income: $100,020 ($67,917 statewide)
- Poverty rate: 6.8% (12.9% statewide)
- Median home value: $416,100 ($292,200 statewide)
- Adults with a bachelor’s degree or higher: 47.4% (32.3% statewide)
- Avg. unemployment rate in 2023: 2.7% (2.9% statewide)
- Cost of living: 7.1% more than U.S. avg. (2.1% more than U.S. avg. statewide)
- Total population: 278,722
Georgia: Forsyth County
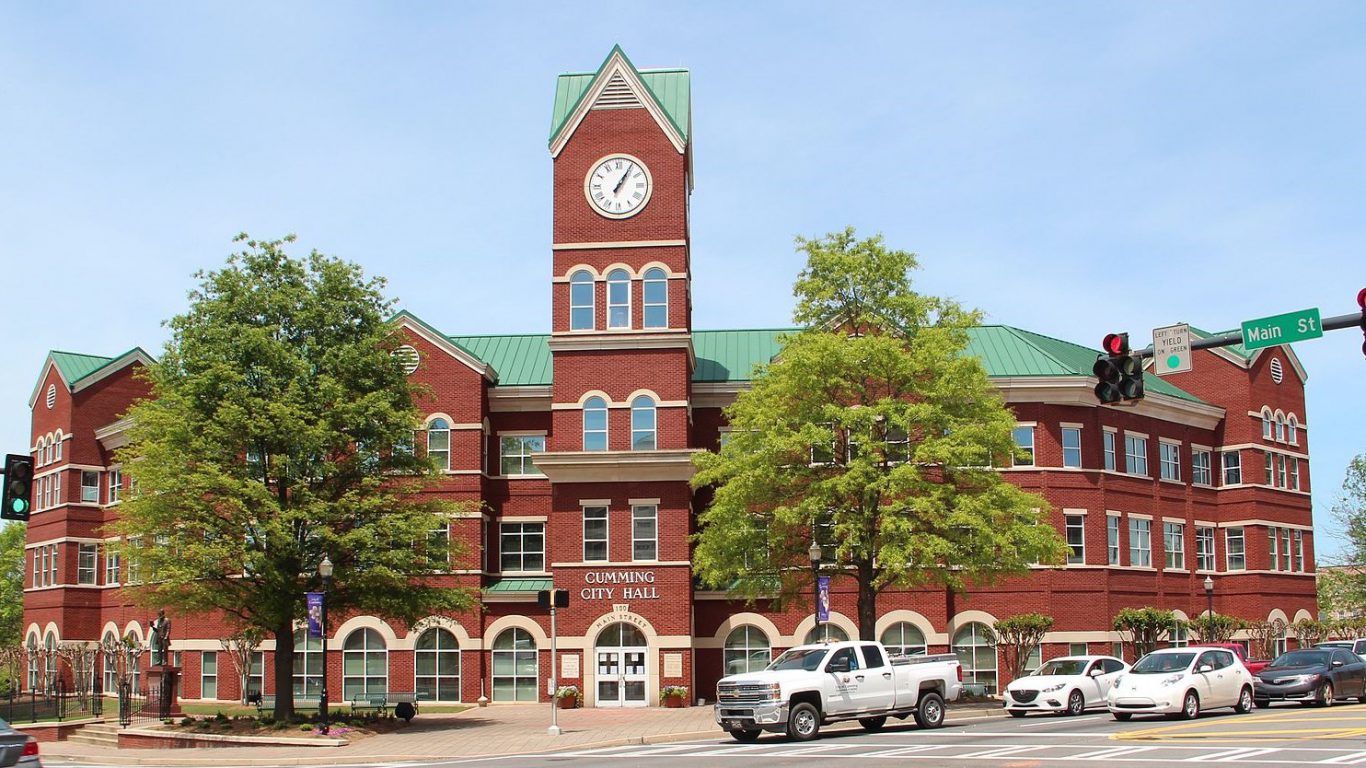
- Median household income: $131,660 ($71,355 statewide)
- Poverty rate: 4.6% (13.5% statewide)
- Median home value: $451,100 ($245,900 statewide)
- Adults with a bachelor’s degree or higher: 56.2% (33.6% statewide)
- Avg. unemployment rate in 2023: 2.5% (3.2% statewide)
- Cost of living: 4.3% more than U.S. avg. (4.2% less than U.S. avg. statewide)
- Total population: 253,225
Hawaii: Honolulu County

- Median household income: $99,816 ($94,814 statewide)
- Poverty rate: 8.8% (9.6% statewide)
- Median home value: $832,200 ($764,800 statewide)
- Adults with a bachelor’s degree or higher: 36.6% (34.7% statewide)
- Avg. unemployment rate in 2023: 2.7% (3.0% statewide)
- Cost of living: 14.0% more than U.S. avg. (10.8% more than U.S. avg. statewide)
- Total population: 1,010,100
Idaho: Teton County
- Median household income: $88,906 ($70,214 statewide)
- Poverty rate: 10.0% (11.0% statewide)
- Median home value: $479,800 ($331,600 statewide)
- Adults with a bachelor’s degree or higher: 47.1% (30.2% statewide)
- Avg. unemployment rate in 2023: 2.3% (3.1% statewide)
- Cost of living: 7.5% more than U.S. avg. (8.2% less than U.S. avg. statewide)
- Total population: 11,813
Illinois: DuPage County

- Median household income: $107,035 ($78,433 statewide)
- Poverty rate: 6.3% (11.8% statewide)
- Median home value: $361,700 ($239,100 statewide)
- Adults with a bachelor’s degree or higher: 51.1% (36.7% statewide)
- Avg. unemployment rate in 2023: 3.4% (4.5% statewide)
- Cost of living: 11.3% more than U.S. avg. (1.3% more than U.S. avg. statewide)
- Total population: 930,559
Indiana: Hamilton County

- Median household income: $114,866 ($67,173 statewide)
- Poverty rate: 4.2% (12.3% statewide)
- Median home value: $350,900 ($183,600 statewide)
- Adults with a bachelor’s degree or higher: 60.8% (28.2% statewide)
- Avg. unemployment rate in 2023: 2.5% (3.3% statewide)
- Cost of living: 2.6% more than U.S. avg. (8.2% less than U.S. avg. statewide)
- Total population: 349,527
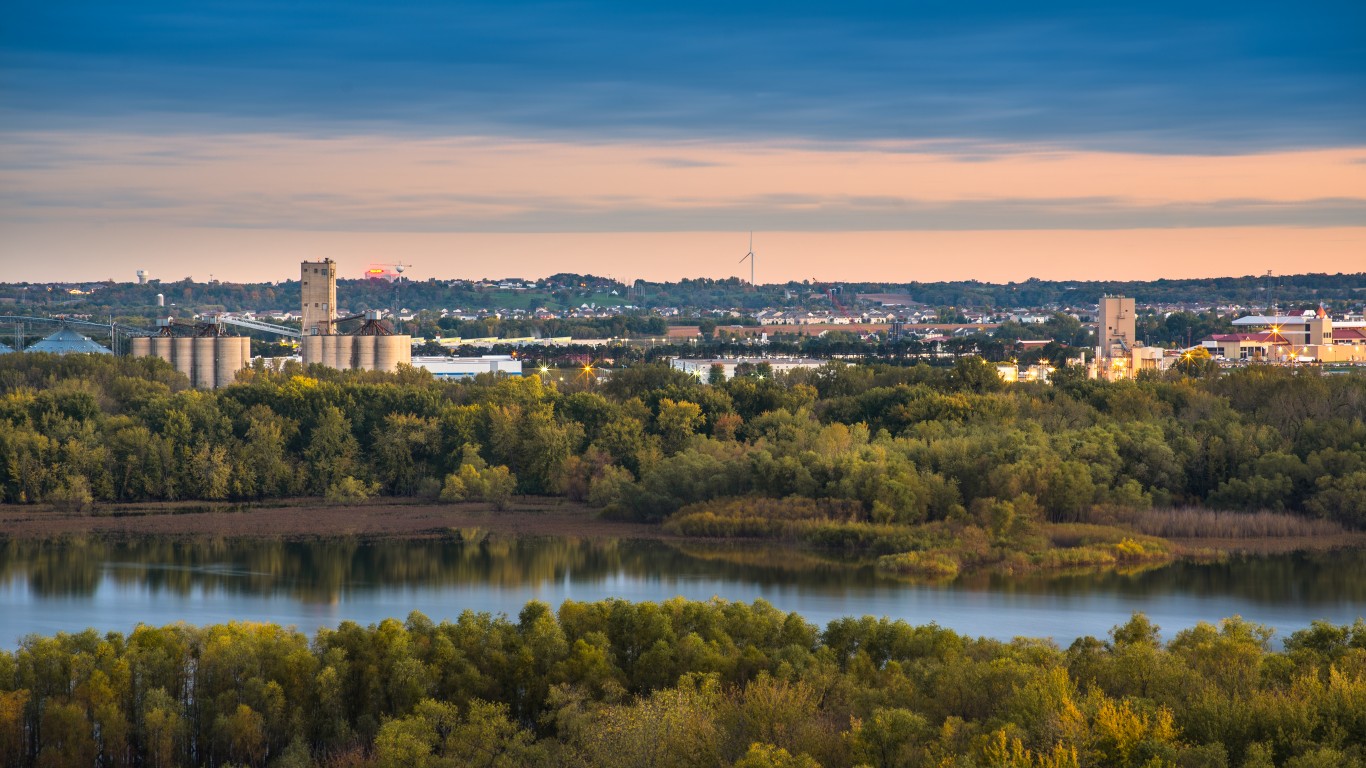
Iowa: Dallas County
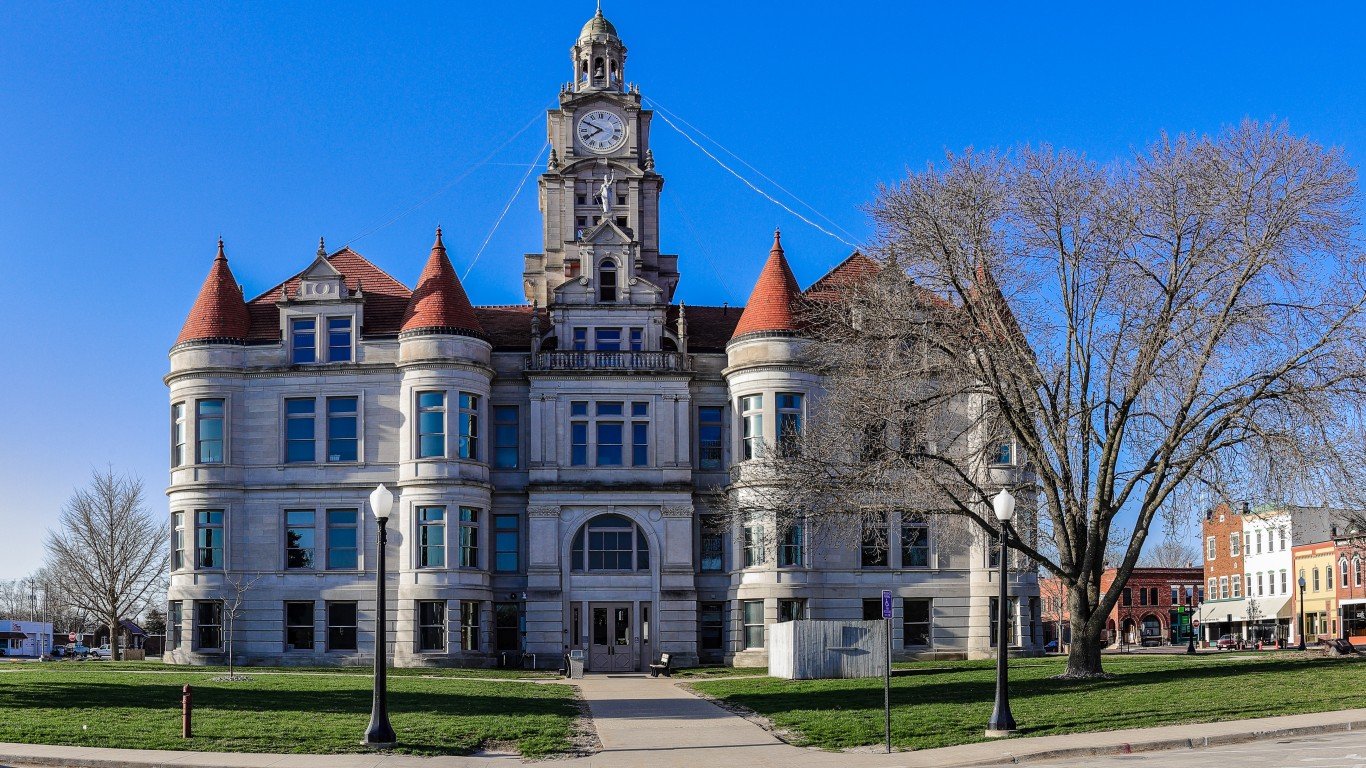
- Median household income: $99,533 ($70,571 statewide)
- Poverty rate: 5.7% (11.1% statewide)
- Median home value: $314,900 ($181,600 statewide)
- Adults with a bachelor’s degree or higher: 51.5% (30.3% statewide)
- Avg. unemployment rate in 2023: 2.2% (2.9% statewide)
- Cost of living: 5.2% less than U.S. avg. (11.6% less than U.S. avg. statewide)
- Total population: 100,367
Kansas: Johnson County
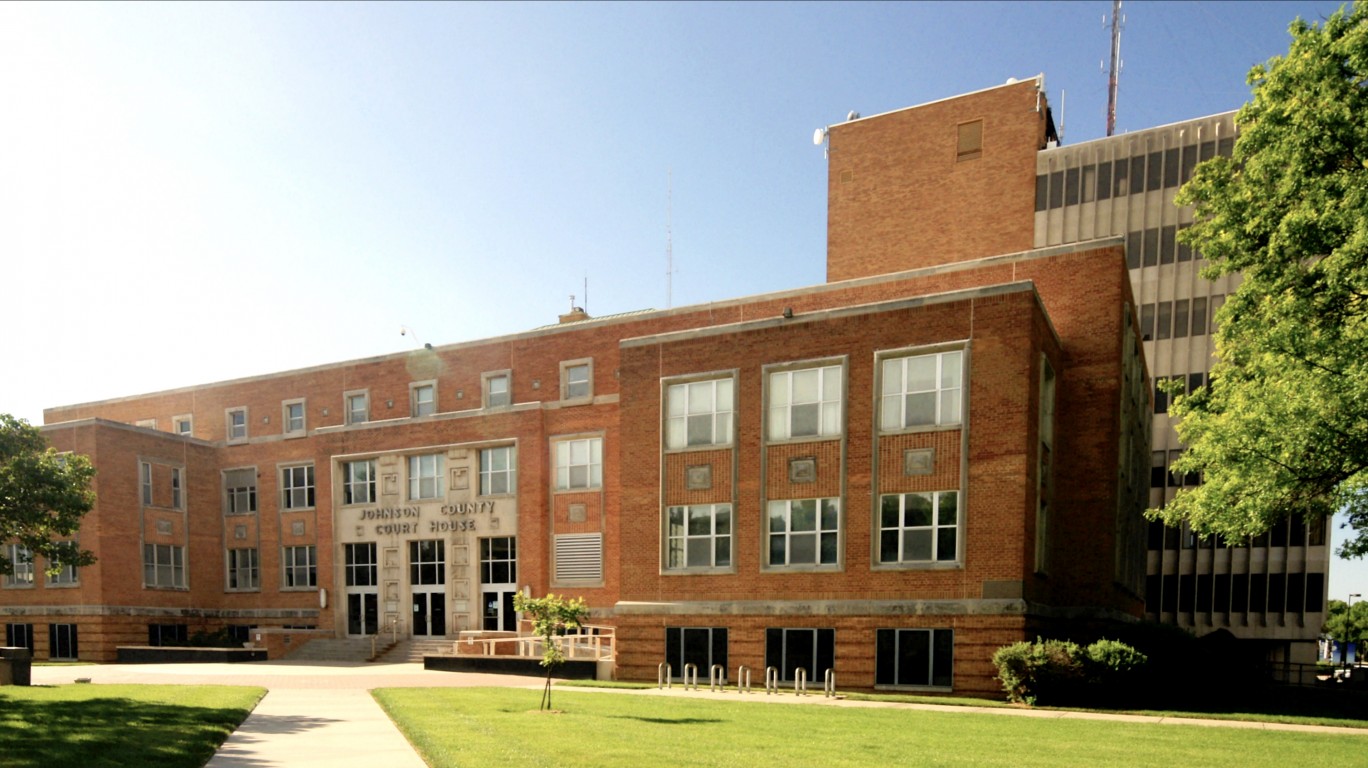
- Median household income: $103,644 ($69,747 statewide)
- Poverty rate: 5.3% (11.6% statewide)
- Median home value: $343,300 ($189,300 statewide)
- Adults with a bachelor’s degree or higher: 56.7% (34.7% statewide)
- Avg. unemployment rate in 2023: 2.4% (2.7% statewide)
- Cost of living: 1.6% less than U.S. avg. (10.0% less than U.S. avg. statewide)
- Total population: 610,742
Kentucky: Oldham County
- Median household income: $117,334 ($60,183 statewide)
- Poverty rate: 4.0% (16.1% statewide)
- Median home value: $357,500 ($177,000 statewide)
- Adults with a bachelor’s degree or higher: 45.4% (26.5% statewide)
- Avg. unemployment rate in 2023: 3.4% (4.2% statewide)
- Cost of living: 6.6% less than U.S. avg. (10.6% less than U.S. avg. statewide)
- Total population: 67,997
Louisiana: Ascension Parish
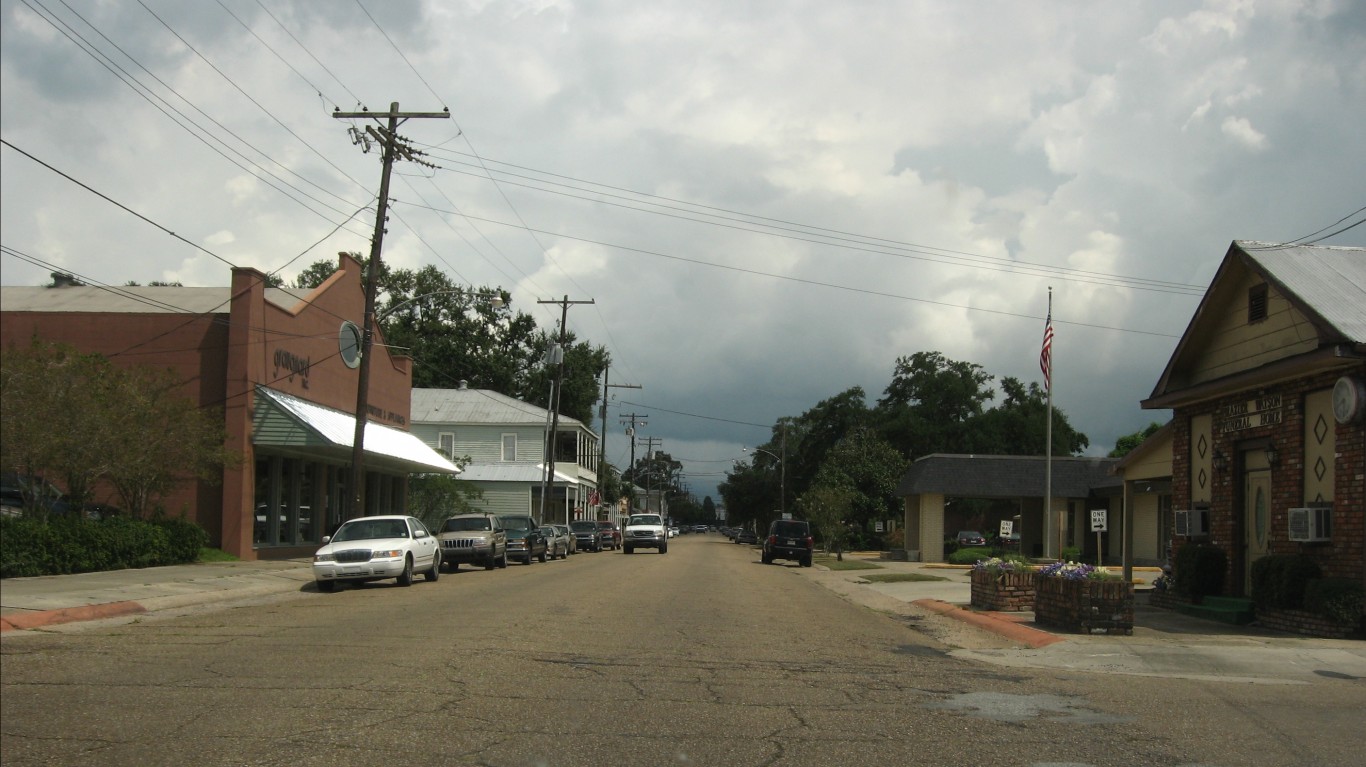
- Median household income: $93,800 ($57,852 statewide)
- Poverty rate: 9.9% (18.7% statewide)
- Median home value: $255,600 ($198,300 statewide)
- Adults with a bachelor’s degree or higher: 29.0% (26.1% statewide)
- Avg. unemployment rate in 2023: 3.0% (3.7% statewide)
- Cost of living: 6.0% less than U.S. avg. (9.4% less than U.S. avg. statewide)
- Total population: 126,973
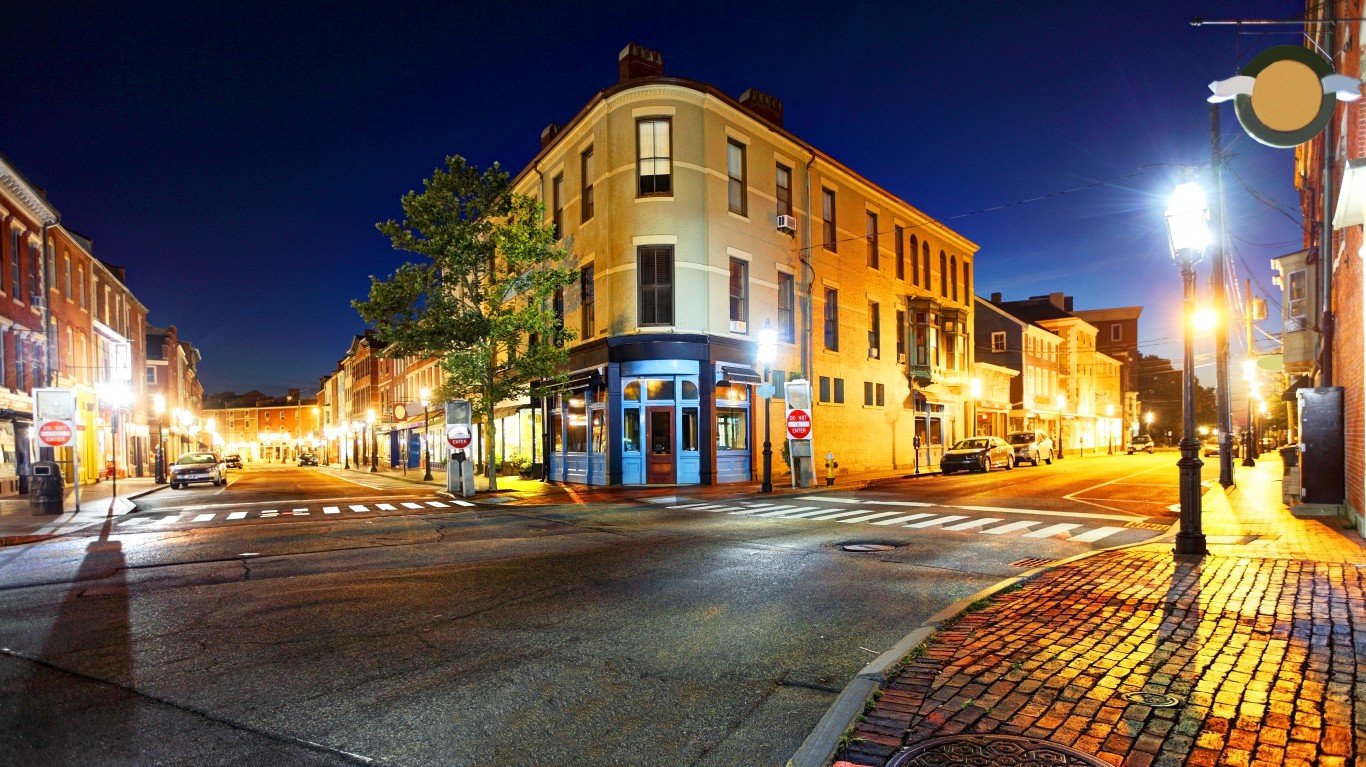
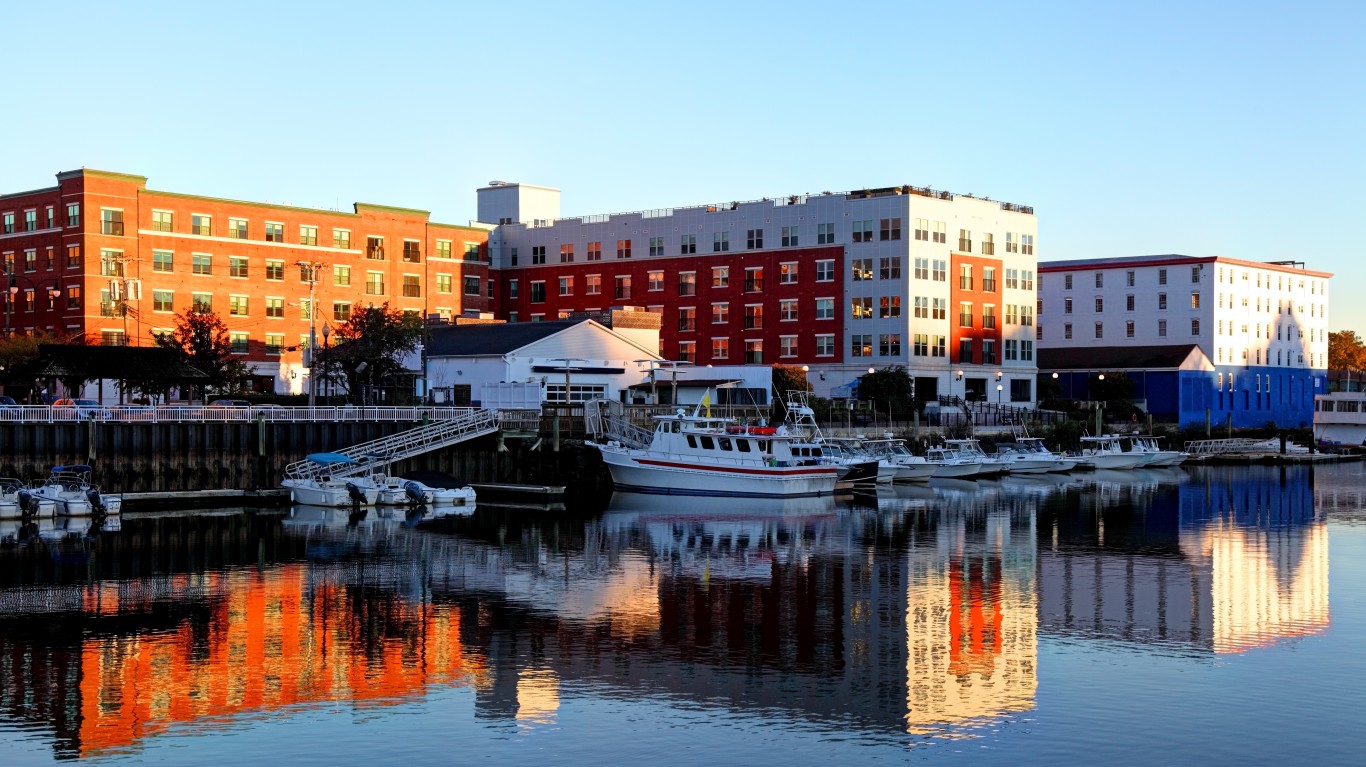
Maine: Cumberland County

- Median household income: $87,710 ($68,251 statewide)
- Poverty rate: 7.2% (10.9% statewide)
- Median home value: $372,900 ($244,800 statewide)
- Adults with a bachelor’s degree or higher: 50.6% (34.1% statewide)
- Avg. unemployment rate in 2023: 2.4% (2.9% statewide)
- Cost of living: 3.9% more than U.S. avg. (0.8% more than U.S. avg. statewide)
- Total population: 303,357
Maryland: Howard County

- Median household income: $140,971 ($98,461 statewide)
- Poverty rate: 5.4% (9.3% statewide)
- Median home value: $551,300 ($380,500 statewide)
- Adults with a bachelor’s degree or higher: 64.0% (42.2% statewide)
- Avg. unemployment rate in 2023: 1.7% (2.1% statewide)
- Cost of living: 13.2% more than U.S. avg. (5.0% more than U.S. avg. statewide)
- Total population: 332,011
Massachusetts: Nantucket County
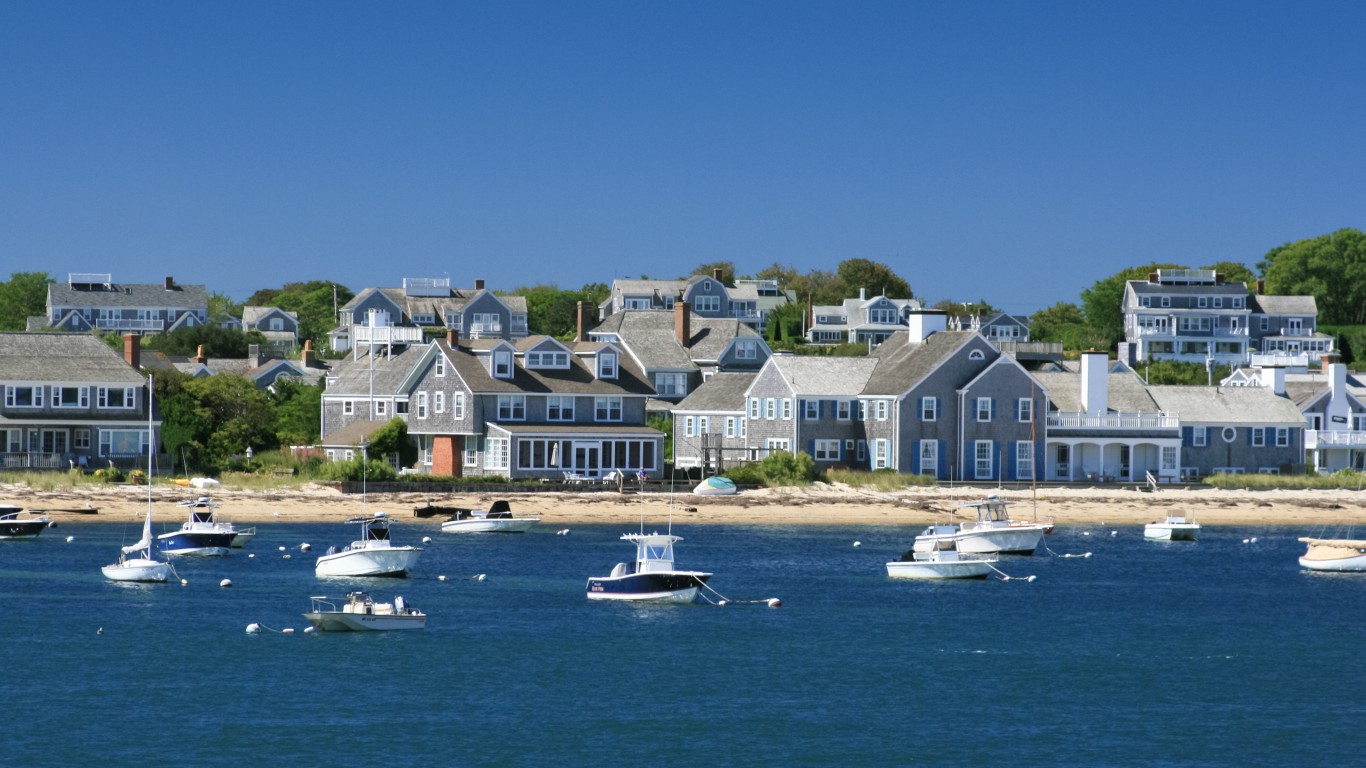
- Median household income: $135,590 ($96,505 statewide)
- Poverty rate: 4.9% (9.9% statewide)
- Median home value: $1,265,600 ($483,900 statewide)
- Adults with a bachelor’s degree or higher: 57.4% (45.9% statewide)
- Avg. unemployment rate in 2023: 5.8% (3.4% statewide)
- Cost of living: 1.0% less than U.S. avg. (9.4% more than U.S. avg. statewide)
- Total population: 14,065
Michigan: Livingston County
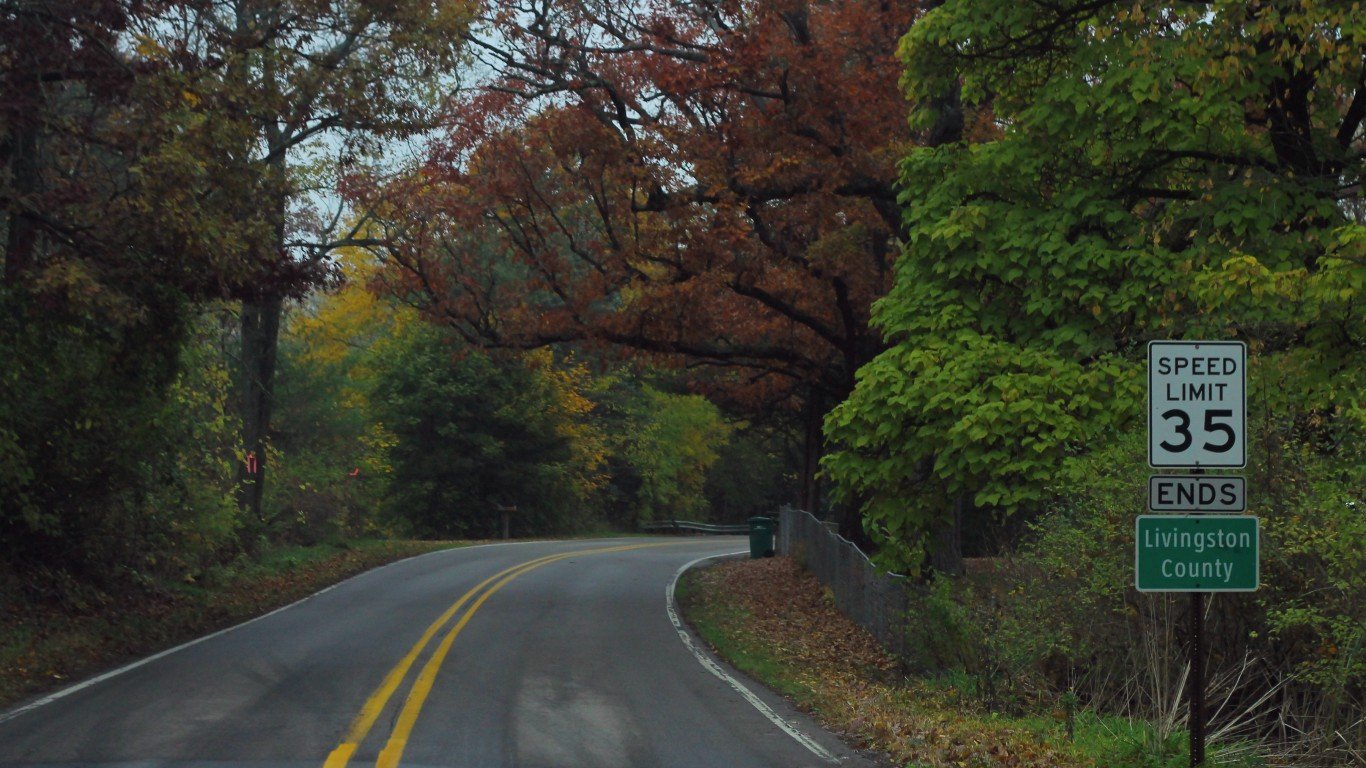
- Median household income: $96,135 ($68,505 statewide)
- Poverty rate: 4.9% (13.1% statewide)
- Median home value: $311,800 ($201,100 statewide)
- Adults with a bachelor’s degree or higher: 38.1% (31.1% statewide)
- Avg. unemployment rate in 2023: 2.7% (3.9% statewide)
- Cost of living: 1.1% less than U.S. avg. (6.6% less than U.S. avg. statewide)
- Total population: 194,302
Minnesota: Scott County
- Median household income: $118,268 ($84,313 statewide)
- Poverty rate: 5.0% (9.3% statewide)
- Median home value: $376,000 ($286,800 statewide)
- Adults with a bachelor’s degree or higher: 42.9% (38.2% statewide)
- Avg. unemployment rate in 2023: 2.5% (2.8% statewide)
- Cost of living: 1.0% more than U.S. avg. (2.3% less than U.S. avg. statewide)
- Total population: 151,347
Mississippi: DeSoto County
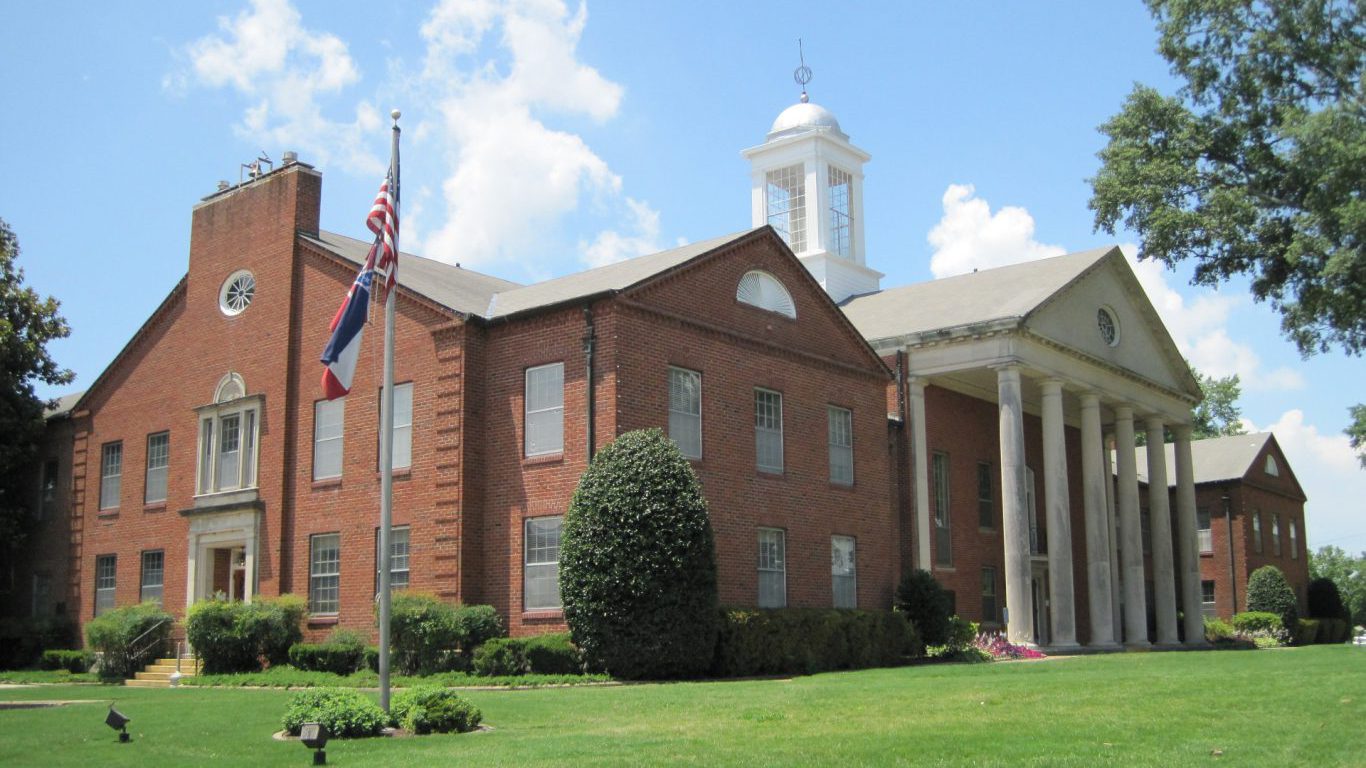
- Median household income: $79,666 ($52,985 statewide)
- Poverty rate: 9.8% (19.2% statewide)
- Median home value: $227,600 ($151,000 statewide)
- Adults with a bachelor’s degree or higher: 27.4% (23.9% statewide)
- Avg. unemployment rate in 2023: 2.8% (3.2% statewide)
- Cost of living: 9.6% less than U.S. avg. (12.7% less than U.S. avg. statewide)
- Total population: 186,214
Missouri: St. Charles County
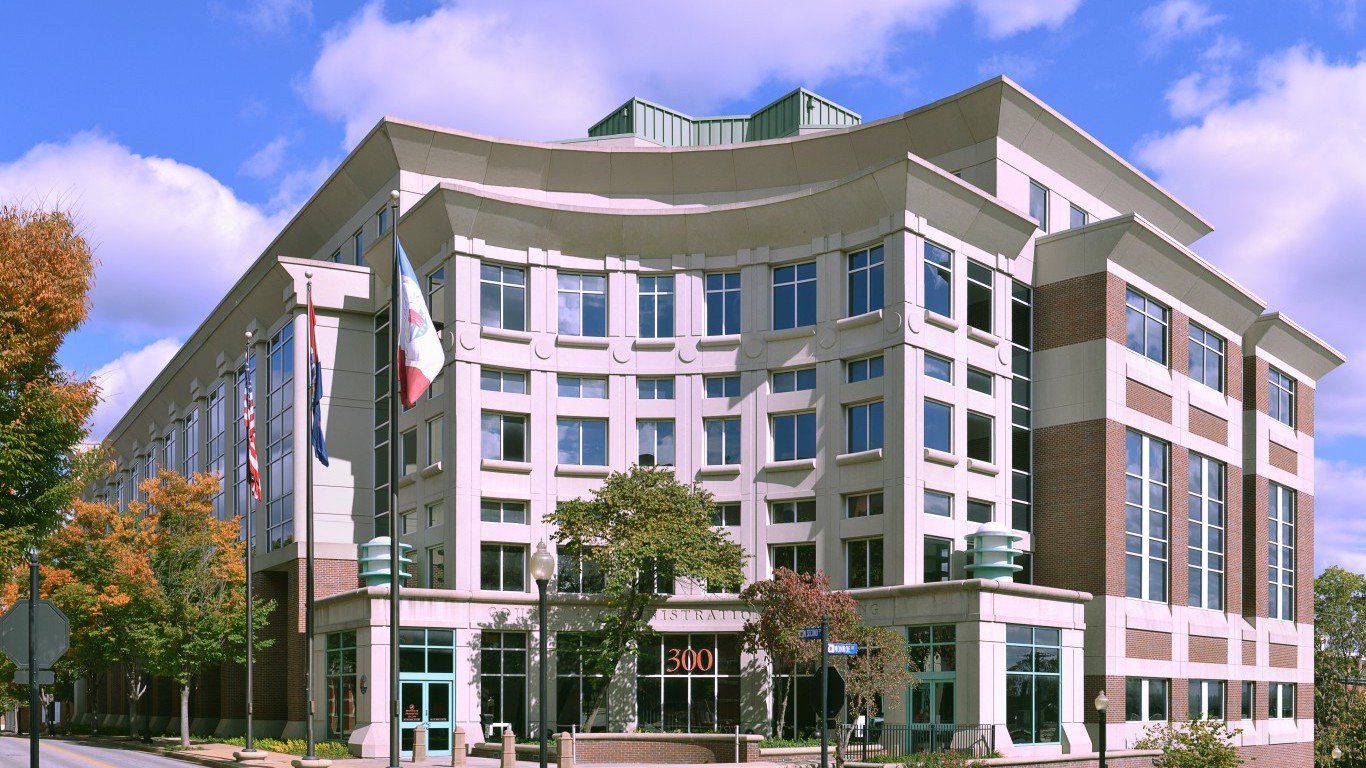
- Median household income: $99,596 ($65,920 statewide)
- Poverty rate: 4.5% (12.8% statewide)
- Median home value: $278,300 ($199,400 statewide)
- Adults with a bachelor’s degree or higher: 42.0% (31.2% statewide)
- Avg. unemployment rate in 2023: 2.5% (3.0% statewide)
- Cost of living: 1.9% less than U.S. avg. (8.9% less than U.S. avg. statewide)
- Total population: 406,262
Montana: Gallatin County

- Median household income: $83,434 ($66,341 statewide)
- Poverty rate: 10.6% (12.4% statewide)
- Median home value: $526,700 ($305,700 statewide)
- Adults with a bachelor’s degree or higher: 52.9% (34.0% statewide)
- Avg. unemployment rate in 2023: 2.1% (2.9% statewide)
- Cost of living: 2.1% less than U.S. avg. (9.7% less than U.S. avg. statewide)
- Total population: 119,685
Nebraska: Sarpy County
- Median household income: $95,911 ($71,722 statewide)
- Poverty rate: 5.5% (10.4% statewide)
- Median home value: $263,000 ($205,600 statewide)
- Adults with a bachelor’s degree or higher: 41.2% (33.5% statewide)
- Avg. unemployment rate in 2023: 2.2% (2.3% statewide)
- Cost of living: 5.9% less than U.S. avg. (10.2% less than U.S. avg. statewide)
- Total population: 191,272
Nevada: Lander County
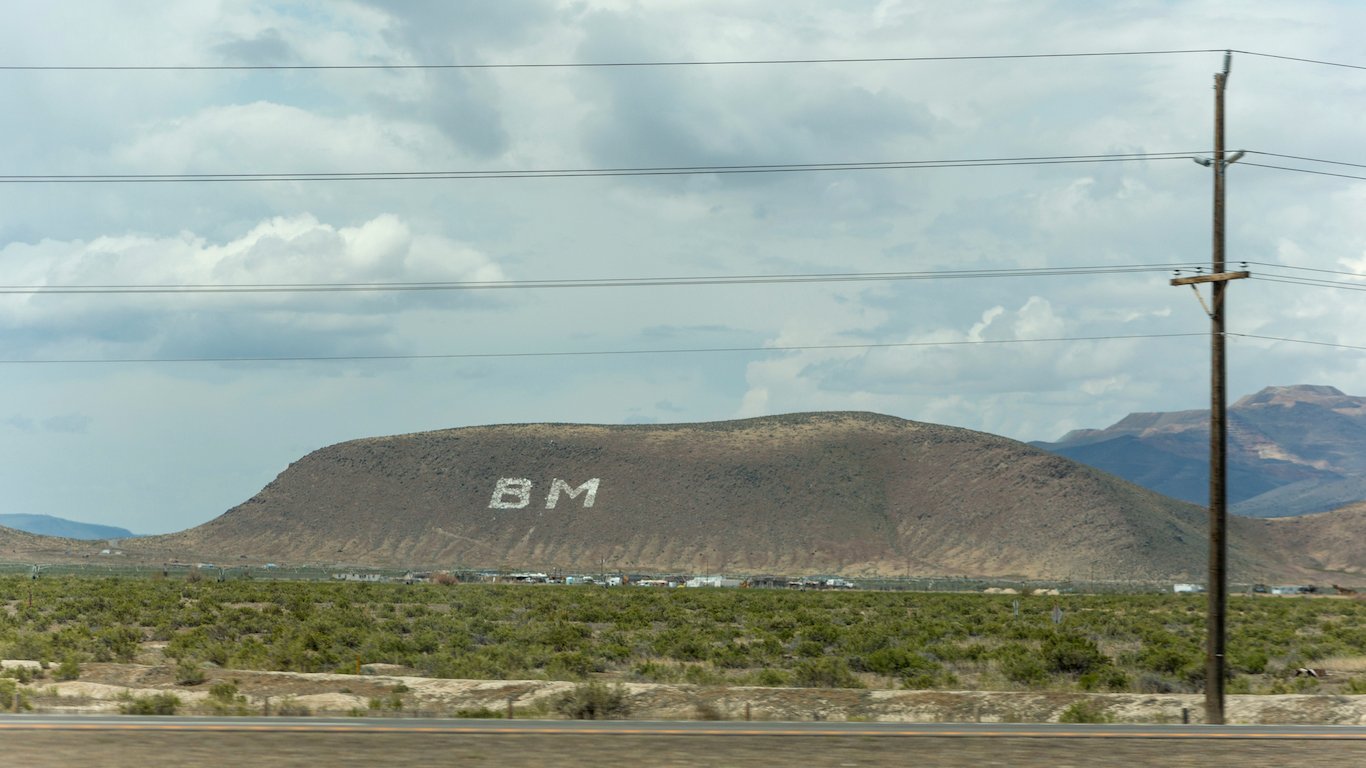
- Median household income: $92,388 ($71,646 statewide)
- Poverty rate: 10.8% (12.7% statewide)
- Median home value: $198,000 ($373,800 statewide)
- Adults with a bachelor’s degree or higher: 14.0% (26.5% statewide)
- Avg. unemployment rate in 2023: 3.6% (5.1% statewide)
- Cost of living: 10.8% less than U.S. avg. (3.6% less than U.S. avg. statewide)
- Total population: 5,728
New Hampshire: Rockingham County
- Median household income: $110,225 ($90,845 statewide)
- Poverty rate: 4.8% (7.3% statewide)
- Median home value: $424,100 ($337,100 statewide)
- Adults with a bachelor’s degree or higher: 43.6% (39.0% statewide)
- Avg. unemployment rate in 2023: 2.3% (2.2% statewide)
- Cost of living: 4.4% more than U.S. avg. (7.6% more than U.S. avg. statewide)
- Total population: 315,169
New Jersey: Hunterdon County

- Median household income: $133,534 ($97,126 statewide)
- Poverty rate: 3.7% (9.7% statewide)
- Median home value: $478,600 ($401,400 statewide)
- Adults with a bachelor’s degree or higher: 55.5% (42.3% statewide)
- Avg. unemployment rate in 2023: 3.5% (4.4% statewide)
- Cost of living: 9.9% more than U.S. avg. (8.8% more than U.S. avg. statewide)
- Total population: 129,099
New Mexico: Los Alamos County
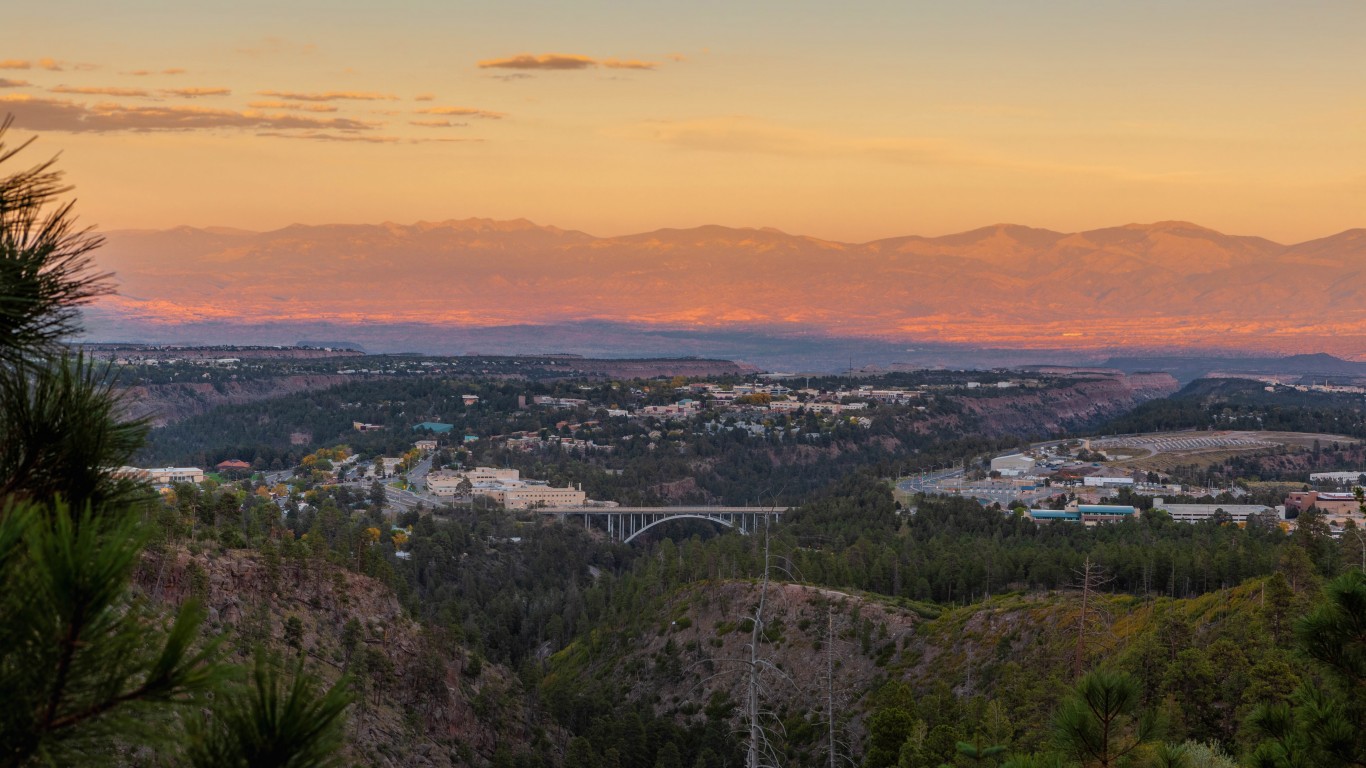
- Median household income: $135,801 ($58,722 statewide)
- Poverty rate: 3.7% (18.3% statewide)
- Median home value: $412,700 ($216,000 statewide)
- Adults with a bachelor’s degree or higher: 69.7% (29.1% statewide)
- Avg. unemployment rate in 2023: 1.9% (3.8% statewide)
- Cost of living: 5.1% less than U.S. avg. (9.0% less than U.S. avg. statewide)
- Total population: 19,253
New York: Nassau County
- Median household income: $137,709 ($81,386 statewide)
- Poverty rate: 5.4% (13.6% statewide)
- Median home value: $633,800 ($384,100 statewide)
- Adults with a bachelor’s degree or higher: 48.2% (38.8% statewide)
New York: Nassau County (continued)
- Avg. unemployment rate in 2023: 3.1% (4.2% statewide)
- Cost of living: 20.6% more than U.S. avg. (7.6% more than U.S. avg. statewide)
- Total population: 1,389,160
North Carolina: Wake County

- Median household income: $96,734 ($66,186 statewide)
- Poverty rate: 8.2% (13.3% statewide)
- Median home value: $385,700 ($234,900 statewide)
- Adults with a bachelor’s degree or higher: 55.7% (33.9% statewide)
- Avg. unemployment rate in 2023: 3.0% (3.5% statewide)
- Cost of living: 0.3% less than U.S. avg. (5.8% less than U.S. avg. statewide)
- Total population: 1,132,103
North Dakota: Divide County
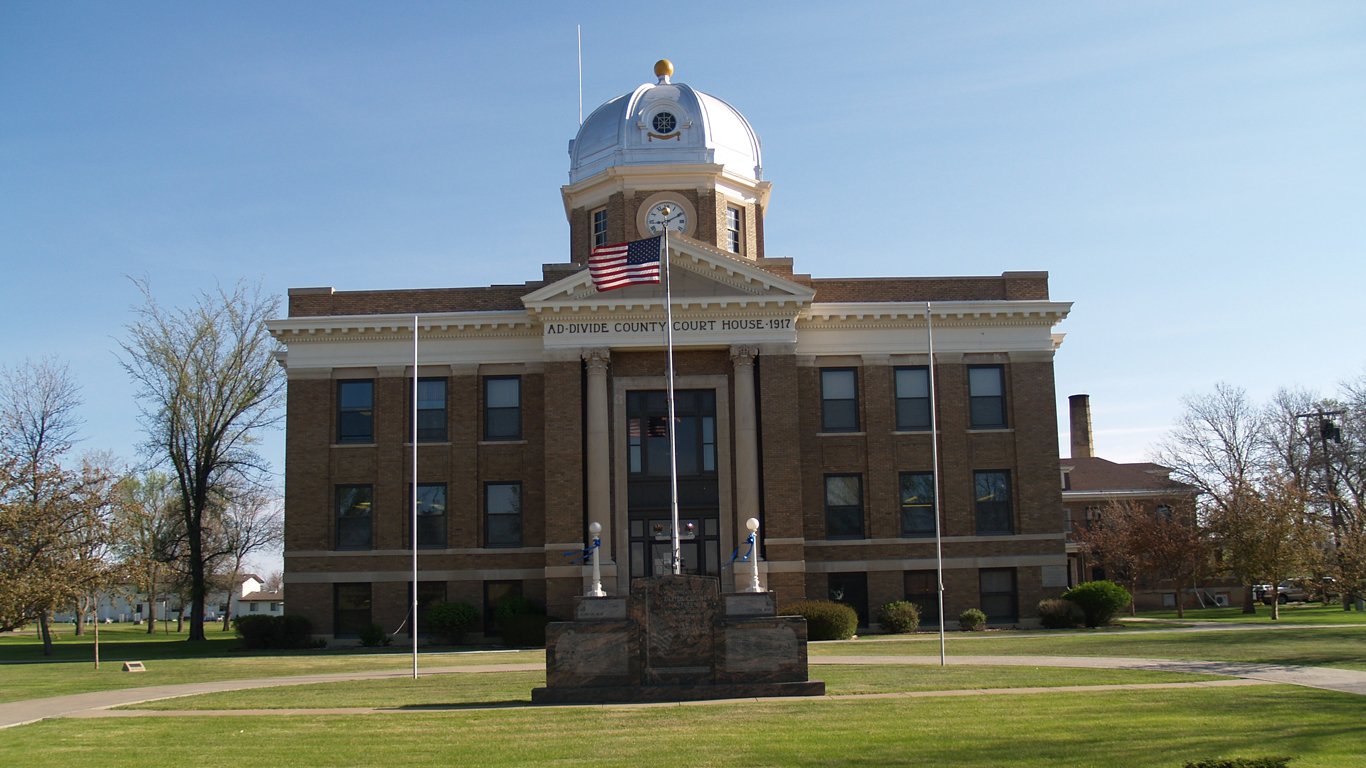
- Median household income: $95,938 ($73,959 statewide)
- Poverty rate: 6.6% (10.8% statewide)
- Median home value: $162,900 ($232,500 statewide)
- Adults with a bachelor’s degree or higher: 21.3% (31.4% statewide)
- Avg. unemployment rate in 2023: 1.2% (1.9% statewide)
- Cost of living: 9.0% less than U.S. avg. (11.3% less than U.S. avg. statewide)
- Total population: 2,195
Ohio: Delaware County
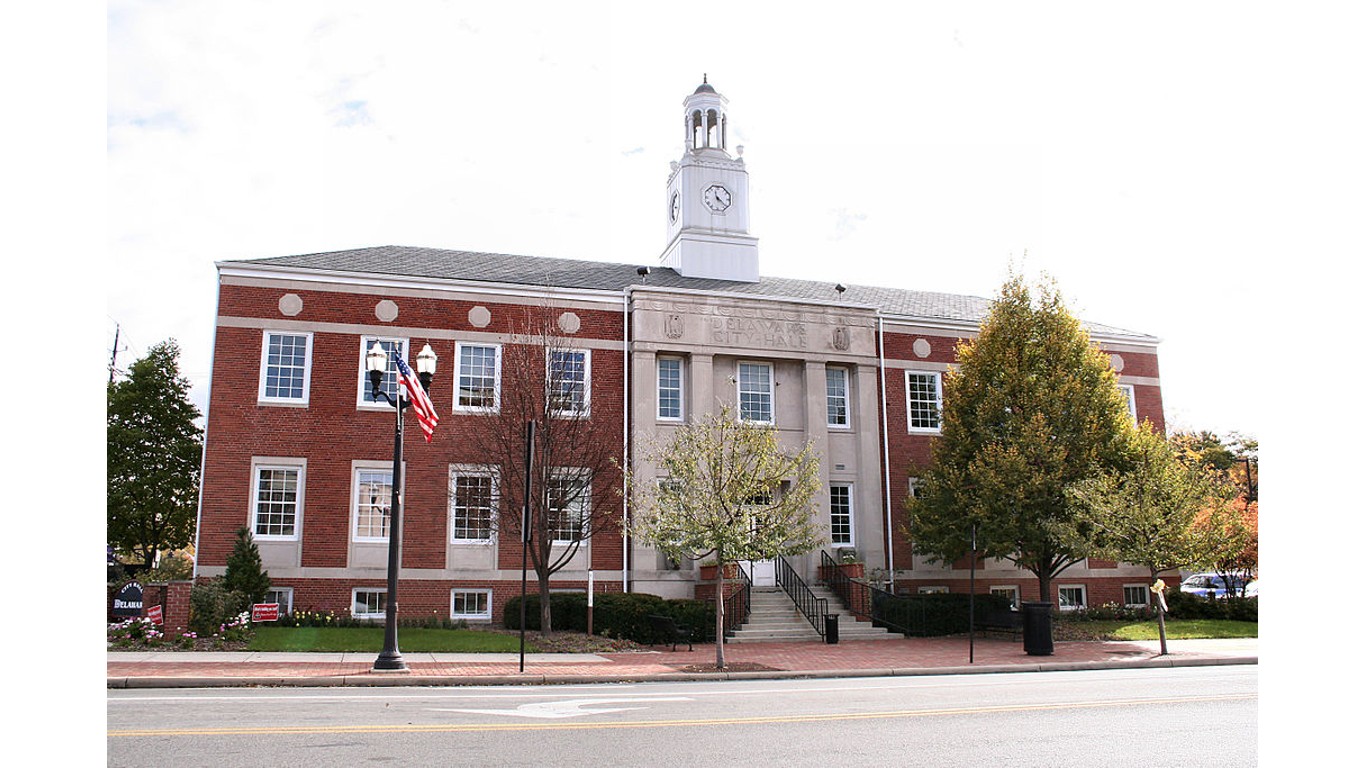
- Median household income: $123,995 ($66,990 statewide)
- Poverty rate: 4.5% (13.3% statewide)
- Median home value: $393,000 ($183,300 statewide)
- Adults with a bachelor’s degree or higher: 57.4% (30.4% statewide)
- Avg. unemployment rate in 2023: 2.8% (3.5% statewide)
- Cost of living: 0.5% less than U.S. avg. (8.6% less than U.S. avg. statewide)
- Total population: 216,074
Oklahoma: Canadian County
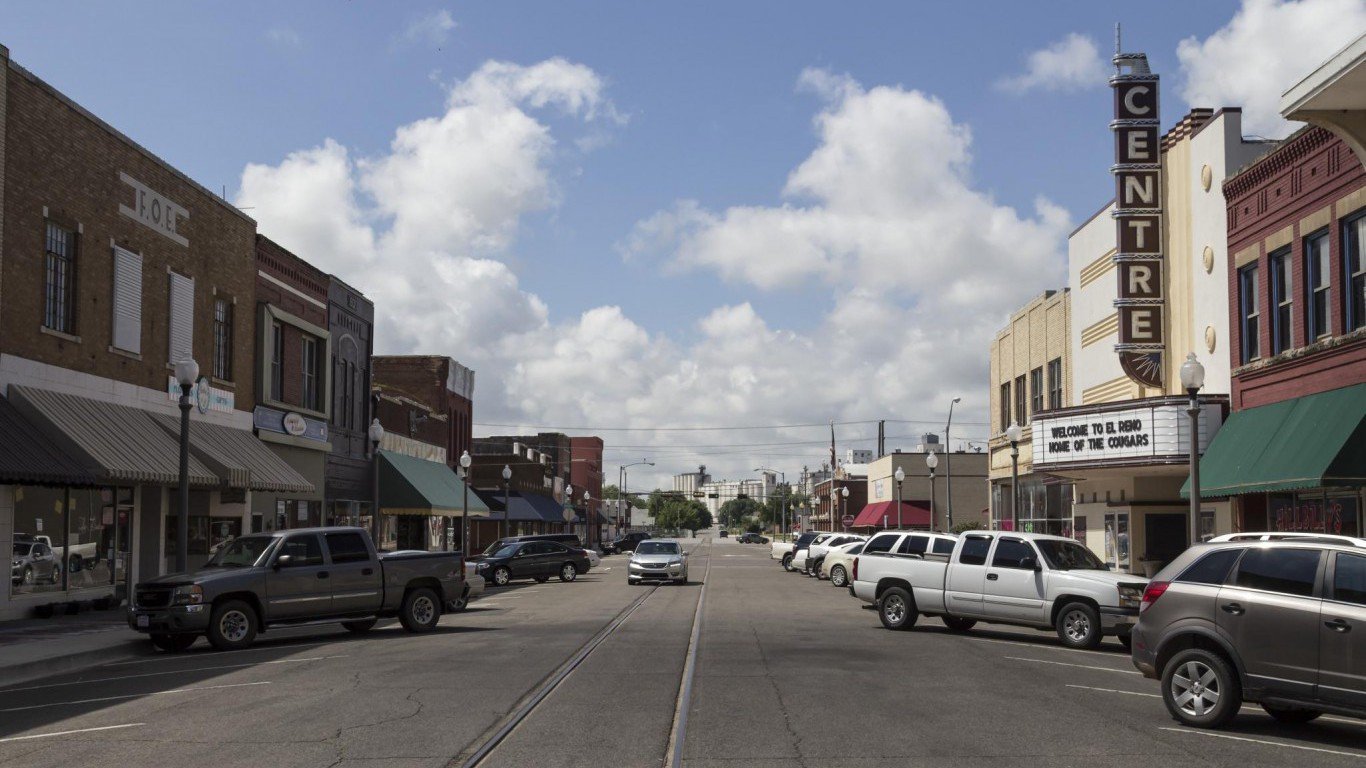
- Median household income: $82,364 ($61,364 statewide)
- Poverty rate: 8.0% (15.2% statewide)
- Median home value: $212,700 ($170,500 statewide)
- Adults with a bachelor’s degree or higher: 32.0% (27.3% statewide)
- Avg. unemployment rate in 2023: 2.7% (3.2% statewide)
- Cost of living: 6.2% less than U.S. avg. (11.2% less than U.S. avg. statewide)
- Total population: 156,681
Oregon: Washington County

- Median household income: $100,121 ($76,632 statewide)
- Poverty rate: 8.2% (11.9% statewide)
- Median home value: $504,300 ($423,100 statewide)
- Adults with a bachelor’s degree or higher: 45.8% (35.5% statewide)
- Avg. unemployment rate in 2023: 3.2% (3.7% statewide)
- Cost of living: 7.3% more than U.S. avg. (6.6% more than U.S. avg. statewide)
- Total population: 599,541
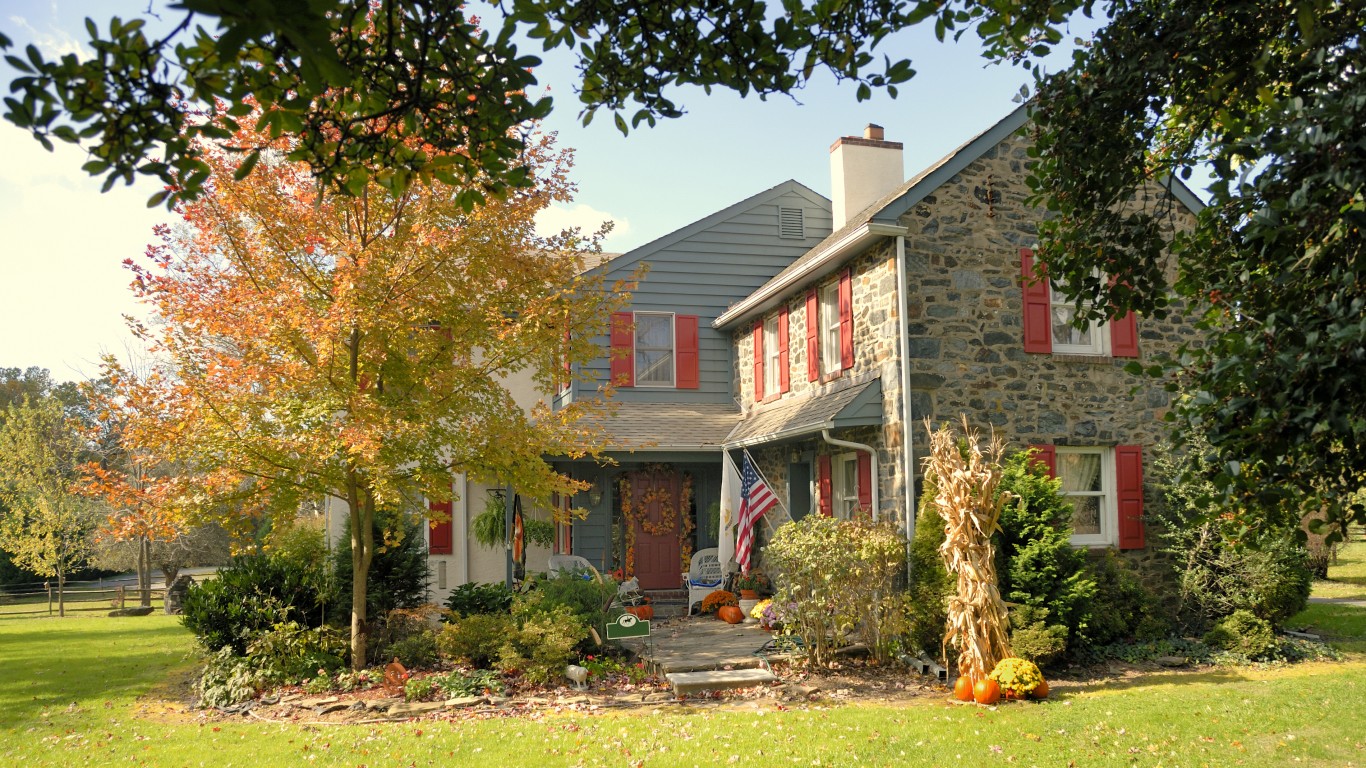
Pennsylvania: Chester County
- Median household income: $118,574 ($73,170 statewide)
- Poverty rate: 6.0% (11.8% statewide)
- Median home value: $435,000 ($226,200 statewide)
- Adults with a bachelor’s degree or higher: 56.1% (33.8% statewide)
- Avg. unemployment rate in 2023: 2.6% (3.4% statewide)
- Cost of living: 3.1% more than U.S. avg. (3.8% less than U.S. avg. statewide)
- Total population: 536,474
Rhode Island: Bristol County
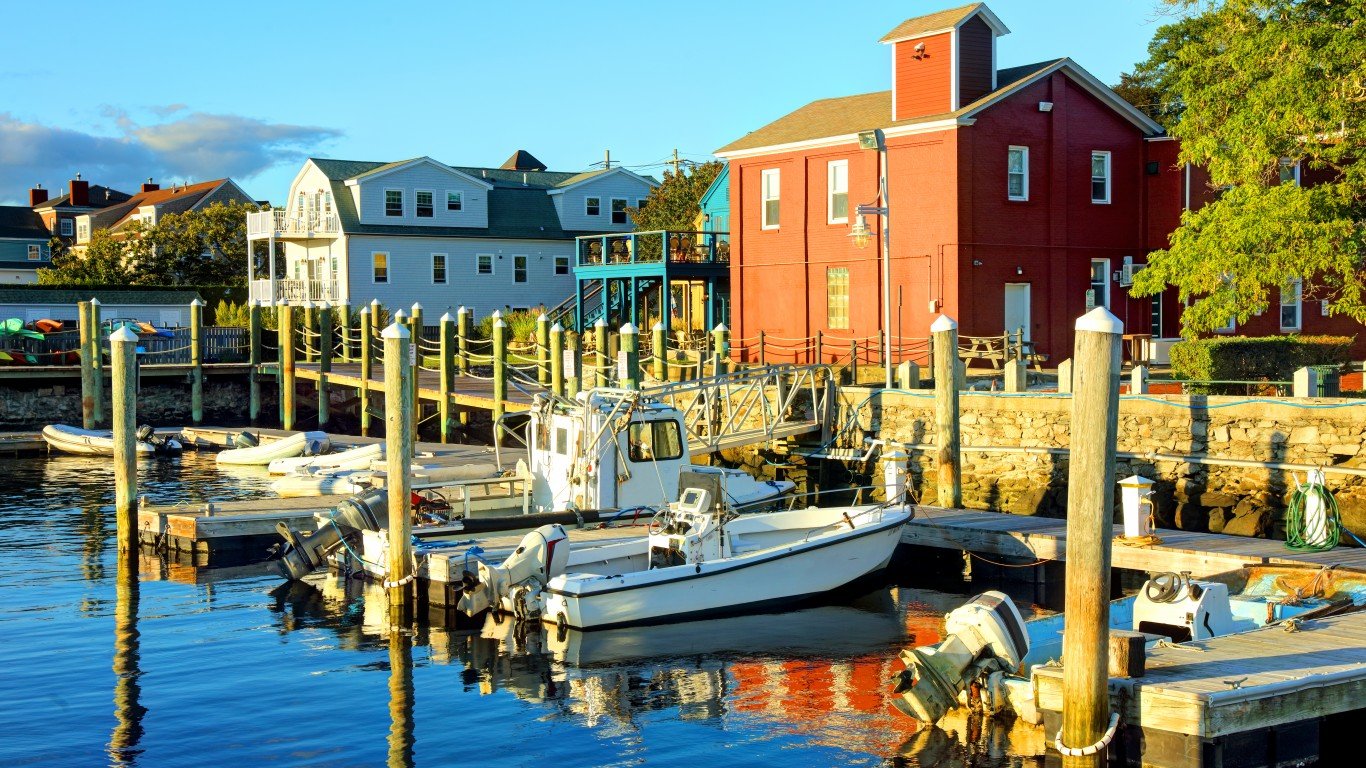
- Median household income: $105,875 ($81,370 statewide)
- Poverty rate: 7.2% (11.2% statewide)
- Median home value: $443,700 ($343,100 statewide)
- Adults with a bachelor’s degree or higher: 51.4% (36.3% statewide)
- Avg. unemployment rate in 2023: 2.5% (3.0% statewide)
- Cost of living: 10.8% more than U.S. avg. (4.7% more than U.S. avg. statewide)
- Total population: 50,658
South Carolina: Beaufort County
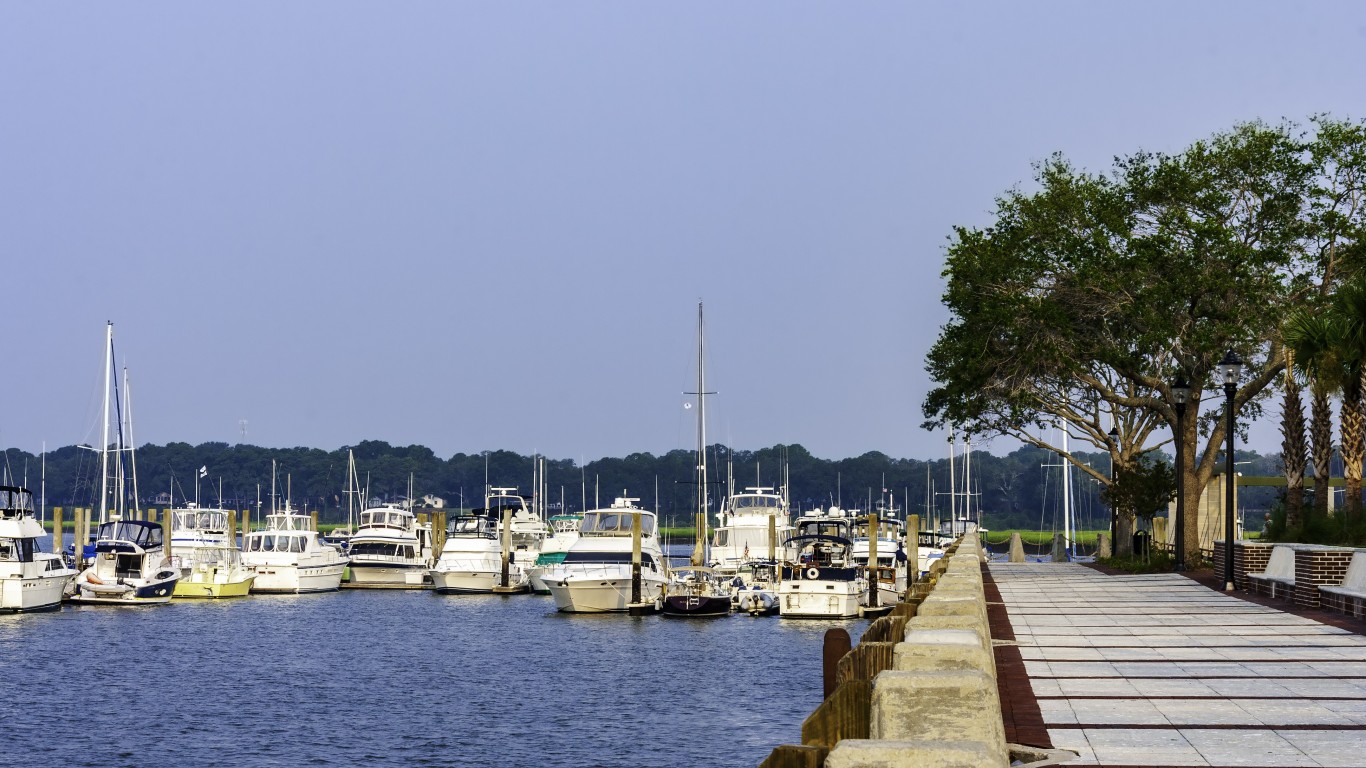
- Median household income: $81,260 ($63,623 statewide)
- Poverty rate: 10.4% (14.4% statewide)
- Median home value: $377,900 ($216,200 statewide)
- Adults with a bachelor’s degree or higher: 43.4% (30.6% statewide)
- Avg. unemployment rate in 2023: 2.8% (3.0% statewide)
- Cost of living: 0.3% less than U.S. avg. (6.4% less than U.S. avg. statewide)
- Total population: 189,071
South Dakota: Lincoln County
- Median household income: $92,317 ($69,457 statewide)
- Poverty rate: 6.5% (12.3% statewide)
- Median home value: $292,200 ($219,500 statewide)
- Adults with a bachelor’s degree or higher: 41.8% (30.4% statewide)
- Avg. unemployment rate in 2023: 1.6% (2.0% statewide)
- Cost of living: 4.2% less than U.S. avg. (12.0% less than U.S. avg. statewide)
- Total population: 65,801
Tennessee: Williamson County
- Median household income: $125,943 ($64,035 statewide)
- Poverty rate: 4.2% (14.0% statewide)
- Median home value: $611,100 ($232,100 statewide)
- Adults with a bachelor’s degree or higher: 62.0% (29.7% statewide)
- Avg. unemployment rate in 2023: 2.5% (3.3% statewide)
- Cost of living: 4.3% more than U.S. avg. (8.2% less than U.S. avg. statewide)
- Total population: 248,897
Texas: Rockwall County

- Median household income: $121,303 ($73,035 statewide)
- Poverty rate: 4.2% (13.9% statewide)
- Median home value: $363,500 ($238,000 statewide)
- Adults with a bachelor’s degree or higher: 43.9% (32.3% statewide)
- Avg. unemployment rate in 2023: 3.6% (3.9% statewide)
- Cost of living: 8.1% more than U.S. avg. (2.5% less than U.S. avg. statewide)
- Total population: 110,631
Utah: Summit County

- Median household income: $126,392 ($86,833 statewide)
- Poverty rate: 5.2% (8.5% statewide)
- Median home value: $895,100 ($408,500 statewide)
- Adults with a bachelor’s degree or higher: 57.4% (36.1% statewide)
Utah: Summit County (continued)
- Avg. unemployment rate in 2023: 2.4% (2.6% statewide)
- Cost of living: 11.0% more than U.S. avg. (5.5% less than U.S. avg. statewide)
- Total population: 42,524
Vermont: Chittenden County
- Median household income: $89,494 ($74,014 statewide)
- Poverty rate: 11.2% (10.4% statewide)
- Median home value: $378,300 ($272,400 statewide)
- Adults with a bachelor’s degree or higher: 55.7% (41.7% statewide)
- Avg. unemployment rate in 2023: 1.6% (2.0% statewide)
- Cost of living: 4.6% more than U.S. avg. (1.1% more than U.S. avg. statewide)
- Total population: 168,309
Virginia: Loudoun County
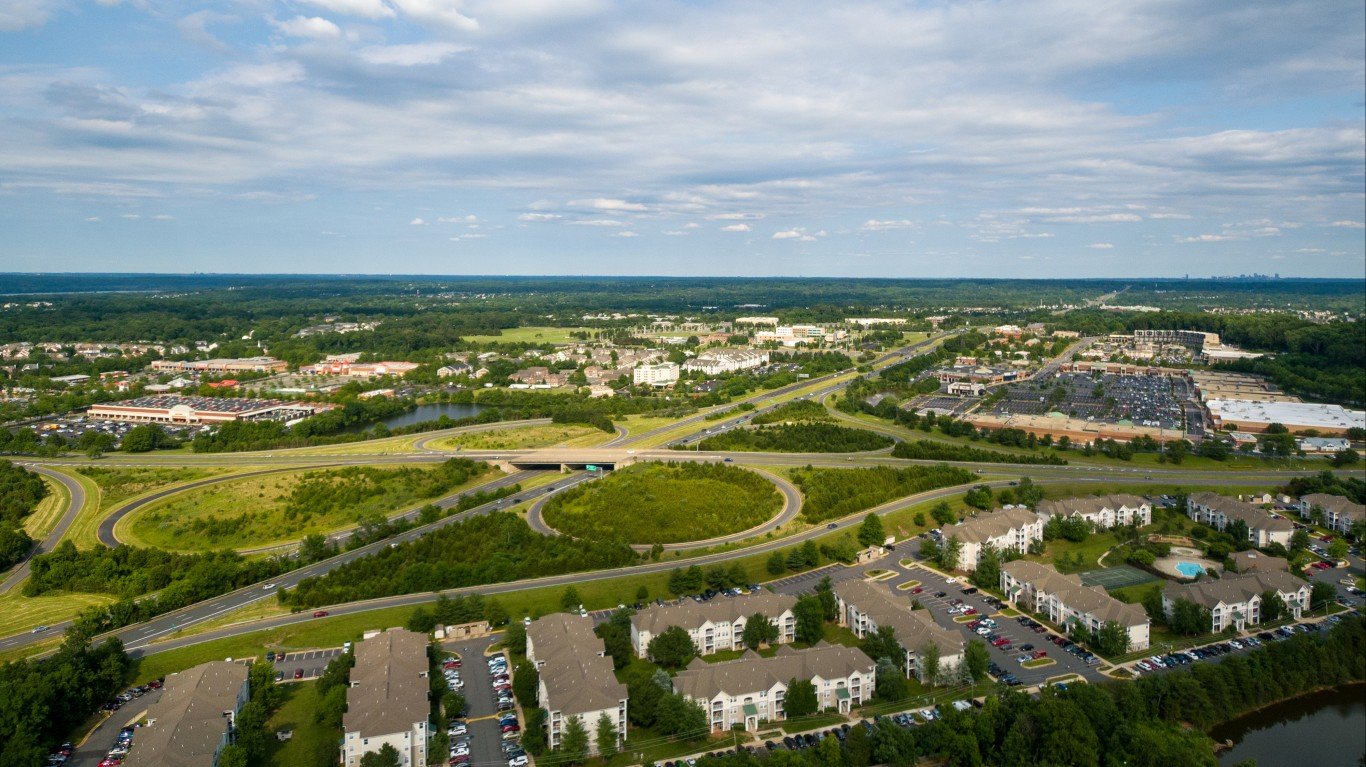
- Median household income: $170,463 ($87,249 statewide)
- Poverty rate: 3.8% (10.0% statewide)
- Median home value: $657,000 ($339,800 statewide)
- Adults with a bachelor’s degree or higher: 63.5% (41.0% statewide)
Virginia: Loudoun County (continued)

- Avg. unemployment rate in 2023: 2.5% (2.9% statewide)
- Cost of living: 15.2% more than U.S. avg. (2.1% more than U.S. avg. statewide)
- Total population: 420,773
Washington: King County

- Median household income: $116,340 ($90,325 statewide)
- Poverty rate: 8.4% (9.9% statewide)
- Median home value: $761,500 ($473,400 statewide)
- Adults with a bachelor’s degree or higher: 54.8% (38.0% statewide)
- Avg. unemployment rate in 2023: 3.4% (4.1% statewide)
- Cost of living: 17.8% more than U.S. avg. (9.8% more than U.S. avg. statewide)
- Total population: 2,254,371
West Virginia: Jefferson County
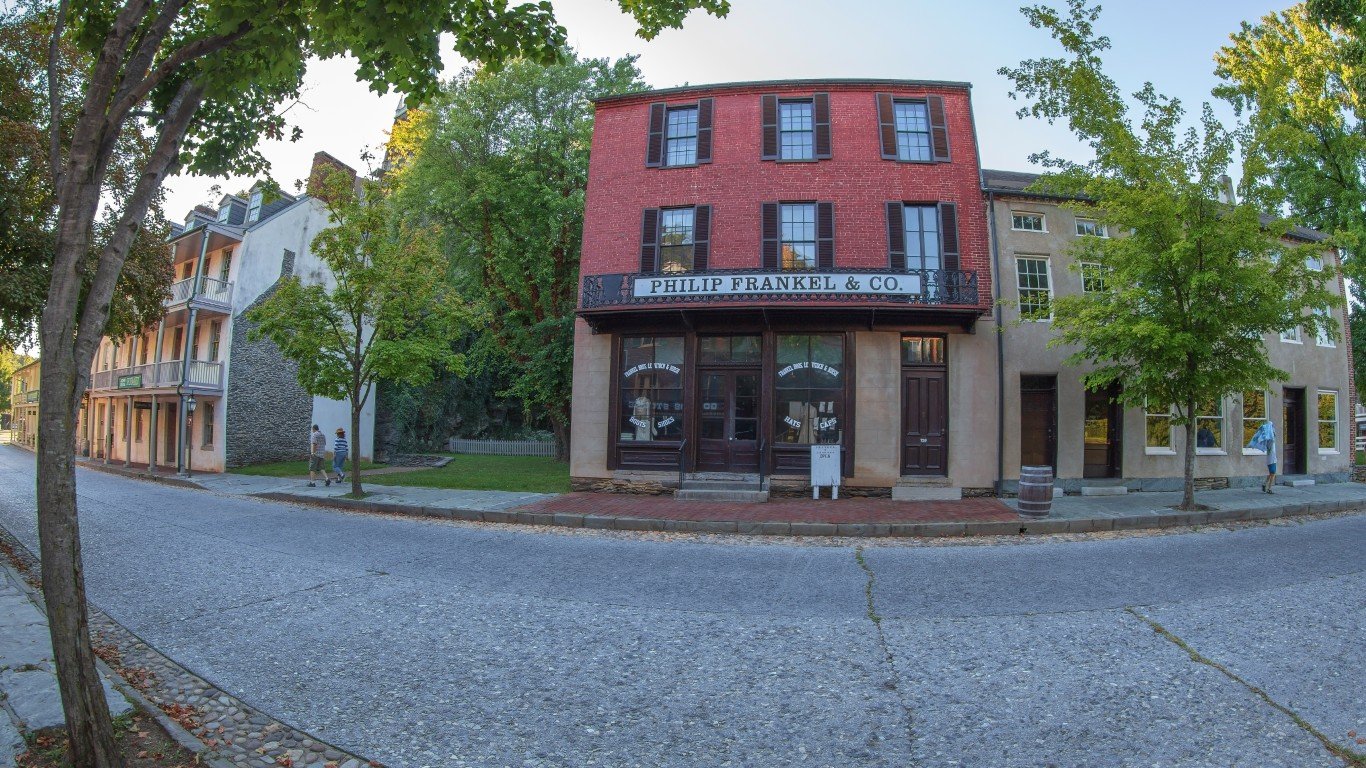
- Median household income: $93,744 ($55,217 statewide)
- Poverty rate: 9.1% (16.8% statewide)
- Median home value: $303,400 ($145,800 statewide)
- Adults with a bachelor’s degree or higher: 32.2% (22.7% statewide)
- Avg. unemployment rate in 2023: 2.7% (3.9% statewide)
- Cost of living: 6.1% less than U.S. avg. (10.8% less than U.S. avg. statewide)
- Total population: 58,043
Wisconsin: Waukesha County
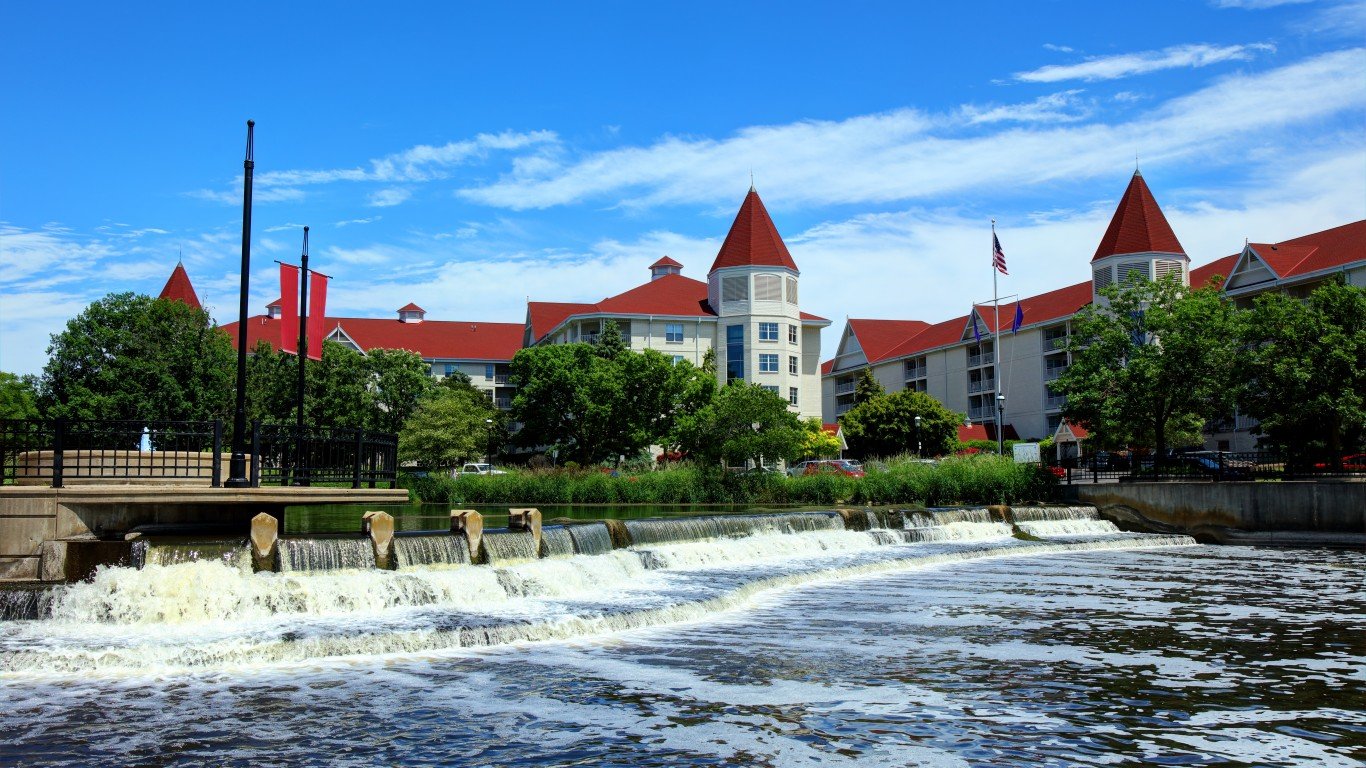
- Median household income: $101,639 ($72,458 statewide)
- Poverty rate: 4.9% (10.7% statewide)
- Median home value: $352,600 ($231,400 statewide)
- Adults with a bachelor’s degree or higher: 47.2% (32.0% statewide)
- Avg. unemployment rate in 2023: 2.6% (3.0% statewide)
- Cost of living: 1.9% less than U.S. avg. (7.7% less than U.S. avg. statewide)
- Total population: 407,290
Wyoming: Teton County

- Median household income: $108,279 ($72,495 statewide)
- Poverty rate: 6.9% (10.7% statewide)
- Median home value: $1,137,500 ($269,900 statewide)
- Adults with a bachelor’s degree or higher: 60.3% (29.0% statewide)
Wyoming: Teton County (continued)

- Avg. unemployment rate in 2023: 2.1% (2.9% statewide)
- Cost of living: 9.6% more than U.S. avg. (8.1% less than U.S. avg. statewide)
- Total population: 23,346
The post Check Out Every State’s Wealthiest Counties appeared first on 24/7 Wall St..