


Bitcoin fractal analysis forecasts new all-time highs above $110K by end of week
Key takeaways: Bitcoin onchain and technical data suggest new all-time highs are imminent.Glassnode data shows most Bitcoin wallet cohorts accumulating BTC. A daily timeframe bearish divergence signals fading momentum, raising doubt on BTC’s ability to rally into the $120,000 to $130,000 range.Bitcoin (BTC) price rallied back above $105,000 during the US market trading session, after forming a double bottom pattern in the 1-hour chart. Bitcoin 1-hour chart. Source: Cointelegraph/TradingViewAvailable liquidity around the $102,500 zone was swept, possibly laying the foundation for new Bitcoin price highs this week.Bitcoin fractals hint at new all-time highsBitcoin’s current range between $106,300 and $100,600 represents a similar setup to its previous range between $97,900 and $92,700. The price action pattern can be summarized into three different conditions: Range lows and range highs led to immediate trend reversal. A double bottom occurred after range highs ($97,900 and $107,144) were formed. The double bottom formation occurred above range lows, sweeping internal liquidity levels, but the bottom.Bitcoin price fractal analysis. Source: Cointelegraph/TradingViewBitcoin could consolidate between $103,500 and $105,200 (orange boxes) over the next 24 hours, mirroring its earlier sideways movement between $95,800 and $97,300. If this pattern holds, it could increase the chances of Bitcoin breaking above $107,000, potentially reaching new highs above $110,000 this week.Conversely, a failure to hold $103,500 could lead to a retest of the $102,000 support. This would be treated as an invalidation of the price fractal, which could open the possibility of new lows under $102,000 in the coming days. Related: Bitcoin ignores Moody’s US debt downgrade, rallies back to $105K after profit-taking sell-offWill Bitcoin overcome a daily bearish divergence?Glassnode revealed a significant shift in Bitcoin investor behavior, with the latest Accumulation Trend Score chart showing small holders with less than 1 BTC joining the bullish trend at a score of 0.55. Larger cohorts holding 100–1,000 BTC and 1,000–10,000 BTC exhibited strong accumulation scores of 0.9 and 0.85, respectively. Bitcoin accumulation trend score. Source: GlassnodeOnly the 1–10 BTC cohort remains in distribution. The heatmap, transitioning from blue (distribution) to red (accumulation), suggests growing market confidence. Historically, such trends have preceded BTC price rallies. However, crypto analyst Bluntz noted a bearish divergence on the daily chart, which could dampen BTC’s hopes for a new all-time high this week. A bearish divergence takes place when the price is forming a higher high, but the relative strength index (RSI) indicator is forming a higher low, meaning that buying pressure is beginning to fade as prices soar. Bitcoin bearish divergence by Bluntz Capital. Source: X.comSimilarly, Bitcoin analyst Matthew Hyland pointed out that if the bulls want to remain in control, they need to push prices higher in the coming weeks. Hyland said,“BTC is now on the clock and probably needs to make a move to $120k-$130k in the coming weeks to make a higher high on the RSI and avoid any weekly bearish divergence from being confirmed.”Related: Bitcoin bull market 'almost over?' Traders split over BTC price at $105KThis article does not contain investment advice or recommendations. Every investment and trading move involves risk, and readers should conduct their own research when making a decision.


Key takeaways:
Bitcoin onchain and technical data suggest new all-time highs are imminent.
Glassnode data shows most Bitcoin wallet cohorts accumulating BTC.
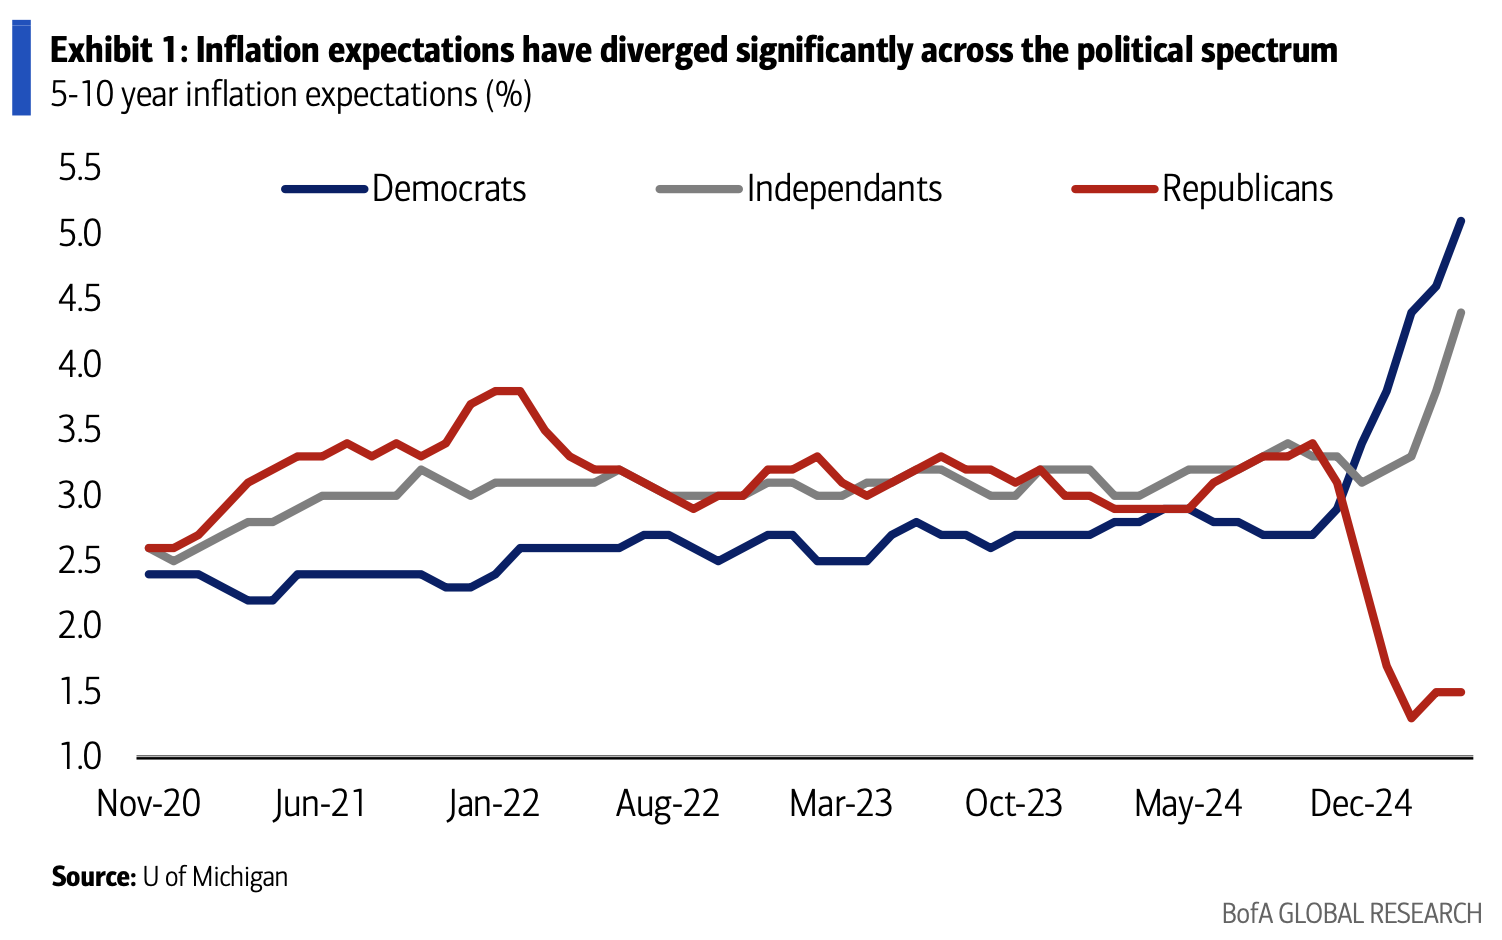
A daily timeframe bearish divergence signals fading momentum, raising doubt on BTC’s ability to rally into the $120,000 to $130,000 range.
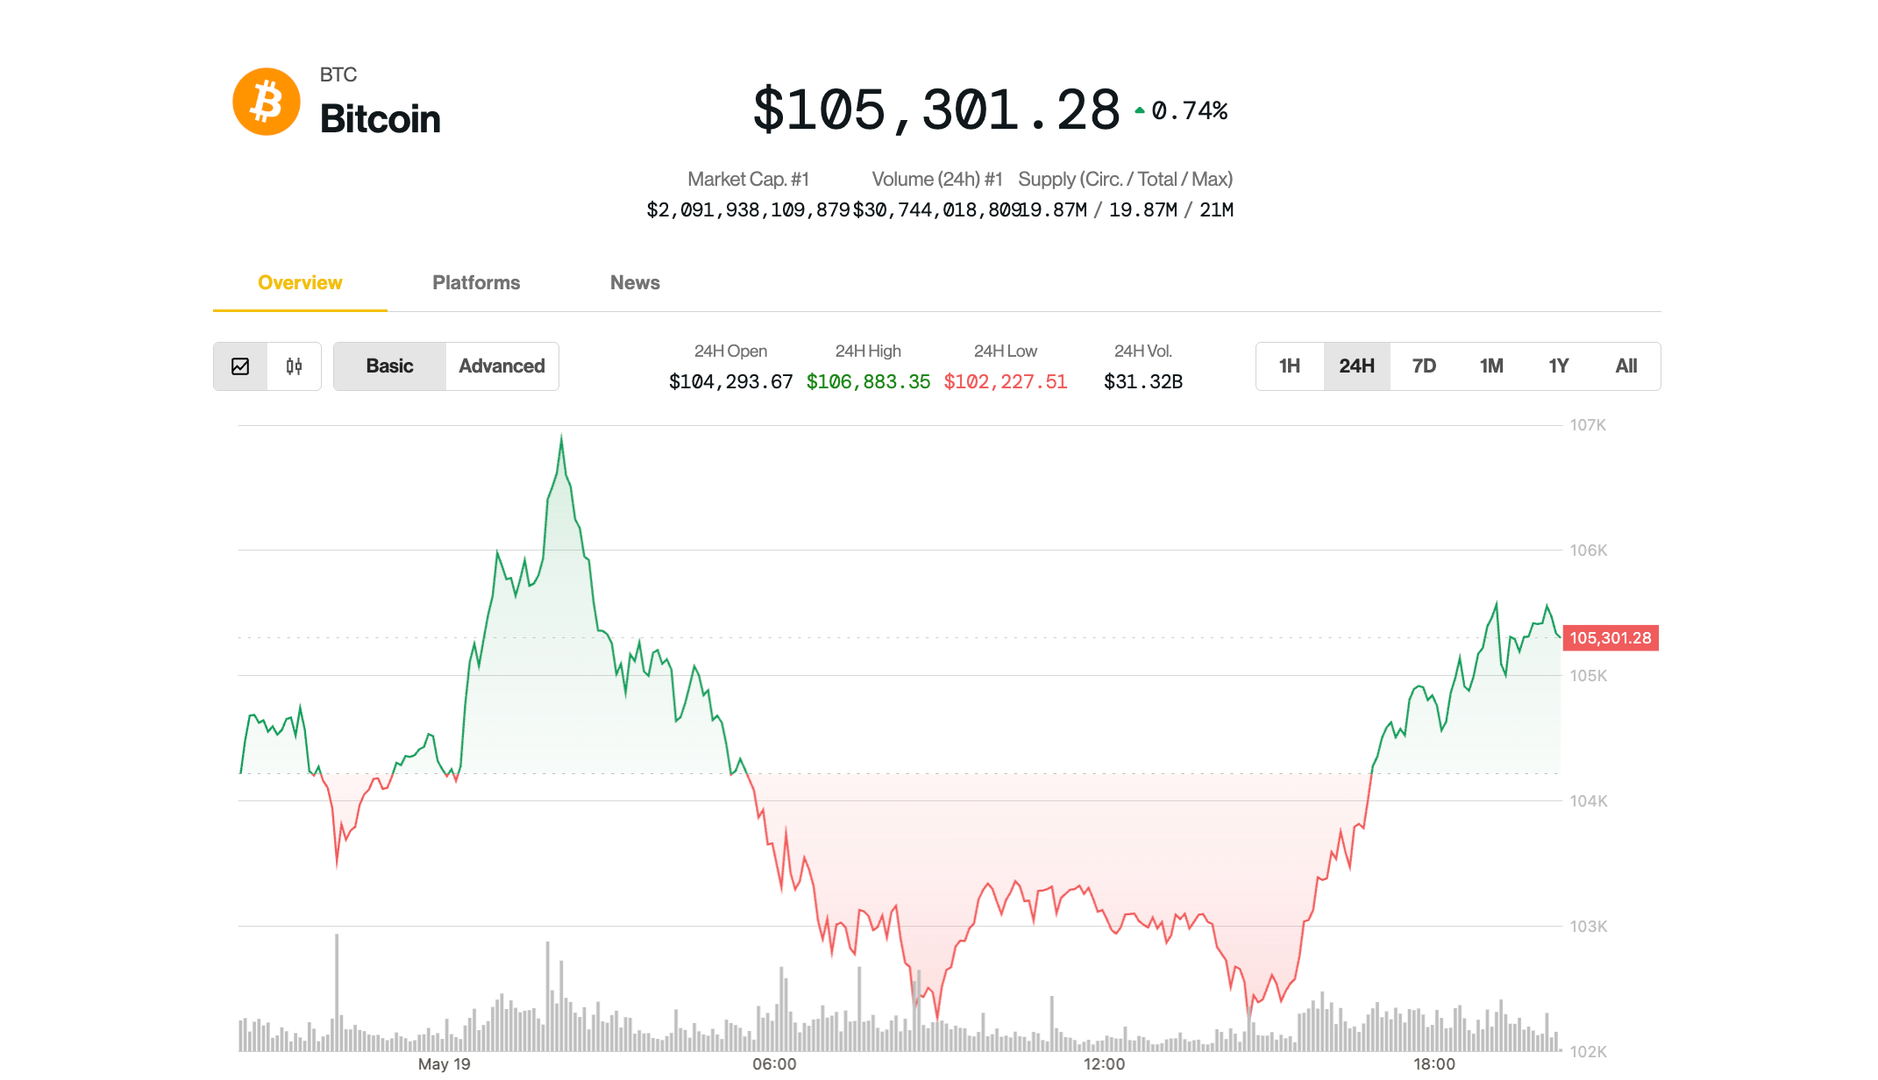
Bitcoin (BTC) price rallied back above $105,000 during the US market trading session, after forming a double bottom pattern in the 1-hour chart.

Available liquidity around the $102,500 zone was swept, possibly laying the foundation for new Bitcoin price highs this week.
Bitcoin fractals hint at new all-time highs
Bitcoin’s current range between $106,300 and $100,600 represents a similar setup to its previous range between $97,900 and $92,700. The price action pattern can be summarized into three different conditions:
Range lows and range highs led to immediate trend reversal.
A double bottom occurred after range highs ($97,900 and $107,144) were formed.
The double bottom formation occurred above range lows, sweeping internal liquidity levels, but the bottom.

Bitcoin could consolidate between $103,500 and $105,200 (orange boxes) over the next 24 hours, mirroring its earlier sideways movement between $95,800 and $97,300. If this pattern holds, it could increase the chances of Bitcoin breaking above $107,000, potentially reaching new highs above $110,000 this week.
Conversely, a failure to hold $103,500 could lead to a retest of the $102,000 support. This would be treated as an invalidation of the price fractal, which could open the possibility of new lows under $102,000 in the coming days.
Will Bitcoin overcome a daily bearish divergence?
Glassnode revealed a significant shift in Bitcoin investor behavior, with the latest Accumulation Trend Score chart showing small holders with less than 1 BTC joining the bullish trend at a score of 0.55. Larger cohorts holding 100–1,000 BTC and 1,000–10,000 BTC exhibited strong accumulation scores of 0.9 and 0.85, respectively.

Only the 1–10 BTC cohort remains in distribution. The heatmap, transitioning from blue (distribution) to red (accumulation), suggests growing market confidence. Historically, such trends have preceded BTC price rallies.
However, crypto analyst Bluntz noted a bearish divergence on the daily chart, which could dampen BTC’s hopes for a new all-time high this week. A bearish divergence takes place when the price is forming a higher high, but the relative strength index (RSI) indicator is forming a higher low, meaning that buying pressure is beginning to fade as prices soar.

Similarly, Bitcoin analyst Matthew Hyland pointed out that if the bulls want to remain in control, they need to push prices higher in the coming weeks. Hyland said,
“BTC is now on the clock and probably needs to make a move to $120k-$130k in the coming weeks to make a higher high on the RSI and avoid any weekly bearish divergence from being confirmed.”
Related: Bitcoin bull market 'almost over?' Traders split over BTC price at $105K
This article does not contain investment advice or recommendations. Every investment and trading move involves risk, and readers should conduct their own research when making a decision.