


August Non-OPEC & World Oil Production Rose
By Ovi The focus of this post is an overview of World oil production along with a more detailed review of the top 11 Non-OPEC oil producing countries. OPEC production is covered in a separate post. Below are a number of Crude plus Condensate (C + C) production charts, usually shortened to “oil”, for oil […]

By Ovi
The focus of this post is an overview of World oil production along with a more detailed review of the top 11 Non-OPEC oil producing countries. OPEC production is covered in a separate post.
Below are a number of Crude plus Condensate (C + C) production charts, usually shortened to “oil”, for oil producing countries. The charts are created from data provided by the EIA’s International Energy Statistics and are updated to July 2024. This is the latest and most detailed/complete World oil production information available. Information from other sources such as OPEC, the STEO and country specific sites such as Brazil, Norway, Mexico and China is used to provide a short term outlook.
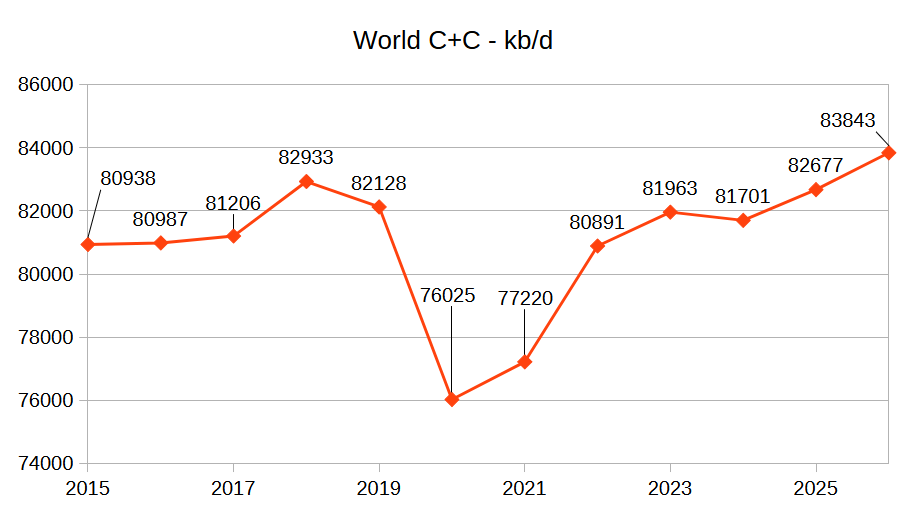
World oil production increased by 126 kb/d in August to 81,724 kb/d, green graph. The largest increase came from the U.S., 195 kb/d. September’s World oil production is projected to decrease by 880 kb/d to 81,844 kb/d. The countries contributing to the large September decrease are Norway and Libya, 180 kb/d and 400+ kb/d respectively.
This chart also projects World C + C production out to December 2025. It uses the December 2024 STEO report along with the International Energy Statistics to make the projection. The red graph forecasts World oil (C + C) production out to December 2025 using the STEO’s December crude oil report.
For December 2025, production is projected to be 84,468 kb/d. The December 2025 oil production projection is 345 kb/d lower than estimated in the previous post and note that it is also lower than the November 2018 peak.
From August 2024 to December 2025, World oil production is estimated to increase by 2,744 kb/d.
A note of caution. The December STEO is now reporting/forecasting only Crude oil production which is also shown in the chart. As a result the red C+C graph is a projection based on the crude production graph.
Over the past 10 months, it has been noted that the ratio (C + C)/C was changing MoM, possibly due to the EIA’s new crude reporting format. As a result the six month average ratio of (C + C)/C was used to make the December 2025 projection. Over the last 10 months that ratio has now settled down to a narrow range with only a small variation. As such going forward the six month ratio will continue to be used to project future production. Based on the current data it appears there is a seasonal variation in the ratio (C + C)/C.

World August oil output without US decreased by 83 kb/d to 68,323 kb/d. September production is expected to drop by 683 kb/d to 67,480 kb/d.
The projection is forecasting that December 2025 crude output will be 70,837 kb/d. This forecast has been revised down by 174 kb/d from the last post. Note that the December 2025 output is lower than the November 2018 peak of 72,685 kb/d.
World oil production W/O the U.S. from August 2024 to December 2025 is forecast to increase by a total of 2,514 kb/d.
A Different Perspective on World Oil Production

Peak production in the Big 3 occurred in April 2020 at a rate of 34,739 kb/d. The peak was associated with a large production increase from Saudi Arabia. Post covid, production peaked at 34,010 kb/d in September 2022. The production drop since then is primarily due to cutbacks by Saudi Arabia and Russia.
August’s Big 3 oil production increased by 234 kb/d to 32,400 kb/d. Production in August was 1,610 kb/d lower than September 2022 post pandemic high of 34,010 kb/d. Of the Big 3, the country with the largest increase was the US with a rise of 195 kb/d, see Table below.
Adding the current Saudi Arabia 1,000 kb/d cut to August’s output would raise production to 33,400 kb/d, just 610 kb/d lower than September 2022 production. Saudi Arabia along with other countries which were scheduled to reverse their cuts in October 2024 have now delayed them to April 2025 because of lower than expected China/World oil demand.

Production in the Remaining Countries had been slowly increasing since the September 2020 low of 42,930 kb/d. Output in December 2023 reached 50,552 kb/d, a new post covid high. However production began to fall in January 2024 but has since reversed direction a few times. August’s production decreased by 109 kb/d to 49,323 kb/d.

This chart shows the combined oil production from five Non-OPEC countries, Brazil, Canada, Guyana and the U.S and whose oil production is expected to grow. These five countries are often cited by OPEC and the IEA for being capable of meeting the increasing World oil demand for next year while OPEC withholds its oil. For these five countries, production from April 2020 to August 2024 rose at an average rate of 1,199 kb/d/year as shown by the OLS orange line.
A quote from the December 2024 IEA report, “Total oil supply is on track to increase by 630 kb/d this year and 1.9 mb/d in 2025, to 104.8 mb/d, even in the absence of unwinding of OPEC+ cuts. Non-OPEC+ supply rises by about 1.5 mb/d in both years, led by the United States, Brazil, Guyana, Canada and Argentina.”
Since the U.S. was a major contributor to that increase, a second graph, red, was added to determine the contribution of the other four countries. As shown by the blue OLS line, oil production in those countries rose at an average rate of 512 kb/d/yr after April 2020.
While both production rates are impressive, this is a case where it may be more important to focus on what has happened to production since December 2023. In both cases production has fallen. While production from these five countries can be expected to grow, it will not be at rate shown from 2020 to September 2024. A reduced rate is more than likely.
Looking at the five countries, the ones with the best chance of increasing production over the next few years are Guyana and Argentina. According to this Article, “The Guyana-Suriname basin is projected to contribute an additional 950,000 b/d to global supply between 2025 and 2028, with four projects set to commence operations during this period.”
Brazil has added close to 700 kb/d of oil production from the pre-salt basin since early 2022. Production since the peak in November 2023 has been erratic due to operational issues such as maintenance. Also OPEC notes that “growing offshore development costs and inflationary pressure may continue to delay projects and moderate short-term growth.” It is not clear at what rate Brazil’s production could increase once it exceeds the November 2023 level.

Argentina increased production by 263 kb/d to 711 kb/d since May 2020. The new oil is coming from the giant Vaca Muerta shale formation.
Countries Ranked by Oil Production

Above are listed the World’s 13th largest oil producing countries. In August 2024, these 13 countries produced 79.2% of the World’s oil. On a MoM basis, production increased by 197 kb/d in these 13 countries while on a YOY basis, production rose by 853 kb/d. Note the large YoY production increase in Iran and Saudi Arabia. Will the upcoming more strict U.S. sanctions on Iran curb that increasing trend?
August Non-OPEC Country Oil Production Charts

August Non-OPEC oil production increased by 216 kb/d to 52,736 kb/d. The largest increases came from the U.S. and Guyana. Note that Non-OPEC production now includes Angola.
Using data from the December 2024 STEO, a projection for Non-OPEC oil output was made for the period September 2024 to December 2025. (Red graph). Output is expected to reach 55,082 kb/d in December 2025, which is 1,110 kb/d higher than the December 2019 peak of 53,972 kb/d. The December 2025 forecast has been revised down by 210 kb/d to 55,082 kb/d from 55,292 kb/d posted in the last update.
From December 2023 to December 2025, oil production in Non-OPEC countries is expected to increase by 777 kb/d.

August’s Non-OPEC W/O US oil production rose by 46 kb/d to 39,335 kb/d. September’s production is projected to rise by 80 kb/d to 39,415 kb/d.
From August 2024 to December 2025, production in Non-OPEC countries W/O the US is expected to increase by 2,117 kb/d. December 2025 production is projected to be 218 kb/d higher than December 2019.
Non-OPEC Oil Countries Ranked by Production

Listed above are the World’s 11 largest Non-OPEC producers. The original criteria for inclusion in the table was that all of the countries produced more than 1,000 kb/d. Note that Angola has been added to this table and that Oman has recently fallen below 1,000 kb/d.
August’s production increased by 187 kb/d to 44,355 kb/d for these eleven Non-OPEC countries while as a whole the Non-OPEC countries saw a monthly production rise of 216 kb/d to 52,736 kb/d.
In August 2024, these 11 countries produced 84.1% of all Non-OPEC oil production.

Angola has been added to the Non-OPEC producing countries since they withdrew from OPEC.
Angola’s August production increased by 60 kb/d to 1,185 kb/d. Since early 2022 Angola’s production appears to have settled into a plateau phase between 1,100 kb/d and 1,200 kb/d.
Angola’s declining production appears to have stopped in 2021. According to this Article, Angola is looking to increase its production and attract more investments. The African oil producer plans to launch additional multi-year oil and gas licensing rounds from 2026.

The EIA reported that Brazil’s August production rose by 111 kb/d to 3,340 kb/d.
Brazil’s National Petroleum Association (BNPA) reported that production increased in September to 3,470 kb/d and then dropped by 201 kb/d in October to 3,269 kb/d. The October pre-salt graph tracks the crude oil graph. For October, pre-salt production decreased by 265 kb/d to 2,599 kb/d.
Overall Brazilian production after September has to increase by 409 kb/d to exceed the November 2023 high. Production has been very erratic since the November 2023 high.

Canada’s production increased by 59 kb/d in August to 4,851 kb/d. The increase is primarily due to the return to operations of facilities shut down for maintenance.

The EIA reported China’s August oil output decreased by 16 kb/d to 4,199 kb/d.
The China National Bureau of Statistics reported production for September and October. September production dropped to 4,154 kb/d and October added 30 kb/d to 4,184 kb/d.

According to the EIA, Kazakhstan’s oil output decreased by 115 kb/d in August to 1,719 kb/d.
Kazakhstan’s recent pre-salt crude oil production, as reported by Argus, has been added to the chart. In October pre-salt crude production dropped by 120 kb/d to 1,340 kb/d and rebounded by 220 kb/d in November to 1,560 kb/d.
Kazakhstan’s OPEC production target is 1,470 kb/d. At 1,560 kb/d, Kazakhstan is 90 kb/d over their target. According to this Article it is not clear how Kazakhstan will get back to its target when Chevron starts increasing production at its Tengiz field.
“While that means Kazakhstan will be able to achieve its October quota, the sources said, complying with OPEC+ quotas might become problematic again when the field returns from maintenance in November.
“Taking into account the expansion of Tengiz, compliance with the quota could become impossible,” one of the sources said.
Chevron and its partners plan to expand output at the Tengiz project to 850,000 bpd in the first half of 2025. Expansion costs at the project stand at around $49 billion.”

According to the EIA, Mexico’s August output was unchanged at 1,862 kb/d.
In June 2024, Pemex issued a new and modified oil production report for Heavy, Light and Extra Light oil. It is shown in blue in the chart and it appears that Mexico is not reporting condensate production when compared to the EIA report.
In earlier reports, the EIA would add close to 55 kb/d of condensate to the Pemex report. The gap between the EIA report and Pemex on average has been close to 55 kb/d over the last 6 months. However for July and August, the condensate contribution increased to 90 kb/d.
For September and October, 90 kb/d has been added to the Pemex report to estimate Mexico’s September and October C + C production, red markers. Note that Mexico’s production has continued to fall every month. Since May 2023, Mexico’s total liquids production has been falling at an average rate of close 10 kb/d/mth or 120 kb/d/yr.

The EIA reported Norway’s August production decreased by 47 kb/d to 1,803 kb/d.
Separately, the Norway Petroleum Directorate (NPD) reported that September dropped by 181 kb/d to 1,622 kb/d and October rebounded to 1,792 kb/d, red markers.
The Norway Petroleum Directorship stated that October’s oil production was 8.2% more than forecast. The Directorate reported that the large September drop was due to a major power outage.

Oman’s production had risen very consistently since the low of May 2020. However production began to drop in November 2022. According to the EIA, August’s output rose by 1 kb/d to 993 kb/d.
Oman produces a lot of condensate. The OPEC MOMR reports that crude production in August was 766 kb/d, 227 kb/d lower than the EIA’s C + C.

The EIA has been reporting flat output of 1,322 kb/d for Qatar since early 2022. However the current August update has revised down all of the previous production data. Qatar’s August output was reported again to be 1,322 kb/d.

The EIA reported Russia’s August C + C production dropped by 60 kb/d to 9,679 kb/d.
Using data from Argus Media reports, Russian crude production is shown from May 2023 to November 2024. For November 2024, Argus reported Russian crude production was 8,970 kb/d, unchanged from October, blue markers. Adding 8% to Argus’ November crude production provides a C + C production estimate of 9,688 kb/d for Russia, which is a proxy for the Pre-War Russian Ministry estimate, red markers.
According to Argus, Russian crude production of 8,970 kb/d is in compliance with their OPEC target of 8,980 kb/d. However the IEA is reporting Russian production of 9,250 kb/d which is 272 kb/d higher than the quota of 8,978 kb/d.
In pre-war times, the Russia Energy Ministry production estimate used to be 400 kb/d higher than the EIA estimate. For August, the Argus proxy estimate is essentially the same as the EIA’s estimate.
Can we believe the Russian production numbers? What are their sources of information?
According to this Article Russian September production was “8.97 million barrels a day last month, (Same as Argus) the people said on condition of anonymity because the figures aren’t public. That’s down about 13,000 barrels a day down from the August level.”

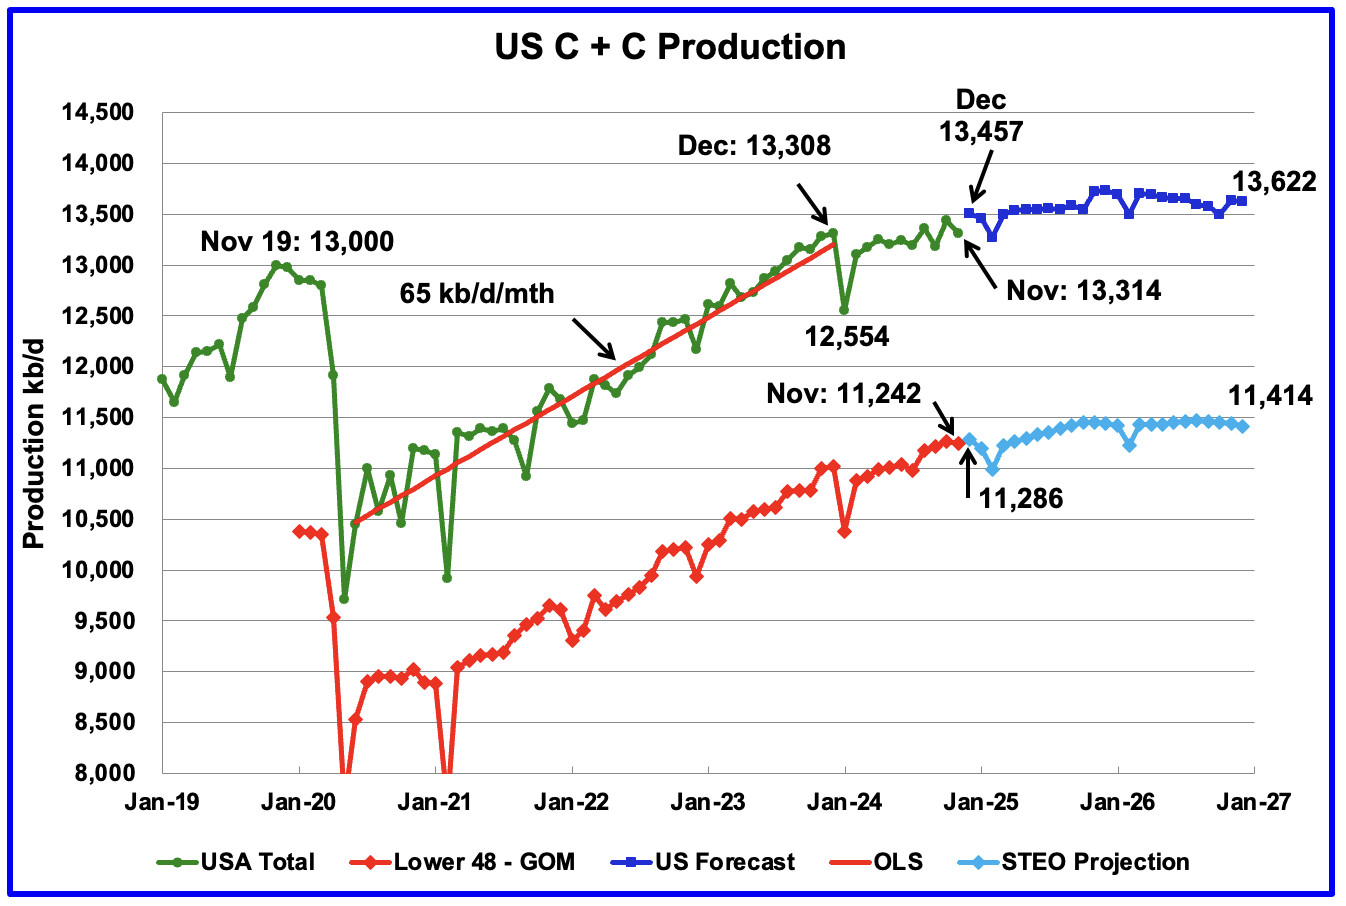
The December EIA/STEO has made a small change to U.S. oil production forecast from the previous one posted a week ago. It is now showing December production rising to 13,624 kb/d, a potential new peak. Interestingly, the weekly data for early December is also showing production of 13,631 kb/d. That is 400 kb/d more than September. Of that 400 kb/d, 200 kb/d will be recovered production from the GOM platform closings associated with Hurricane Helene.
The EIA continues to forecast flat US oil production from March 2025 to October 2025 but has lowered December 2025 production by 30 kb/d to 13,631 kb/d.
From October 2024 to December 2025 oil production is estimated to increase by 178 kb/d.