


Where Will the Dow, S&P 500, and Nasdaq Composite Bottom? A Historically Flawless Valuation Indicator Offers a Very Big Clue.
More than 150 years of historical valuation data provides a logical estimate of where Wall Street's major indexes will trough.

Over the last seven weeks, Wall Street has served up a dose of reality and reminded investors that getting from Point A to B is rarely achieved by moving in a straight line.
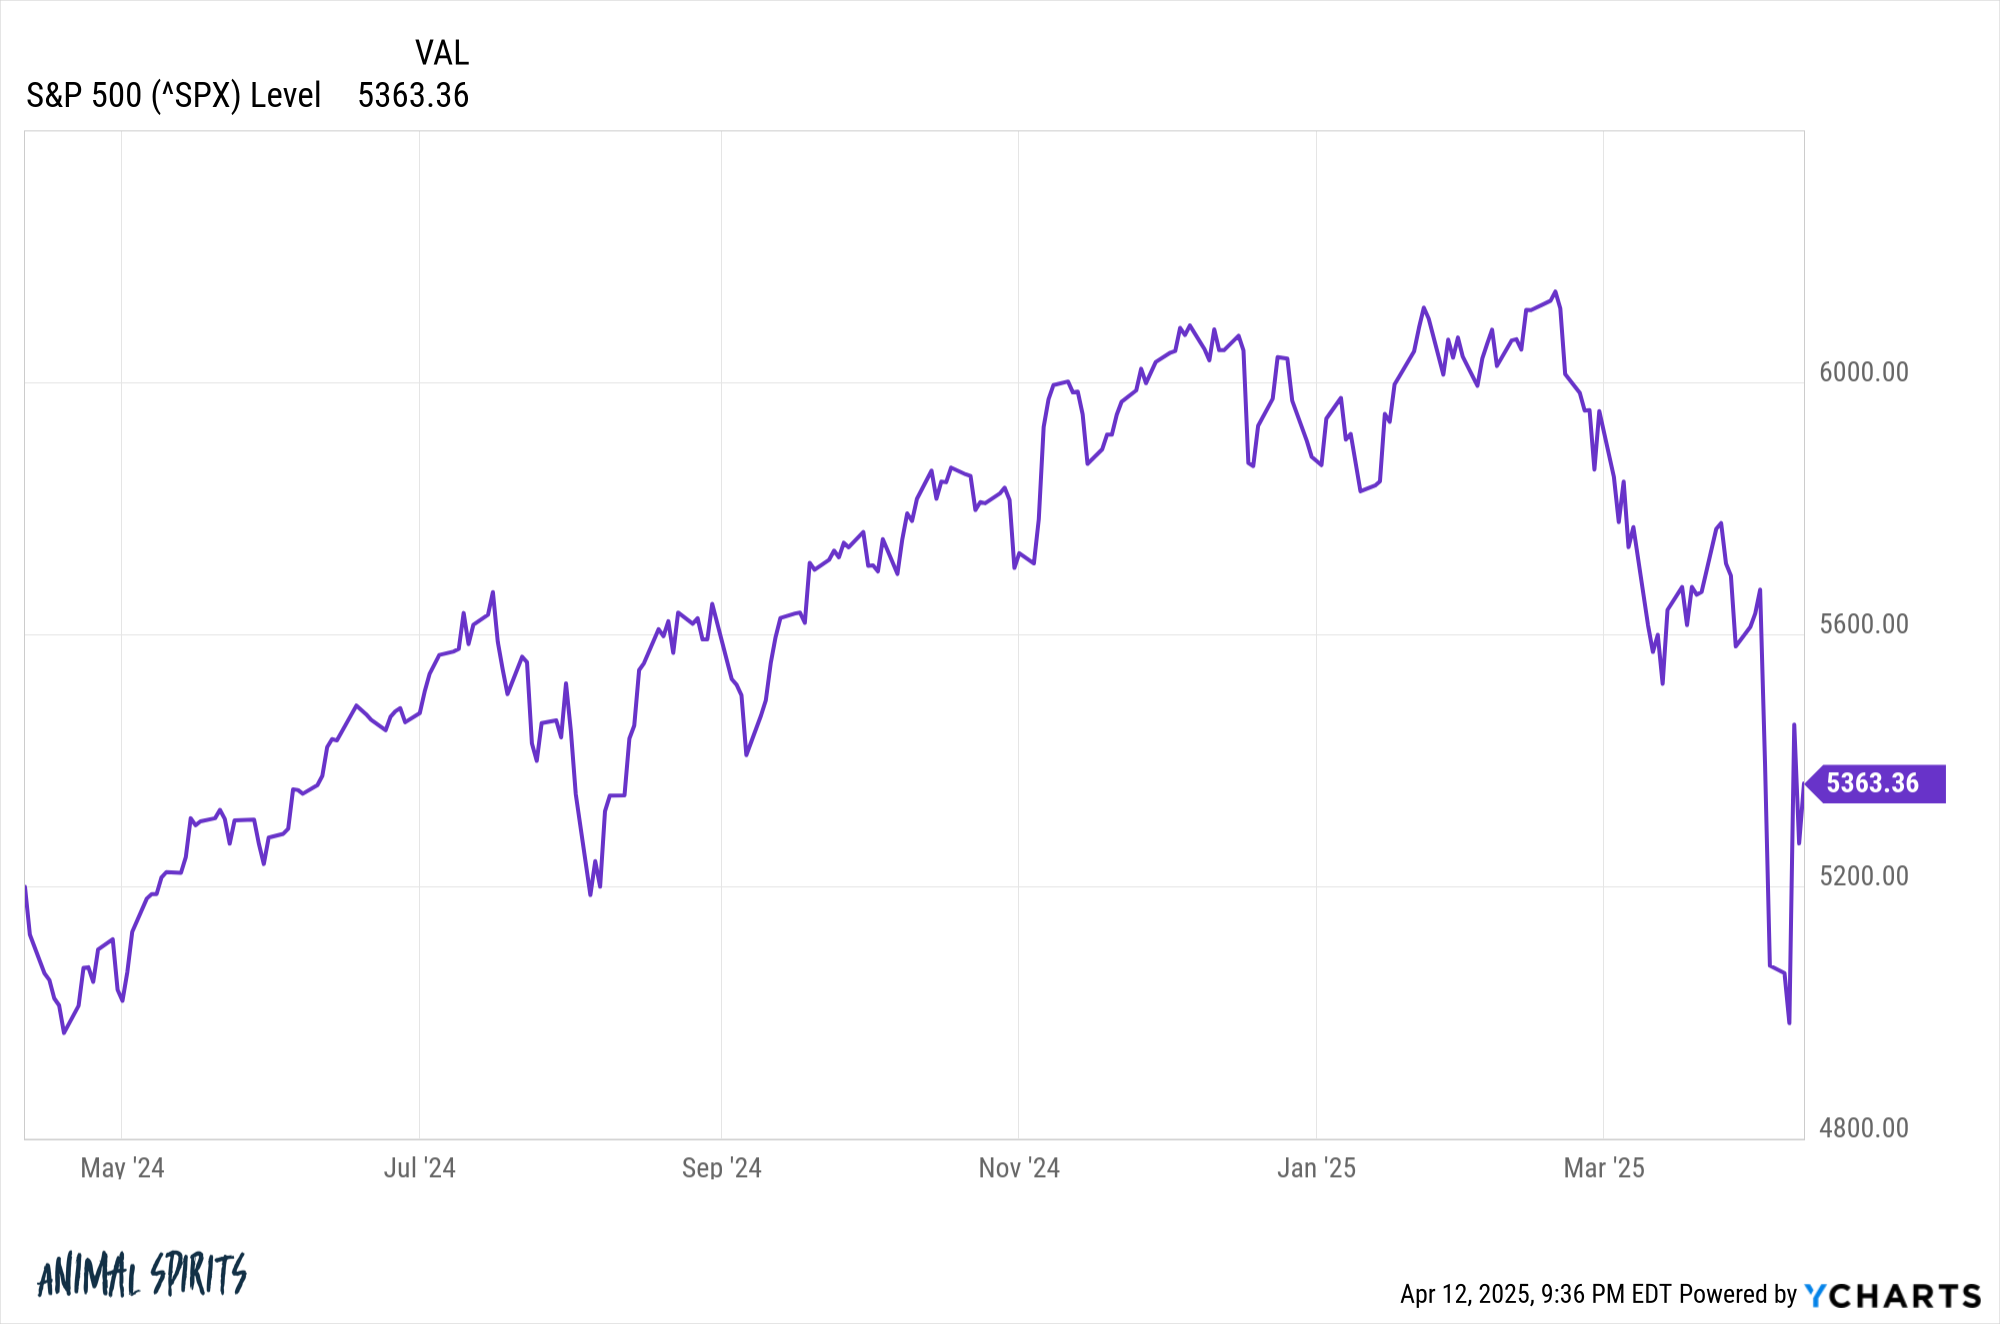
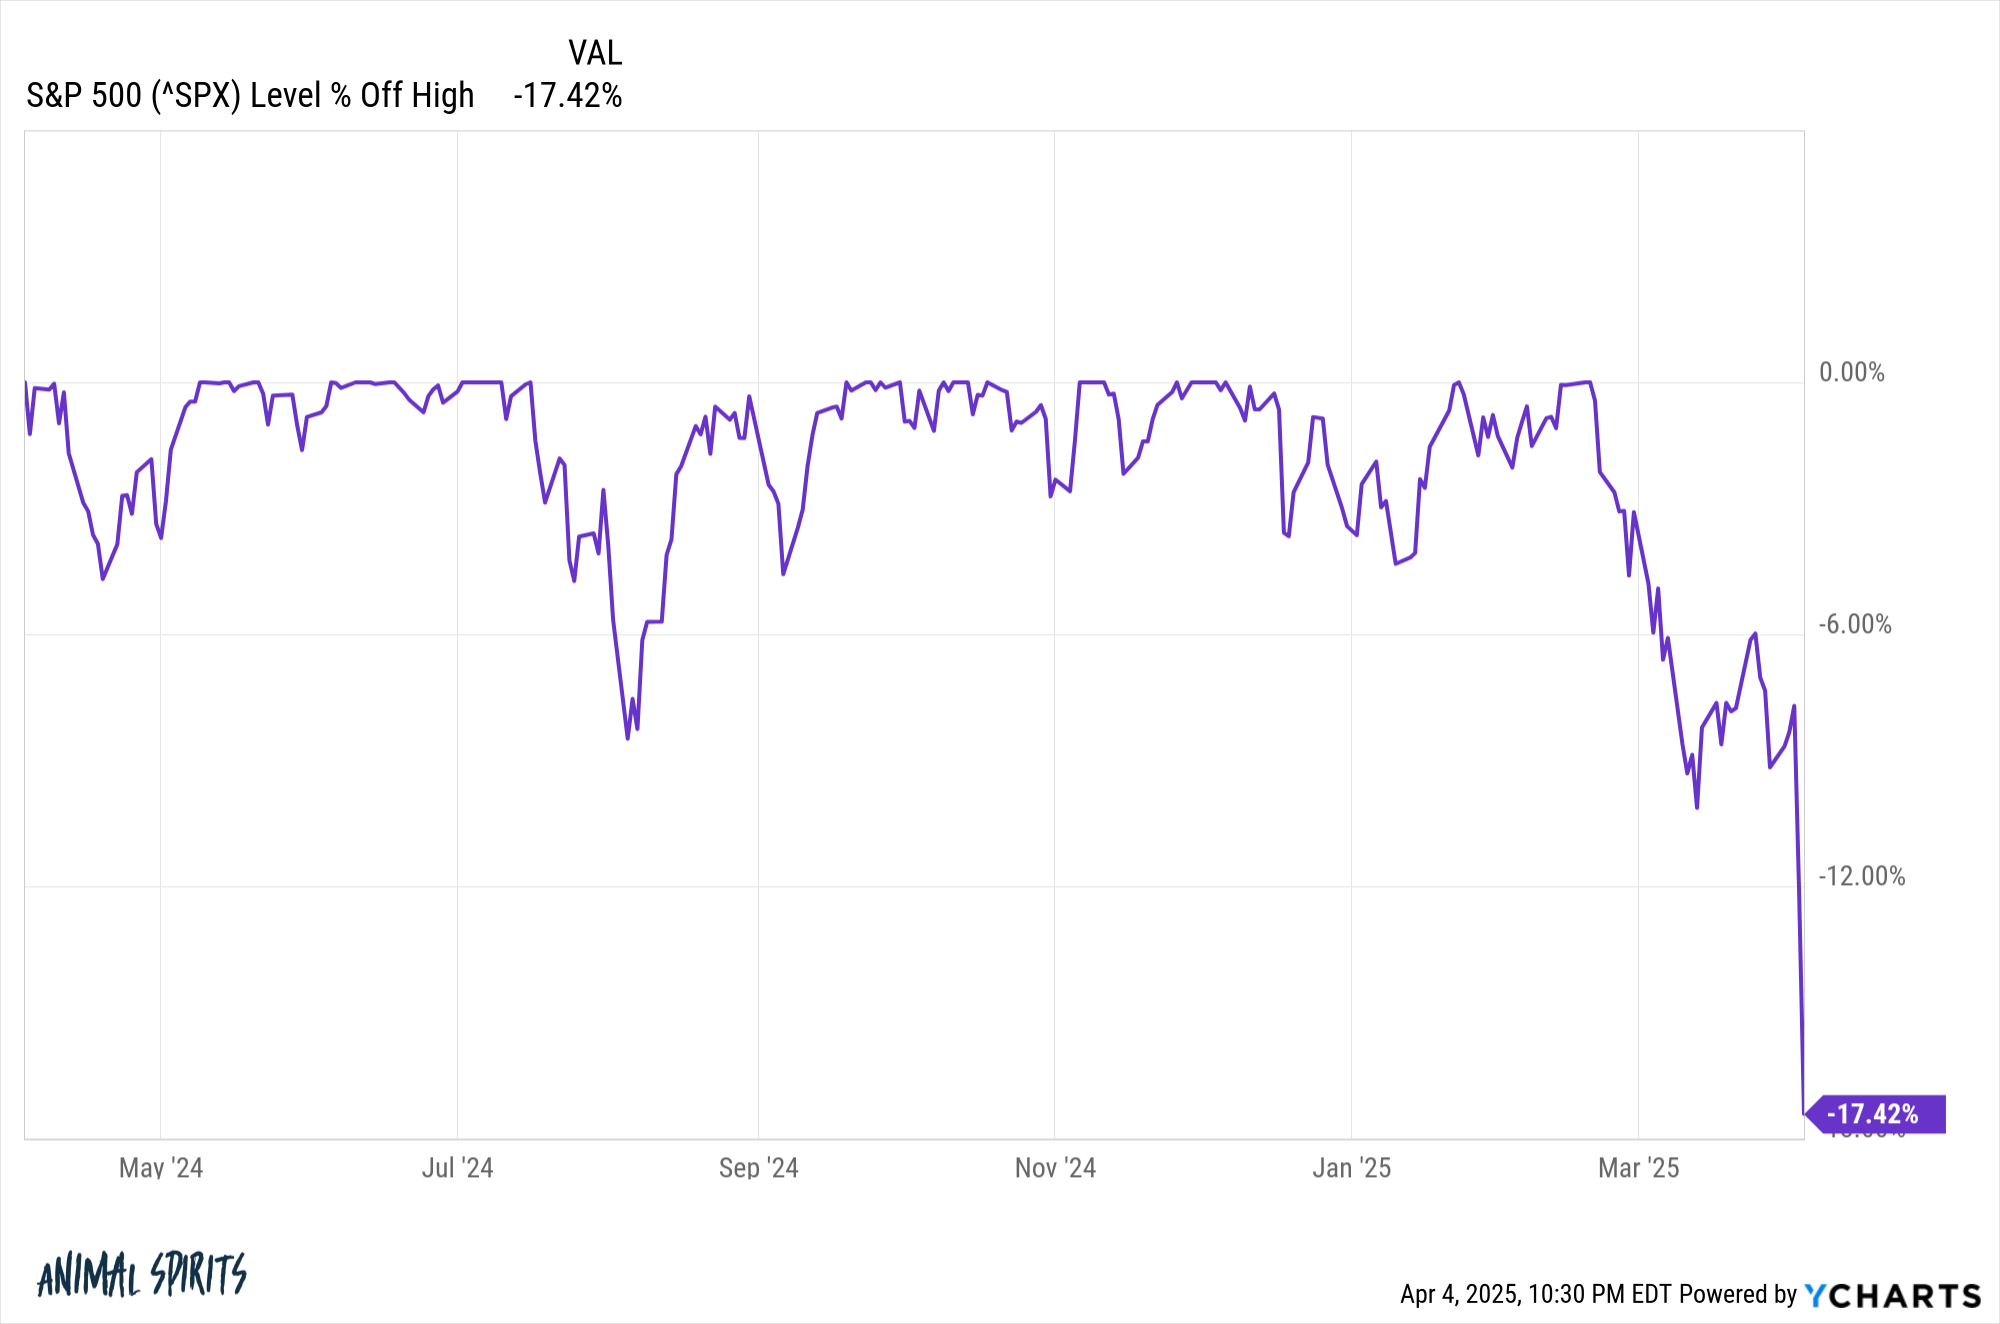
From Feb. 19, which is the date the benchmark S&P 500 (SNPINDEX: ^GSPC) hit its all-time closing high, through April 4, the Dow Jones Industrial Average (DJINDICES: ^DJI), S&P 500, and Nasdaq Composite (NASDAQINDEX: ^IXIC) respectively tumbled by 14.2%, 17.4%, and 22.3%. This places the Dow and S&P 500 comfortably in correction territory, with the Nasdaq Composite officially falling into a bear market.
It's no secret that emotions tend to rule the roost when equity valuations move decisively lower. The all-important question is: How far could the Dow Jones, S&P 500, and Nasdaq Composite tumble before finding their respective bottoms?