


Where $50,000 Goes Furthest: America’s 50 Least Expensive Counties to Live In
Inflation in the United States has exceeded the Federal Reserve’s target 2% rate for over four years. Rapidly rising consumer prices have driven up household expenses considerably. Before the current inflationary period began, American households spent an average of $62,188 per year, according to the Bureau of Labor Statistics. Now, the latest BLS data indicate […] The post Where $50,000 Goes Furthest: America’s 50 Least Expensive Counties to Live In appeared first on 24/7 Wall St..
Inflation in the United States has exceeded the Federal Reserve’s target 2% rate for over four years. Rapidly rising consumer prices have driven up household expenses considerably. Before the current inflationary period began, American households spent an average of $62,188 per year, according to the Bureau of Labor Statistics. Now, the latest BLS data indicate that average household expenditures top $75,000.
Key Points
-
Historic inflation in the COVID-19 era has driven the cost of living in the United States up by well over 20% in the last half decade.
-
While rising prices have a direct impact on every American, consumer prices can also vary considerably at the local level — and across the country, there are counties where consumers are paying far less than a typical American for the same goods and services.
-
Consulting a professional advisor can help you achieve financial security and independence. Click here to get started now.
The rising cost of goods and services in recent years is partly attributable to fundamental market forces. During the pandemic, supply chain constraints reduced access to certain products, while demand for many of the same goods surged — resulting in higher prices. This dynamic is particularly evident in the housing market, as the median list price among homes on the market is now about $440,000, over $140,000 more than it was at the beginning of 2020, according to data from Realtor.com.
While every American has been financially impacted by rising prices, the same supply and demand dynamics that drove inflation have also created considerable variation in the overall cost of living in different communities across the country. And some parts of the country are far more affordable for a wider range of budgets than others.
Using data from the U.S. Department of Commerce, 24/7 Wall St. identified the least expensive U.S. counties to live in. The counties on this list were selected using the latest available data on regional price parity, or RPP, a cost of living index. Supplemental data on median household income, median home value, and unemployment are five-year estimates from the U.S. Census Bureau’s 2023 American Community Survey.
Among the 50 counties on this list, goods and services are anywhere from 18.8% to 25.2% lower than they are nationwide, on average. These counties are largely concentrated in the South. Mississippi alone is home to 18 counties on this list, and another 10 are located in Alabama. (Here is a look at the most expensive states to live in.)
Lower costs in these places are often due to several closely related economic factors. Only a handful of these counties are part of a larger metropolitan area, and most are largely rural areas home to fewer than 30,000 people. With small populations, the demand for goods and services tends to be lower, which ultimately pushes down consumer prices. This interplay is reflected in local housing markets. According to the U.S. Census Bureau, median home values in these counties are anywhere from about 16% to 80% lower than the comparable national median. (Here is a look at the states where home prices are still going up.)
Most counties on this list are also home to relatively low-income populations. Nationwide, the typical American household earns $77,719 per year, while in all but a few of the least expensive counties, a typical household earns less than $55,000 annually. Generally, in high-income areas where residents have more disposable income, greater consumer spending drives up competition for goods and services, which in turn pushes prices higher. Conversely, in lower-income areas, reduced consumer spending can help keep the overall cost of living relatively low.
These are the least expensive U.S. counties to live in.
Why It Matters
For years, rapidly rising prices have strained household budgets for millions of Americans. But while no corner of the country was spared from the effects of inflation, there are specific places where the cost of living is markedly lower than in much of the rest of the country. In dozens of counties across the United States, the cost of living is at least 18% lower than it is nationwide, on average.
50. Pickens County, Alabama

- Estimated cost of living in county: 18.8% lower than national average
- Median household income in county: $47,014 (39.5% lower than national median)
- Median home value in county: $123,300 (63.8% lower than national median)
- 5-year average unemployment rate in county: 6.5% (1.3 ppt. higher than national average)
- County population: 18,843
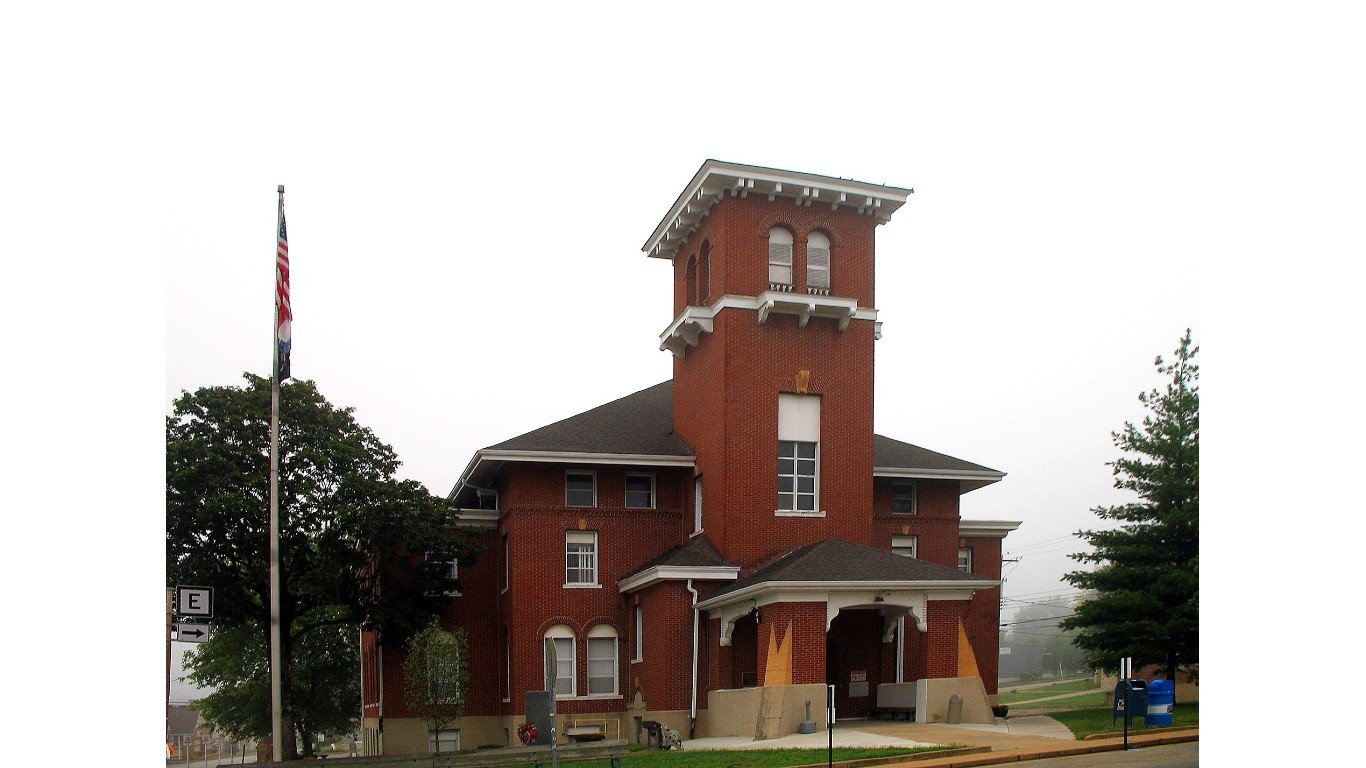
49. Wayne County, Missouri
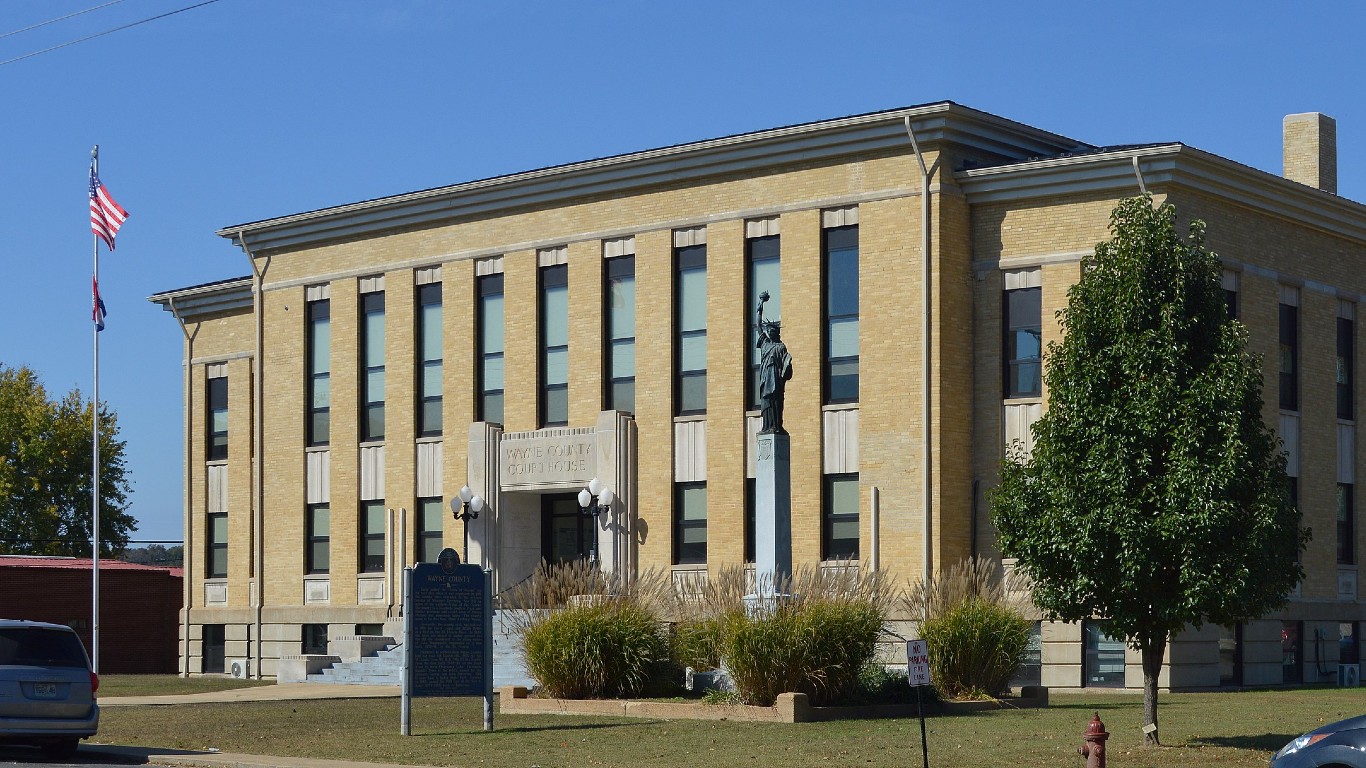
- Estimated cost of living in county: 18.9% lower than national average
- Median household income in county: $43,393 (44.2% lower than national median)
- Median home value in county: $113,100 (66.8% lower than national median)
- 5-year average unemployment rate in county: 7.7% (2.5 ppt. higher than national average)
- County population: 10,942
48. La Paz County, Arizona

- Estimated cost of living in county: 18.9% lower than national average
- Median household income in county: $49,506 (36.3% lower than national median)
- Median home value in county: $117,600 (65.4% lower than national median)
- 5-year average unemployment rate in county: 10.8% (5.6 ppt. higher than national average)
- County population: 16,605
47. Graham County, Arizona

- Estimated cost of living in county: 19.0% lower than national average
- Median household income in county: $67,326 (13.4% lower than national median)
- Median home value in county: $202,700 (40.4% lower than national median)
- 5-year average unemployment rate in county: 6.3% (1.1 ppt. higher than national average)
- County population: 38,860
46. DeKalb County, Alabama

- Estimated cost of living in county: 19.0% lower than national average
- Median household income in county: $51,149 (34.2% lower than national median)
- Median home value in county: $135,500 (60.2% lower than national median)
- 5-year average unemployment rate in county: 4.2% (1.0 ppt. lower than national average)
- County population: 71,946
45. Smith County, Mississippi
- Estimated cost of living in county: 19.0% lower than national average
- Median household income in county: $51,396 (33.9% lower than national median)
- Median home value in county: $114,000 (66.5% lower than national median)
- 5-year average unemployment rate in county: 4.4% (0.8 ppt. lower than national average)
- County population: 14,193
44. Butler County, Kentucky

- Estimated cost of living in county: 19.0% lower than national average
- Median household income in county: $52,003 (33.1% lower than national median)
- Median home value in county: $105,500 (69.0% lower than national median)
- 5-year average unemployment rate in county: 4.2% (1.0 ppt. lower than national average)
- County population: 12,373
43. George County, Mississippi

- Estimated cost of living in county: 19.0% lower than national average
- Median household income in county: $54,822 (29.5% lower than national median)
- Median home value in county: $168,100 (50.6% lower than national median)
- 5-year average unemployment rate in county: 8.5% (3.3 ppt. higher than national average)
- County population: 24,870
42. Greene County, Mississippi

- Estimated cost of living in county: 19.0% lower than national average
- Median household income in county: $55,838 (28.2% lower than national median)
- Median home value in county: $94,200 (72.3% lower than national median)
- 5-year average unemployment rate in county: 10.6% (5.4 ppt. higher than national average)
- County population: 13,595
41. Pemiscot County, Missouri

- Estimated cost of living in county: 19.1% lower than national average
- Median household income in county: $40,748 (47.6% lower than national median)
- Median home value in county: $95,900 (71.8% lower than national median)
- 5-year average unemployment rate in county: 9.7% (4.5 ppt. higher than national average)
- County population: 15,232
40. Asotin County, Washington
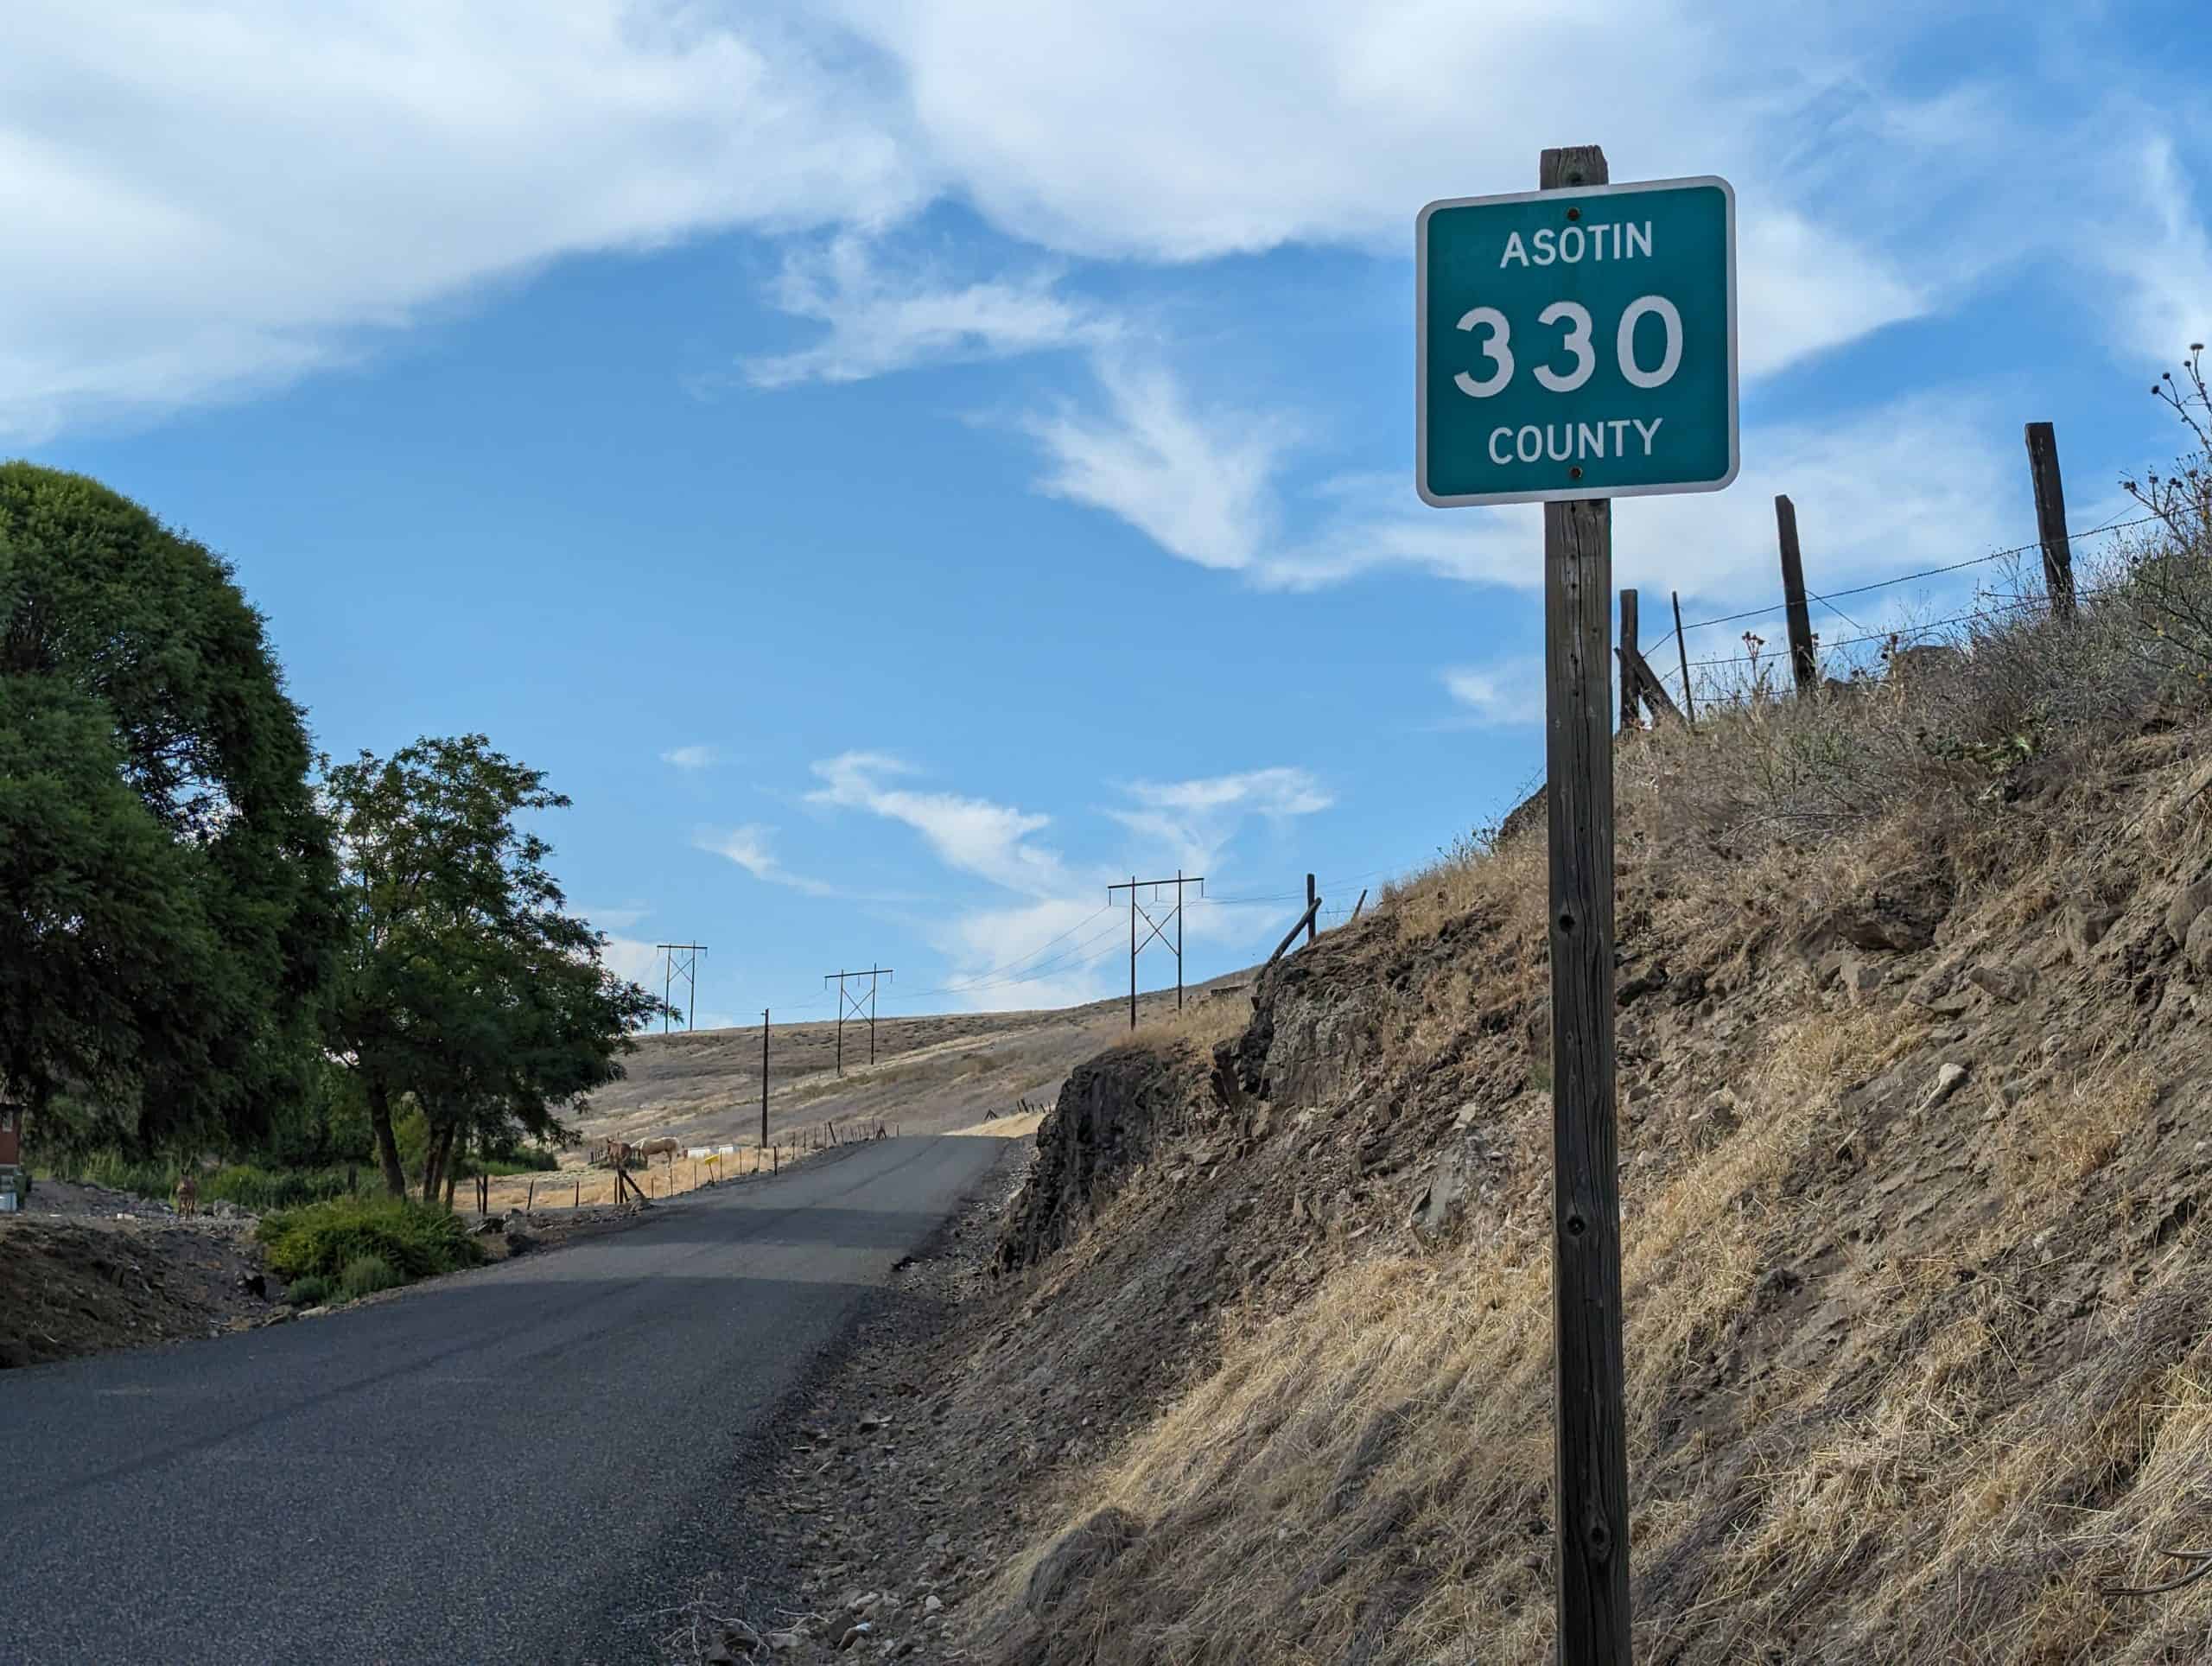
- Estimated cost of living in county: 19.1% lower than national average
- Median household income in county: $69,107 (11.1% lower than national median)
- Median home value in county: $286,200 (15.9% lower than national median)
- 5-year average unemployment rate in county: 5.8% (0.6 ppt. higher than national average)
- County population: 22,424
39. Monroe County, Mississippi

- Estimated cost of living in county: 19.1% lower than national average
- Median household income in county: $51,231 (34.1% lower than national median)
- Median home value in county: $115,200 (66.1% lower than national median)
- 5-year average unemployment rate in county: 5.8% (0.6 ppt. higher than national average)
- County population: 33,928
38. Calhoun County, Mississippi

- Estimated cost of living in county: 19.2% lower than national average
- Median household income in county: $43,942 (43.5% lower than national median)
- Median home value in county: $82,900 (75.6% lower than national median)
- 5-year average unemployment rate in county: 3.7% (1.5 ppt. lower than national average)
- County population: 13,029
37. Jackson County, Alabama
- Estimated cost of living in county: 19.2% lower than national average
- Median household income in county: $49,454 (36.4% lower than national median)
- Median home value in county: $145,800 (57.1% lower than national median)
- 5-year average unemployment rate in county: 5.4% (0.2 ppt. higher than national average)
- County population: 52,839
36. Washington County, Missouri
- Estimated cost of living in county: 19.2% lower than national average
- Median household income in county: $51,886 (33.2% lower than national median)
- Median home value in county: $118,400 (65.2% lower than national median)
- 5-year average unemployment rate in county: 3.8% (1.4 ppt. lower than national average)
- County population: 23,483
35. Navajo County, Arizona

- Estimated cost of living in county: 19.3% lower than national average
- Median household income in county: $52,752 (32.1% lower than national median)
- Median home value in county: $186,100 (45.3% lower than national median)
- 5-year average unemployment rate in county: 8.8% (3.6 ppt. higher than national average)
- County population: 107,744
34. Guadalupe County, New Mexico
- Estimated cost of living in county: 19.3% lower than national average
- Median household income in county: $40,149 (48.3% lower than national median)
- Median home value in county: $107,200 (68.5% lower than national median)
- 5-year average unemployment rate in county: 4.7% (0.5 ppt. lower than national average)
- County population: 4,379
33. Luna County, New Mexico

- Estimated cost of living in county: 19.3% lower than national average
- Median household income in county: $37,917 (51.2% lower than national median)
- Median home value in county: $112,500 (66.9% lower than national median)
- 5-year average unemployment rate in county: 5.5% (0.3 ppt. higher than national average)
- County population: 25,420
32. Dunklin County, Missouri
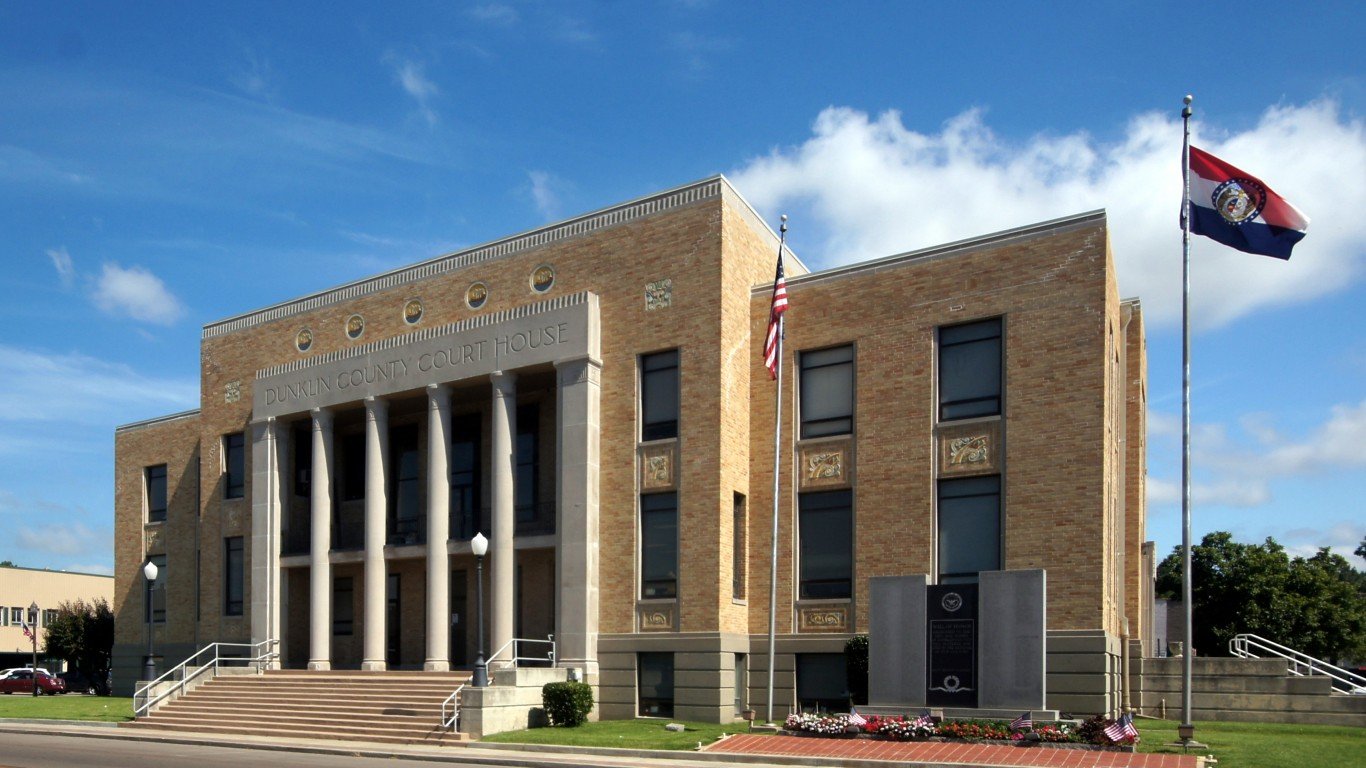
- Estimated cost of living in county: 19.3% lower than national average
- Median household income in county: $47,368 (39.1% lower than national median)
- Median home value in county: $93,800 (72.4% lower than national median)
- 5-year average unemployment rate in county: 4.7% (0.5 ppt. lower than national average)
- County population: 27,795
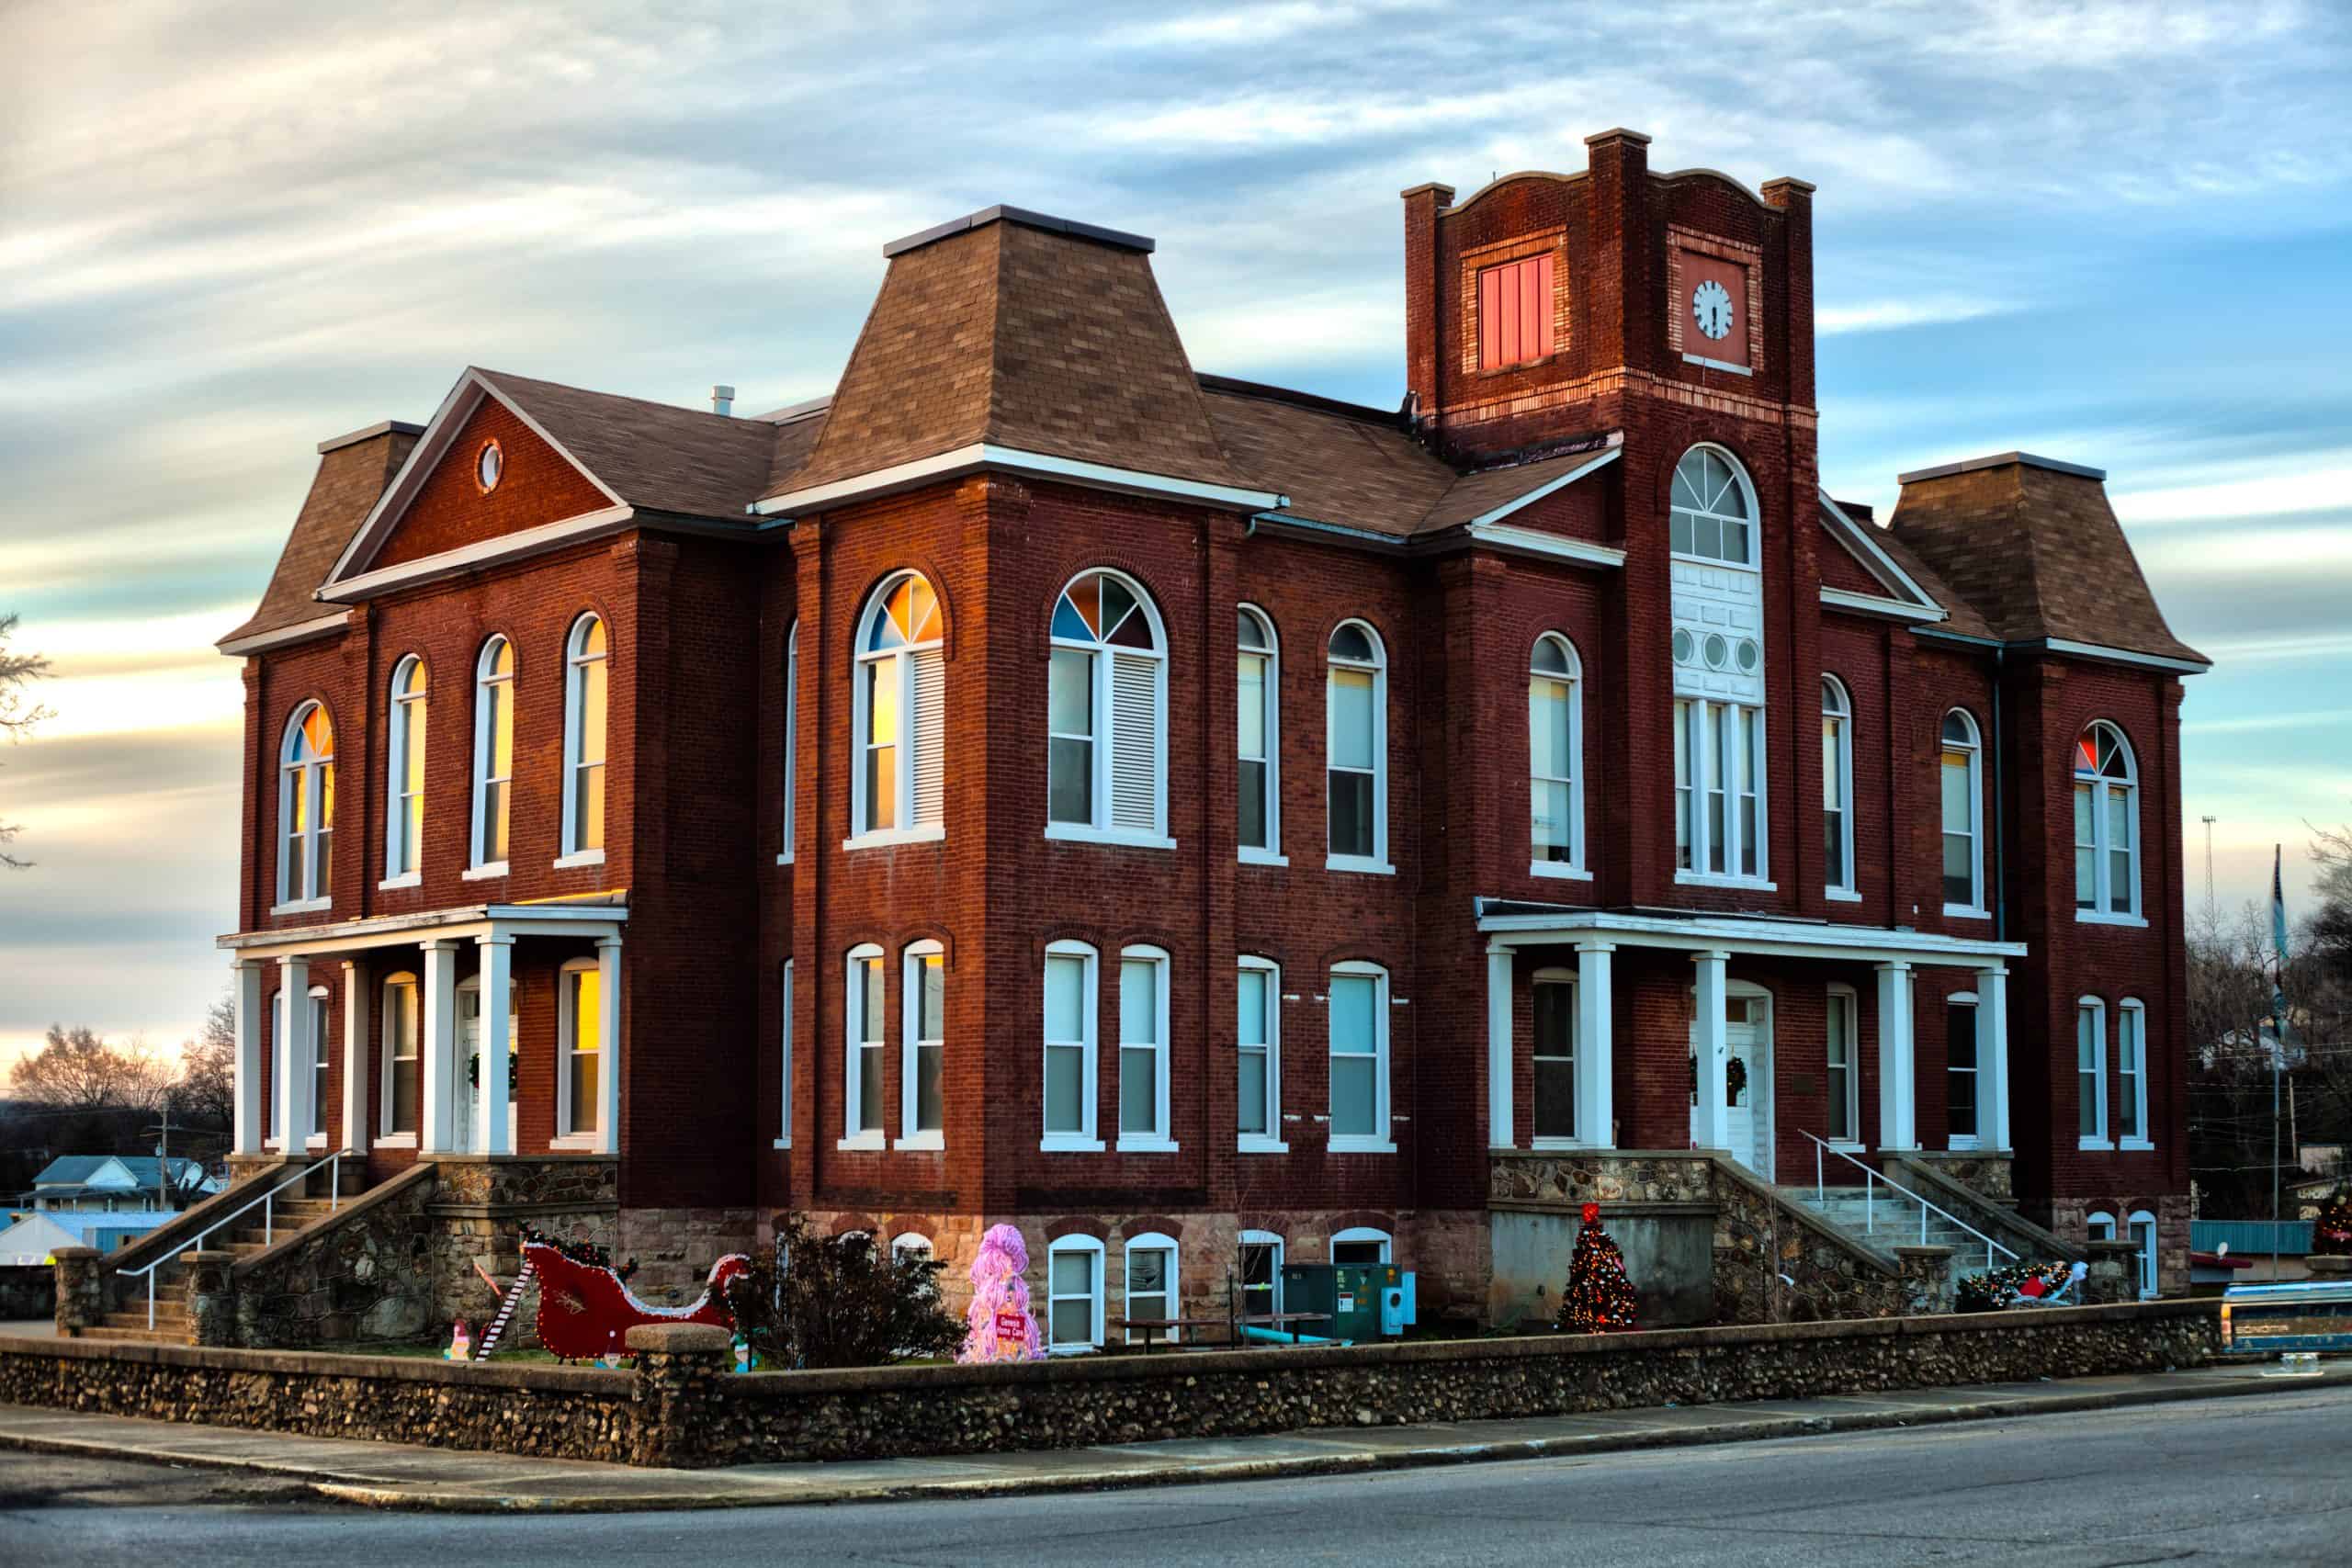
31. Monroe County, Arkansas

- Estimated cost of living in county: 19.4% lower than national average
- Median household income in county: $43,955 (43.4% lower than national median)
- Median home value in county: $82,200 (75.8% lower than national median)
- 5-year average unemployment rate in county: 9.4% (4.2 ppt. higher than national average)
- County population: 6,681
30. Newton County, Mississippi

- Estimated cost of living in county: 19.4% lower than national average
- Median household income in county: $50,426 (35.1% lower than national median)
- Median home value in county: $102,700 (69.8% lower than national median)
- 5-year average unemployment rate in county: 3.5% (1.7 ppt. lower than national average)
- County population: 21,151
29. Randolph County, Alabama

- Estimated cost of living in county: 19.4% lower than national average
- Median household income in county: $51,551 (33.7% lower than national median)
- Median home value in county: $184,000 (45.9% lower than national median)
- 5-year average unemployment rate in county: 2.8% (2.4 ppt. lower than national average)
- County population: 22,310
28. Marion County, Alabama

- Estimated cost of living in county: 19.5% lower than national average
- Median household income in county: $50,714 (34.7% lower than national median)
- Median home value in county: $104,300 (69.3% lower than national median)
- 5-year average unemployment rate in county: 6.2% (1.0 ppt. higher than national average)
- County population: 29,190
27. Minidoka County, Idaho
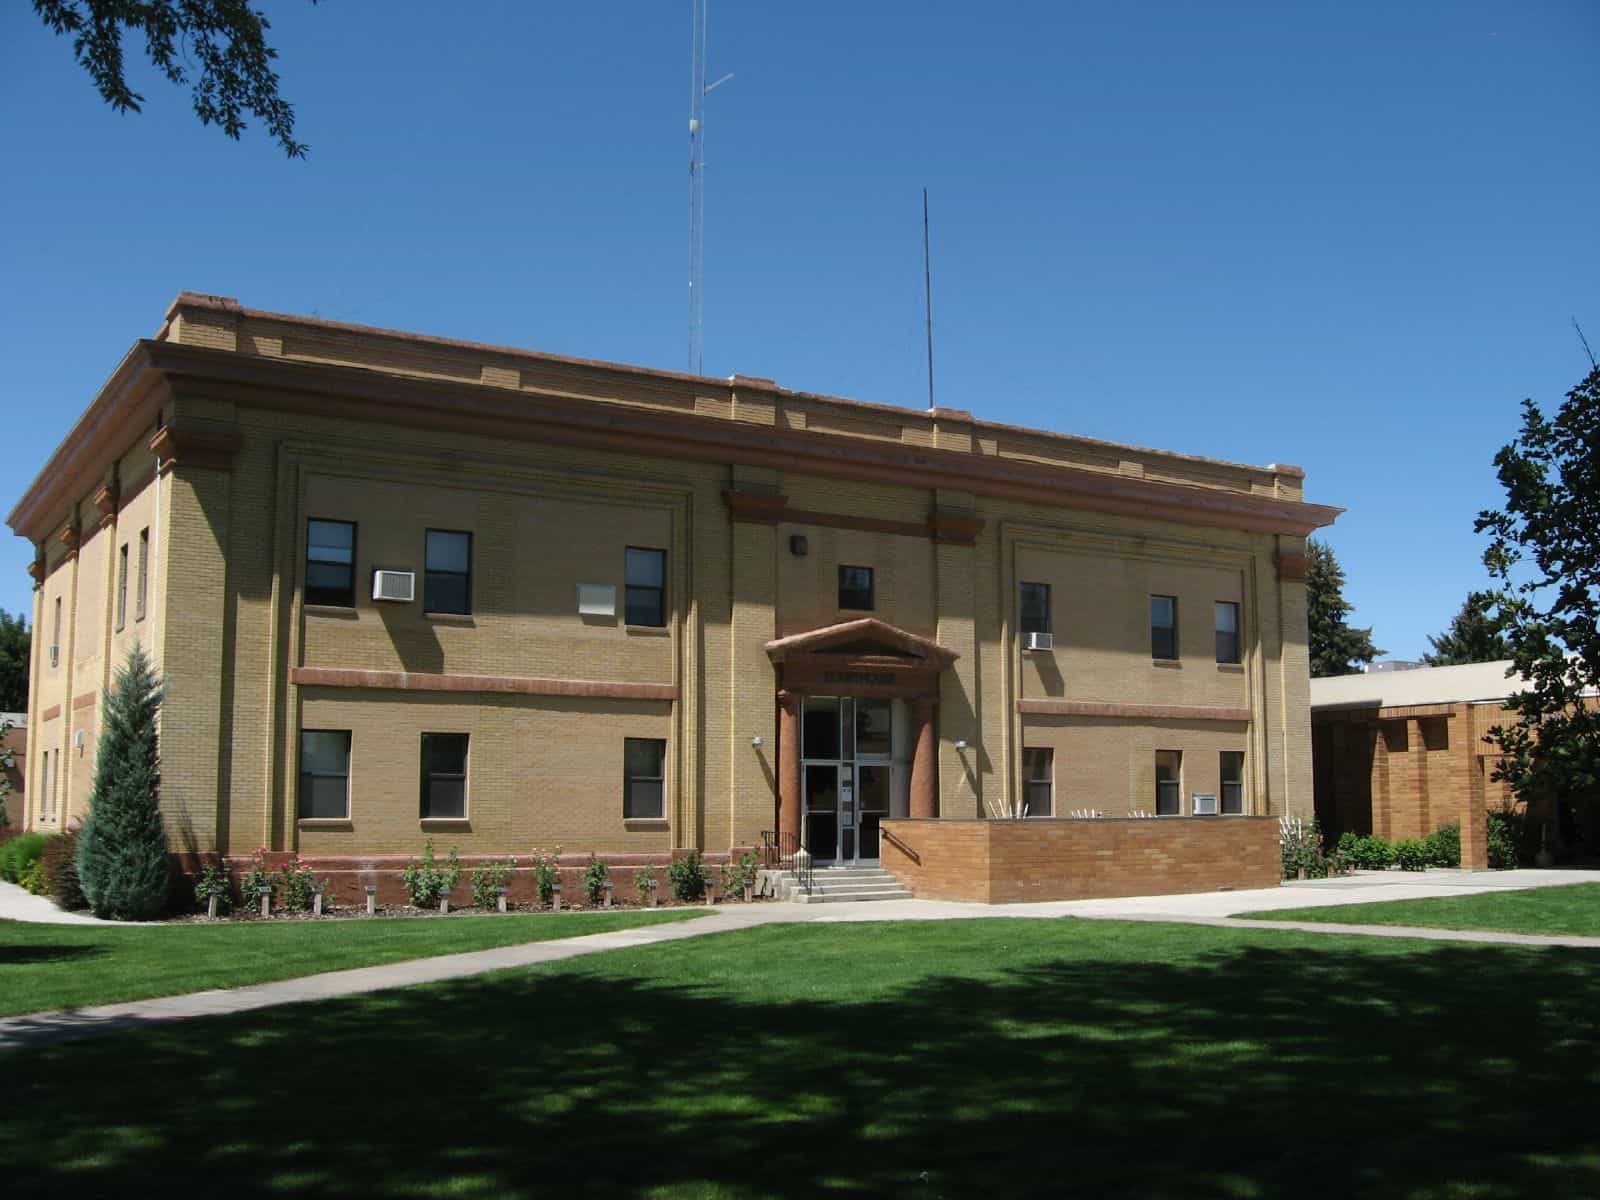
- Estimated cost of living in county: 19.5% lower than national average
- Median household income in county: $70,060 (9.9% lower than national median)
- Median home value in county: $235,300 (30.8% lower than national median)
- 5-year average unemployment rate in county: 3.0% (2.2 ppt. lower than national average)
- County population: 21,922
26. Ripley County, Missouri
- Estimated cost of living in county: 19.5% lower than national average
- Median household income in county: $43,898 (43.5% lower than national median)
- Median home value in county: $110,800 (67.4% lower than national median)
- 5-year average unemployment rate in county: 4.6% (0.6 ppt. lower than national average)
- County population: 10,755
25. Fayette County, Alabama

- Estimated cost of living in county: 19.5% lower than national average
- Median household income in county: $50,733 (34.7% lower than national median)
- Median home value in county: $121,200 (64.4% lower than national median)
- 5-year average unemployment rate in county: 9.5% (4.3 ppt. higher than national average)
- County population: 16,173
24. Apache County, Arizona

- Estimated cost of living in county: 19.6% lower than national average
- Median household income in county: $40,338 (48.1% lower than national median)
- Median home value in county: $68,500 (79.9% lower than national median)
- 5-year average unemployment rate in county: 10.0% (4.8 ppt. higher than national average)
- County population: 65,680
23. Sedgwick County, Colorado
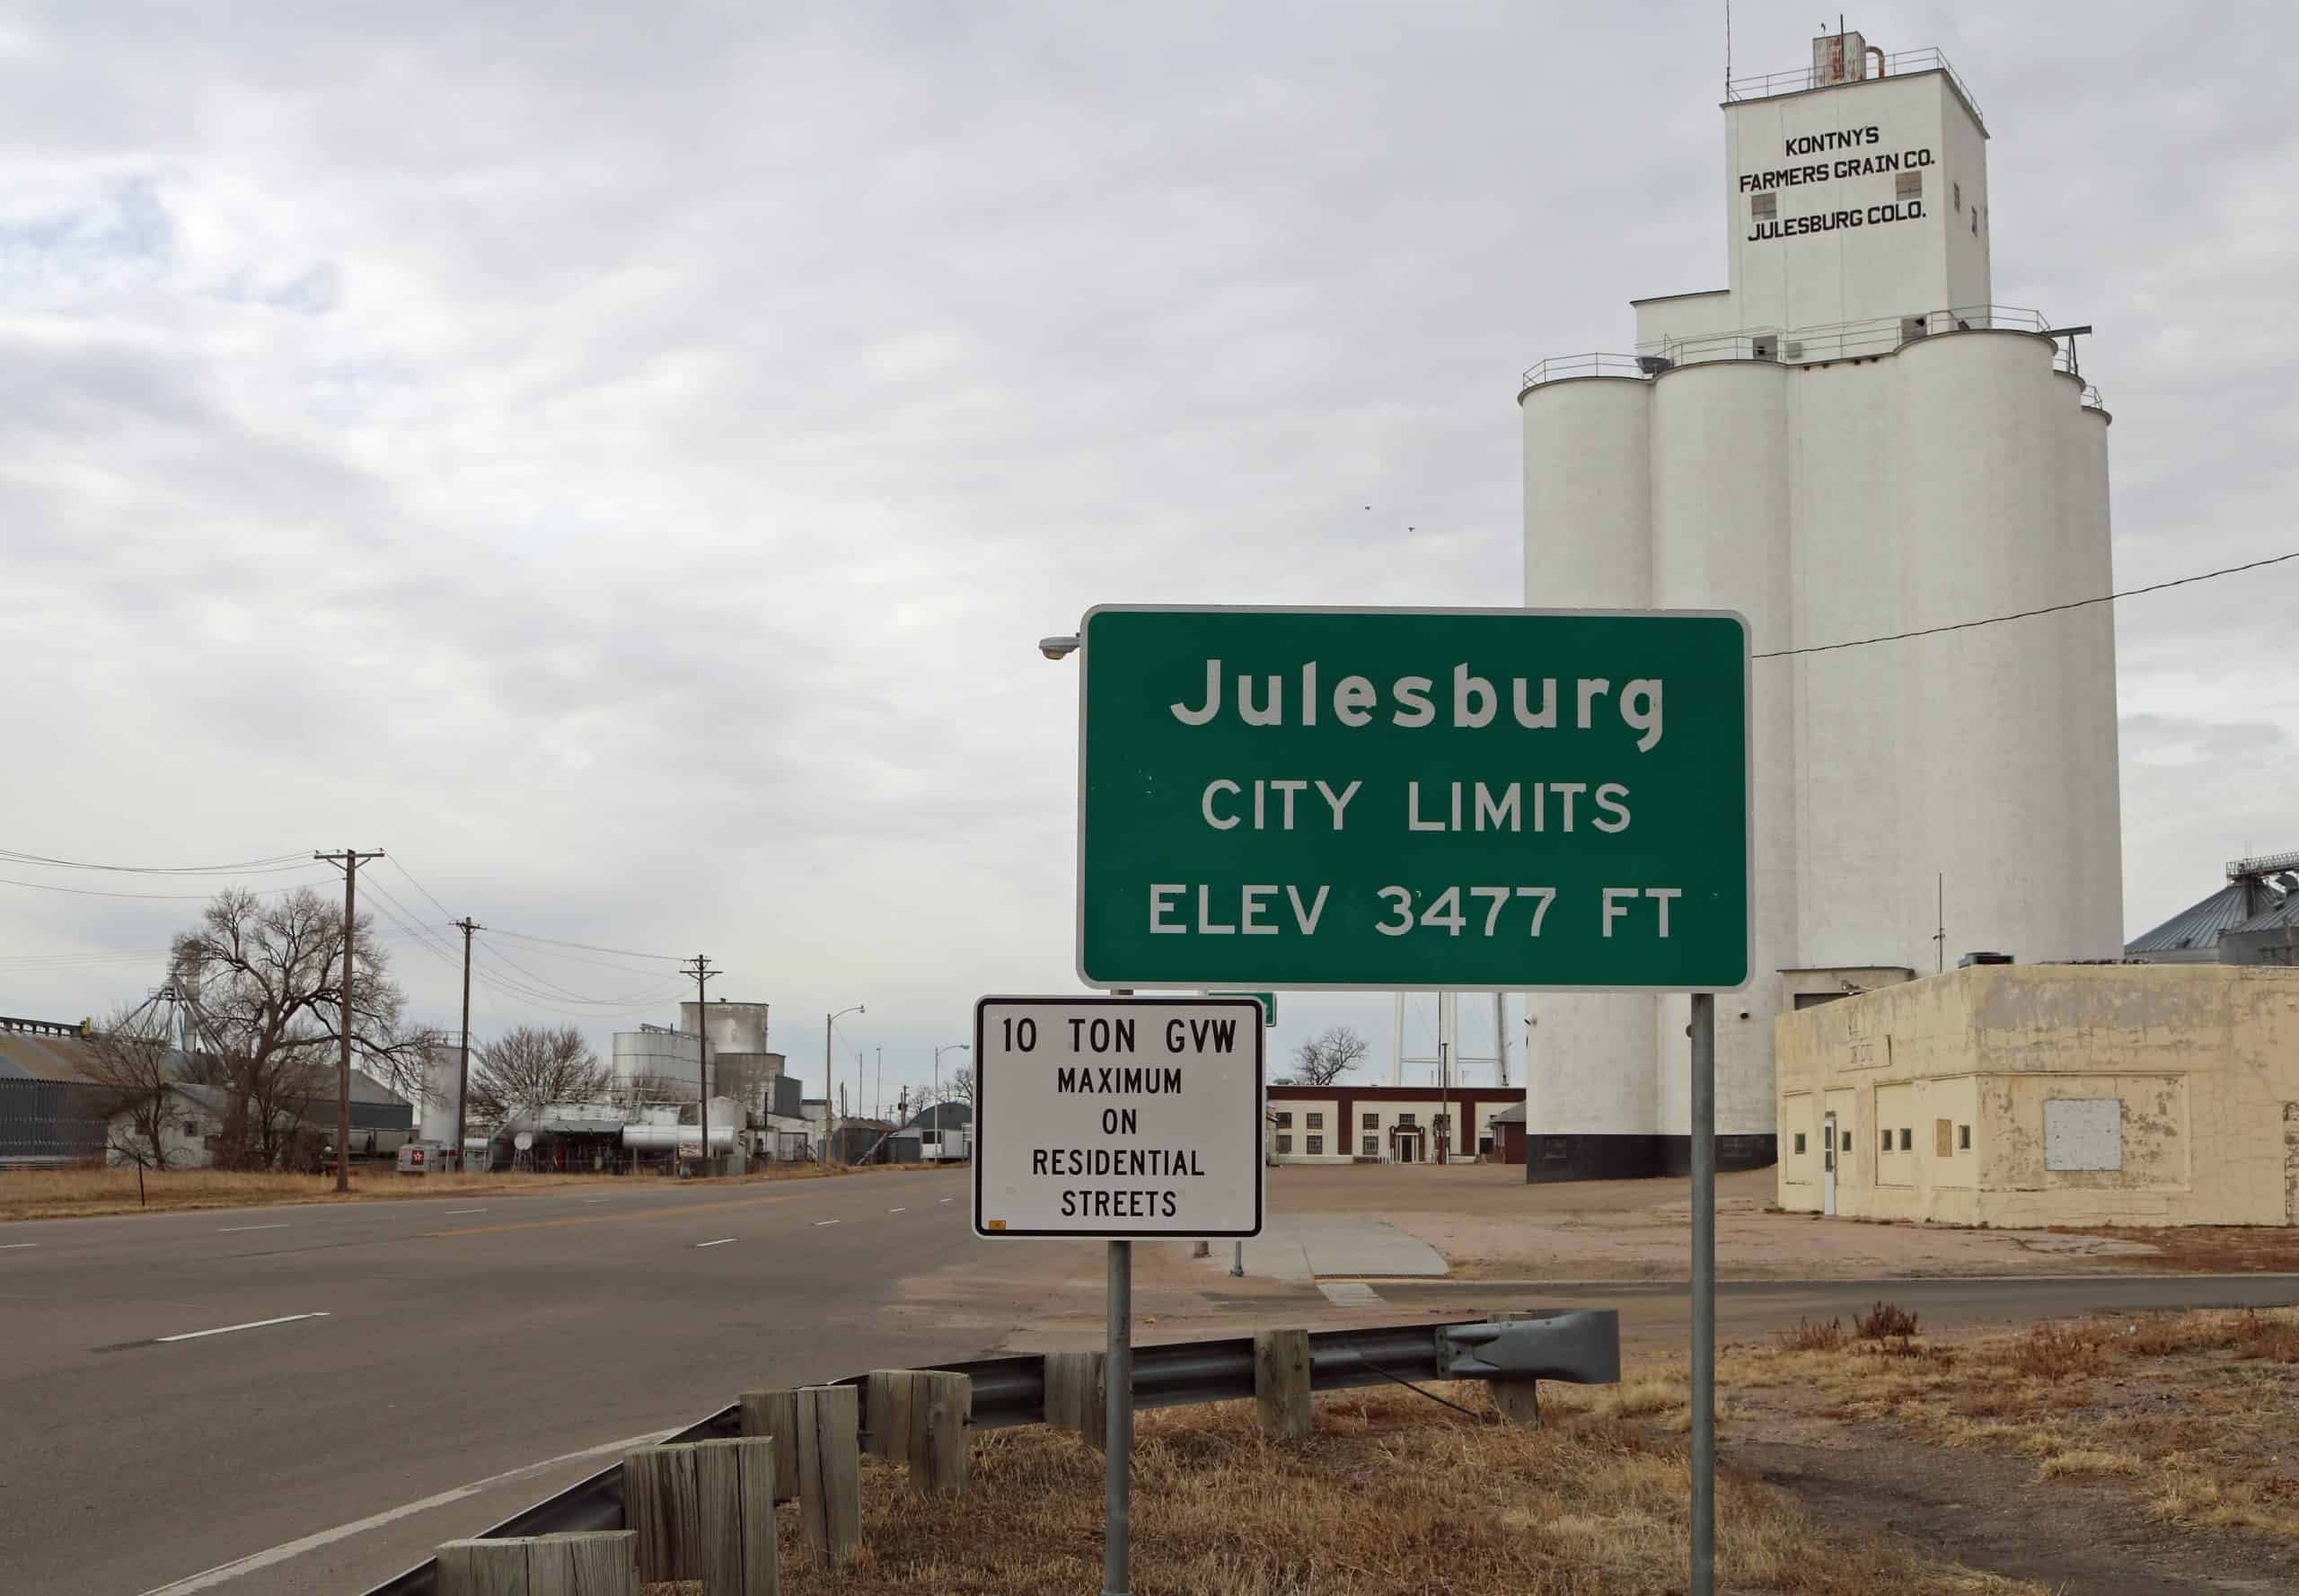
- Estimated cost of living in county: 19.8% lower than national average
- Median household income in county: $52,833 (32.0% lower than national median)
- Median home value in county: $142,700 (58.1% lower than national median)
- 5-year average unemployment rate in county: 2.3% (2.9 ppt. lower than national average)
- County population: 2,346
22. Neshoba County, Mississippi

- Estimated cost of living in county: 19.8% lower than national average
- Median household income in county: $53,087 (31.7% lower than national median)
- Median home value in county: $96,600 (71.6% lower than national median)
- 5-year average unemployment rate in county: 8.1% (2.9 ppt. higher than national average)
- County population: 28,927
21. Tippah County, Mississippi

- Estimated cost of living in county: 19.9% lower than national average
- Median household income in county: $51,141 (34.2% lower than national median)
- Median home value in county: $128,400 (62.3% lower than national median)
- 5-year average unemployment rate in county: 5.3% (0.1 ppt. higher than national average)
- County population: 21,621
20. Prowers County, Colorado
- Estimated cost of living in county: 19.9% lower than national average
- Median household income in county: $57,601 (25.9% lower than national median)
- Median home value in county: $150,900 (55.6% lower than national median)
- 5-year average unemployment rate in county: 4.8% (0.4 ppt. lower than national average)
- County population: 11,931
19. Attala County, Mississippi
- Estimated cost of living in county: 19.9% lower than national average
- Median household income in county: $48,098 (38.1% lower than national median)
- Median home value in county: $107,600 (68.4% lower than national median)
- 5-year average unemployment rate in county: 6.0% (0.8 ppt. higher than national average)
- County population: 17,685
18. Lamar County, Alabama

- Estimated cost of living in county: 19.9% lower than national average
- Median household income in county: $47,447 (39.0% lower than national median)
- Median home value in county: $112,700 (66.9% lower than national median)
- 5-year average unemployment rate in county: 6.4% (1.2 ppt. higher than national average)
- County population: 13,809
17. Scott County, Mississippi
- Estimated cost of living in county: 19.9% lower than national average
- Median household income in county: $48,492 (37.6% lower than national median)
- Median home value in county: $89,900 (73.6% lower than national median)
- 5-year average unemployment rate in county: 4.4% (0.8 ppt. lower than national average)
- County population: 27,754
16. Winston County, Mississippi

- Estimated cost of living in county: 20.0% lower than national average
- Median household income in county: $49,071 (36.9% lower than national median)
- Median home value in county: $121,200 (64.4% lower than national median)
- 5-year average unemployment rate in county: 7.9% (2.7 ppt. higher than national average)
- County population: 17,609
15. Union County, New Mexico

- Estimated cost of living in county: 20.1% lower than national average
- Median household income in county: $45,319 (41.7% lower than national median)
- Median home value in county: $135,900 (60.1% lower than national median)
- 5-year average unemployment rate in county: 6.6% (1.4 ppt. higher than national average)
- County population: 4,039
14. Wilkinson County, Mississippi

- Estimated cost of living in county: 20.1% lower than national average
- Median household income in county: $35,930 (53.8% lower than national median)
- Median home value in county: $80,200 (76.4% lower than national median)
- 5-year average unemployment rate in county: 7.5% (2.3 ppt. higher than national average)
- County population: 8,376
13. Benton County, Mississippi

- Estimated cost of living in county: 20.1% lower than national average
- Median household income in county: $42,139 (45.8% lower than national median)
- Median home value in county: $109,300 (67.9% lower than national median)
- 5-year average unemployment rate in county: 2.7% (2.5 ppt. lower than national average)
- County population: 7,592
12. Winston County, Alabama

- Estimated cost of living in county: 20.3% lower than national average
- Median household income in county: $48,032 (38.2% lower than national median)
- Median home value in county: $110,500 (67.5% lower than national median)
- 5-year average unemployment rate in county: 4.2% (1.0 ppt. lower than national average)
- County population: 23,637
11. Jefferson County, Mississippi
- Estimated cost of living in county: 20.3% lower than national average
- Median household income in county: $36,207 (53.4% lower than national median)
- Median home value in county: $81,400 (76.1% lower than national median)
- 5-year average unemployment rate in county: 5.0% (0.2 ppt. lower than national average)
- County population: 7,127
10. Clay County, Alabama

- Estimated cost of living in county: 20.5% lower than national average
- Median household income in county: $51,852 (33.3% lower than national median)
- Median home value in county: $144,700 (57.5% lower than national median)
- 5-year average unemployment rate in county: 3.5% (1.7 ppt. lower than national average)
- County population: 14,188
9. Prentiss County, Mississippi

- Estimated cost of living in county: 20.5% lower than national average
- Median household income in county: $51,466 (33.8% lower than national median)
- Median home value in county: $116,500 (65.8% lower than national median)
- 5-year average unemployment rate in county: 3.5% (1.7 ppt. lower than national average)
- County population: 24,999
8. Leake County, Mississippi

- Estimated cost of living in county: 20.5% lower than national average
- Median household income in county: $48,418 (37.7% lower than national median)
- Median home value in county: $114,600 (66.3% lower than national median)
- 5-year average unemployment rate in county: 6.7% (1.5 ppt. higher than national average)
- County population: 21,288
7. Cheyenne County, Colorado
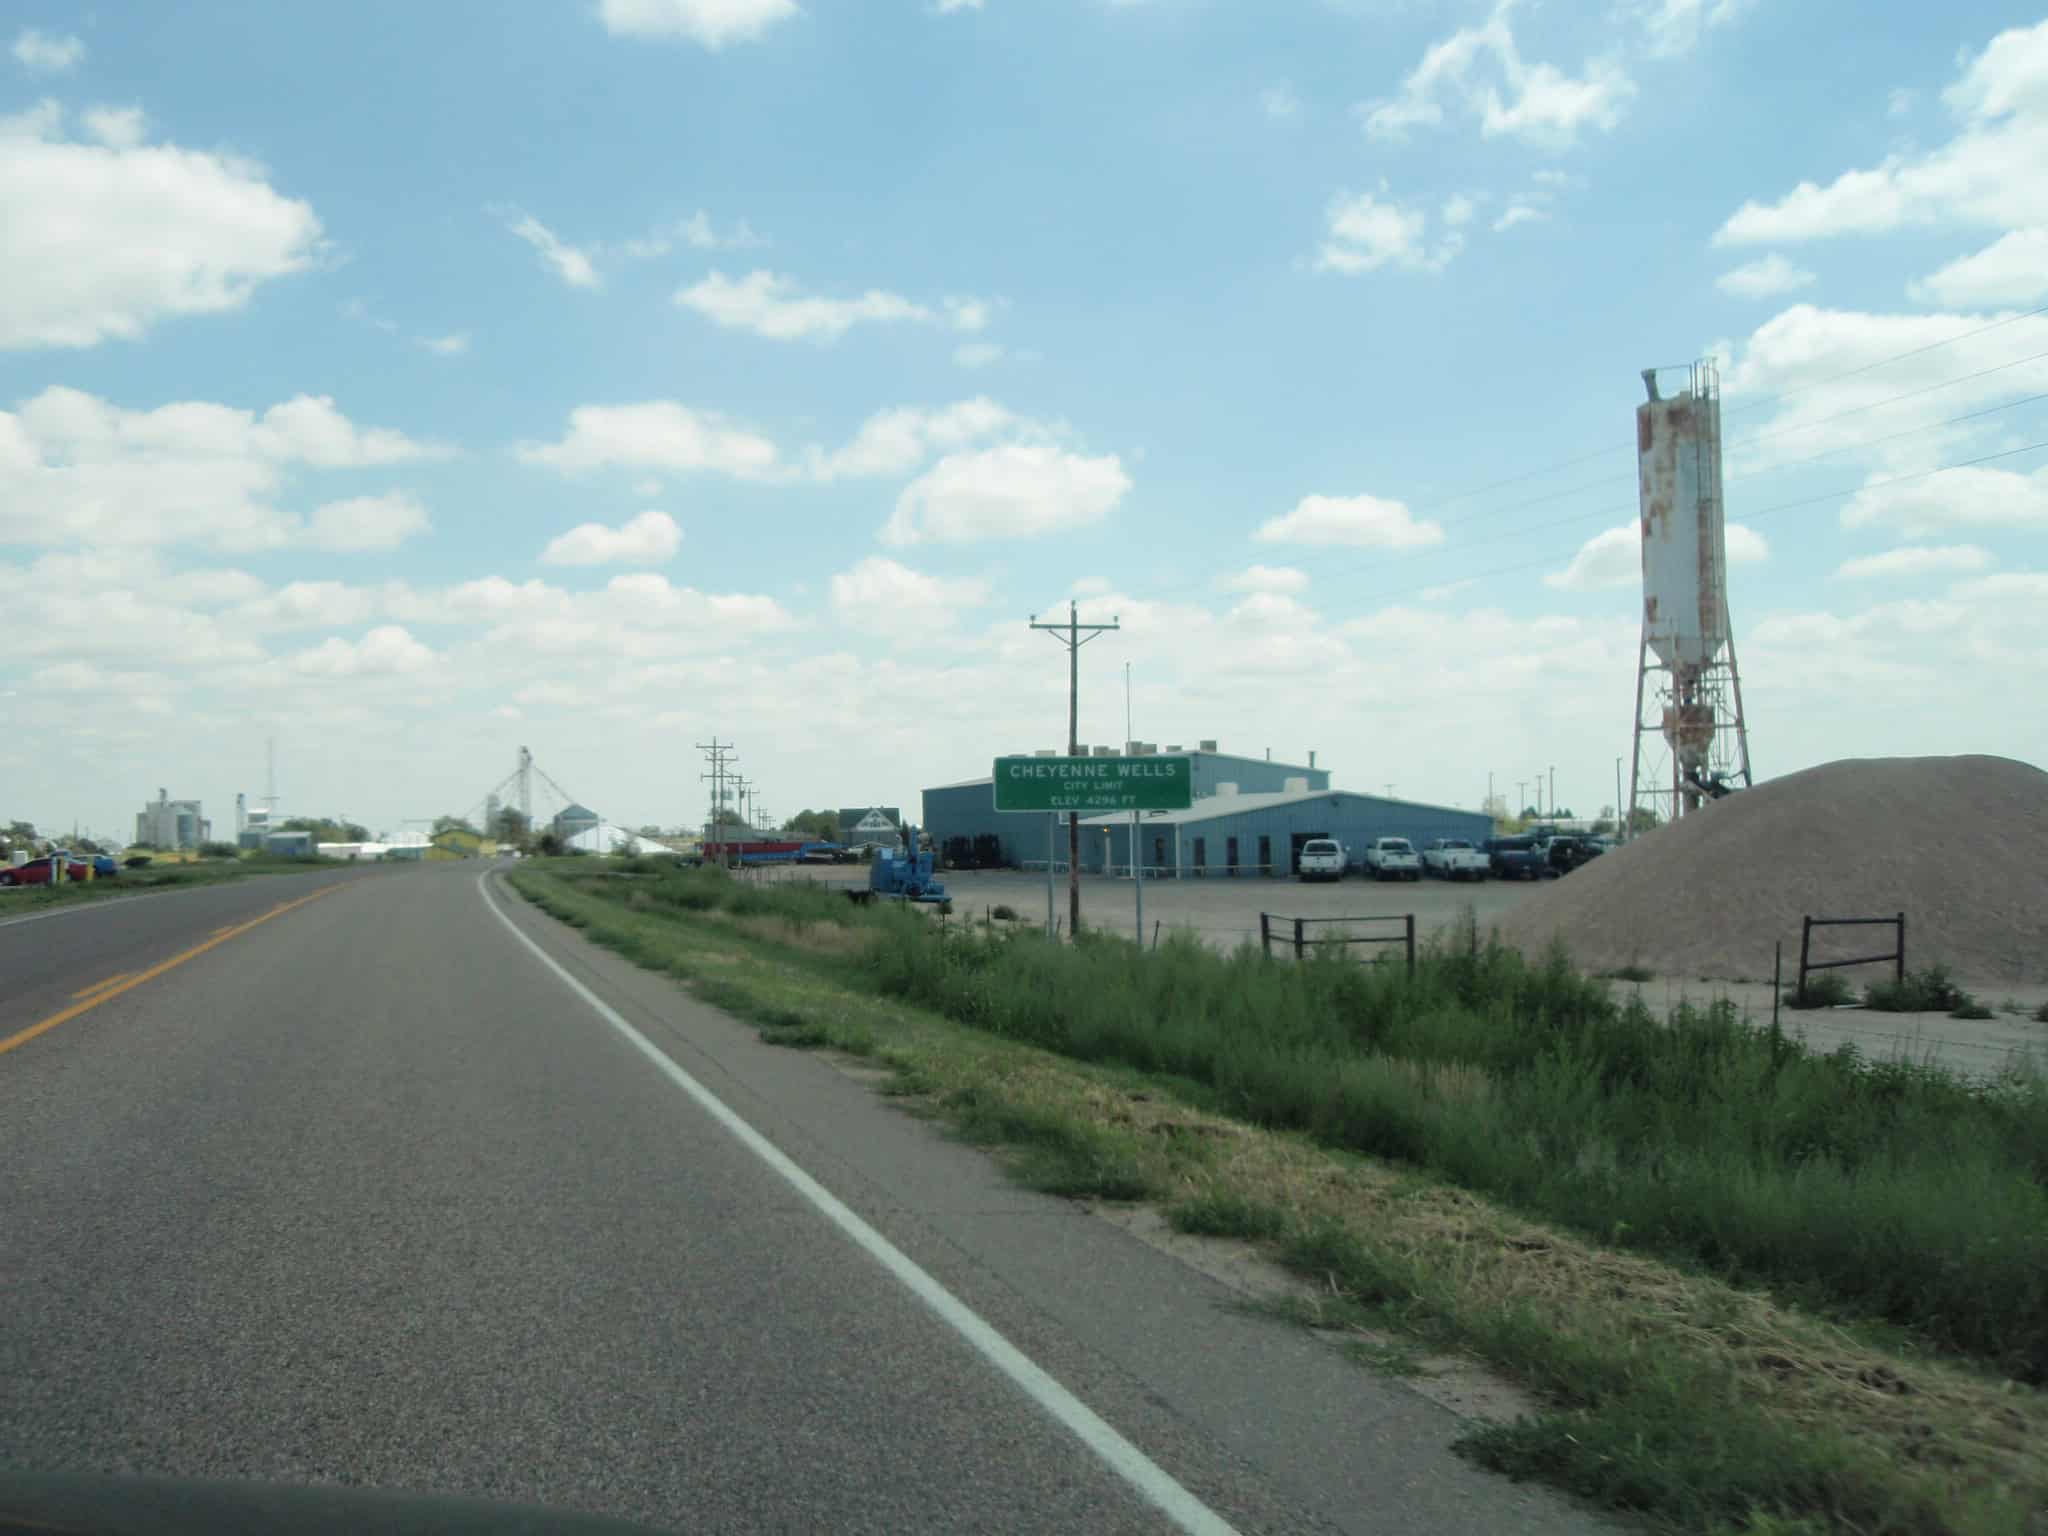
- Estimated cost of living in county: 20.8% lower than national average
- Median household income in county: $67,768 (12.8% lower than national median)
- Median home value in county: $187,100 (45.0% lower than national median)
- 5-year average unemployment rate in county: 1.9% (3.3 ppt. lower than national average)
- County population: 1,732
6. Tishomingo County, Mississippi

- Estimated cost of living in county: 20.9% lower than national average
- Median household income in county: $46,257 (40.5% lower than national median)
- Median home value in county: $132,500 (61.1% lower than national median)
- 5-year average unemployment rate in county: 3.1% (2.1 ppt. lower than national average)
- County population: 18,738
5. Kemper County, Mississippi

- Estimated cost of living in county: 20.9% lower than national average
- Median household income in county: $43,595 (43.9% lower than national median)
- Median home value in county: $90,200 (73.5% lower than national median)
- 5-year average unemployment rate in county: 11.0% (5.8 ppt. higher than national average)
- County population: 8,855
4. Franklin County, Alabama

- Estimated cost of living in county: 21.3% lower than national average
- Median household income in county: $51,493 (33.7% lower than national median)
- Median home value in county: $128,000 (62.4% lower than national median)
- 5-year average unemployment rate in county: 3.6% (1.6 ppt. lower than national average)
- County population: 31,978
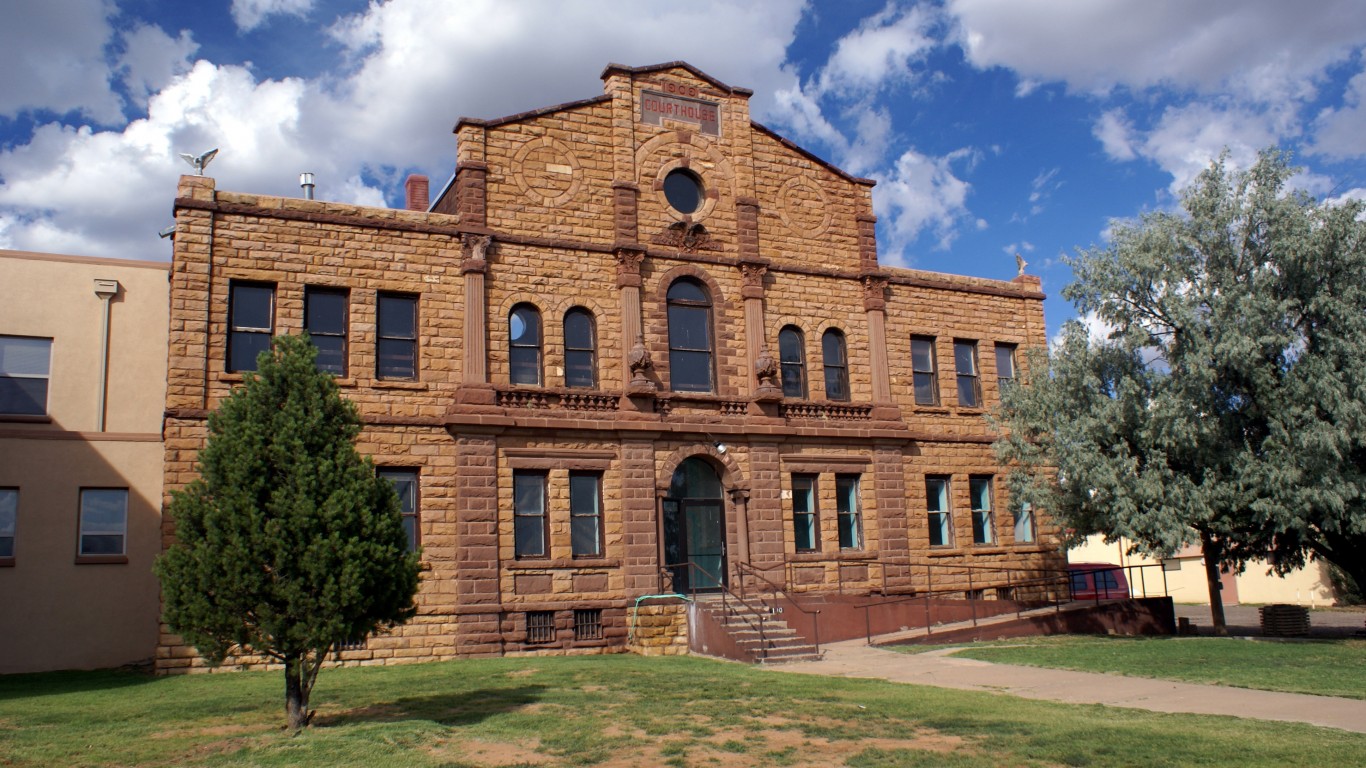
3. Greenlee County, Arizona

- Estimated cost of living in county: 21.9% lower than national average
- Median household income in county: $75,239 (3.2% lower than national median)
- Median home value in county: $136,300 (59.9% lower than national median)
- 5-year average unemployment rate in county: 3.5% (1.7 ppt. lower than national average)
- County population: 9,452
2. Santa Cruz County, Arizona
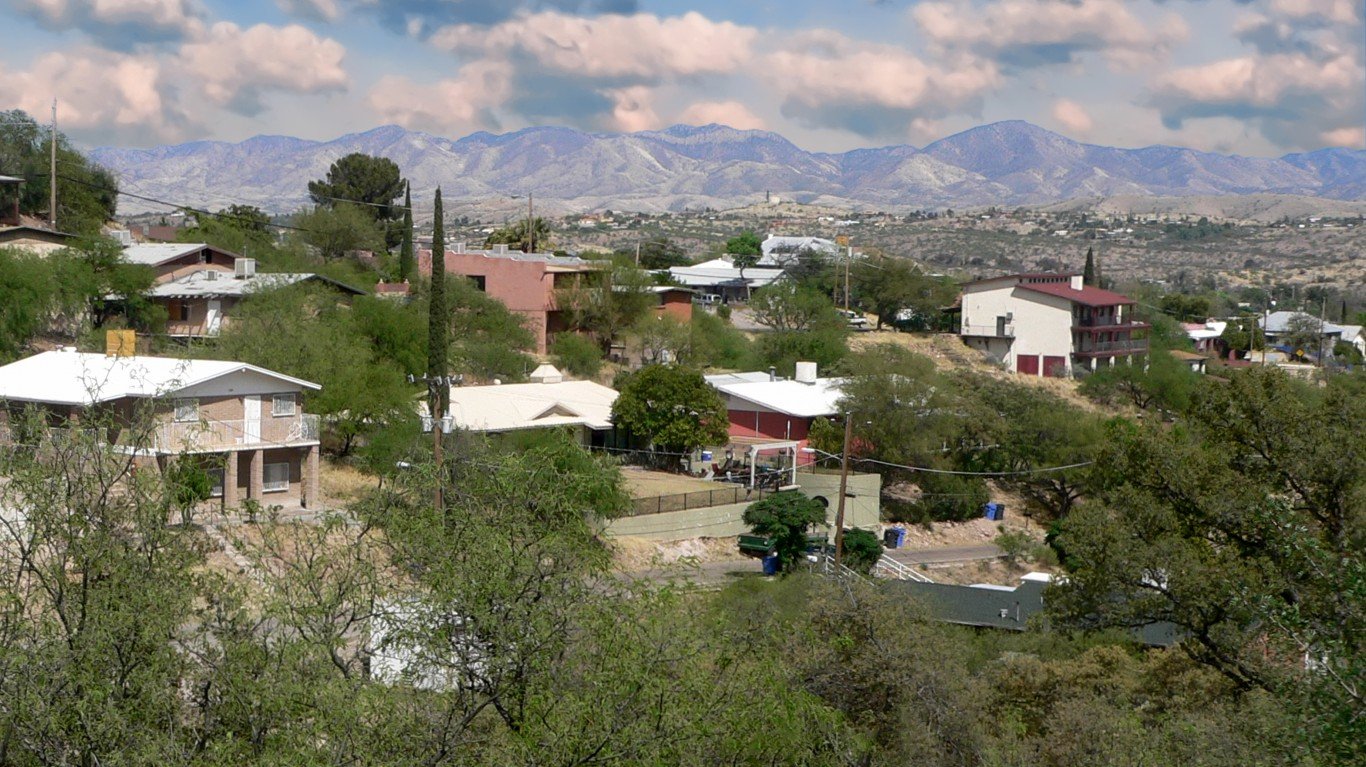
- Estimated cost of living in county: 24.4% lower than national average
- Median household income in county: $53,614 (31.0% lower than national median)
- Median home value in county: $216,100 (36.5% lower than national median)
- 5-year average unemployment rate in county: 10.5% (5.3 ppt. higher than national average)
- County population: 48,209
1. Baca County, Colorado

- Estimated cost of living in county: 25.2% lower than national average
- Median household income in county: $40,380 (48.0% lower than national median)
- Median home value in county: $122,000 (64.1% lower than national median)
- 5-year average unemployment rate in county: 1.3% (3.9 ppt. lower than national average)
- County population: 3,460
The post Where $50,000 Goes Furthest: America’s 50 Least Expensive Counties to Live In appeared first on 24/7 Wall St..