


Traffic Congestion Is Holding Back the Economy in These Massive Cities
24/7 Wall St. Insights Last year, U.S. drivers spent an average of 43 hours sitting in traffic. Delays cost the average U.S. driver $771 in lost productivity throughout the year. New York and Chicago rank among the worst congested cities worldwide. The most congested city is in Europe. Also: Discover the next Nvidia Anyone driving […] The post Traffic Congestion Is Holding Back the Economy in These Massive Cities appeared first on 24/7 Wall St..
24/7 Wall St. Insights
- Last year, U.S. drivers spent an average of 43 hours sitting in traffic.
- Delays cost the average U.S. driver $771 in lost productivity throughout the year.
- New York and Chicago rank among the worst congested cities worldwide.
- The most congested city is in Europe.
- Also: Discover the next Nvidia
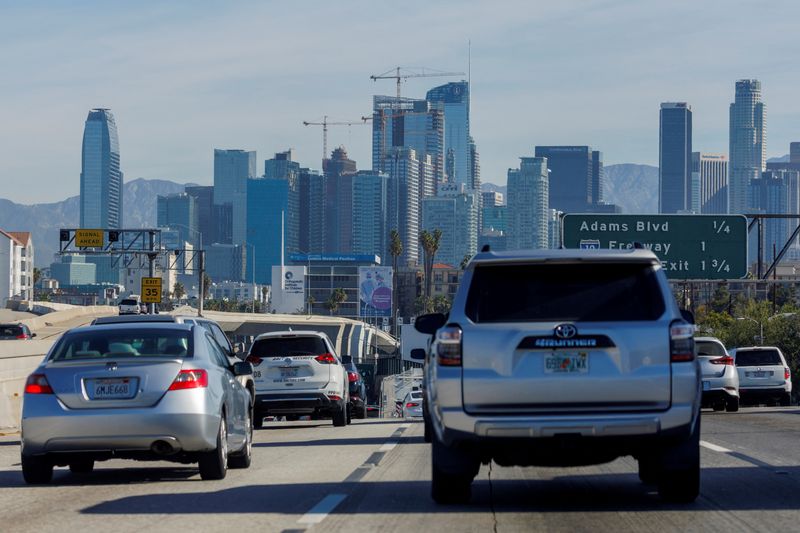
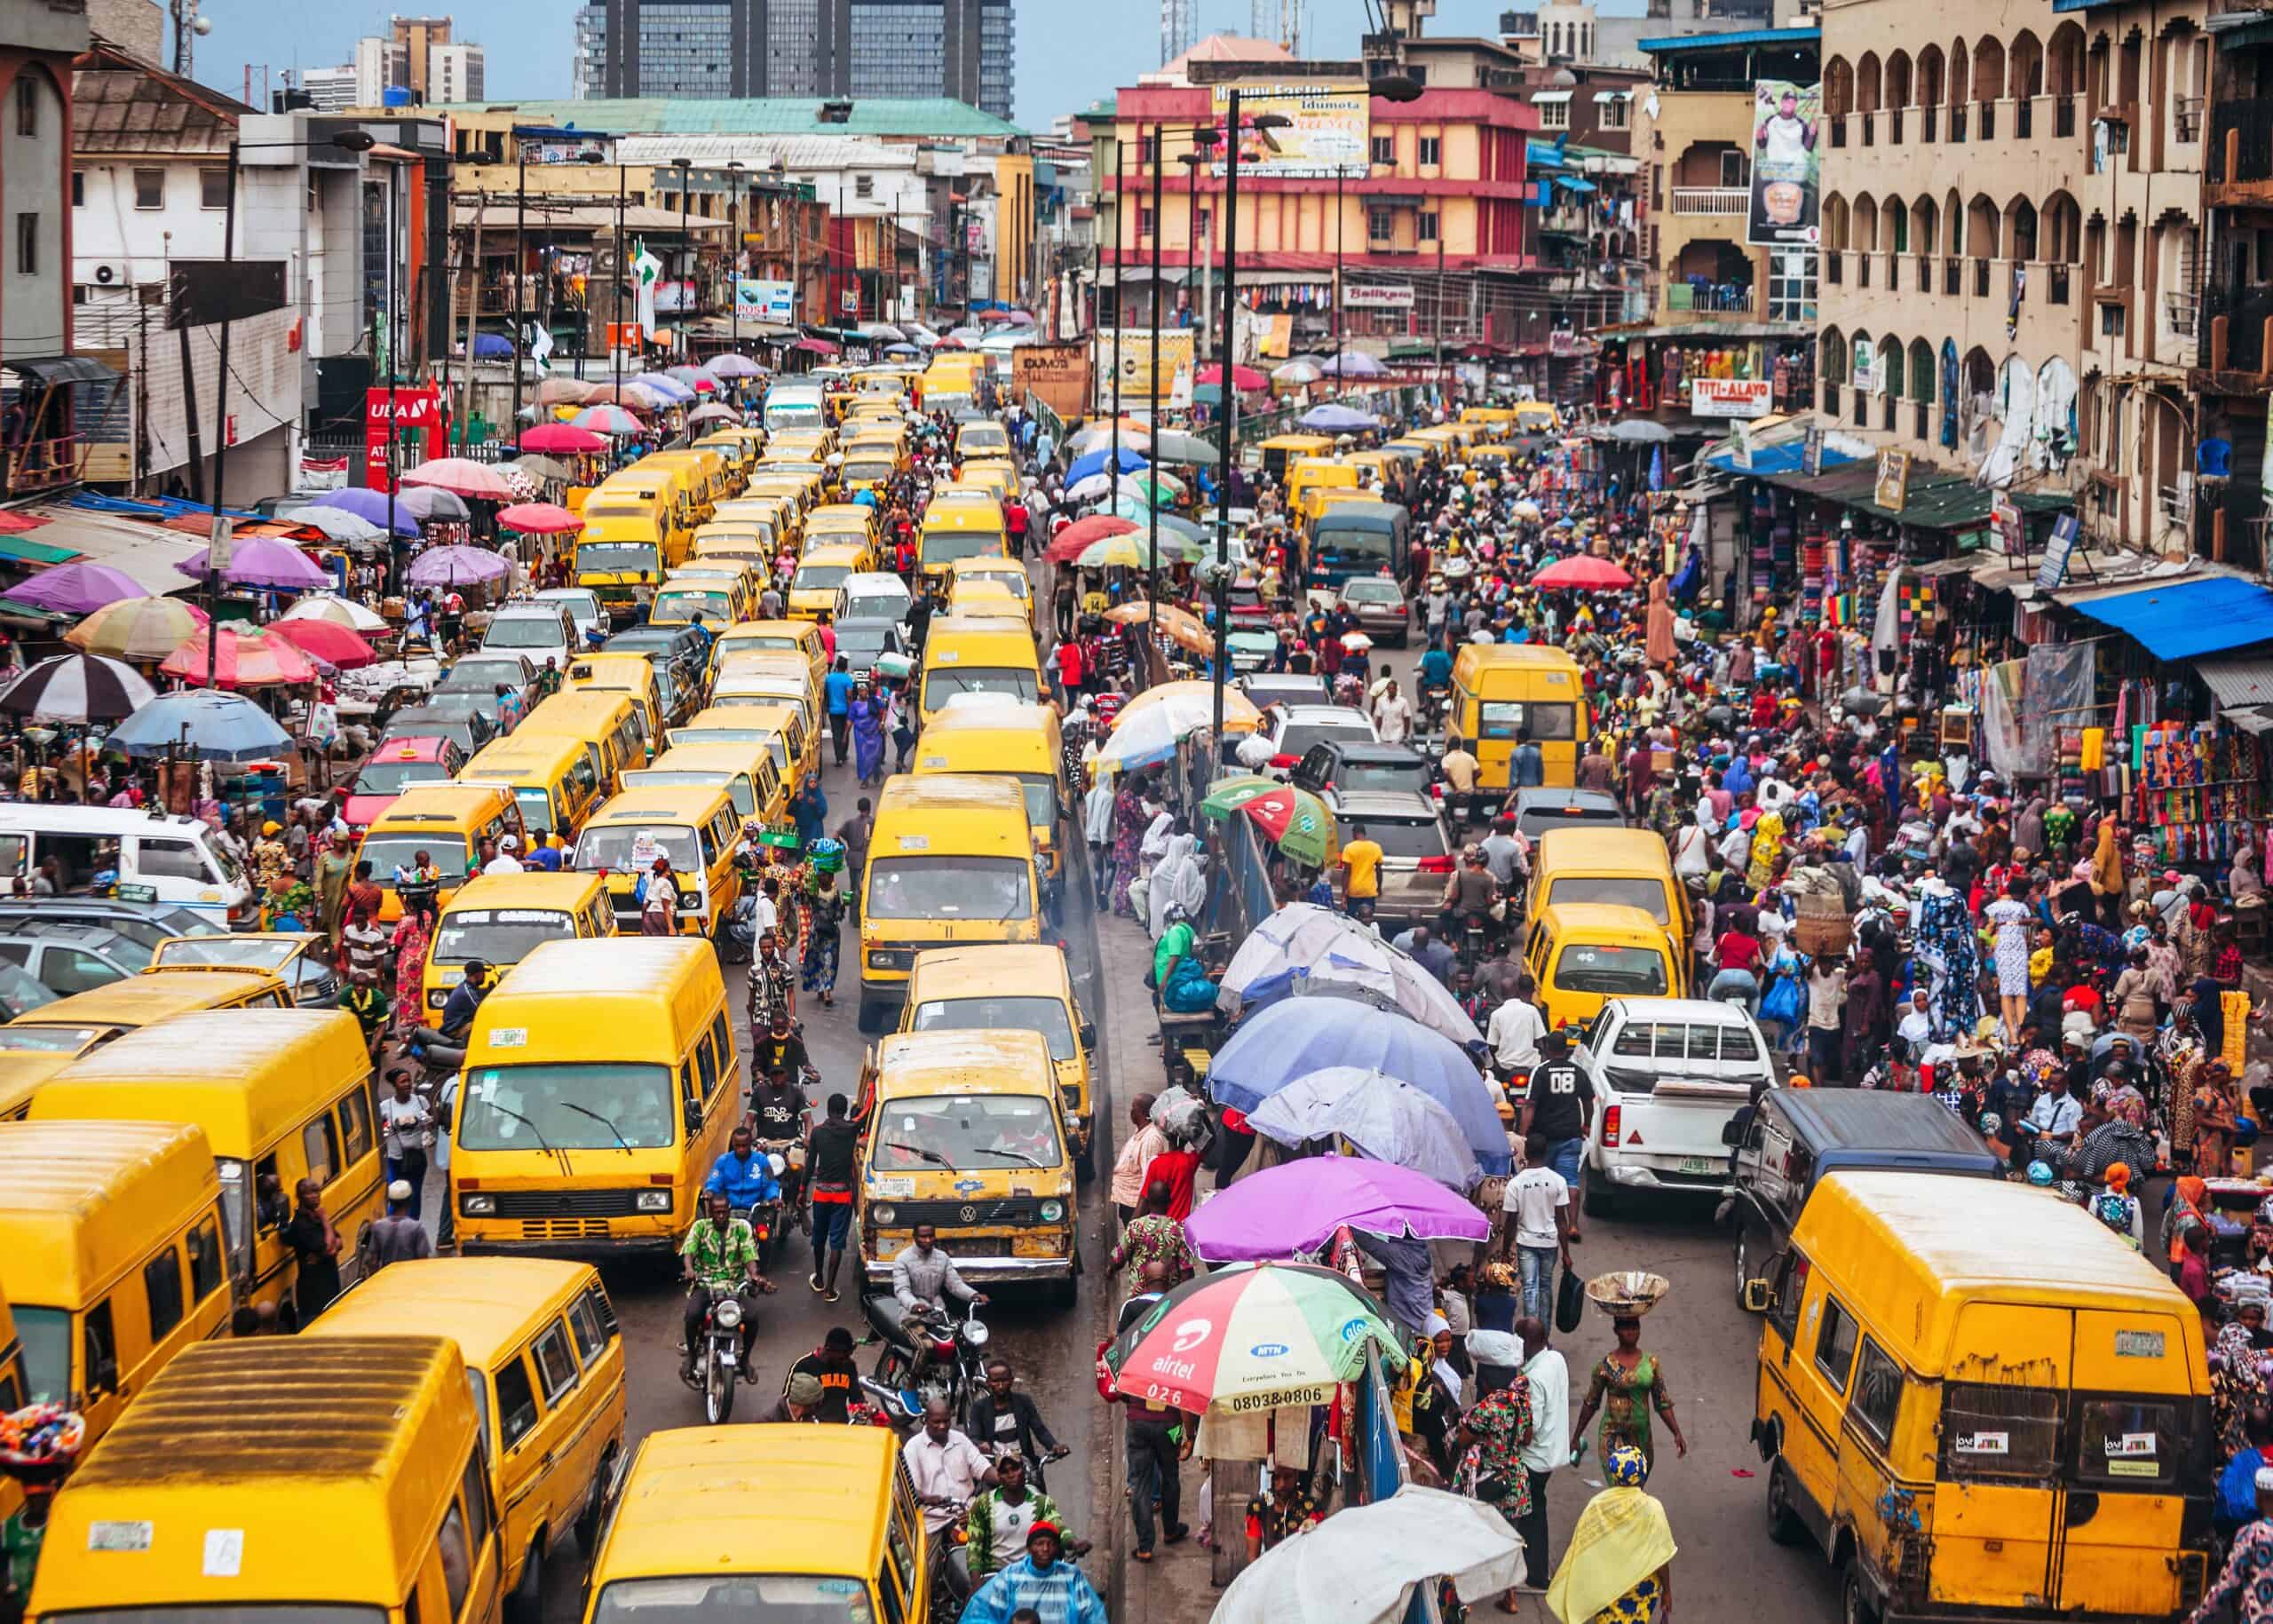
Anyone driving to work this year may have noticed an uptick in congestion. As remote work plummeted and more workers returned to the office, millions of more cars were added to U.S. roads, contributing to traffic and causing hours of extra gridlock during peak hours.
Traffic jams are more than an inconvenience – they’re a massive drain on the economy. In 2024, U.S. drivers spent an average of 43 hours sitting in traffic – more than a full work week. Hampering productivity, disrupting supply chains, and squeezing local businesses, traffic congestion carries with it a serious economic toll, with delays costing the average U.S. driver $771 throughout the year.
While cities like New York and Chicago are famous for their traffic, the most congested cities are outside of the United States. A closer look at the data reveals the global cities losing the most time and money to traffic congestion.
To determine the cities losing the most money to traffic congestion, 24/7 Wall St. reviewed data from software company INRIX. Global cities were ranked based on the average number of hours lost sitting in traffic per driver in 2024. Traffic is defined as the additional time spent in congestion during peak commute periods compared to off-peak periods. Supplemental data on average downtown speed – the speed at which a driver can expect to travel one mile into the central business district during AM peak hours – are also from INRIX. Data on vehicles per capita are from the International Organization of Motor Vehicle Manufacturers.
25. Toronto, Canada
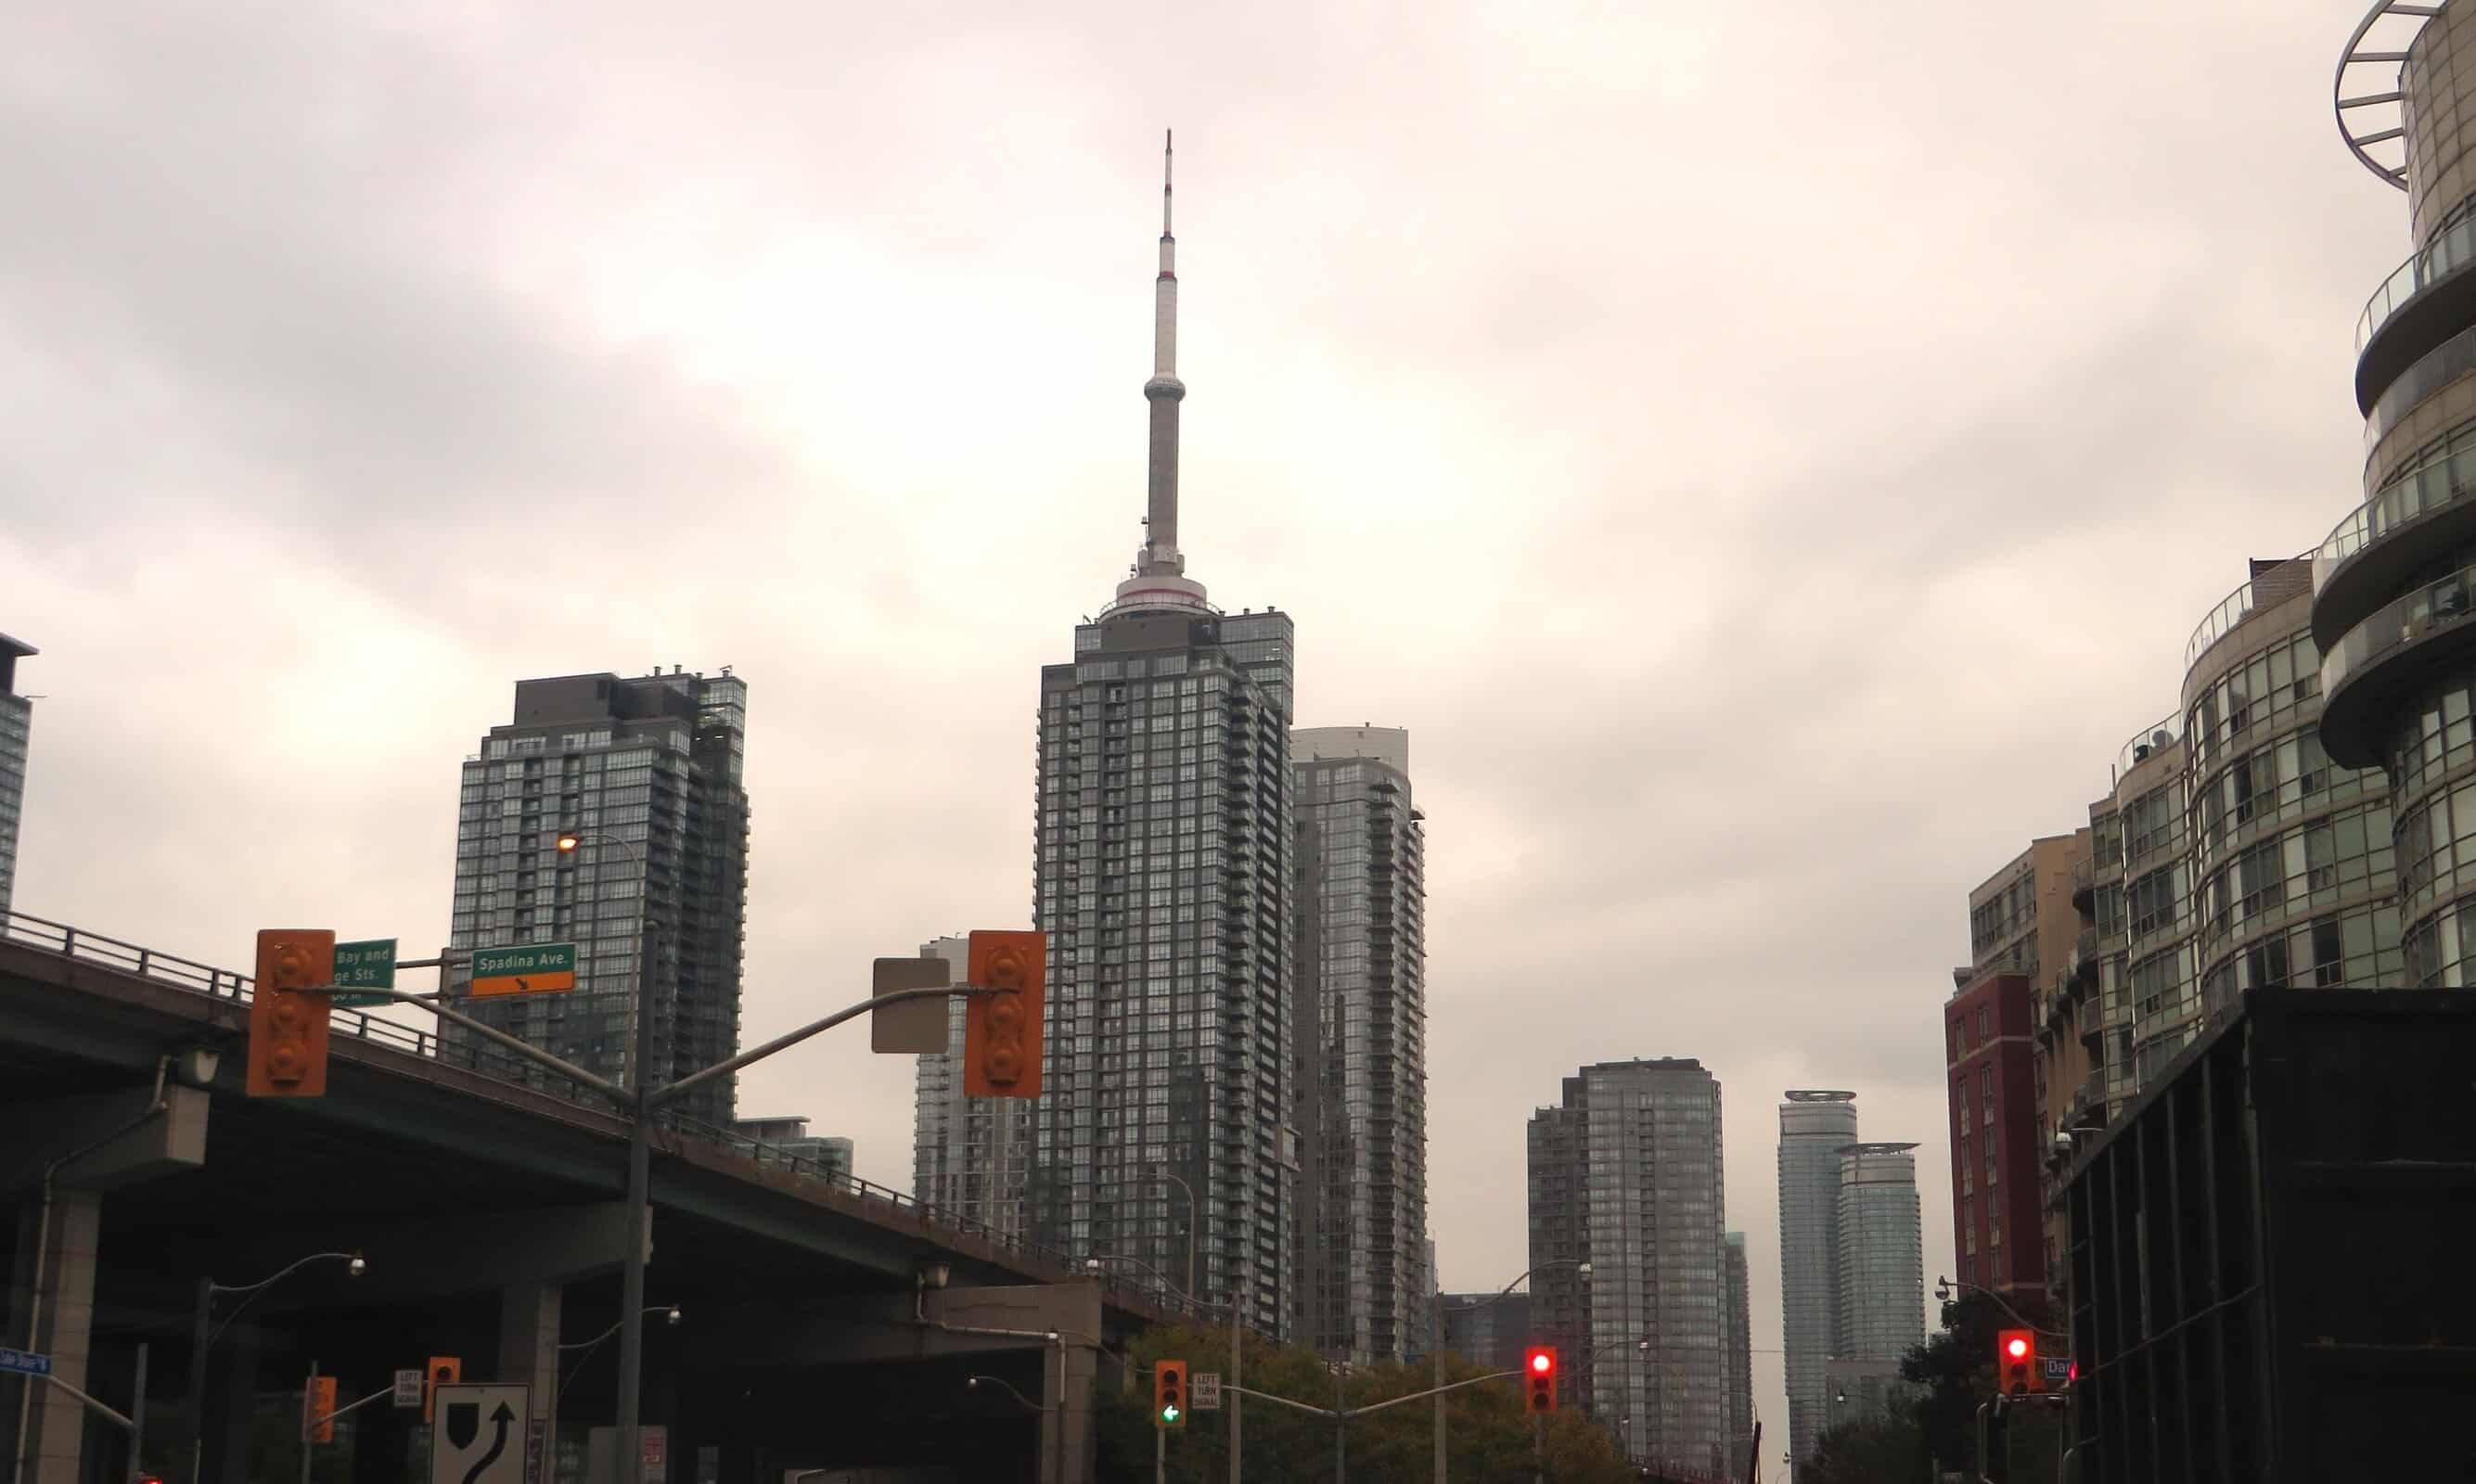
- Time lost to congestion in 2024: 61 hours per driver (+-3.0% from 2023)
- Average downtown speed during peak hours in 2024: 13 miles per hour
- Vehicles per capita: 707 cars per 1,000 inhabitants
- Share of trips taken by private vehicle: 66%
- City population: 2.7 million
24. Milan, Italy

- Time lost to congestion in 2024: 64 hours per driver (+7.0% from 2023)
- Average downtown speed during peak hours in 2024: 18 miles per hour
- Vehicles per capita: 756 cars per 1,000 inhabitants
- Share of trips taken by private vehicle: 67%
- City population: 1.4 million
23. Seattle, USA
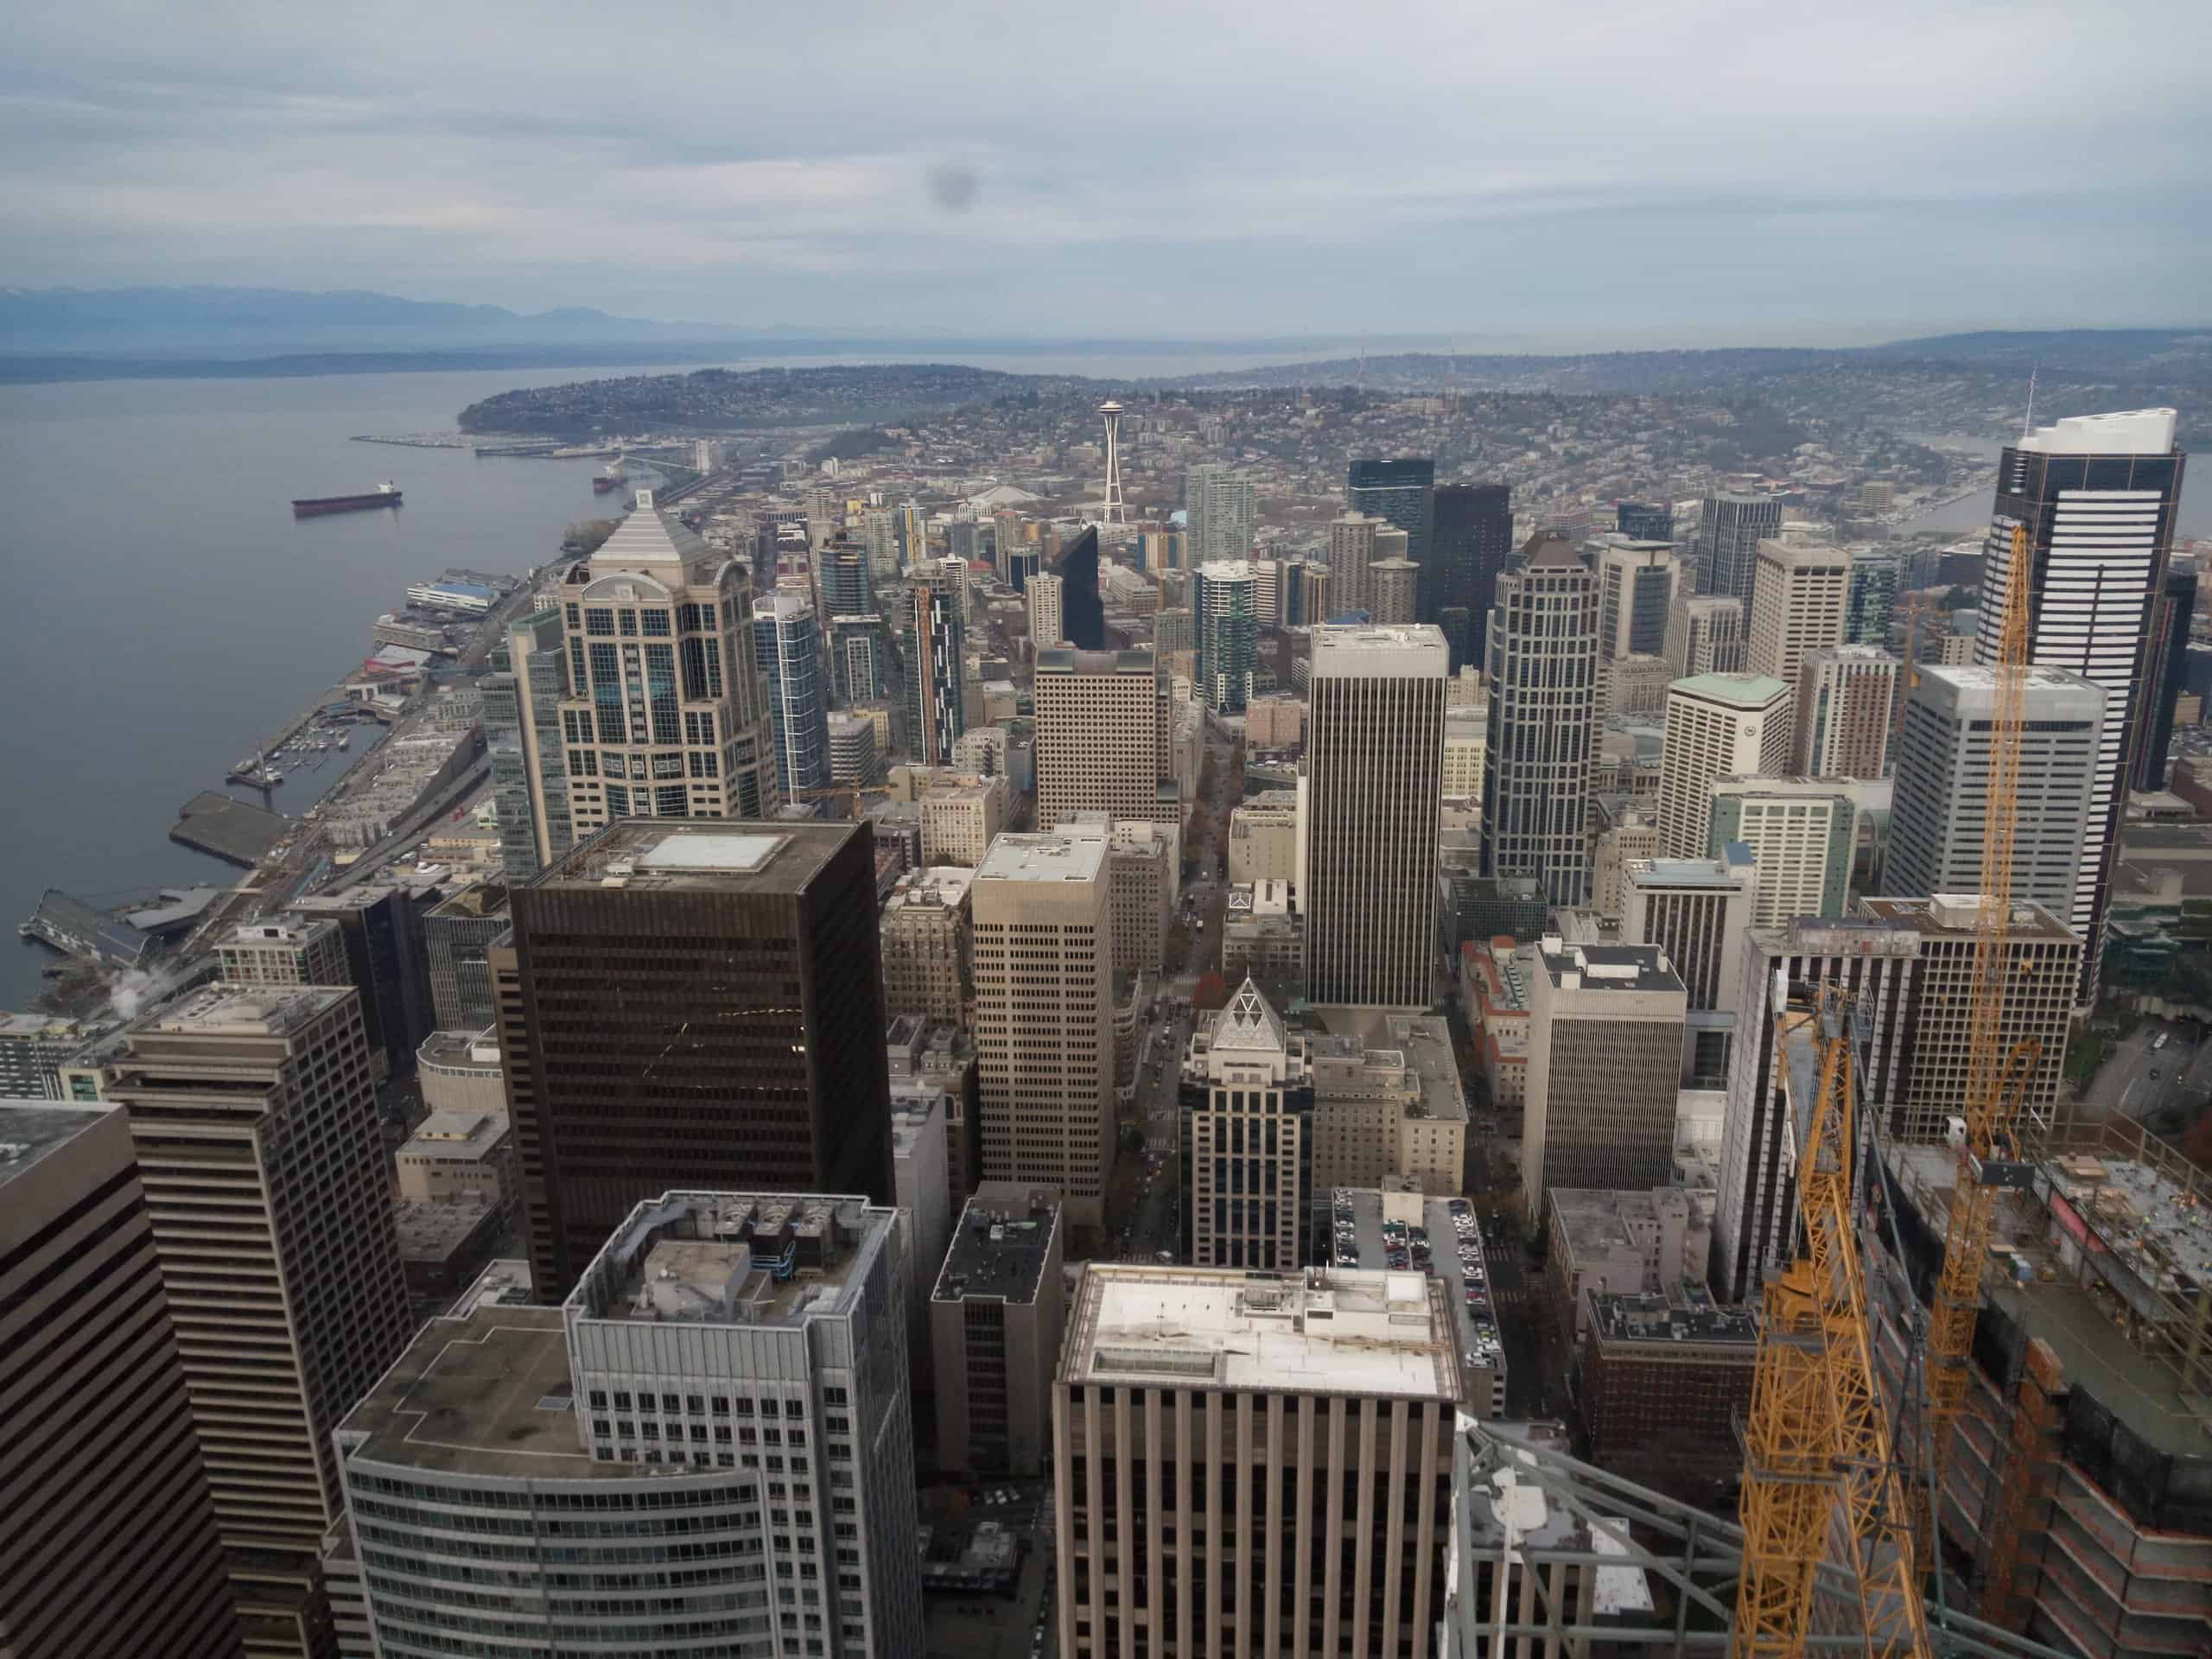
- Time lost to congestion in 2024: 63 hours per driver (+9.0% from 2023)
- Average downtown speed during peak hours in 2024: 18 miles per hour
- Vehicles per capita: 860 cars per 1,000 inhabitants
- Share of trips taken by private vehicle: 68%
- City population: 753,675XXX
22. Washington, D.C., USA

- Time lost to congestion in 2024: 62 hours per driver (+-2.0% from 2023)
- Average downtown speed during peak hours in 2024: 12 miles per hour
- Vehicles per capita: 860 cars per 1,000 inhabitants
- Share of trips taken by private vehicle: 71%
- City population: 705,749XXX
21. Melbourne, Australia

- Time lost to congestion in 2024: 65 hours per driver (+5.0% from 2023)
- Average downtown speed during peak hours in 2024: 18 miles per hour
- Vehicles per capita: 737 cars per 1,000 inhabitants
- Share of trips taken by private vehicle: 81%
- City population: 5.1 million
20. Warsaw, Poland

- Time lost to congestion in 2024: 70 hours per driver (+15.0% from 2023)
- Average downtown speed during peak hours in 2024: 17 miles per hour
- Vehicles per capita: 599 cars per 1,000 inhabitants
- Share of trips taken by private vehicle: 32%
- City population: 1.8 million
19. Atlanta, USA
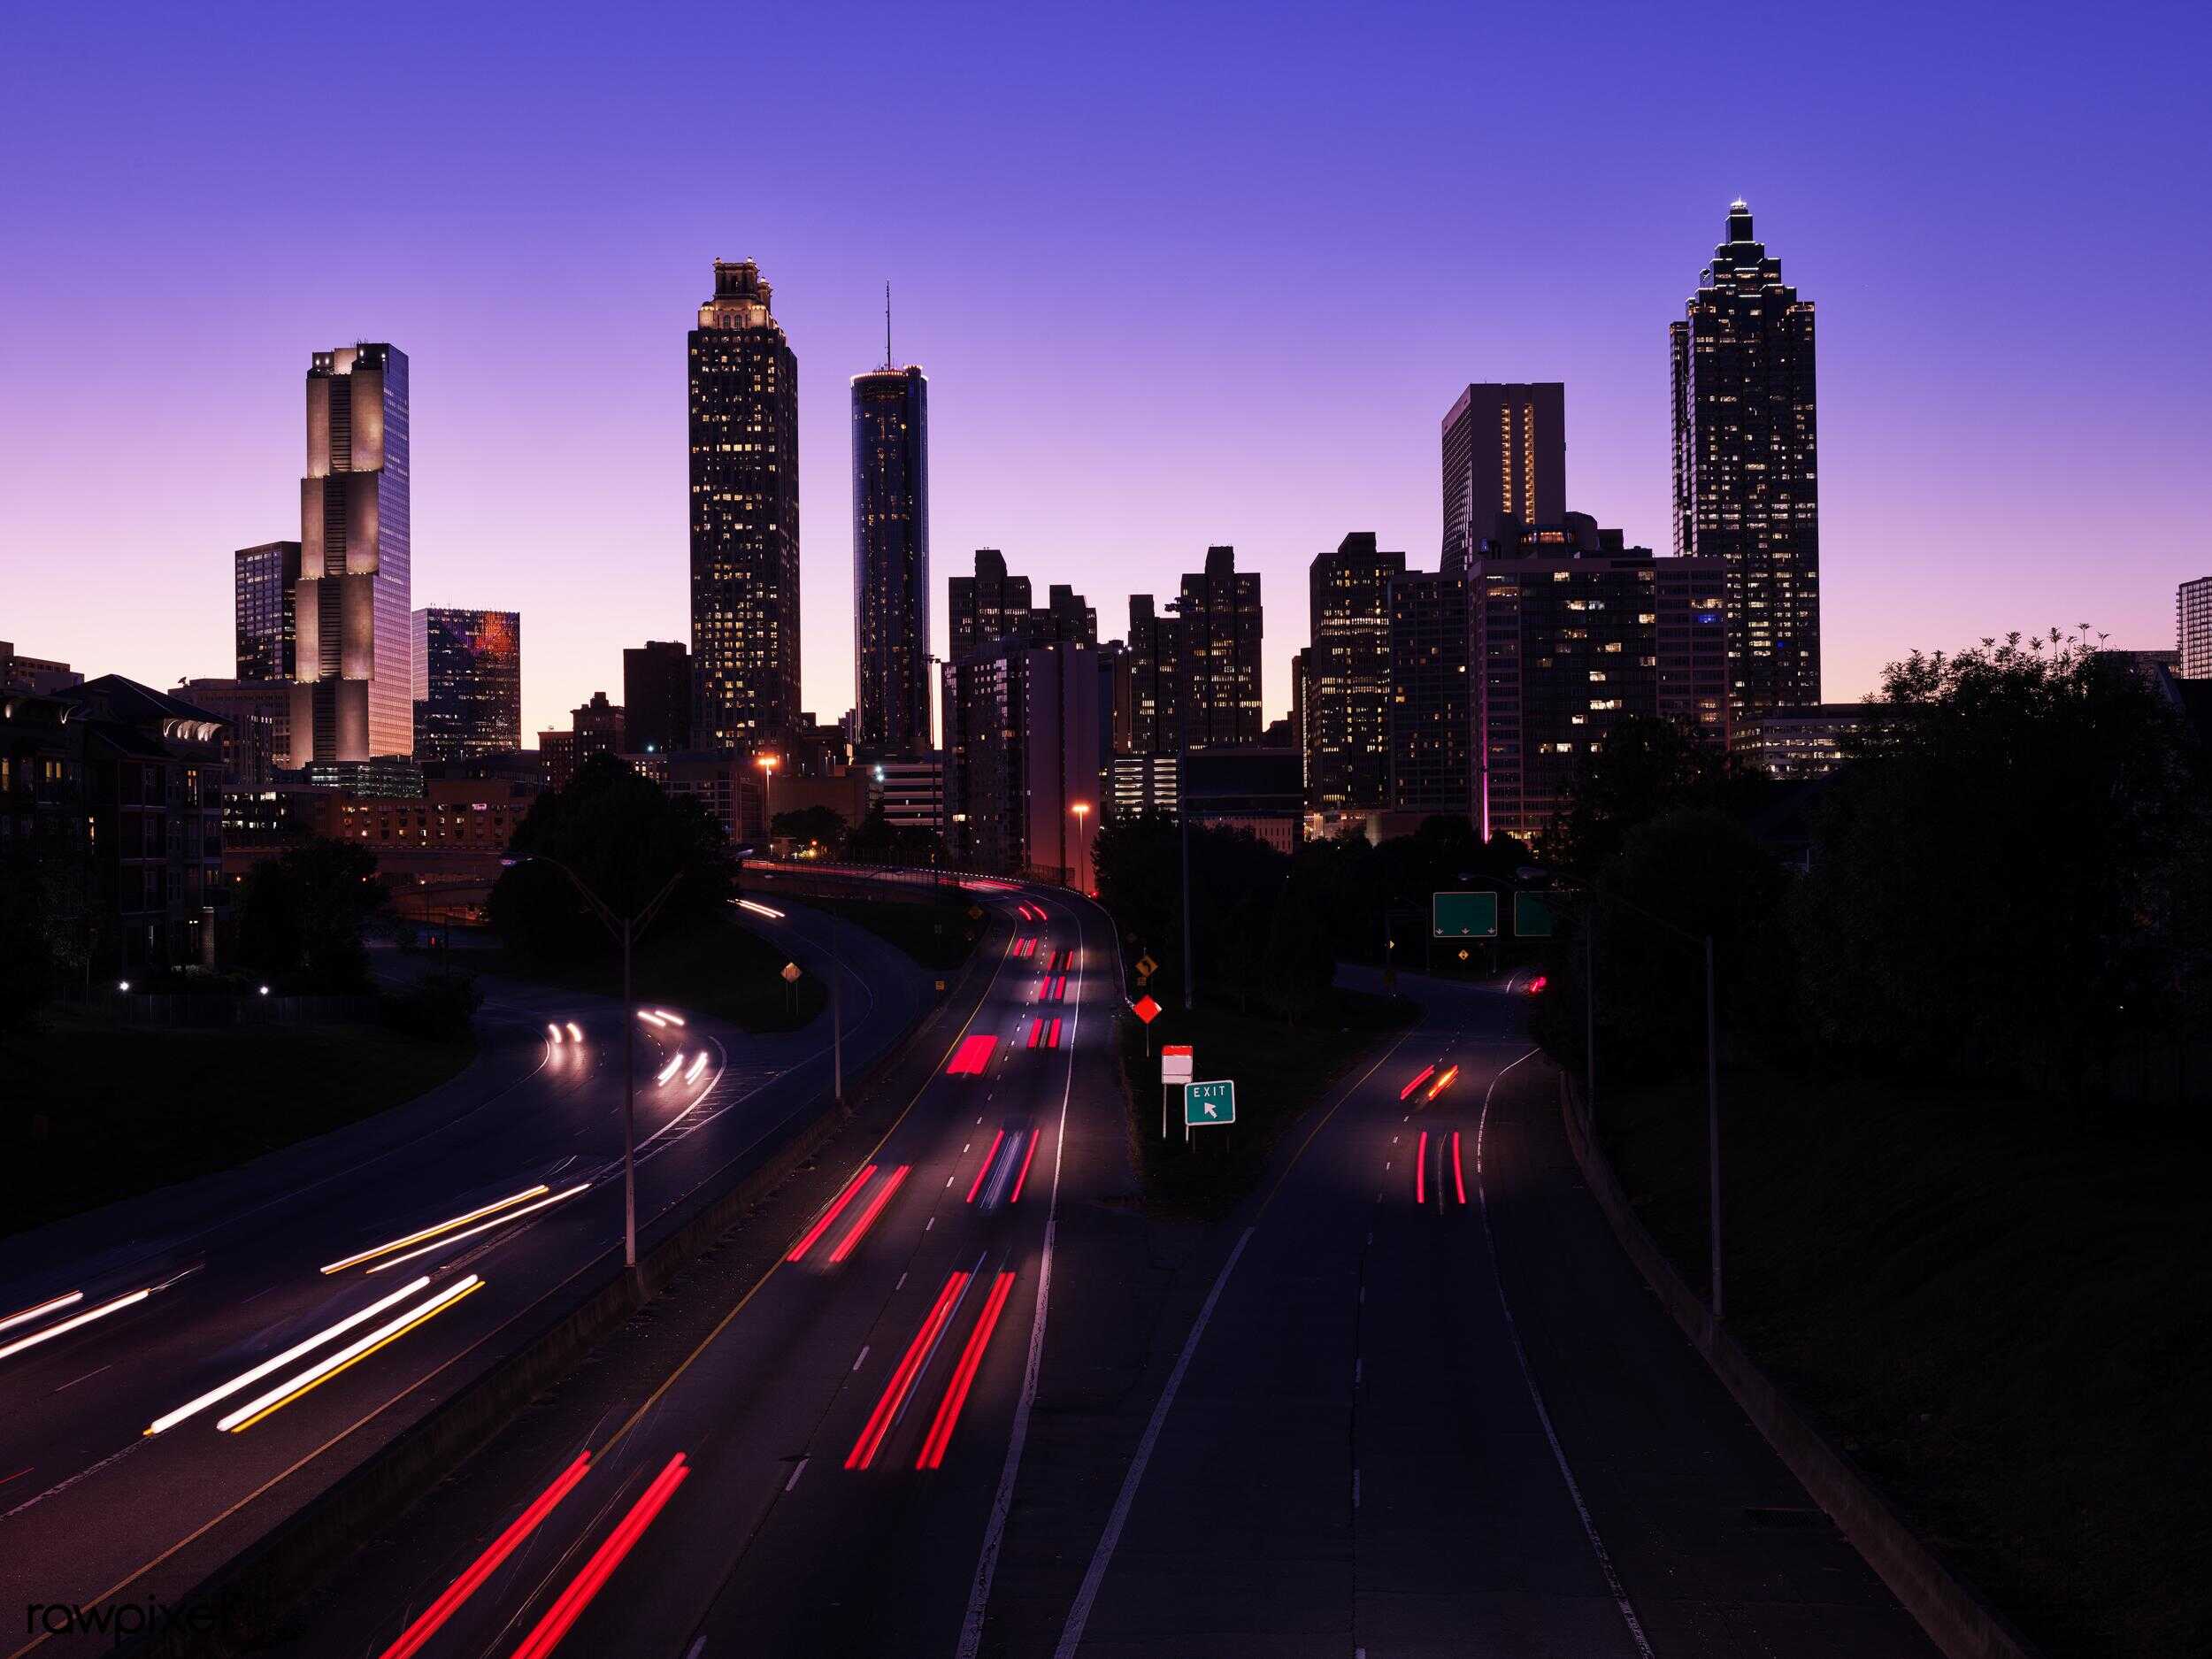
- Time lost to congestion in 2024: 65 hours per driver (+7.0% from 2023)
- Average downtown speed during peak hours in 2024: 18 miles per hour
- Vehicles per capita: 860 cars per 1,000 inhabitants
- Share of trips taken by private vehicle: 86%
- City population: 506,811XXX
18. Brussels, Belgium

- Time lost to congestion in 2024: 74 hours per driver (+9.0% from 2023)
- Average downtown speed during peak hours in 2024: 12 miles per hour
- Vehicles per capita: 590 cars per 1,000 inhabitants
- Share of trips taken by private vehicle: 29%
- City population: 1.2 million
17. Houston, USA

- Time lost to congestion in 2024: 66 hours per driver (+6.0% from 2023)
- Average downtown speed during peak hours in 2024: 17 miles per hour
- Vehicles per capita: 860 cars per 1,000 inhabitants
- Share of trips taken by private vehicle: 91%
- City population: 2.3 million
16. Rome, Italy

- Time lost to congestion in 2024: 71 hours per driver (+3.0% from 2023)
- Average downtown speed during peak hours in 2024: 15 miles per hour
- Vehicles per capita: 756 cars per 1,000 inhabitants
- Share of trips taken by private vehicle: 67%
- City population: 2.9 million
15. Dublin, Ireland

- Time lost to congestion in 2024: 81 hours per driver (+13.0% from 2023)
- Average downtown speed during peak hours in 2024: 15 miles per hour
- Vehicles per capita: 540 cars per 1,000 inhabitants
- Share of trips taken by private vehicle: 55%
- City population: 1.3 million
14. Miami, USA
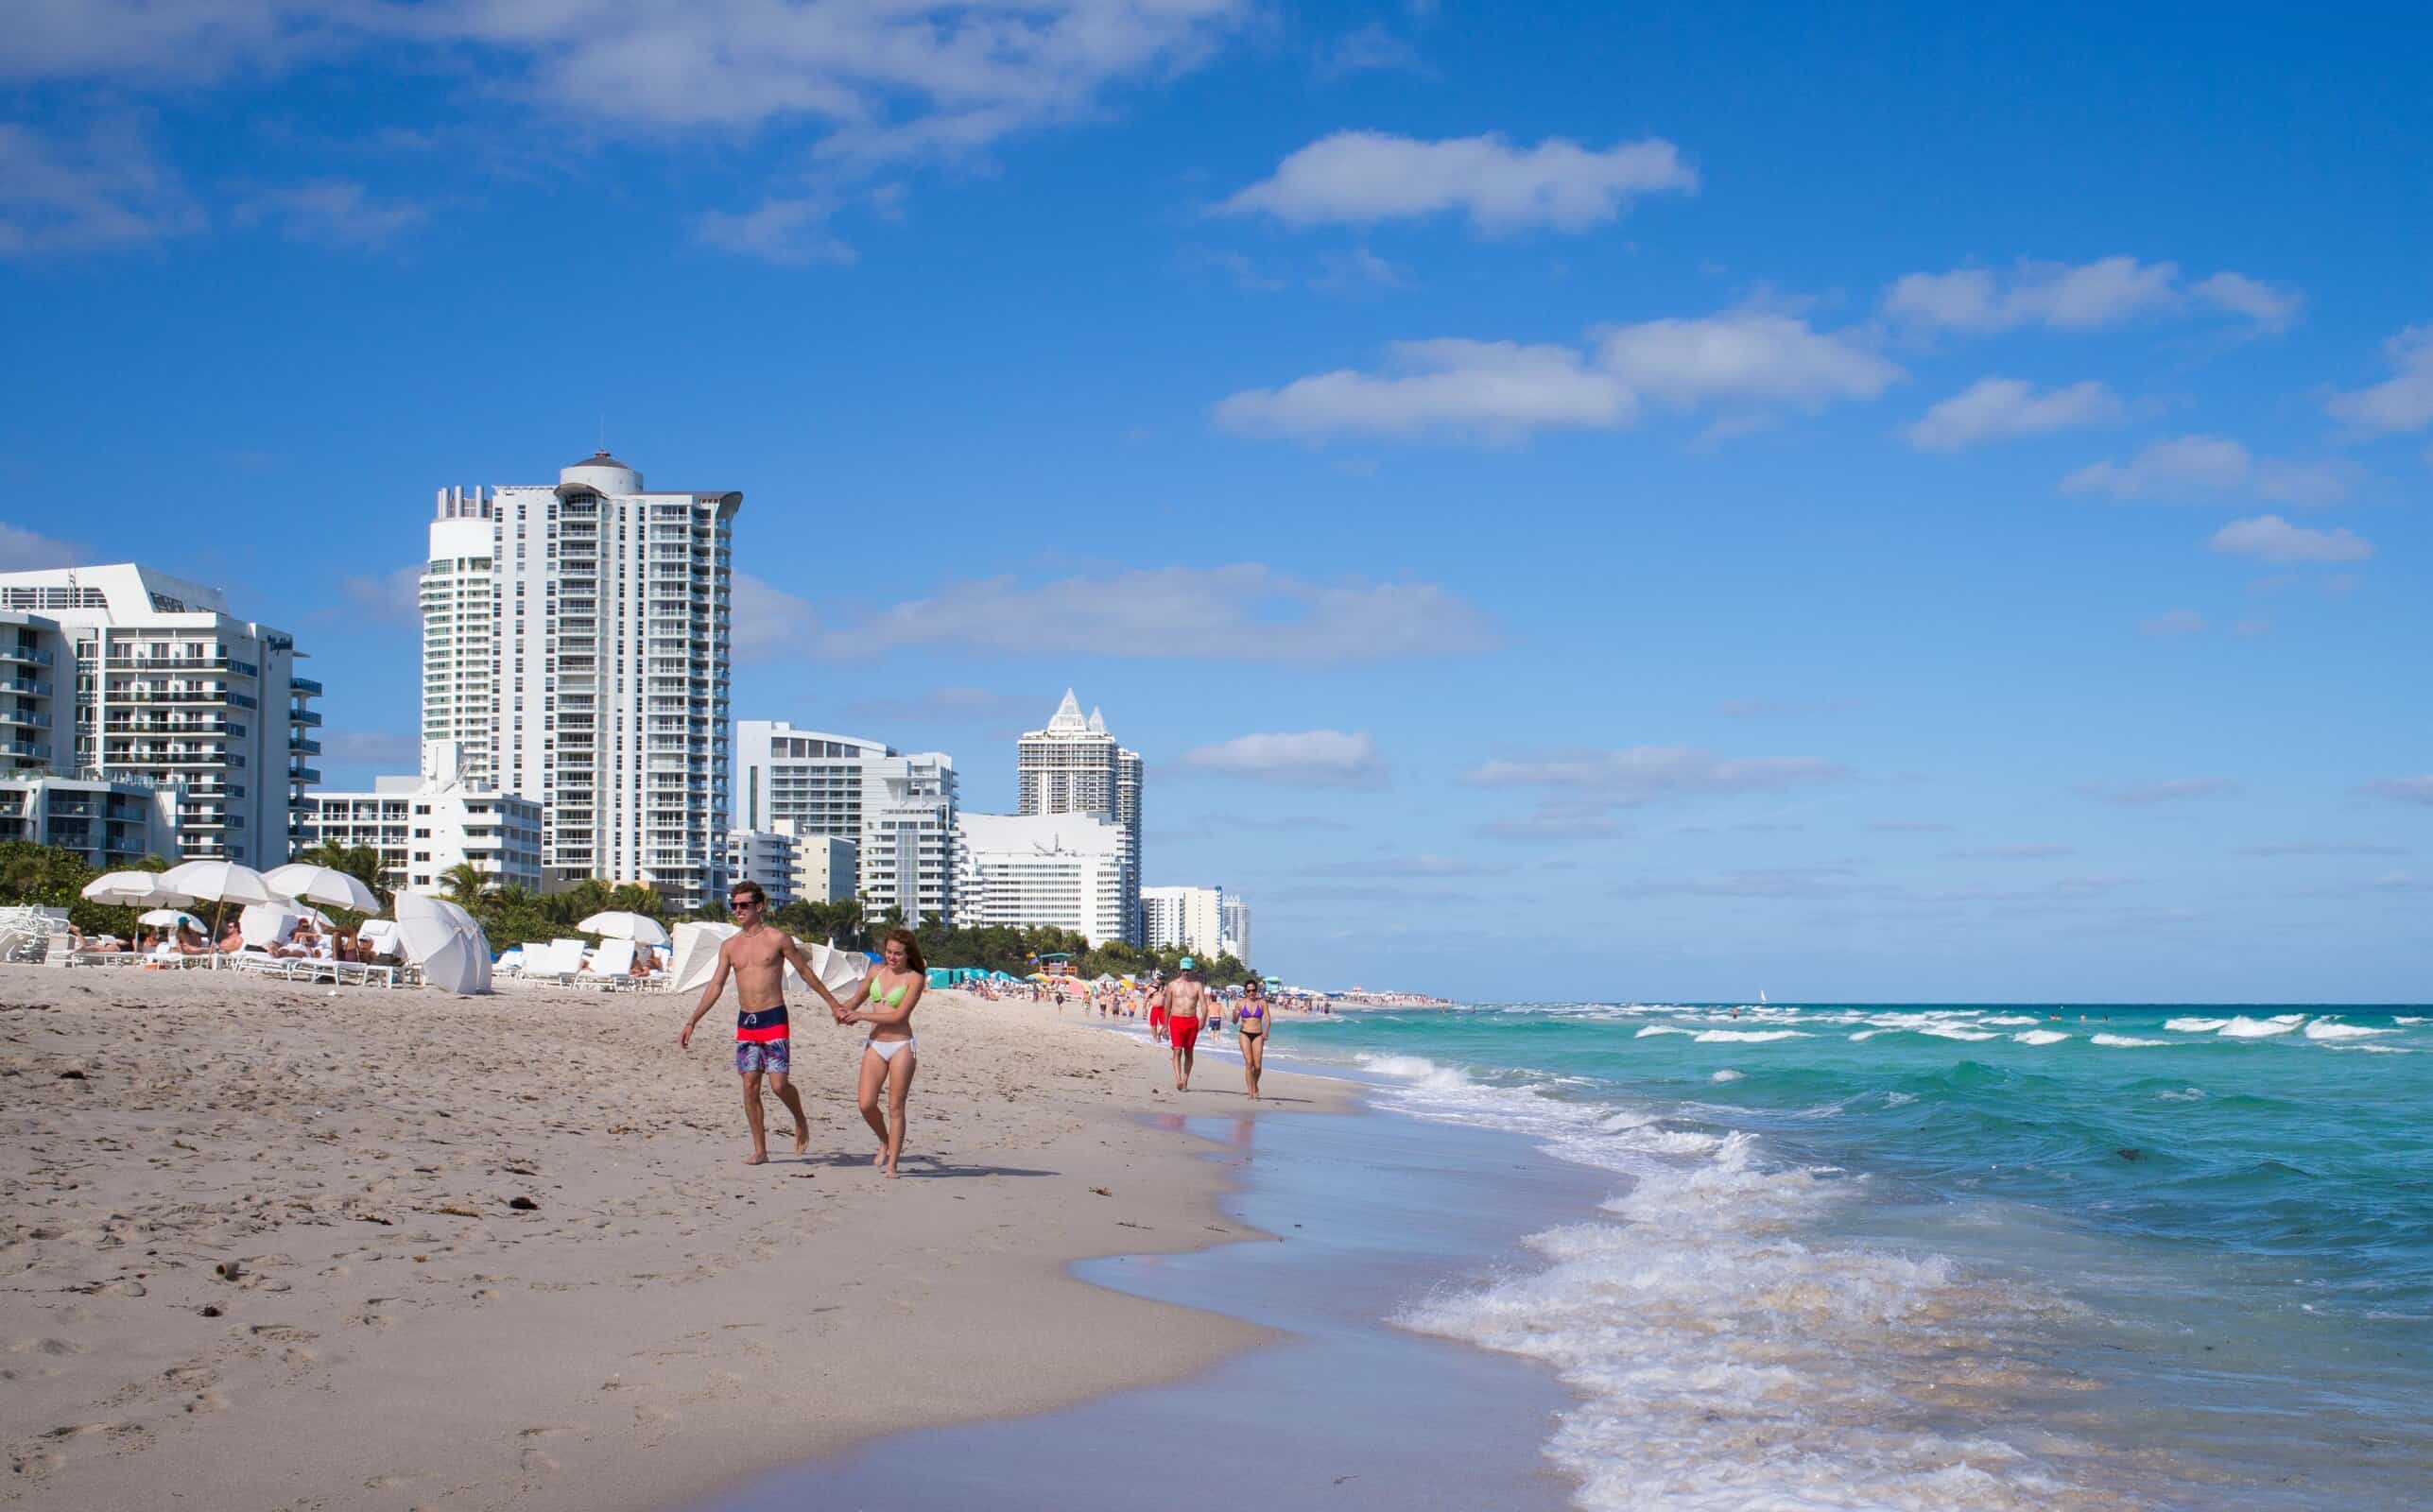
- Time lost to congestion in 2024: 74 hours per driver (+6.0% from 2023)
- Average downtown speed during peak hours in 2024: 20 miles per hour
- Vehicles per capita: 860 cars per 1,000 inhabitants
- Share of trips taken by private vehicle: 91%
- City population: 467,963XXX
13. Philadelphia, USA
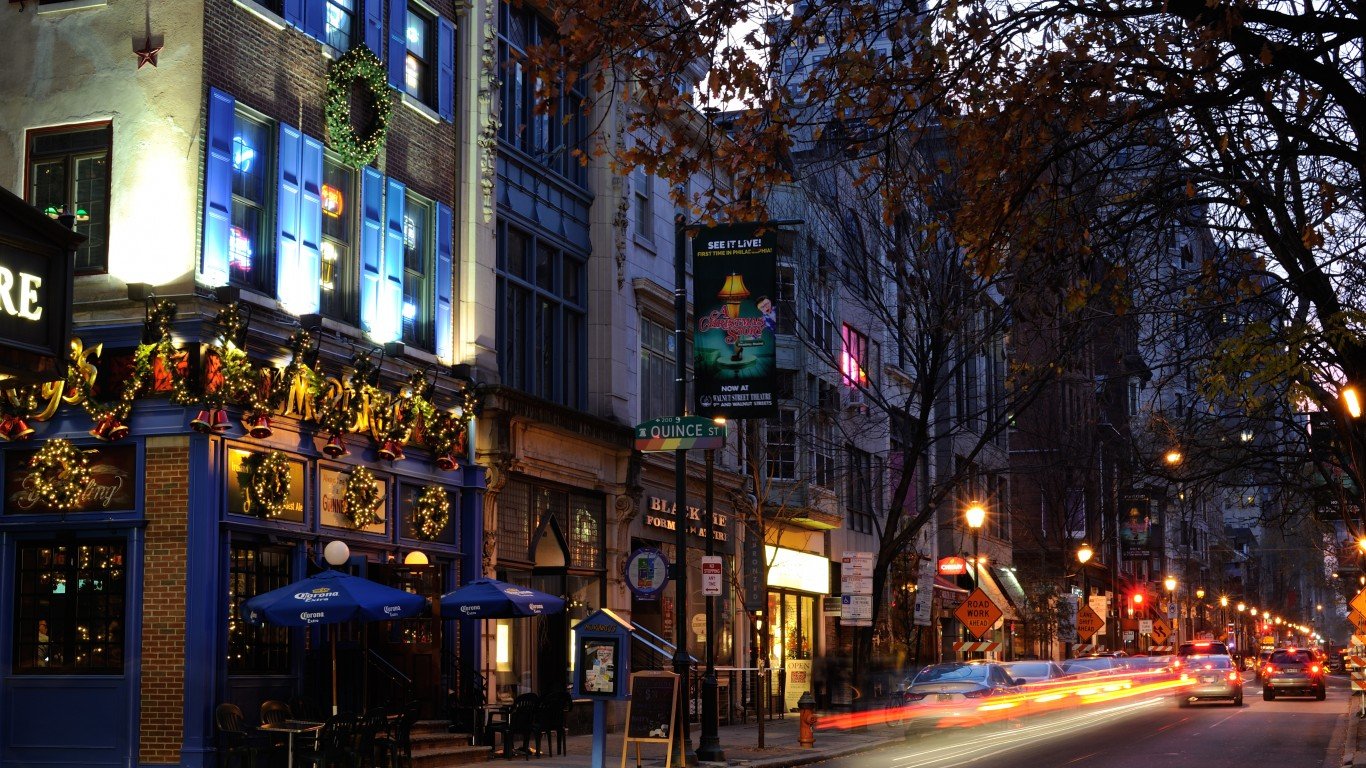
- Time lost to congestion in 2024: 77 hours per driver (+12.0% from 2023)
- Average downtown speed during peak hours in 2024: 14 miles per hour
- Vehicles per capita: 860 cars per 1,000 inhabitants
- Share of trips taken by private vehicle: 84%
- City population: 1.6 million
12. Boston, USA

- Time lost to congestion in 2024: 79 hours per driver (+-10.0% from 2023)
- Average downtown speed during peak hours in 2024: 13 miles per hour
- Vehicles per capita: 860 cars per 1,000 inhabitants
- Share of trips taken by private vehicle: 73%
- City population: 692,600XXX
11. Bangkok, Thailand

- Time lost to congestion in 2024: 74 hours per driver (+17.0% from 2023)
- Average downtown speed during peak hours in 2024: 16 miles per hour
- Vehicles per capita: 300 cars per 1,000 inhabitants
- Share of trips taken by private vehicle: 50%
- City population: 10.5 million
10. Brisbane, Australia

- Time lost to congestion in 2024: 84 hours per driver (+14.0% from 2023)
- Average downtown speed during peak hours in 2024: 21 miles per hour
- Vehicles per capita: 737 cars per 1,000 inhabitants
- Share of trips taken by private vehicle: 81%
- City population: 2.2 million
9. Cape Town, South Africa
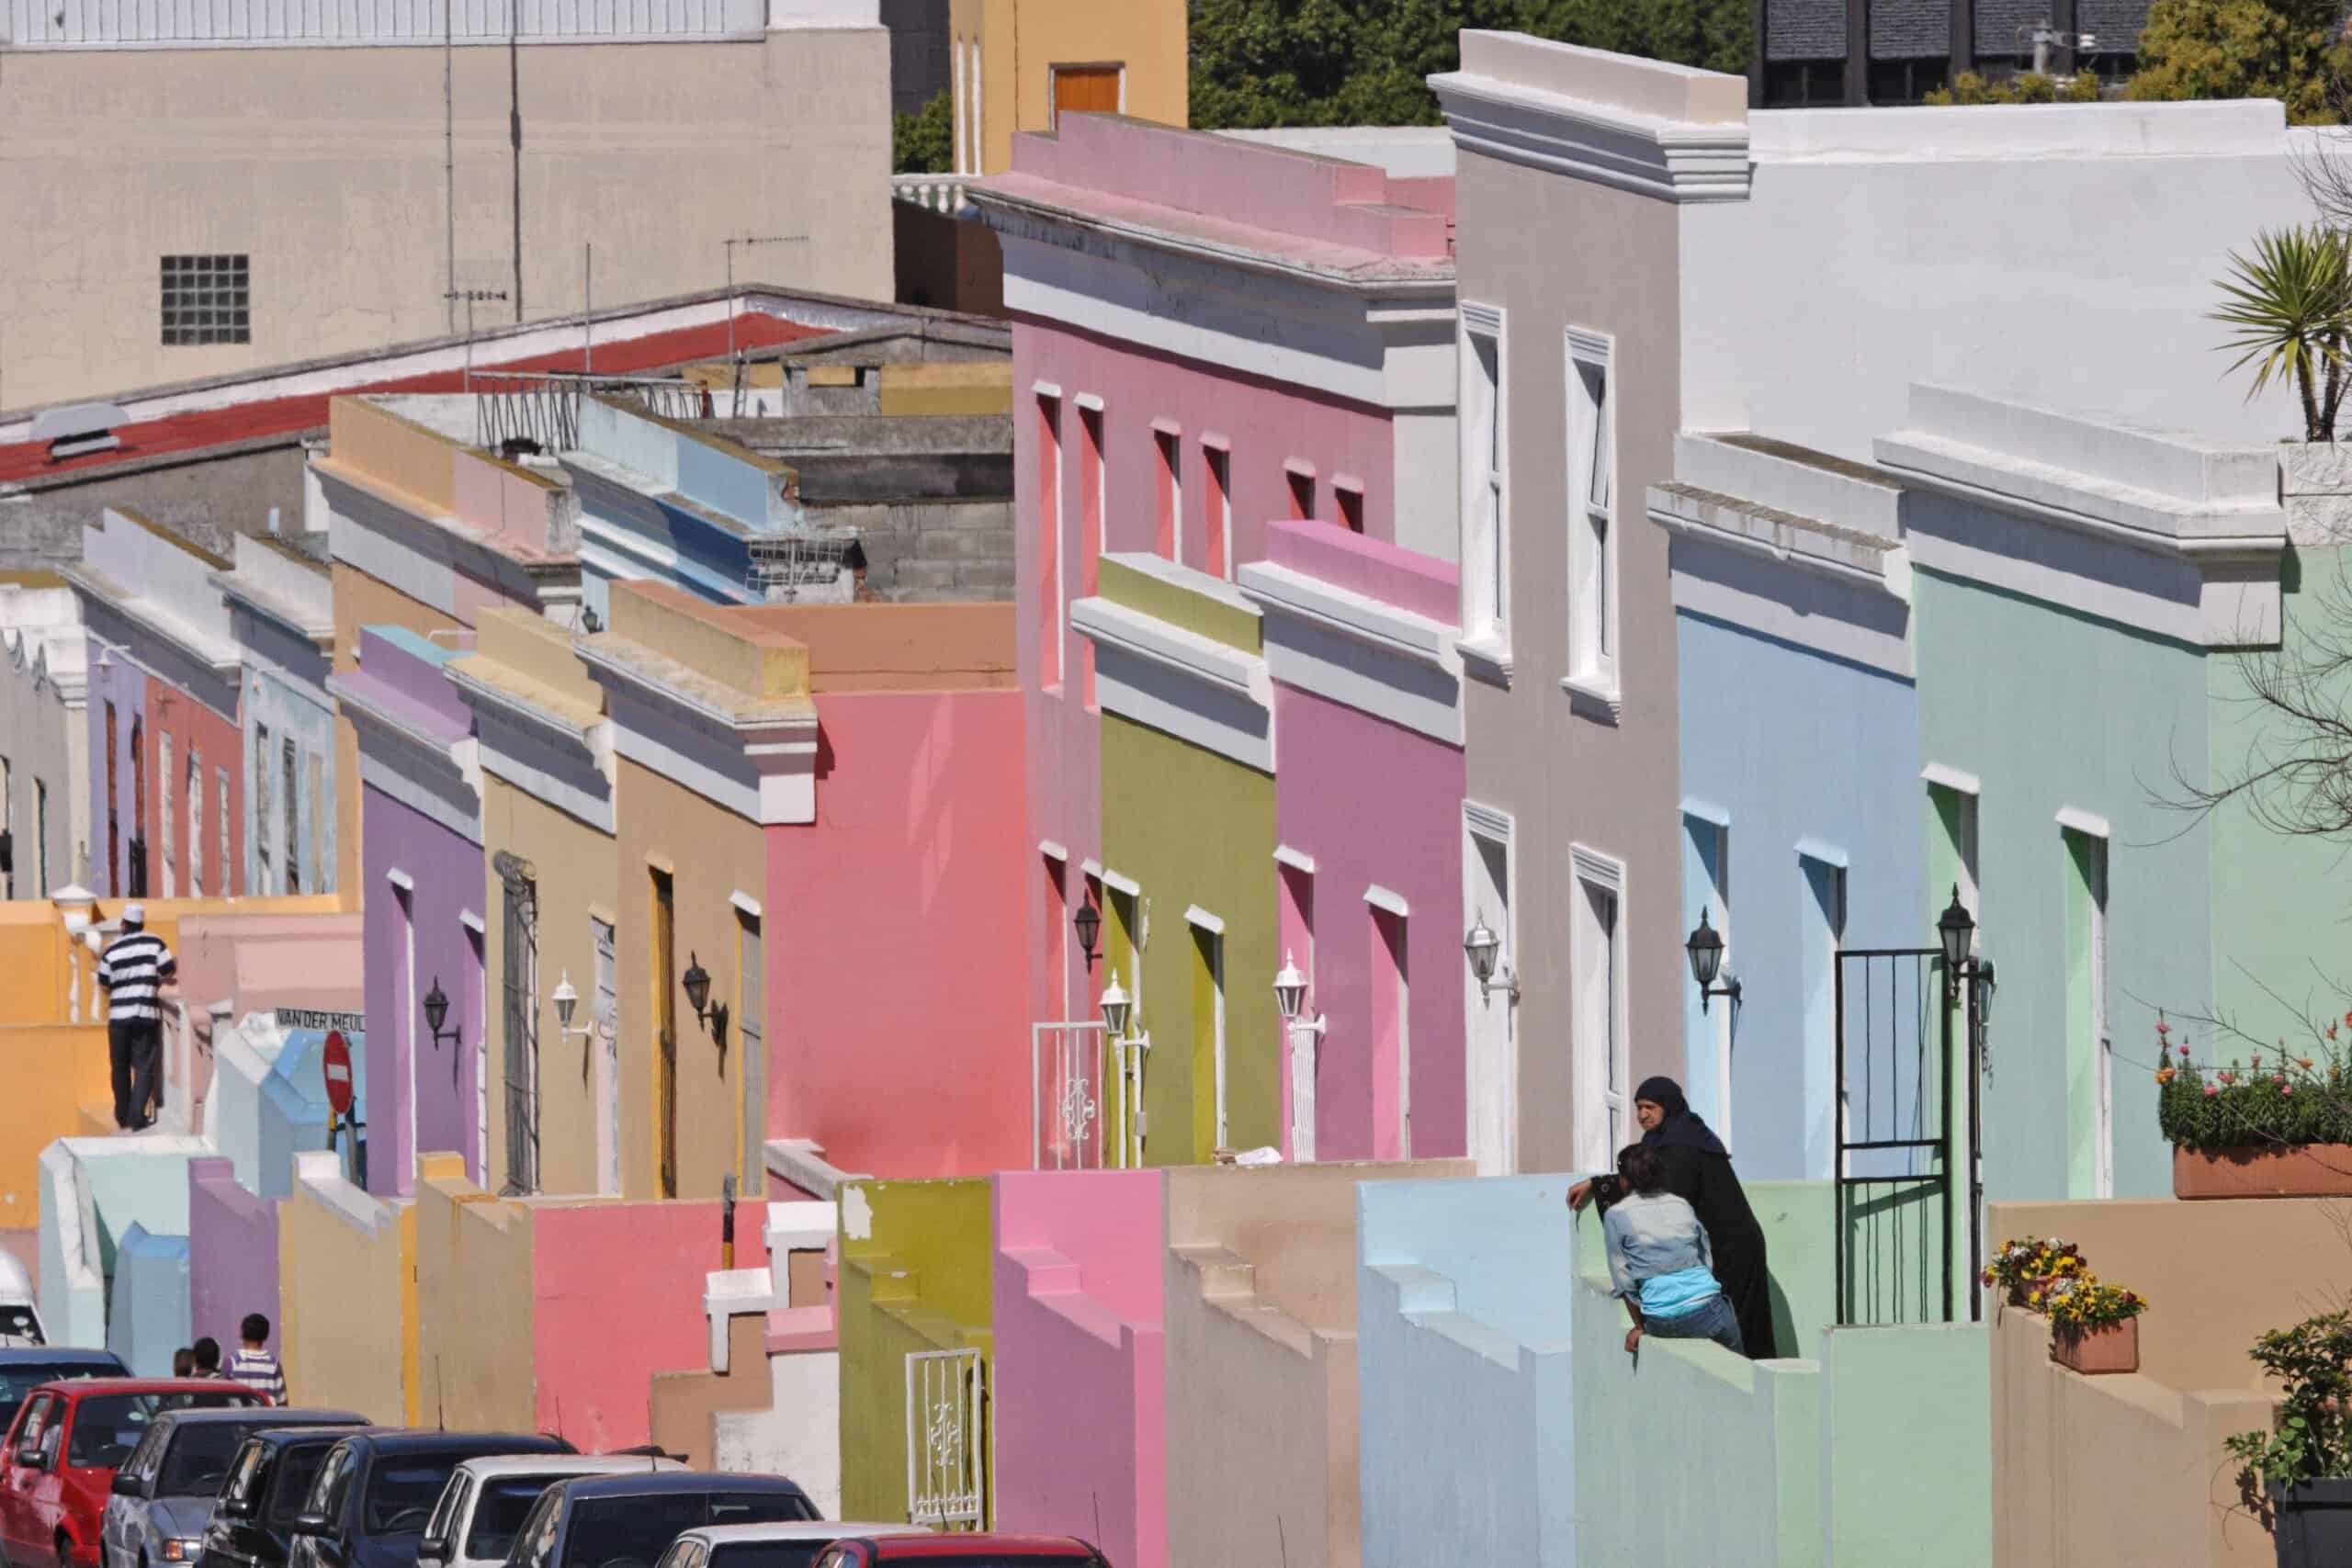
- Time lost to congestion in 2024: 94 hours per driver (+13.0% from 2023)
- Average downtown speed during peak hours in 2024: 14 miles per hour
- Vehicles per capita: 180 cars per 1,000 inhabitants
- Share of trips taken by private vehicle: 59%
- City population: 4.6 million
8. Los Angeles, USA
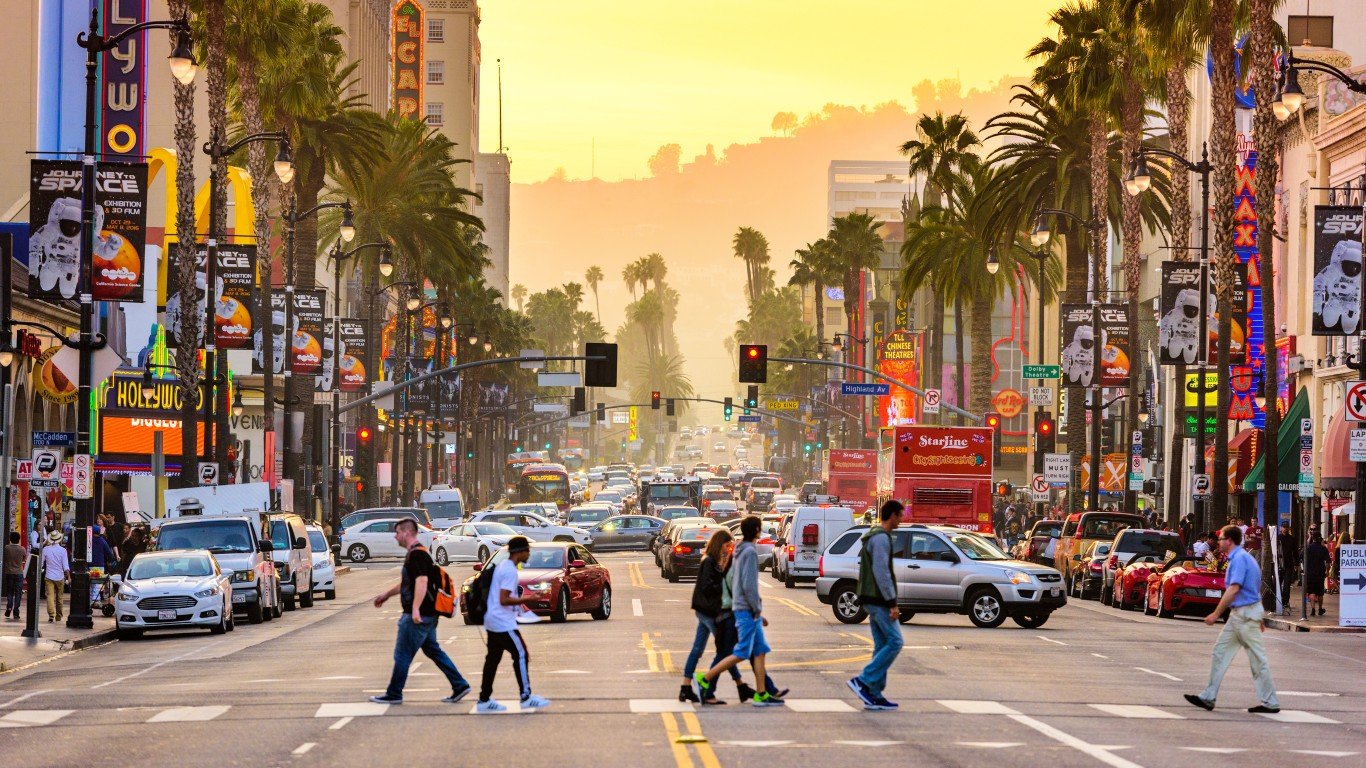
- Time lost to congestion in 2024: 88 hours per driver (+-1.0% from 2023)
- Average downtown speed during peak hours in 2024: 22 miles per hour
- Vehicles per capita: 860 cars per 1,000 inhabitants
- Share of trips taken by private vehicle: 83%
- City population: 4.0 million
7. Jakarta, Indonesia
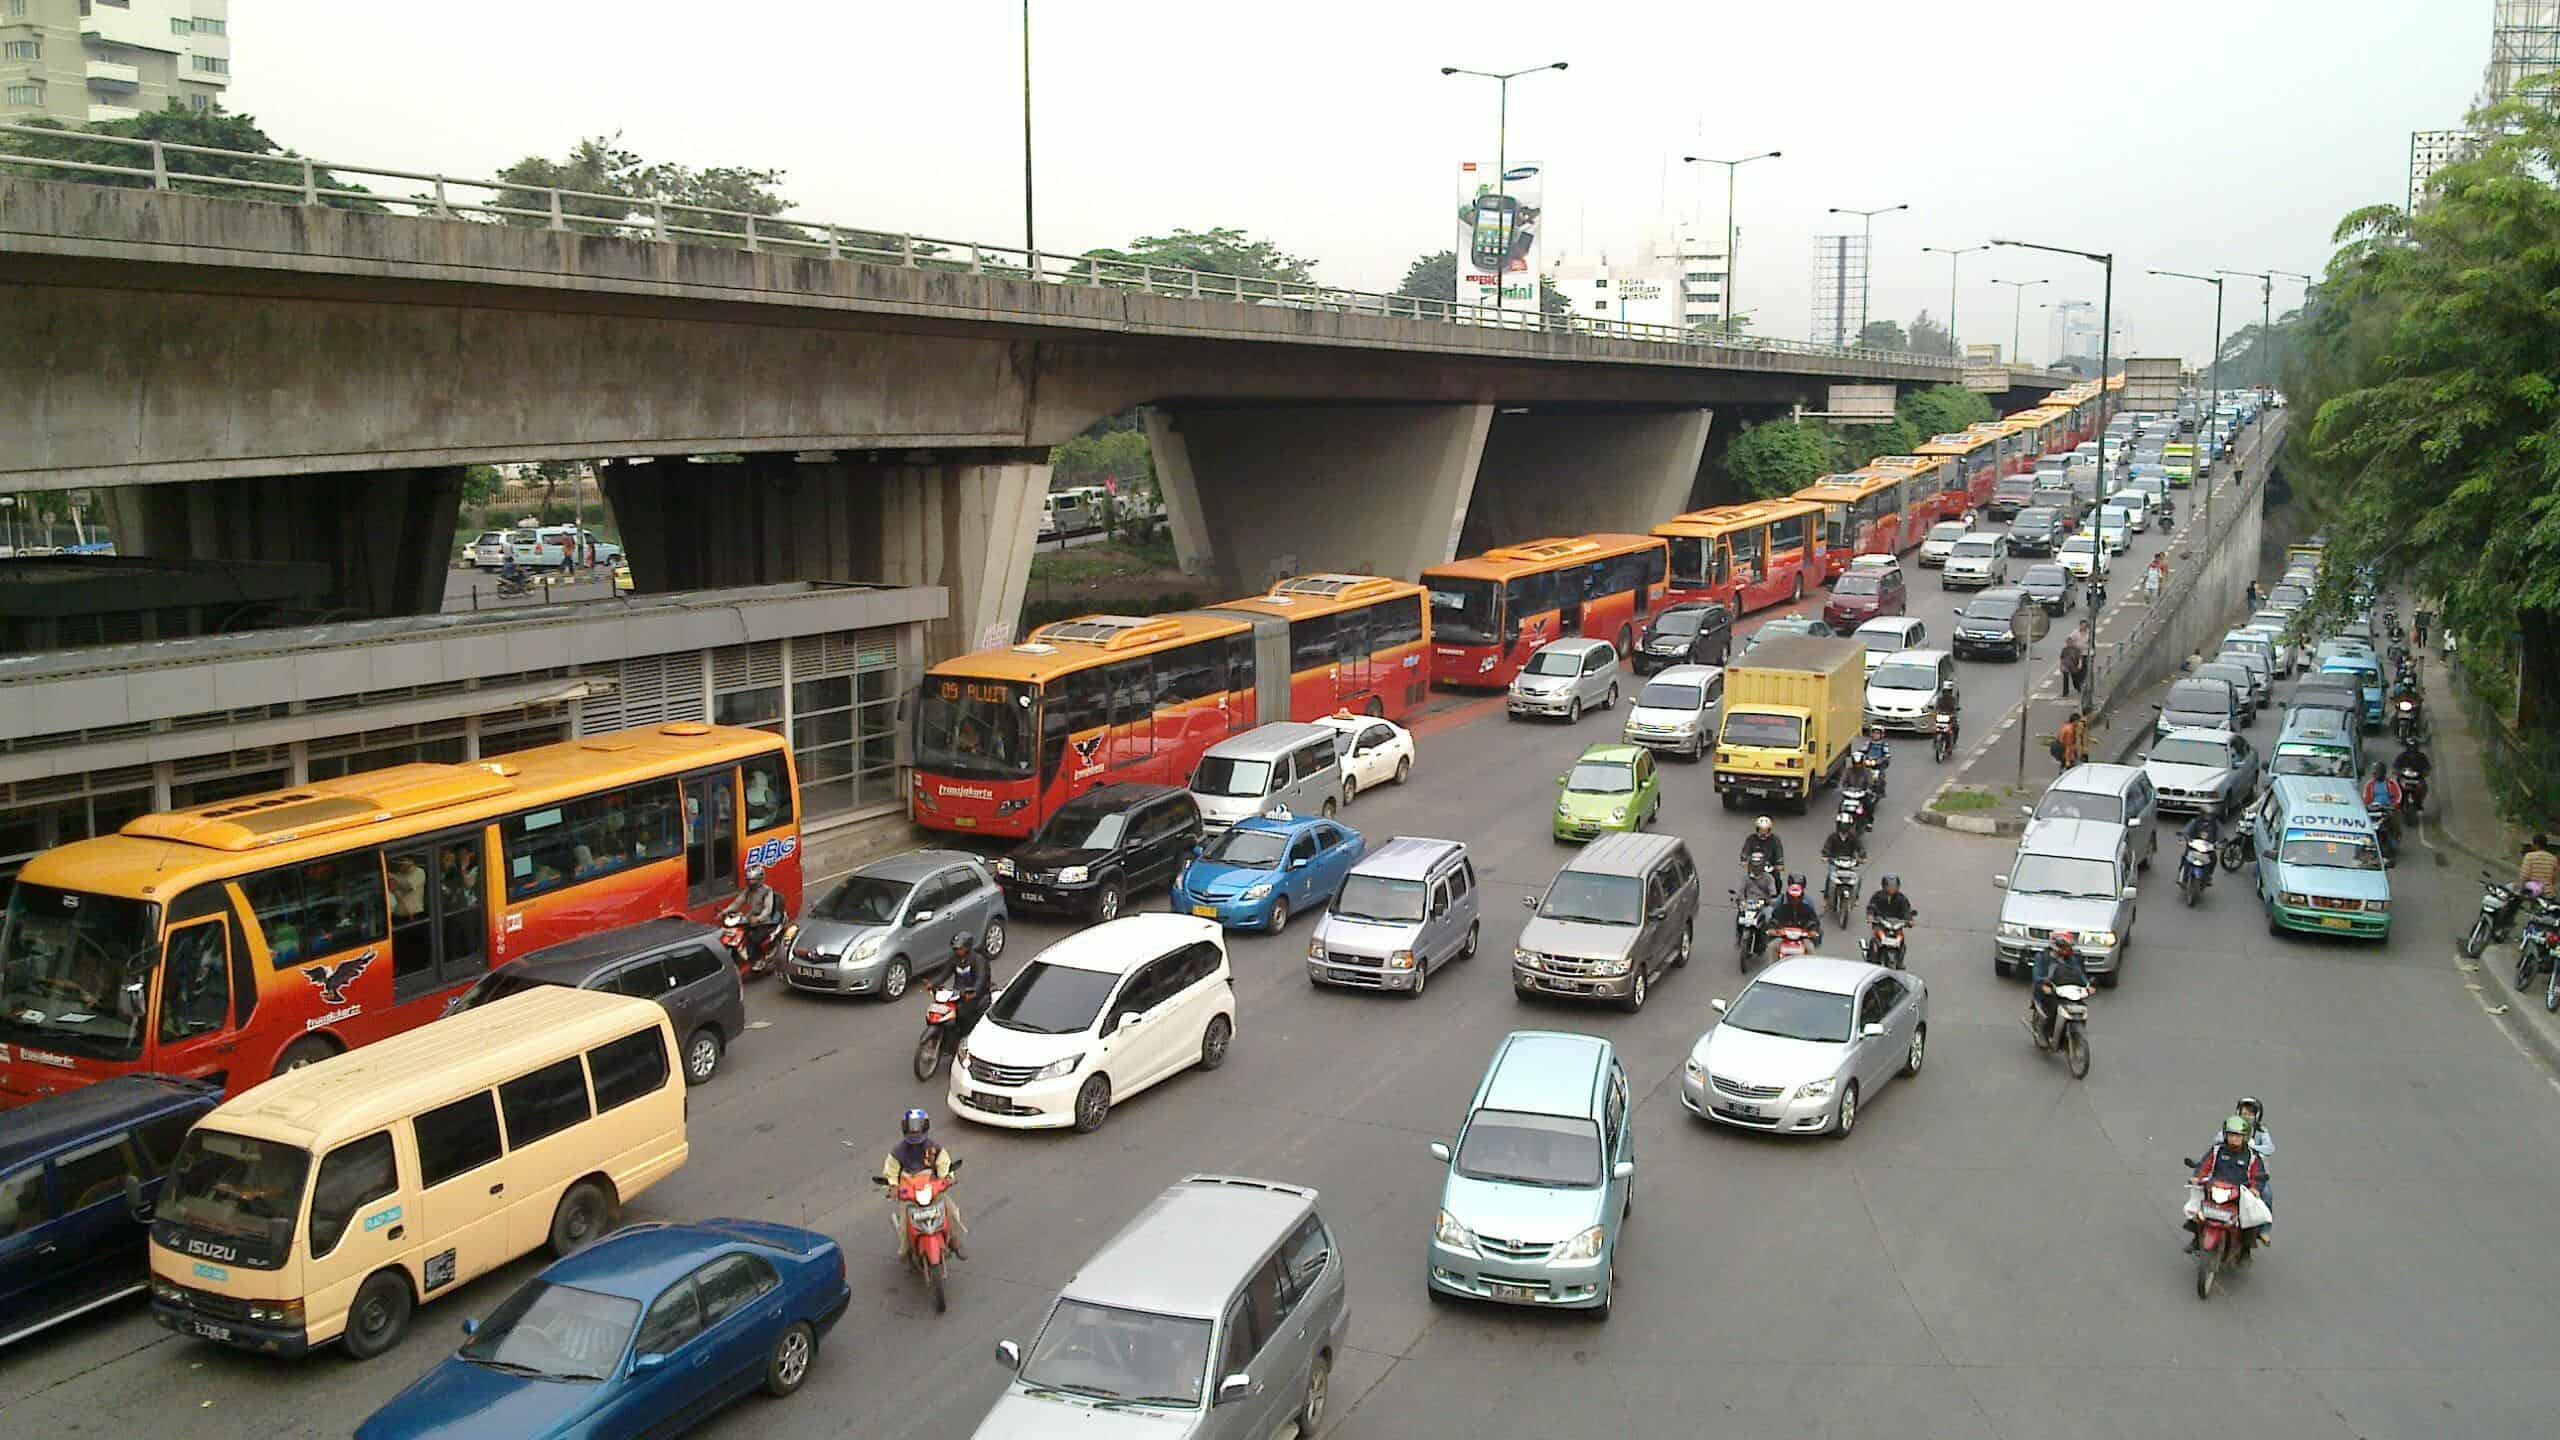
- Time lost to congestion in 2024: 89 hours per driver (+37.0% from 2023)
- Average downtown speed during peak hours in 2024: 13 miles per hour
- Vehicles per capita: 77 cars per 1,000 inhabitants
- Share of trips taken by private vehicle: 21%
- City population: 10.8 million
6. Paris, France

- Time lost to congestion in 2024: 97 hours per driver (+0.0% from 2023)
- Average downtown speed during peak hours in 2024: 13 miles per hour
- Vehicles per capita: 704 cars per 1,000 inhabitants
- Share of trips taken by private vehicle: 26%
- City population: 2.1 million
5. London, United Kingdom

- Time lost to congestion in 2024: 101 hours per driver (+2.0% from 2023)
- Average downtown speed during peak hours in 2024: 13 miles per hour
- Vehicles per capita: 632 cars per 1,000 inhabitants
- Share of trips taken by private vehicle: 66%
- City population: 9.0 million
4. Mexico City, Mexico

- Time lost to congestion in 2024: 97 hours per driver (+1.0% from 2023)
- Average downtown speed during peak hours in 2024: 13 miles per hour
- Vehicles per capita: 275 cars per 1,000 inhabitants
- Share of trips taken by private vehicle: 22%
- City population: 9.2 million
3. Chicago, USA

- Time lost to congestion in 2024: 102 hours per driver (+6.0% from 2023)
- Average downtown speed during peak hours in 2024: 14 miles per hour
- Vehicles per capita: 860 cars per 1,000 inhabitants
- Share of trips taken by private vehicle: 79%
- City population: 2.7 million
2. New York City, USA

- Time lost to congestion in 2024: 102 hours per driver (+1.0% from 2023)
- Average downtown speed during peak hours in 2024: 13 miles per hour
- Vehicles per capita: 860 cars per 1,000 inhabitants
- Share of trips taken by private vehicle: 27%
- City population: 8.3 million
1. Istanbul, Turkey

- Time lost to congestion in 2024: 105 hours per driver (+15.0% from 2023)
- Average downtown speed during peak hours in 2024: 15 miles per hour
- Vehicles per capita: 157 cars per 1,000 inhabitants
- Share of trips taken by private vehicle: 27%
- City population: 15.8 million
The post Traffic Congestion Is Holding Back the Economy in These Massive Cities appeared first on 24/7 Wall St..