


This U.S. State Produces 11.5% of America’s Food
Agriculture is a major industry in the United States. According to the American Farm Bureau Federation, farm and ranch families comprise less than 2% of the country’s population. But on average, each farm feeds 169 people a year both in the U.S. and abroad, highlighting the importance of farm and agricultural commodities. However, as President […] The post This U.S. State Produces 11.5% of America’s Food appeared first on 24/7 Wall St..
Agriculture is a major industry in the United States. According to the American Farm Bureau Federation, farm and ranch families comprise less than 2% of the country’s population. But on average, each farm feeds 169 people a year both in the U.S. and abroad, highlighting the importance of farm and agricultural commodities. However, as President Donald Trump’s administration levied a 145% tariff against China, and was hit with a 125% tariff in response, farmers are becoming increasingly worried about the impact of the trade war on their products. The American Farm Bureau Federation states that 40% of food grown and produced in the United States is never eaten. With labor hardships and the destruction of trade relationships, farmers are concerned that their products will go to waste — and that families will struggle. John Pihl, a Northern Illinois farmer, has even said, “Mexico is our biggest importer of corn. But this time, they may figure out that they can get corn from South America just as easily as from the U.S.” (Here are the 12 biggest factors causing egg prices to soar.)
Illinois, where Pihl is farming, is known for its corn and soybean crops — both of which are going to be significantly affected by the trade war, especially considering that China is the largest importer of soybeans worldwide. But what other crops and farm commodities are being grown, produced, cultivated, and sold across the United States? Here, 24/7 Wall St. put together a comprehensive list of each state’s cash receipts by commodity to see which states are producing the most food in America. To do so, we used 2023 receipt data from the U.S. Department of Agriculture’s Economic Research Service. This is the most up-to-date data available at the time of writing. We excluded Alaska, Rhode Island, New Hampshire, Massachusetts, Hawaii, and Connecticut from the list as each state contributed 0.1% or less. However, if you’d like to learn more about those states specifically, you can head to the data to check it out. Supplemental information on major commodities came from several sources, including state agricultural departments and farm bureaus.
This previously published article was updated on April 14, 2025 to highlight the impact of the burgeoning trade war on U.S. farmers.
Why Conversations Around Food are More Important Than Ever
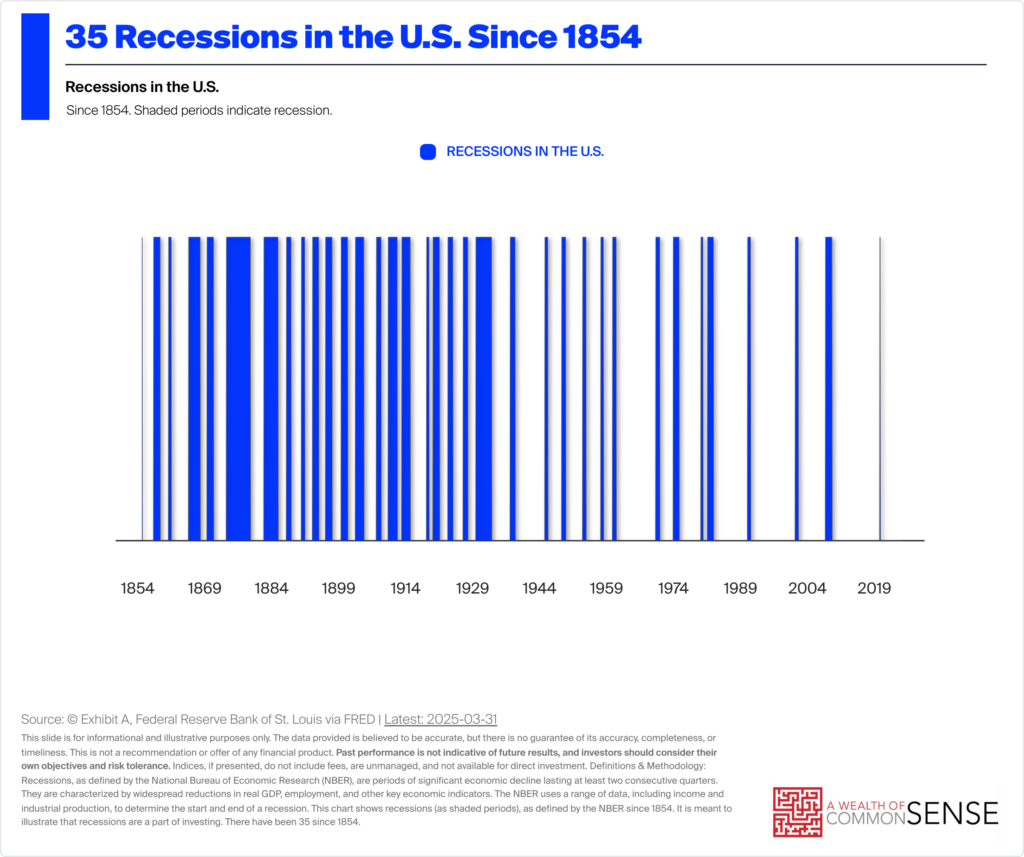
Food is life. And agriculture is the central force behind the food we eat, products we buy, and lives we sustain. With the ongoing trade war, as well as other factors like the devastation of bird flu and a lack of labor forces considering migrant worker fears of deportation, the agricultural industry in the U.S. is currently in an incredibly precarious position. Understanding where food is being produced across the country, and what commodities may be at risk, can help you prepare for a possible recession or stock up on food that may not be as easily accessible in the coming months to years. It also gives you a jumping off point to understand farming in your state — and perhaps motivate you to learn ways to support agricultural development.
Check out the top farm commodity-producing states across the U.S.:
44. Maine

- Annual Production: $872.6 million
- Percent of US total: 0.2%
- Major commodities: Potatoes, dairy, eggs, blueberries
43. Vermont

- Annual Production: $931 million
- Percent of US total: 0.2%
- Major commodities: Dairy, cattle/calves, maple syrup, apples
42. West Virginia

- Annual Production: $974.46 million
- Percent of US total: 0.2%
- Major commodities: Cattle, broiler chickens, soybeans, apples
41. Nevada

- Annual Production: $986.6 million
- Percent of US total: 0.2%
- Major commodities: Hay (alfalfa), potatoes, barley, wheat, oats
40. New Jersey

- Annual Production: $1.6 billion
- Percent of US total: 0.3%
- Major commodities: Blueberries, peaches, peppers, tomatoes, soybeans, asparagus
39. Delaware
- Annual Production: $1.84 billion
- Percent of US total: 0.4%
- Major commodities: Broilers, corn, wheat, peas, grapes, dairy
38. Wyoming

- Annual Production: $2.1 billion
- Percent of US total: 0.4%
- Major commodities: Cattle, beef, sugar beets, hay, livestock
37. Utah
- Annual Production: $2.45 billion
- Percent of US total: 0.5%
- Major commodities: Alfalfa hay, barley, cattle, cherries
36. Maryland
- Annual Production: $2.93 billion
- Percent of US total: 0.6%
- Major commodities: Broilers, corn, soybeans, dairy, grains, watermelon, floriculture
35. South Carolina

- Annual Production: $3.37 billion
- Percent of US total: 0.7%
- Major commodities: Broilers, turkeys, corn, cotton, cattle, soybeans, peanuts
34. New Mexico

- Annual Production: $3.98 billion
- Percent of US total: 0.8%
- Major commodities: Chili peppers, cattle, cotton, milk, pecans, onions
33. Louisiana

- Annual Production: $4.19 billion
- Percent of US total: 0.8%
- Major commodities: Sugarcane, cotton, soybeans, broilers, corn, rice, cattle
32. Virginia
- Annual Production: $4.76 billion
- Percent of US total: 0.9%
- Major commodities: Broilers, cattle/calves, miscellaneous crops, turkeys, dairy, corn, soybeans
31. Montana
- Annual Production: $4.96 billion
- Percent of US total: 1%
- Major commodities: Cattle, wheat, hay, barley, lentils, sugar beets
30. Tennessee

- Annual Production: $5.23 billion
- Percent of US total: 1%
- Major commodities: Soybeans, cattle, broilers, corn, wheat, hay, miscellaneous crops
29. Arizona
- Annual Production: $5.24 billion
- Percent of US total: 1%
- Major commodities: Cattle and calves, dairy, lettuce, hay, spinach, broccoli, cauliflower, dates
28. Oregon
- Annual Production: $6.5 billion
- Percent of US total: 1.3%
- Major commodities: Miscellaneous crops, hazelnut, grass seed, cattle, dairy, hay
27. New York

- Annual Production: $7.09 billion
- Percent of US total: 1.4%
- Major commodities: Dairy, corn, cattle, apples, floriculture, eggs, soybeans, hay
26. Mississippi

- Annual Production: $7.31 billion
- Percent of US total: 1.4%
- Major commodities: Poultry, forestry, catfish, miscellaneous crops, corn, cotton
25. Alabama
- Annual Production: $7.95 billion
- Percent of US total: 1.5%
- Major commodities: Broilers, cattle, eggs, miscellaneous crops, cotton, corn, soybeans, peanuts, catfish
24. Kentucky

- Annual Production: $8.05 billion
- Percent of US total: 1.6%
- Major commodities: Poultry, horses, hay, soybeans, cattle, corn
23. Pennsylvania

- Annual Production: $8.58 billion
- Percent of US total: 1.7%
- Major commodities: Dairy, eggs, livestock, mushrooms, corn
22. Oklahoma
- Annual Production: $8.63 billion
- Percent of US total: 1.7%
- Major commodities: Cattle, hogs, broilers, wheat, miscellaneous crops, hay, corn, dairy, peanuts
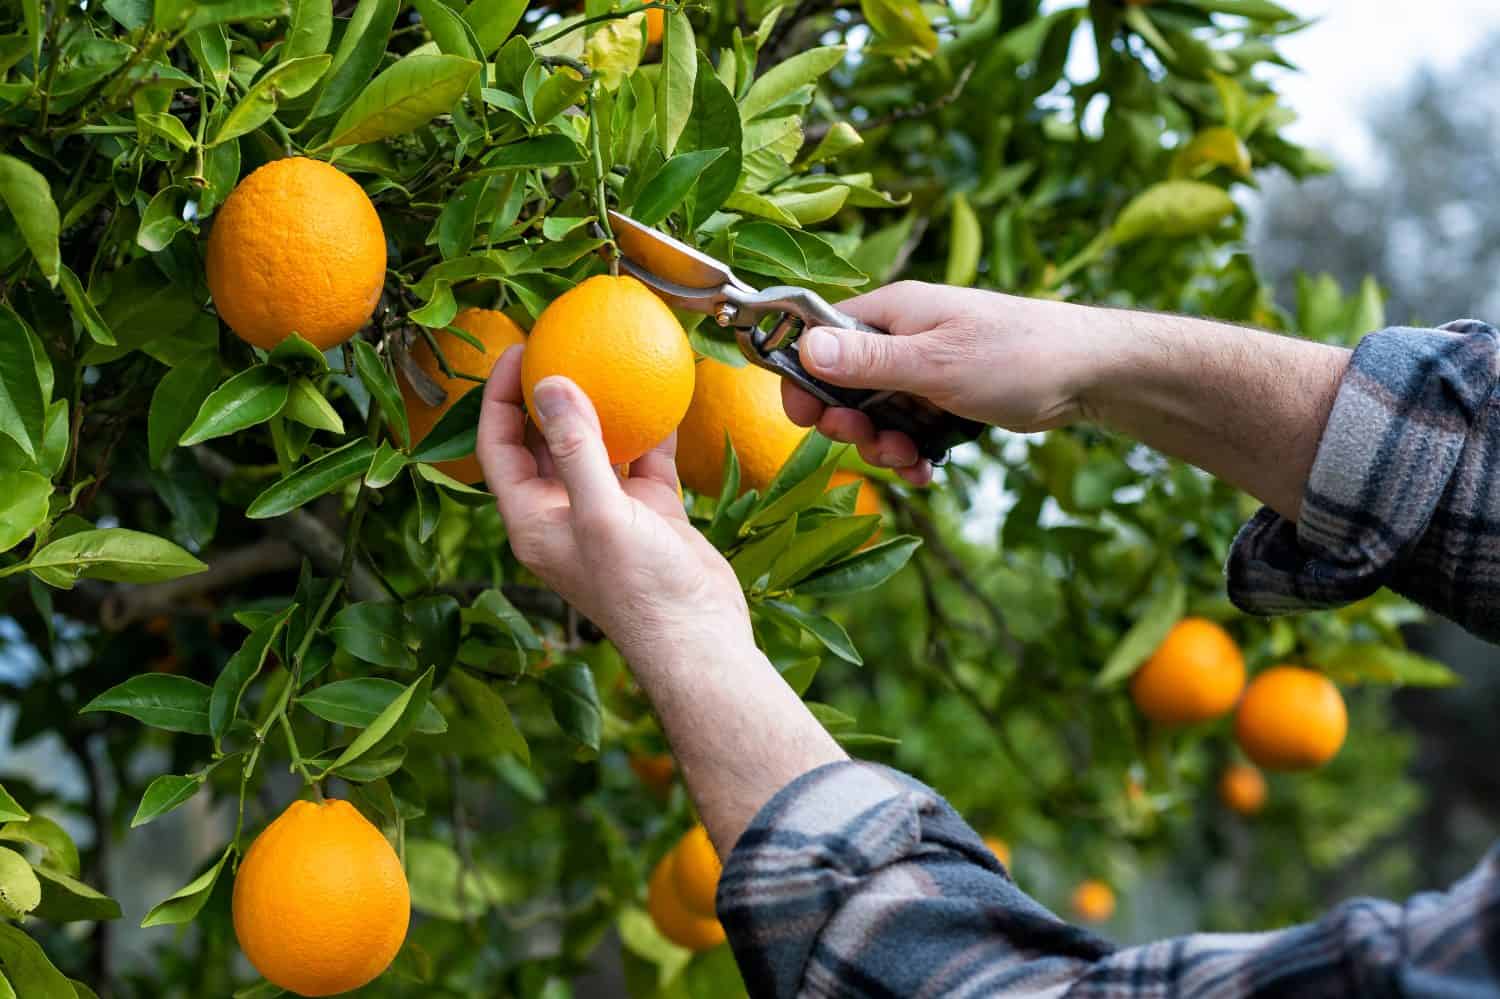
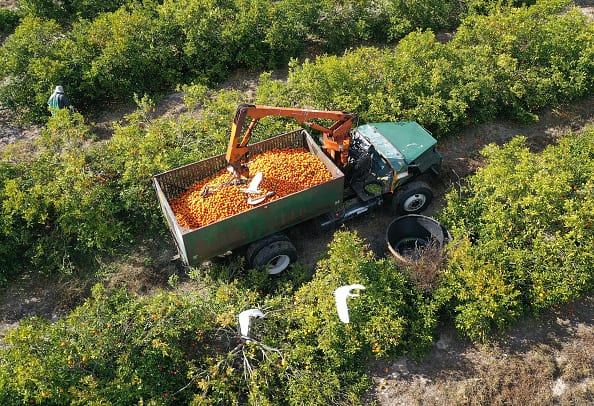
21. Florida

- Annual Production: $9.23 billion
- Percent of US total: 1.8%
- Major commodities: Oranges, floriculture, sugarcane, cattle, tomatoes, dairy, strawberries
20. Colorado

- Annual Production: $9.24 billion
- Percent of US total: 1.8%
- Major commodities: Cattle and calves, sheep, hogs, dairy, corn, proso millet
19. Idaho

- Annual Production: $10.87 billion
- Percent of US total: 2.1%
- Major commodities: Dairy, cattle, potatoes, barley, wheat, mint
18. Michigan

- Annual Production: $11.29 billion
- Percent of US total: 2.2%
- Major commodities: Dairy, corn, soybeans, miscellaneous crops, cattle, eggs, floriculture, hogs, apples
17. North Dakota
- Annual Production: $11.8 billion
- Percent of US total: 2.3%
- Major commodities: Soybeans, wheat, corn, cattle, canola, sugar beets, dry beans, sunflowers, potatoes
16. Washington

- Annual Production: $11.89 billion
- Percent of US total: 2.3%
- Major commodities: Cattle, apples, dairy, potatoes, wheat, hay, eggs, hops, onions
15. Georgia

- Annual Production: $12.46 billion
- Percent of US total: 2.4%
- Major commodities: Peaches, pecans, broilers, cotton, blueberries, spring onions, corn
14. Arkansas

- Annual Production: $13.14 billion
- Percent of US total: 2.5%
- Major commodities: Broilers, soybeans, rice, eggs, corn, cattle, cotton, turkeys, miscellaneous crops
13. South Dakota

- Annual Production: $13.55 billion
- Percent of US total: 2.6%
- Major commodities: Corn, cattle, soybeans, hogs, dairy, wheat, hay, sunflower, miscellaneous crops
12. Ohio

- Annual Production: $13.74 billion
- Percent of US total: 2.7%
- Major commodities: Soybeans, corn, chicken eggs, dairy, hogs, cattle, miscellaneous crops
11. Missouri

- Annual Production: $15.42 billion
- Percent of US total: 3%
- Major commodities: Soybeans, cattle, corn, hogs, broilers, eggs, rice
10. Wisconsin

- Annual Production: $15.45 billion
- Percent of US total: 3%
- Major commodities: Dairy, cattle, corn, soybeans, potatoes, eggs, cranberries, ginseng
9. North Carolina

- Annual Production: $15.62 billion
- Percent of US total: 3%
- Major commodities: Broilers, hogs, turkeys, sweet potatoes, dry beans, eggs, corn, tobacco, cotton
8. Indiana

- Annual Production: $16.6 billion
- Percent of US total: 3.2%
- Major commodities: Corn, soybeans, eggs, hogs, milk, turkeys, cattle, miscellaneous crops
7. Kansas
- Annual Production: $23.08 billion
- Percent of US total: 4.5%
- Major commodities: Wheat, dairy, sorghum, hogs, hay, miscellaneous crops, eggs
6. Minnesota

- Annual Production: $24.8 billion
- Percent of US total: 4.8%
- Major commodities: Corn, soybeans, hogs, cattle, dairy, turkeys, sugar beets, wheat
5. Illinois

- Annual Production: $26.48 billion
- Percent of US total: 5.1%
- Major commodities: Corn, soybeans, hogs, cattle, miscellaneous crops, wheat, dairy, eggs, floriculture
4. Texas

- Annual Production: $29.85 billion
- Percent of US total: 5.8%
- Major commodities: Cattle, broilers, dairy, miscellaneous crops, corn, cotton, eggs, hay, wheat
3. Nebraska

- Annual Production: $31.25 billion
- Percent of US total: 6%
- Major commodities: Cattle, corn, soybeans, hogs, broilers, eggs, hay, miscellaneous crops, dairy, wheat
2. Iowa
- Annual Production: $38.75 billion
- Percent of US total: 7.5%
- Major commodities: Corn, hogs, soybeans, cattle, eggs, dairy, turkeys, hay
1. California

- Annual Production: $59.38 billion
- Percent of US total: 11.5%
- Major commodities: Dairy, grapes, miscellaneous crops, cattle, lettuce, almonds, pistachios, strawberries, tomatoes, carrots, broilers, rice, floriculture, broccoli, hay, oranges, tangerines, eggs, walnuts
The post This U.S. State Produces 11.5% of America’s Food appeared first on 24/7 Wall St..