


This Popular Vacation City Has the With the Widest Gap Between the Rich and Poor in America
Among wealthy, highly developed nations, the United States stands out for its high level of income inequality. According to the latest available data from the World Bank, income inequality is about seven to nine percentage points higher in the U.S. than in countries like Australia, Germany, Italy, and the United Kingdom — and about 10 […] The post This Popular Vacation City Has the With the Widest Gap Between the Rich and Poor in America appeared first on 24/7 Wall St..

Among wealthy, highly developed nations, the United States stands out for its high level of income inequality. According to the latest available data from the World Bank, income inequality is about seven to nine percentage points higher in the U.S. than in countries like Australia, Germany, Italy, and the United Kingdom — and about 10 or more percentage points higher than in places like Austria, Canada, France, and Sweden.
24/7 Wall St. Key Points:
- The United States has some of the worst income inequality of any wealthy, highly developed country.
- America’s high level of inequality is on full display in cities across the country.
- Also: 2 Dividend Legends To Hold Forever
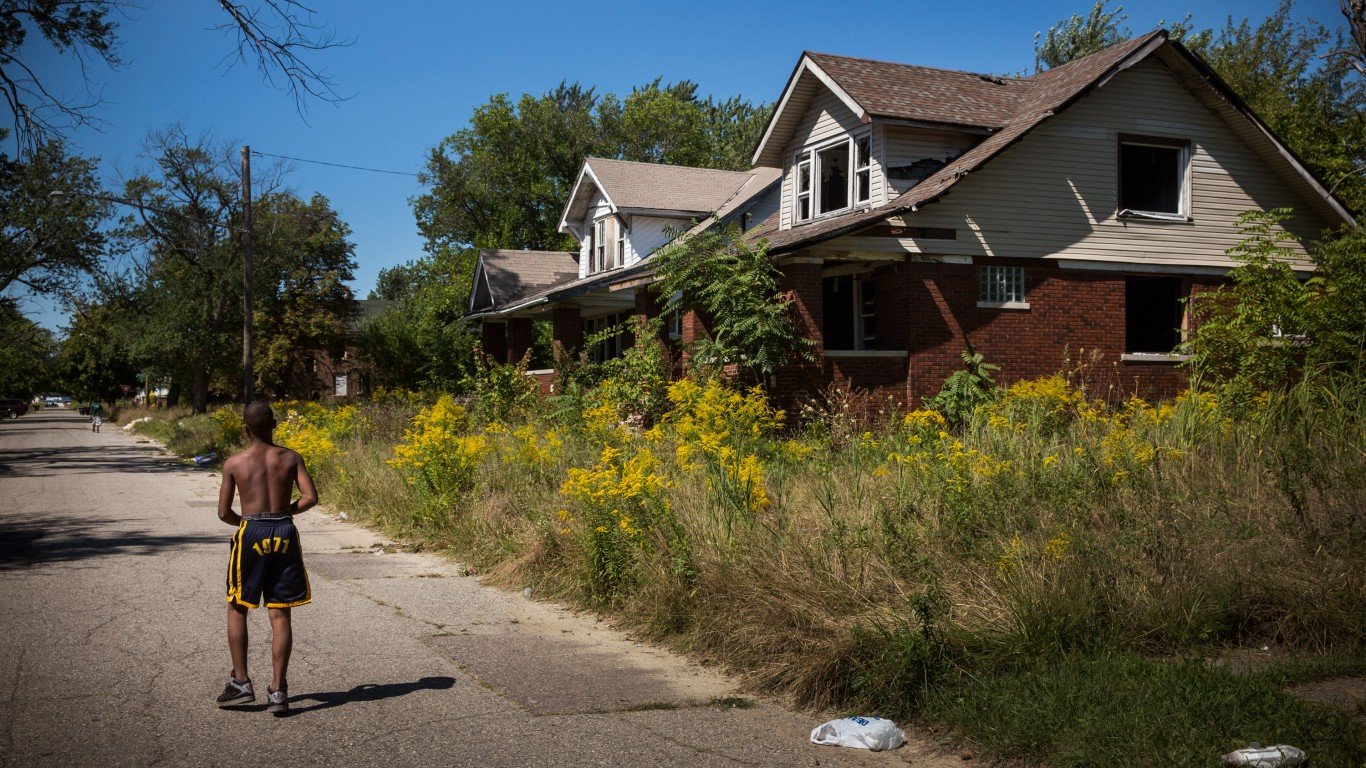
Perhaps nowhere is income inequality in the U.S. more apparent than in major American cities. In cities across the country, neighborhoods characterized by pronounced wealth are often only blocks away from areas marked by abject poverty.
Income inequality is often expressed through the Gini coefficient — a single index measure on a scale of 0 to 100, where 0 represents perfect equality in income distribution and 100 represents perfect inequality. According to the U.S. Census Bureau’s 2023 American Community Survey, the average Gini coefficient across the urban centers of all major metropolitan areas stands at 50.8 out of 100. The Gini score in rural areas and across the U.S. as a whole, meanwhile, is far lower, at 46.1 and 48.3 out of 100, respectively.
While American cities generally have higher levels of income inequality than other parts of the country, in certain cities, inequality is especially striking.
Using five year estimates from the 2023 ACS, 24/7 Wall St. identified the American cities with the widest gaps between the rich and the poor. We reviewed all places with populations of at least 65,000 and ranked them on their Gini index score, listing the top 50. All supplemental data are also five year estimates from the 2023 ACS.
Among the cities on this list, Gini coefficients range from 51.7 to 62.3 out of 100. The largest share of cities on this list — 29 out of 50 — are located in the South, including eight in Florida alone. Only five cities on this list are in the Northeast, and the Midwest and West are each home to eight.
The extent to which serious financial hardship is present in these cities can vary considerably. Still, in the vast majority of cities on this list, poverty is more common than it is across the U.S. as a whole. Nationwide, 12.4% of the population live below the poverty line, and in 42 cities on this list, the poverty rate exceeds the national average — by over 10 percentage points in many cases. (Here is a look at America’s poorest cities.)
When it comes to income inequality, the concentration of low-income residents is only one side of the equation — but while every city on this list is also home to populations of high-income residents, in most of these places, high incomes benefit a smaller than average share of the population. In 28 of the cities on this list, the share of households earning at least $200,000 per year is below the comparable 12.6% share nationwide. (Here is a look at the richest city in every state.)
These are the American cities with the widest gap between the rich and the poor.
Why It Matters
Income inequality has been on the rise in the United States for decades. According to a recent study from the Peter G. Peterson Foundation, a fiscal policy advocacy group, average income among the highest earning quintile of American households surged by 165% between 1981 and 2021, adjusting for inflation. Meanwhile, the average income of the lowest earning quintile increased by just 38% over the same period. The disparities fueled by these trends are on full display in certain U.S. cities.
50. Tallahassee, Florida

- Gini index score: 51.7 out of 100
- Share of households earning less than $25,000 per year: 23.0% (7.9 ppt. higher than U.S. average)
- Share of households earning at least $200,000 per year: 7.1% (5.5 ppt. lower than U.S. average)
- Median household income: $55,931 (28.8% less than U.S. median)
- Poverty rate: 23.2% (10.8 ppt. higher than U.S. average)
- Population: 199,696
49. Davis, California

- Gini index score: 51.7 out of 100
- Share of households earning less than $25,000 per year: 18.8% (3.7 ppt. higher than U.S. average)
- Share of households earning at least $200,000 per year: 21.1% (8.5 ppt. higher than U.S. average)
- Median household income: $87,421 (11.3% more than U.S. median)
- Poverty rate: 25.1% (12.7 ppt. higher than U.S. average)
- Population: 66,801
48. Memphis, Tennessee

- Gini index score: 51.7 out of 100
- Share of households earning less than $25,000 per year: 24.6% (9.5 ppt. higher than U.S. average)
- Share of households earning at least $200,000 per year: 5.9% (6.7 ppt. lower than U.S. average)
- Median household income: $51,211 (34.8% less than U.S. median)
- Poverty rate: 22.5% (10.1 ppt. higher than U.S. average)
- Population: 629,063
47. Wilmington, Delaware

- Gini index score: 51.7 out of 100
- Share of households earning less than $25,000 per year: 25.0% (9.9 ppt. higher than U.S. average)
- Share of households earning at least $200,000 per year: 6.9% (5.7 ppt. lower than U.S. average)
- Median household income: $55,269 (29.6% less than U.S. median)
- Poverty rate: 23.2% (10.8 ppt. higher than U.S. average)
- Population: 71,124
46. Sandy Springs, Georgia
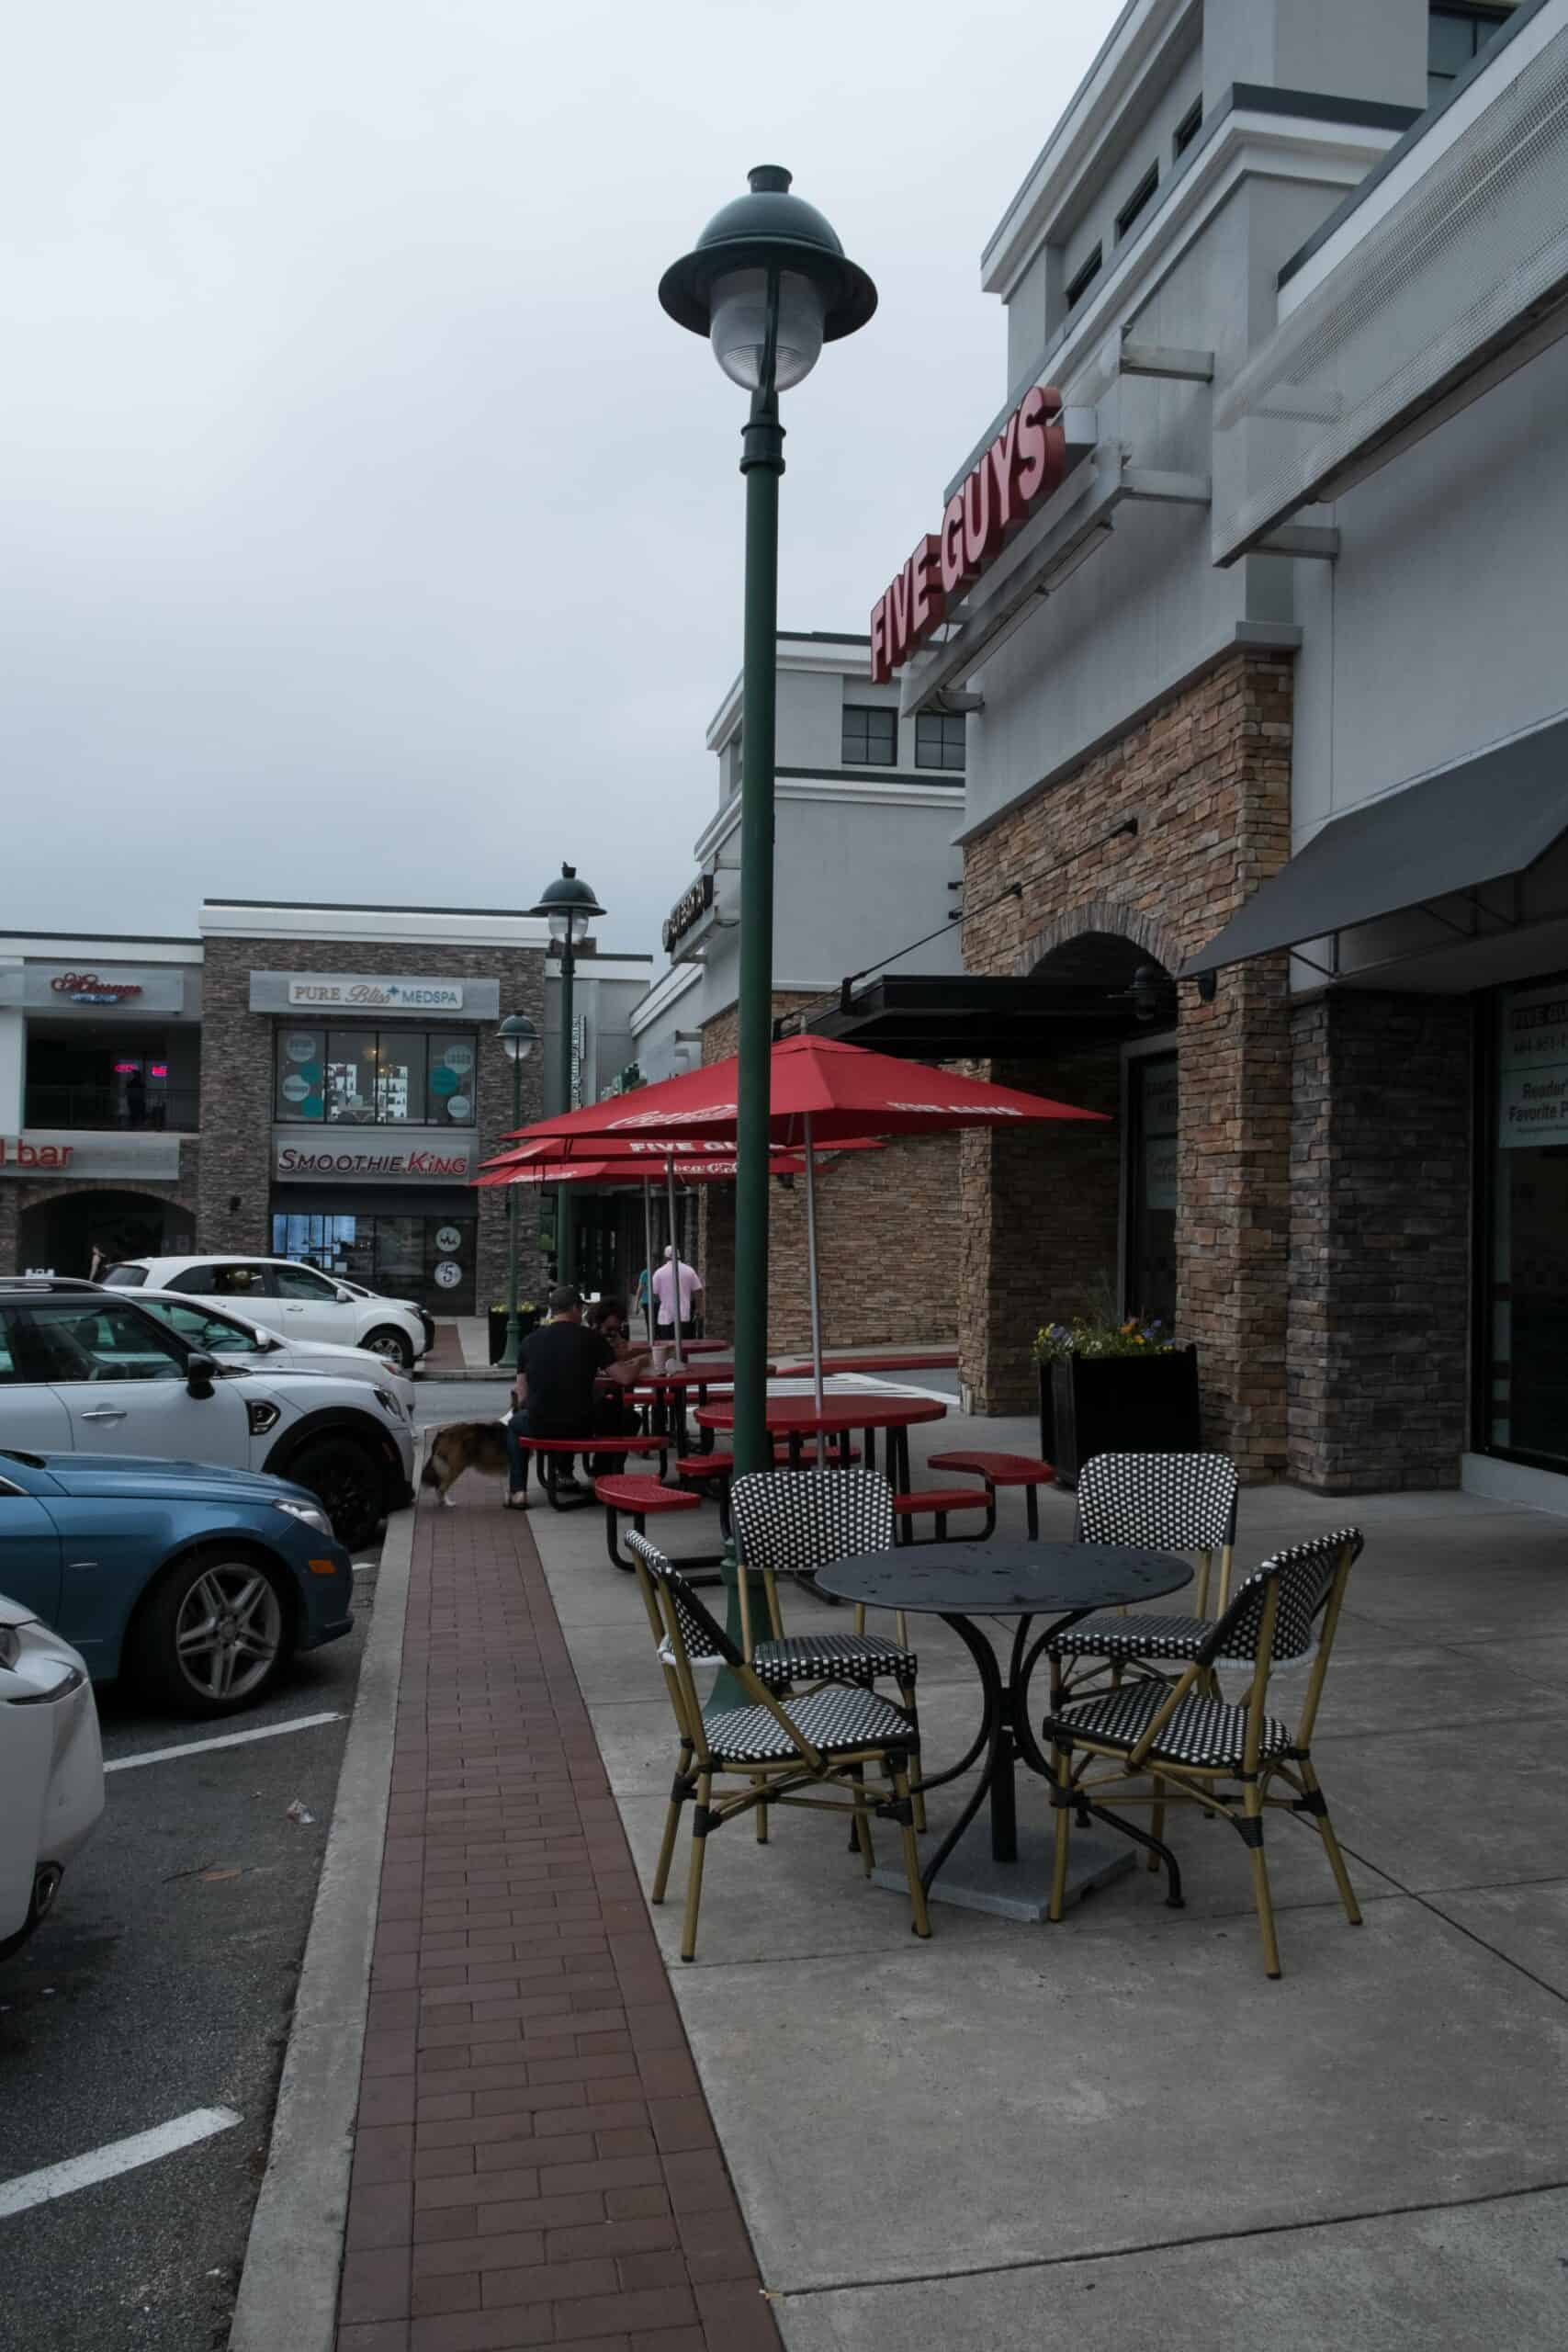
- Gini index score: 51.8 out of 100
- Share of households earning less than $25,000 per year: 9.6% (5.5 ppt. lower than U.S. average)
- Share of households earning at least $200,000 per year: 22.5% (9.9 ppt. higher than U.S. average)
- Median household income: $101,593 (29.4% more than U.S. median)
- Poverty rate: 7.4% (5.0 ppt. lower than U.S. average)
- Population: 107,198
45. San Francisco, California

- Gini index score: 51.8 out of 100
- Share of households earning less than $25,000 per year: 13.3% (1.8 ppt. lower than U.S. average)
- Share of households earning at least $200,000 per year: 36.1% (23.5 ppt. higher than U.S. average)
- Median household income: $141,446 (80.1% more than U.S. median)
- Poverty rate: 10.6% (1.8 ppt. lower than U.S. average)
- Population: 836,321
44. Macon-Bibb County, Georgia

- Gini index score: 51.9 out of 100
- Share of households earning less than $25,000 per year: 26.9% (11.8 ppt. higher than U.S. average)
- Share of households earning at least $200,000 per year: 5.7% (6.9 ppt. lower than U.S. average)
- Median household income: $50,747 (35.4% less than U.S. median)
- Poverty rate: 24.8% (12.4 ppt. higher than U.S. average)
- Population: 156,543
43. Scottsdale, Arizona

- Gini index score: 51.9 out of 100
- Share of households earning less than $25,000 per year: 9.9% (5.2 ppt. lower than U.S. average)
- Share of households earning at least $200,000 per year: 24.6% (12.0 ppt. higher than U.S. average)
- Median household income: $107,372 (36.7% more than U.S. median)
- Poverty rate: 7.1% (5.3 ppt. lower than U.S. average)
- Population: 242,169
42. Iowa City, Iowa
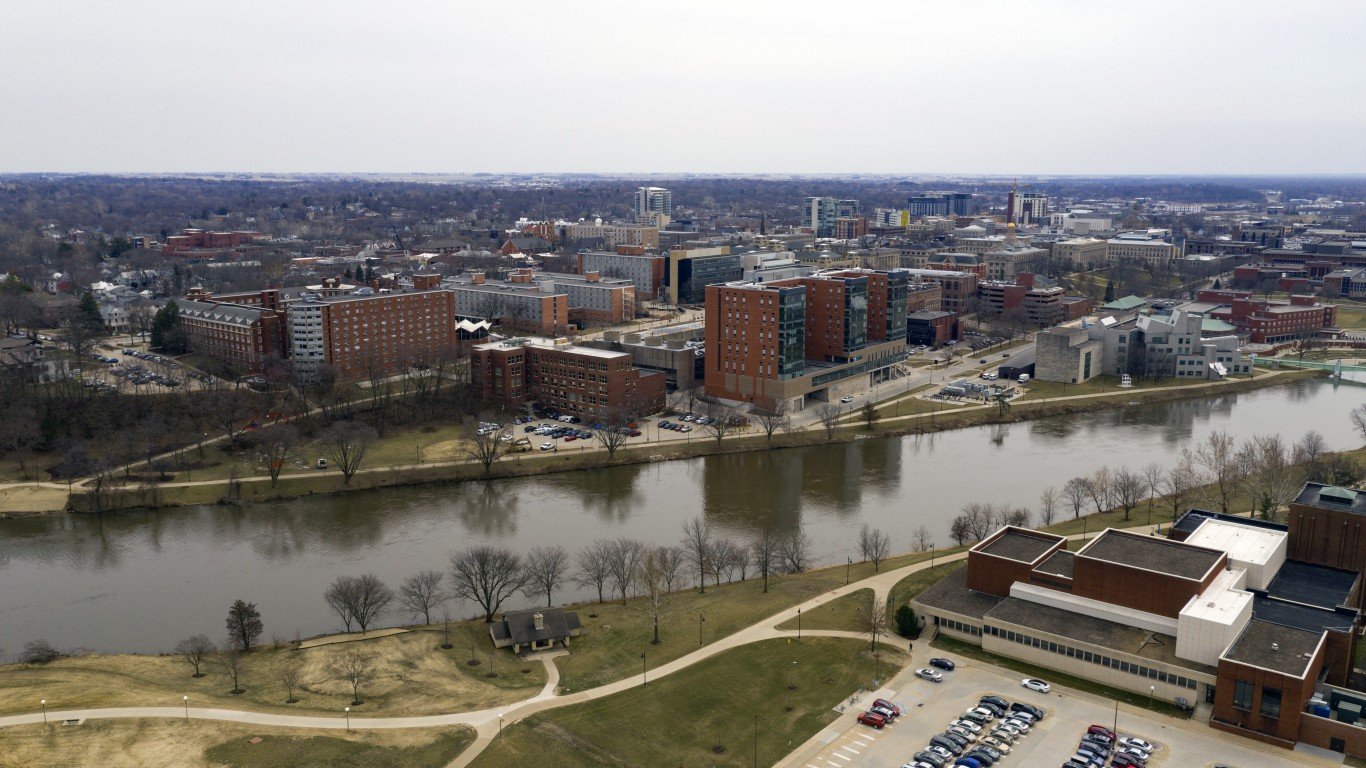
- Gini index score: 52.0 out of 100
- Share of households earning less than $25,000 per year: 23.4% (8.3 ppt. higher than U.S. average)
- Share of households earning at least $200,000 per year: 9.2% (3.4 ppt. lower than U.S. average)
- Median household income: $57,533 (26.7% less than U.S. median)
- Poverty rate: 26.3% (13.9 ppt. higher than U.S. average)
- Population: 75,264
41. Richmond, Virginia

- Gini index score: 52.1 out of 100
- Share of households earning less than $25,000 per year: 21.4% (6.3 ppt. higher than U.S. average)
- Share of households earning at least $200,000 per year: 10.0% (2.6 ppt. lower than U.S. average)
- Median household income: $62,671 (20.2% less than U.S. median)
- Poverty rate: 18.8% (6.4 ppt. higher than U.S. average)
- Population: 227,595
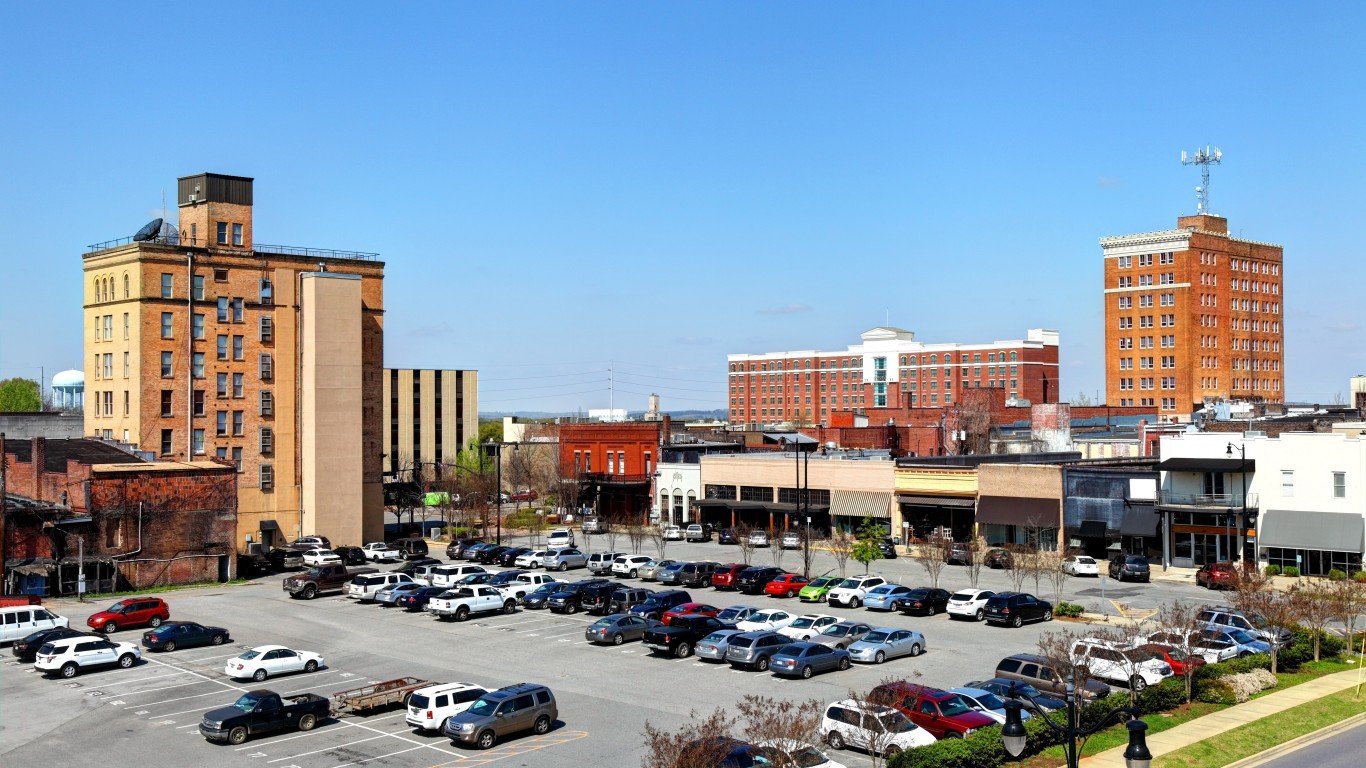
40. Birmingham, Alabama

- Gini index score: 52.1 out of 100
- Share of households earning less than $25,000 per year: 29.4% (14.3 ppt. higher than U.S. average)
- Share of households earning at least $200,000 per year: 5.1% (7.5 ppt. lower than U.S. average)
- Median household income: $44,376 (43.5% less than U.S. median)
- Poverty rate: 25.2% (12.8 ppt. higher than U.S. average)
- Population: 199,322
39. Ann Arbor, Michigan

- Gini index score: 52.2 out of 100
- Share of households earning less than $25,000 per year: 18.5% (3.4 ppt. higher than U.S. average)
- Share of households earning at least $200,000 per year: 17.6% (5.0 ppt. higher than U.S. average)
- Median household income: $81,089 (3.2% more than U.S. median)
- Poverty rate: 23.0% (10.6 ppt. higher than U.S. average)
- Population: 121,179
38. Johnson City, Tennessee
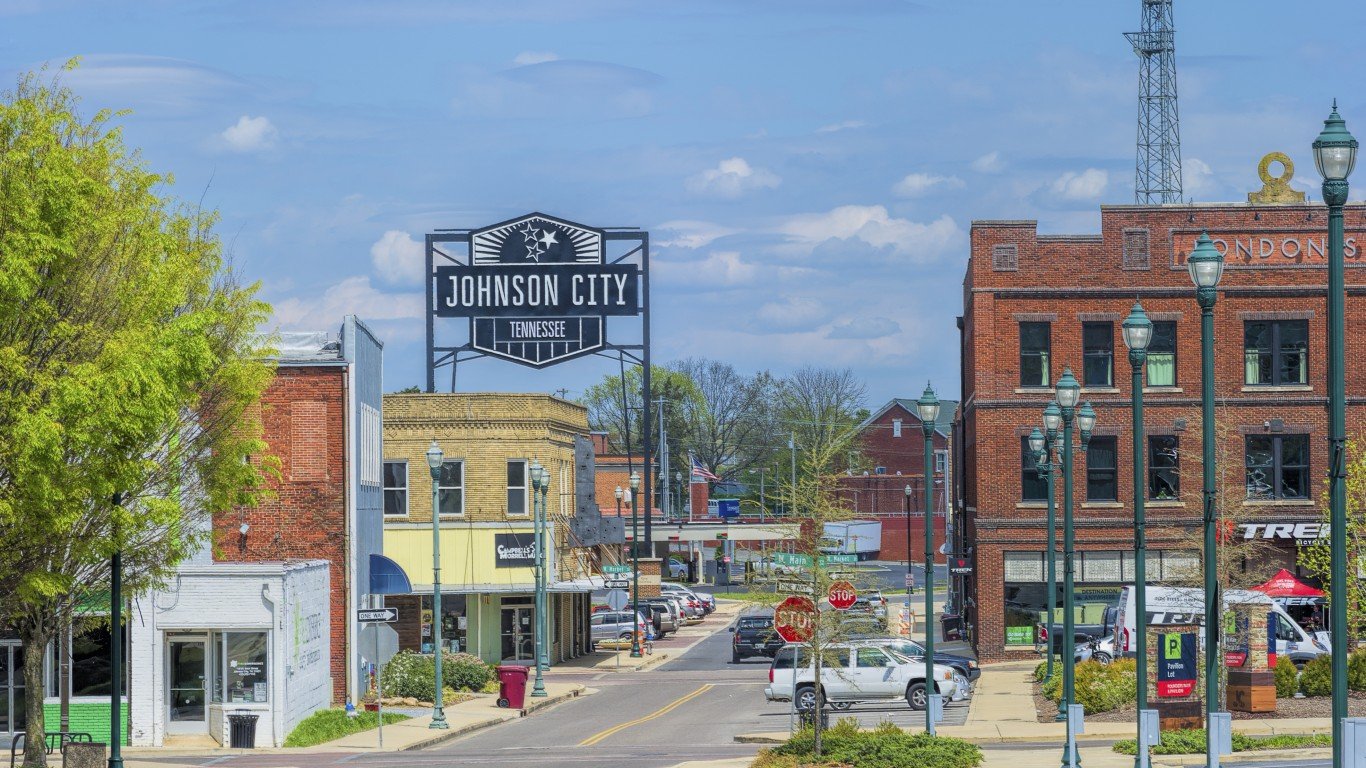
- Gini index score: 52.2 out of 100
- Share of households earning less than $25,000 per year: 24.6% (9.5 ppt. higher than U.S. average)
- Share of households earning at least $200,000 per year: 7.5% (5.1 ppt. lower than U.S. average)
- Median household income: $55,429 (29.4% less than U.S. median)
- Poverty rate: 21.1% (8.7 ppt. higher than U.S. average)
- Population: 71,455
37. Chicago, Illinois

- Gini index score: 52.4 out of 100
- Share of households earning less than $25,000 per year: 19.3% (4.2 ppt. higher than U.S. average)
- Share of households earning at least $200,000 per year: 13.7% (1.1 ppt. higher than U.S. average)
- Median household income: $75,134 (4.3% less than U.S. median)
- Poverty rate: 16.8% (4.4 ppt. higher than U.S. average)
- Population: 2,707,648
36. Fort Smith, Arkansas
- Gini index score: 52.4 out of 100
- Share of households earning less than $25,000 per year: 20.5% (5.4 ppt. higher than U.S. average)
- Share of households earning at least $200,000 per year: 5.6% (7.0 ppt. lower than U.S. average)
- Median household income: $52,692 (32.9% less than U.S. median)
- Poverty rate: 18.3% (5.9 ppt. higher than U.S. average)
- Population: 89,496
35. Los Angeles, California

- Gini index score: 52.6 out of 100
- Share of households earning less than $25,000 per year: 17.5% (2.4 ppt. higher than U.S. average)
- Share of households earning at least $200,000 per year: 15.9% (3.3 ppt. higher than U.S. average)
- Median household income: $80,366 (2.3% more than U.S. median)
- Poverty rate: 16.5% (4.1 ppt. higher than U.S. average)
- Population: 3,857,897
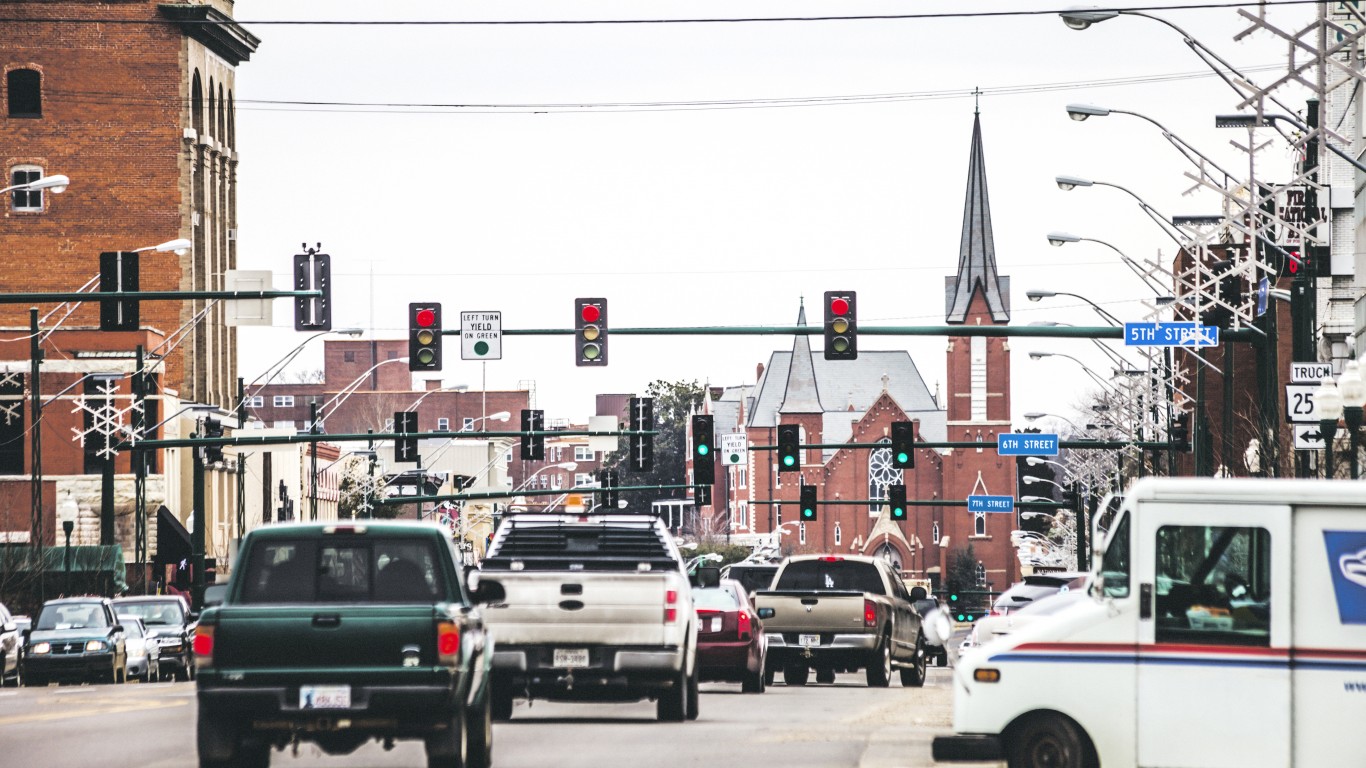
34. Peoria, Illinois

- Gini index score: 52.6 out of 100
- Share of households earning less than $25,000 per year: 24.2% (9.1 ppt. higher than U.S. average)
- Share of households earning at least $200,000 per year: 8.9% (3.7 ppt. lower than U.S. average)
- Median household income: $58,716 (25.2% less than U.S. median)
- Poverty rate: 20.0% (7.6 ppt. higher than U.S. average)
- Population: 112,126
33. Dallas, Texas

- Gini index score: 52.7 out of 100
- Share of households earning less than $25,000 per year: 17.0% (1.9 ppt. higher than U.S. average)
- Share of households earning at least $200,000 per year: 11.9% (0.7 ppt. lower than U.S. average)
- Median household income: $67,760 (13.7% less than U.S. median)
- Poverty rate: 17.2% (4.8 ppt. higher than U.S. average)
- Population: 1,299,553
32. Newport Beach, California

- Gini index score: 52.7 out of 100
- Share of households earning less than $25,000 per year: 8.8% (6.3 ppt. lower than U.S. average)
- Share of households earning at least $200,000 per year: 41.8% (29.2 ppt. higher than U.S. average)
- Median household income: $158,461 (101.8% more than U.S. median)
- Poverty rate: 7.3% (5.1 ppt. lower than U.S. average)
- Population: 84,304
31. Berkeley, California

- Gini index score: 52.8 out of 100
- Share of households earning less than $25,000 per year: 16.0% (0.9 ppt. higher than U.S. average)
- Share of households earning at least $200,000 per year: 29.4% (16.8 ppt. higher than U.S. average)
- Median household income: $108,558 (38.2% more than U.S. median)
- Poverty rate: 16.8% (4.4 ppt. higher than U.S. average)
- Population: 120,223
30. New Haven, Connecticut

- Gini index score: 53.0 out of 100
- Share of households earning less than $25,000 per year: 26.1% (11.0 ppt. higher than U.S. average)
- Share of households earning at least $200,000 per year: 7.9% (4.7 ppt. lower than U.S. average)
- Median household income: $53,771 (31.5% less than U.S. median)
- Poverty rate: 25.0% (12.6 ppt. higher than U.S. average)
- Population: 132,893
29. Lake Charles, Louisiana

- Gini index score: 53.2 out of 100
- Share of households earning less than $25,000 per year: 23.7% (8.6 ppt. higher than U.S. average)
- Share of households earning at least $200,000 per year: 7.9% (4.7 ppt. lower than U.S. average)
- Median household income: $56,864 (27.6% less than U.S. median)
- Poverty rate: 23.2% (10.8 ppt. higher than U.S. average)
- Population: 81,679
28. Delray Beach, Florida
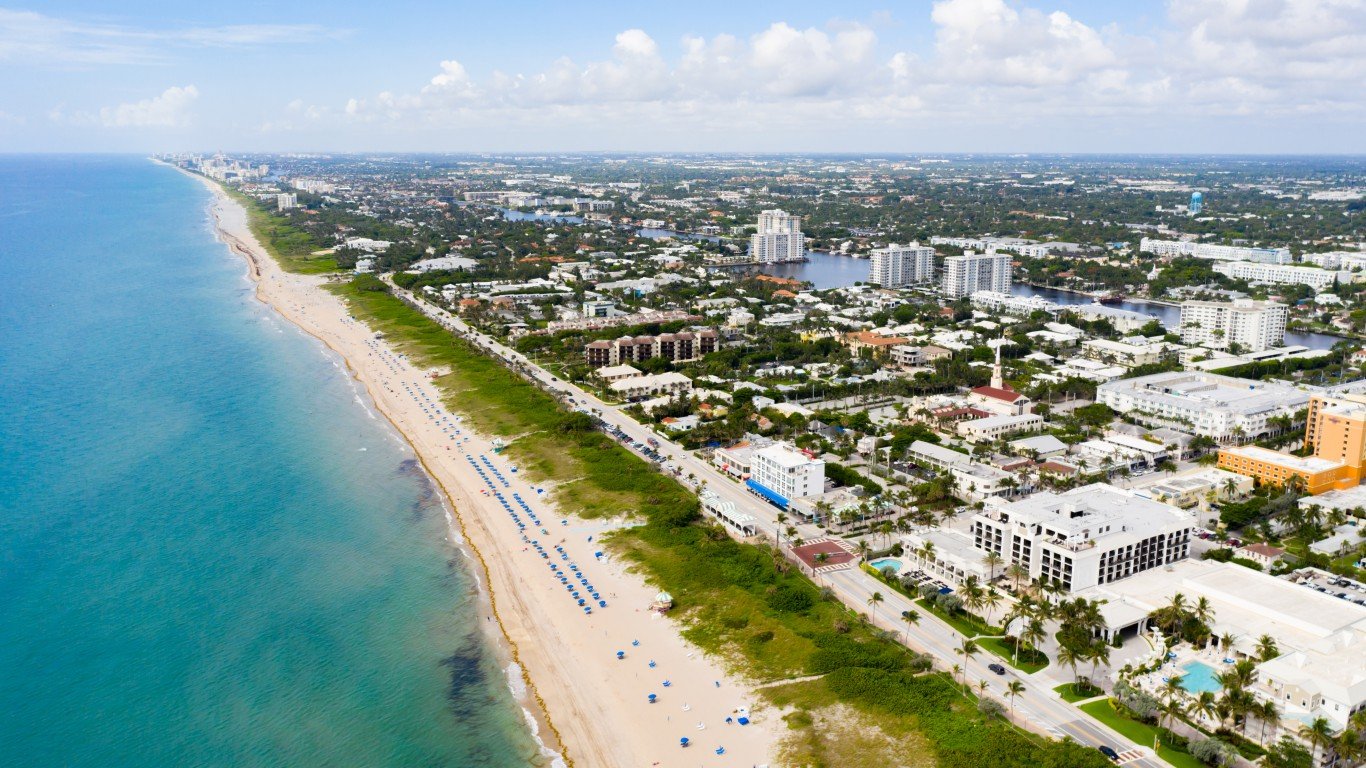
- Gini index score: 53.2 out of 100
- Share of households earning less than $25,000 per year: 14.8% (0.3 ppt. lower than U.S. average)
- Share of households earning at least $200,000 per year: 14.7% (2.1 ppt. higher than U.S. average)
- Median household income: $79,393 (1.1% more than U.S. median)
- Poverty rate: 12.6% (0.2 ppt. higher than U.S. average)
- Population: 66,940
27. Boston, Massachusetts

- Gini index score: 53.3 out of 100
- Share of households earning less than $25,000 per year: 19.4% (4.3 ppt. higher than U.S. average)
- Share of households earning at least $200,000 per year: 21.8% (9.2 ppt. higher than U.S. average)
- Median household income: $94,755 (20.6% more than U.S. median)
- Poverty rate: 16.9% (4.5 ppt. higher than U.S. average)
- Population: 663,972
26. Fort Lauderdale, Florida

- Gini index score: 53.3 out of 100
- Share of households earning less than $25,000 per year: 15.5% (0.4 ppt. higher than U.S. average)
- Share of households earning at least $200,000 per year: 14.7% (2.1 ppt. higher than U.S. average)
- Median household income: $79,935 (1.8% more than U.S. median)
- Poverty rate: 15.2% (2.8 ppt. higher than U.S. average)
- Population: 183,032
25. Little Rock, Arkansas

- Gini index score: 53.4 out of 100
- Share of households earning less than $25,000 per year: 18.9% (3.8 ppt. higher than U.S. average)
- Share of households earning at least $200,000 per year: 10.7% (1.9 ppt. lower than U.S. average)
- Median household income: $60,583 (22.9% less than U.S. median)
- Poverty rate: 16.4% (4.0 ppt. higher than U.S. average)
- Population: 202,739
24. Houston, Texas

- Gini index score: 53.4 out of 100
- Share of households earning less than $25,000 per year: 19.1% (4.0 ppt. higher than U.S. average)
- Share of households earning at least $200,000 per year: 11.2% (1.4 ppt. lower than U.S. average)
- Median household income: $62,894 (19.9% less than U.S. median)
- Poverty rate: 19.7% (7.3 ppt. higher than U.S. average)
- Population: 2,300,419
23. Tuscaloosa, Alabama
- Gini index score: 53.4 out of 100
- Share of households earning less than $25,000 per year: 27.6% (12.5 ppt. higher than U.S. average)
- Share of households earning at least $200,000 per year: 6.8% (5.8 ppt. lower than U.S. average)
- Median household income: $48,536 (38.2% less than U.S. median)
- Poverty rate: 23.8% (11.4 ppt. higher than U.S. average)
- Population: 107,699
22. Gainesville, Florida

- Gini index score: 53.6 out of 100
- Share of households earning less than $25,000 per year: 28.4% (13.3 ppt. higher than U.S. average)
- Share of households earning at least $200,000 per year: 5.5% (7.1 ppt. lower than U.S. average)
- Median household income: $45,611 (41.9% less than U.S. median)
- Poverty rate: 28.0% (15.6 ppt. higher than U.S. average)
- Population: 143,611
21. Cincinnati, Ohio

- Gini index score: 54.0 out of 100
- Share of households earning less than $25,000 per year: 27.1% (12.0 ppt. higher than U.S. average)
- Share of households earning at least $200,000 per year: 8.1% (4.5 ppt. lower than U.S. average)
- Median household income: $51,707 (34.2% less than U.S. median)
- Poverty rate: 24.5% (12.1 ppt. higher than U.S. average)
- Population: 309,595
20. New Rochelle, New York

- Gini index score: 54.1 out of 100
- Share of households earning less than $25,000 per year: 15.4% (0.3 ppt. higher than U.S. average)
- Share of households earning at least $200,000 per year: 26.7% (14.1 ppt. higher than U.S. average)
- Median household income: $103,813 (32.2% more than U.S. median)
- Poverty rate: 10.6% (1.8 ppt. lower than U.S. average)
- Population: 81,591
19. Shreveport, Louisiana

- Gini index score: 54.2 out of 100
- Share of households earning less than $25,000 per year: 29.1% (14.0 ppt. higher than U.S. average)
- Share of households earning at least $200,000 per year: 6.0% (6.6 ppt. lower than U.S. average)
- Median household income: $48,465 (38.3% less than U.S. median)
- Poverty rate: 23.6% (11.2 ppt. higher than U.S. average)
- Population: 183,483
18. Bloomington, Indiana

- Gini index score: 54.3 out of 100
- Share of households earning less than $25,000 per year: 30.0% (14.9 ppt. higher than U.S. average)
- Share of households earning at least $200,000 per year: 7.4% (5.2 ppt. lower than U.S. average)
- Median household income: $48,918 (37.7% less than U.S. median)
- Poverty rate: 30.5% (18.1 ppt. higher than U.S. average)
- Population: 78,791
17. Champaign, Illinois

- Gini index score: 54.4 out of 100
- Share of households earning less than $25,000 per year: 26.6% (11.5 ppt. higher than U.S. average)
- Share of households earning at least $200,000 per year: 8.6% (4.0 ppt. lower than U.S. average)
- Median household income: $57,544 (26.7% less than U.S. median)
- Poverty rate: 23.9% (11.5 ppt. higher than U.S. average)
- Population: 88,822
16. College Station, Texas

- Gini index score: 54.5 out of 100
- Share of households earning less than $25,000 per year: 26.6% (11.5 ppt. higher than U.S. average)
- Share of households earning at least $200,000 per year: 8.4% (4.2 ppt. lower than U.S. average)
- Median household income: $51,776 (34.1% less than U.S. median)
- Poverty rate: 28.6% (16.2 ppt. higher than U.S. average)
- Population: 122,280
15. Evanston, Illinois
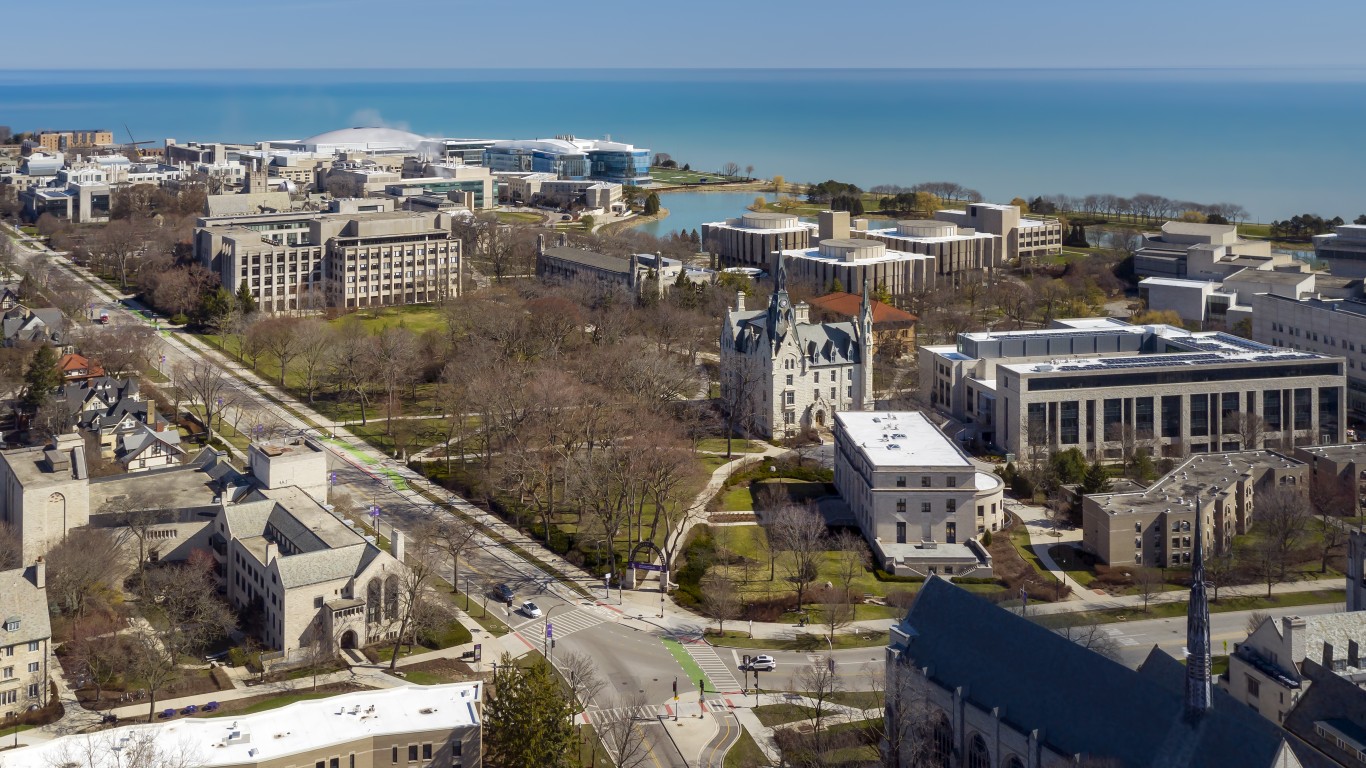
- Gini index score: 54.6 out of 100
- Share of households earning less than $25,000 per year: 13.3% (1.8 ppt. lower than U.S. average)
- Share of households earning at least $200,000 per year: 24.0% (11.4 ppt. higher than U.S. average)
- Median household income: $95,766 (21.9% more than U.S. median)
- Poverty rate: 11.9% (0.5 ppt. lower than U.S. average)
- Population: 76,552
14. Tampa, Florida

- Gini index score: 54.7 out of 100
- Share of households earning less than $25,000 per year: 18.3% (3.2 ppt. higher than U.S. average)
- Share of households earning at least $200,000 per year: 14.5% (1.9 ppt. higher than U.S. average)
- Median household income: $71,302 (9.2% less than U.S. median)
- Poverty rate: 15.9% (3.5 ppt. higher than U.S. average)
- Population: 393,389
13. Baton Rouge, Louisiana

- Gini index score: 54.8 out of 100
- Share of households earning less than $25,000 per year: 27.6% (12.5 ppt. higher than U.S. average)
- Share of households earning at least $200,000 per year: 7.7% (4.9 ppt. lower than U.S. average)
- Median household income: $49,944 (36.4% less than U.S. median)
- Poverty rate: 25.0% (12.6 ppt. higher than U.S. average)
- Population: 223,699
12. Miami, Florida

- Gini index score: 54.9 out of 100
- Share of households earning less than $25,000 per year: 23.7% (8.6 ppt. higher than U.S. average)
- Share of households earning at least $200,000 per year: 10.3% (2.3 ppt. lower than U.S. average)
- Median household income: $59,390 (24.4% less than U.S. median)
- Poverty rate: 19.2% (6.8 ppt. higher than U.S. average)
- Population: 446,663
11. New York, New York

- Gini index score: 55.0 out of 100
- Share of households earning less than $25,000 per year: 19.3% (4.2 ppt. higher than U.S. average)
- Share of households earning at least $200,000 per year: 16.8% (4.2 ppt. higher than U.S. average)
- Median household income: $79,713 (1.5% more than U.S. median)
- Poverty rate: 17.4% (5.0 ppt. higher than U.S. average)
- Population: 8,516,202
10. Columbia, South Carolina

- Gini index score: 55.0 out of 100
- Share of households earning less than $25,000 per year: 25.1% (10.0 ppt. higher than U.S. average)
- Share of households earning at least $200,000 per year: 9.8% (2.8 ppt. lower than U.S. average)
- Median household income: $55,653 (29.1% less than U.S. median)
- Poverty rate: 23.3% (10.9 ppt. higher than U.S. average)
- Population: 138,019
9. Santa Monica, California

- Gini index score: 55.1 out of 100
- Share of households earning less than $25,000 per year: 16.0% (0.9 ppt. higher than U.S. average)
- Share of households earning at least $200,000 per year: 28.2% (15.6 ppt. higher than U.S. average)
- Median household income: $109,739 (39.7% more than U.S. median)
- Poverty rate: 11.6% (0.8 ppt. lower than U.S. average)
- Population: 91,535
8. Boca Raton, Florida

- Gini index score: 55.3 out of 100
- Share of households earning less than $25,000 per year: 12.2% (2.9 ppt. lower than U.S. average)
- Share of households earning at least $200,000 per year: 24.0% (11.4 ppt. higher than U.S. average)
- Median household income: $102,722 (30.8% more than U.S. median)
- Poverty rate: 9.4% (3.0 ppt. lower than U.S. average)
- Population: 98,833
7. Boulder, Colorado
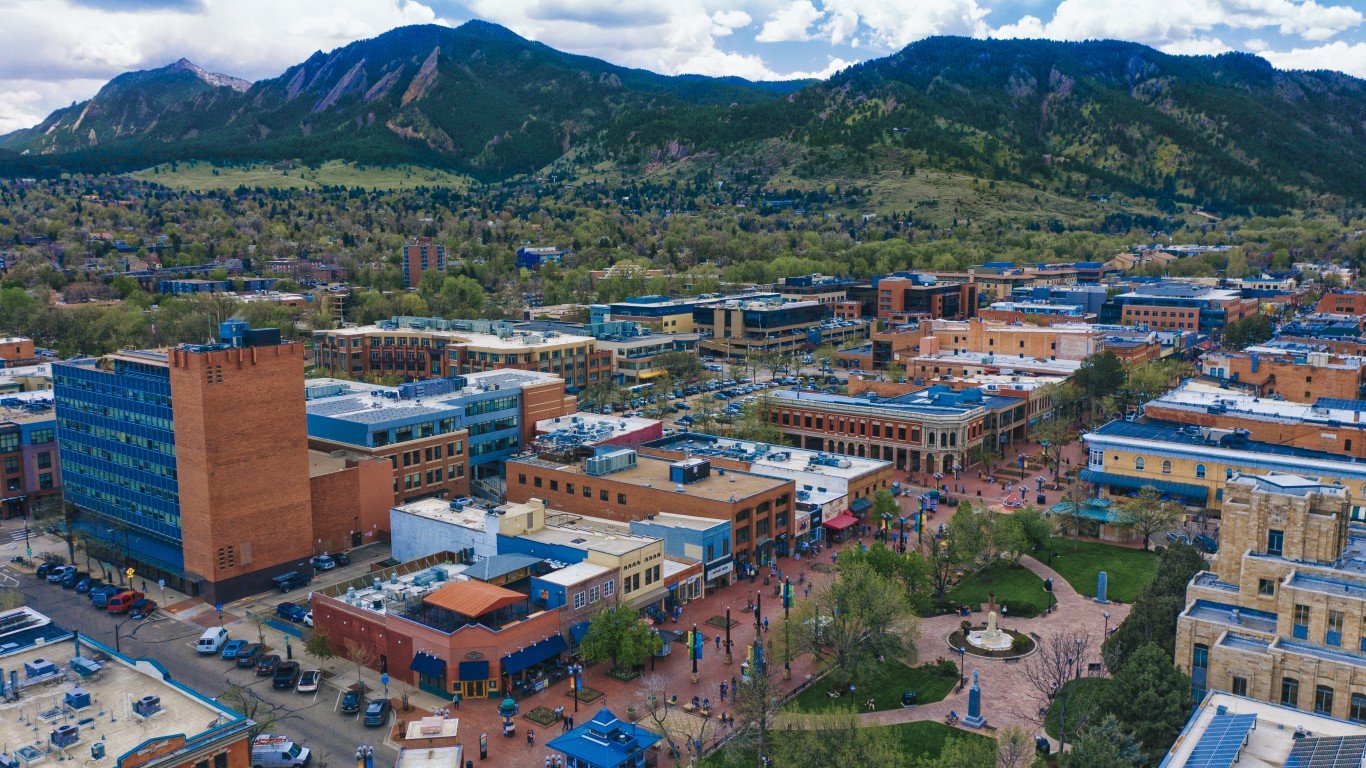
- Gini index score: 55.5 out of 100
- Share of households earning less than $25,000 per year: 19.1% (4.0 ppt. higher than U.S. average)
- Share of households earning at least $200,000 per year: 22.4% (9.8 ppt. higher than U.S. average)
- Median household income: $85,364 (8.7% more than U.S. median)
- Poverty rate: 21.8% (9.4 ppt. higher than U.S. average)
- Population: 106,274
6. Trenton, New Jersey

- Gini index score: 55.6 out of 100
- Share of households earning less than $25,000 per year: 30.3% (15.2 ppt. higher than U.S. average)
- Share of households earning at least $200,000 per year: 5.2% (7.4 ppt. lower than U.S. average)
- Median household income: $47,102 (40.0% less than U.S. median)
- Poverty rate: 24.7% (12.3 ppt. higher than U.S. average)
- Population: 89,966
5. Greenville, South Carolina

- Gini index score: 55.6 out of 100
- Share of households earning less than $25,000 per year: 19.1% (4.0 ppt. higher than U.S. average)
- Share of households earning at least $200,000 per year: 13.9% (1.3 ppt. higher than U.S. average)
- Median household income: $68,460 (12.8% less than U.S. median)
- Poverty rate: 14.1% (1.7 ppt. higher than U.S. average)
- Population: 71,755
4. New Orleans, Louisiana

- Gini index score: 55.9 out of 100
- Share of households earning less than $25,000 per year: 28.4% (13.3 ppt. higher than U.S. average)
- Share of households earning at least $200,000 per year: 9.8% (2.8 ppt. lower than U.S. average)
- Median household income: $55,339 (29.5% less than U.S. median)
- Poverty rate: 22.6% (10.2 ppt. higher than U.S. average)
- Population: 376,035
3. Auburn, Alabama
- Gini index score: 56.4 out of 100
- Share of households earning less than $25,000 per year: 30.1% (15.0 ppt. higher than U.S. average)
- Share of households earning at least $200,000 per year: 10.3% (2.3 ppt. lower than U.S. average)
- Median household income: $56,123 (28.5% less than U.S. median)
- Poverty rate: 26.1% (13.7 ppt. higher than U.S. average)
- Population: 78,738
2. Atlanta, Georgia

- Gini index score: 56.7 out of 100
- Share of households earning less than $25,000 per year: 19.9% (4.8 ppt. higher than U.S. average)
- Share of households earning at least $200,000 per year: 18.0% (5.4 ppt. higher than U.S. average)
- Median household income: $81,938 (4.3% more than U.S. median)
- Poverty rate: 17.9% (5.5 ppt. higher than U.S. average)
- Population: 499,287
1. Miami Beach, Florida

- Gini index score: 62.3 out of 100
- Share of households earning less than $25,000 per year: 20.9% (5.8 ppt. higher than U.S. average)
- Share of households earning at least $200,000 per year: 16.1% (3.5 ppt. higher than U.S. average)
- Median household income: $67,014 (14.7% less than U.S. median)
- Poverty rate: 14.4% (2.0 ppt. higher than U.S. average)
- Population: 81,319
The post This Popular Vacation City Has the With the Widest Gap Between the Rich and Poor in America appeared first on 24/7 Wall St..