


This American City Has Lost Nearly 40% of Its Downtown’s Population in Just 10 Years
Even as we approach the 5th anniversary of the pandemic, America’s urban centers are still grappling with the long-term effects of the COVID-19 pandemic, changing work patterns, and evolving demographic trends. While some employers, such as Jamie Dimon from JPMorgan Chase, have made it clear it’s time for employees to get back into the office, […] The post This American City Has Lost Nearly 40% of Its Downtown’s Population in Just 10 Years appeared first on 24/7 Wall St..
Even as we approach the 5th anniversary of the pandemic, America’s urban centers are still grappling with the long-term effects of the COVID-19 pandemic, changing work patterns, and evolving demographic trends.
While some employers, such as Jamie Dimon from JPMorgan Chase, have made it clear it’s time for employees to get back into the office, many other employers have adopted permanent hybrid or fully remote work arrangements, leaving once-bustling downtown office buildings underutilized.
Rising housing costs in larger metros, combined with a growing appetite for more space and flexibility, have spurred some urban residents to migrate to the suburbs – or even entirely new regions. In fact, according to a recent survey, 35% of Americans say they plan to move in 2025 (although, historical trends suggest only 8-9% will actually relocate). Meanwhile, city revitalization initiatives and infrastructure investments, including those funded at state and federal levels, are underway in an effort to draw people back to downtown neighborhoods with updated public transit, housing, and business incentives.
To give our readers a better sense of where the change has been most significant, 24/7 Wall St. reviewed five-year data on population change from the U.S. Census Bureau’s 2022 American Community Survey. Cities were ranked based on the percentage change in population in downtown census tracts from 2012 to 2022. Downtown areas were defined as the census tracts that fall at least 50% within the 1.8-mile radius around a city hall. Non-downtown areas were defined as the census tracts that fall at least 50% within a city’s boundaries, yet less than 50% within the 1.8-mile radius around city hall. Boundary definitions are from the U.S. Census Bureau and are for 2022. Only principal cities of metropolitan statistical areas were considered. City hall coordinates as well as supplemental data on income are also from the Census Bureau.
Some of the cities on our list are experiencing not only downtown population loss but overall population loss as well. Although in some locations, downtowns are shrinking, while non-downtown tracts are experiencing population growth, suggesting people may be moving from declining downtowns to the suburbs. In other cities, such as some Midwestern cities on the list that have known decades of economic struggles, populations have generally been declining — including in their downtown areas.
Geographically, 10 of the cities on the list are from the Midwest. However, the region with the most cities on the list is the South, with 26 cities, including 10 in Texas alone. Georgia has the second most cities on the list, at four, including the city whose downtown shrank the most from 2012 to 2022.
Why This Matters
A thriving downtown is a critical economic driver for any city, acting as a hub for business innovation, job creation, and tourism.
When downtown areas flourish, they attract new businesses, which in turn generate additional employment opportunities and bolster local tax revenues.
Successful downtown redevelopment also tends to increase nearby property values, boosting wealth for property owners and contributing to the city’s overall economic stability.
Furthermore, vibrant city centers draw visitors to cultural attractions, sporting events, and dining options, creating a sustainable cycle of investment and reinvestment. These dynamic urban cores help knit communities together and foster collaboration among entrepreneurs, artists, and residents—ultimately helping to strengthen the entire region’s economic resilience.
Here are 40 American cities with shrinking downtowns:
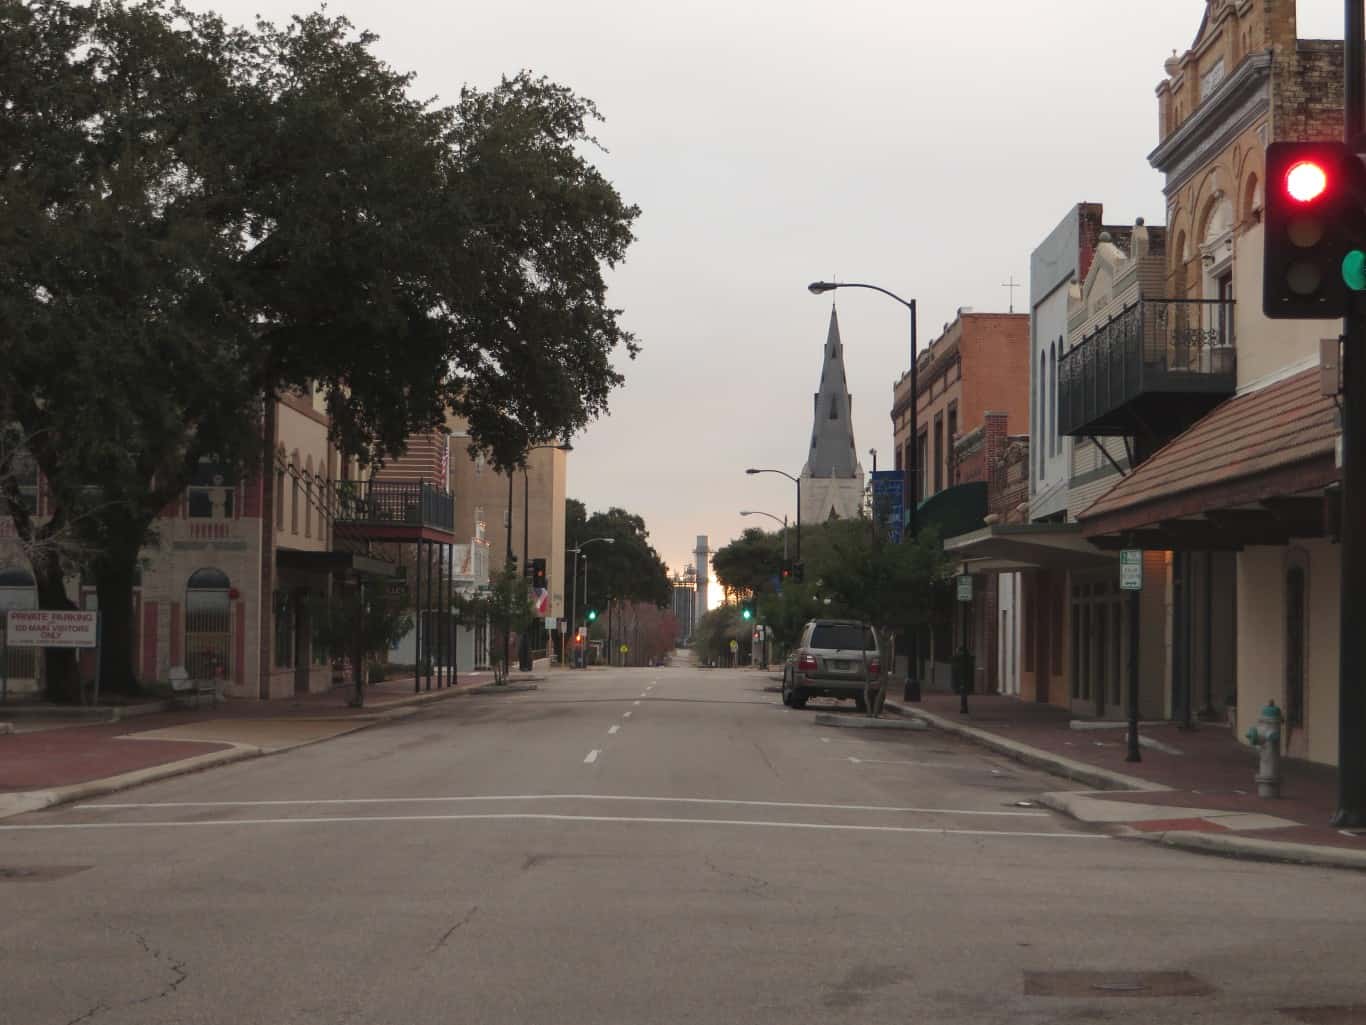
40. San Angelo, Texas
- Population change in downtown tracts from 2012 to 2022: -10.3%
- Population change of non-downtown tracts from 2012 to 2022: +8.7%
- Per capita income change in downtown tracts from 2012 to 2022: +21.3%
- Per capita income change in non-downtown tracts from 2012 to 2022: +15.5%
39. San Antonio, Texas
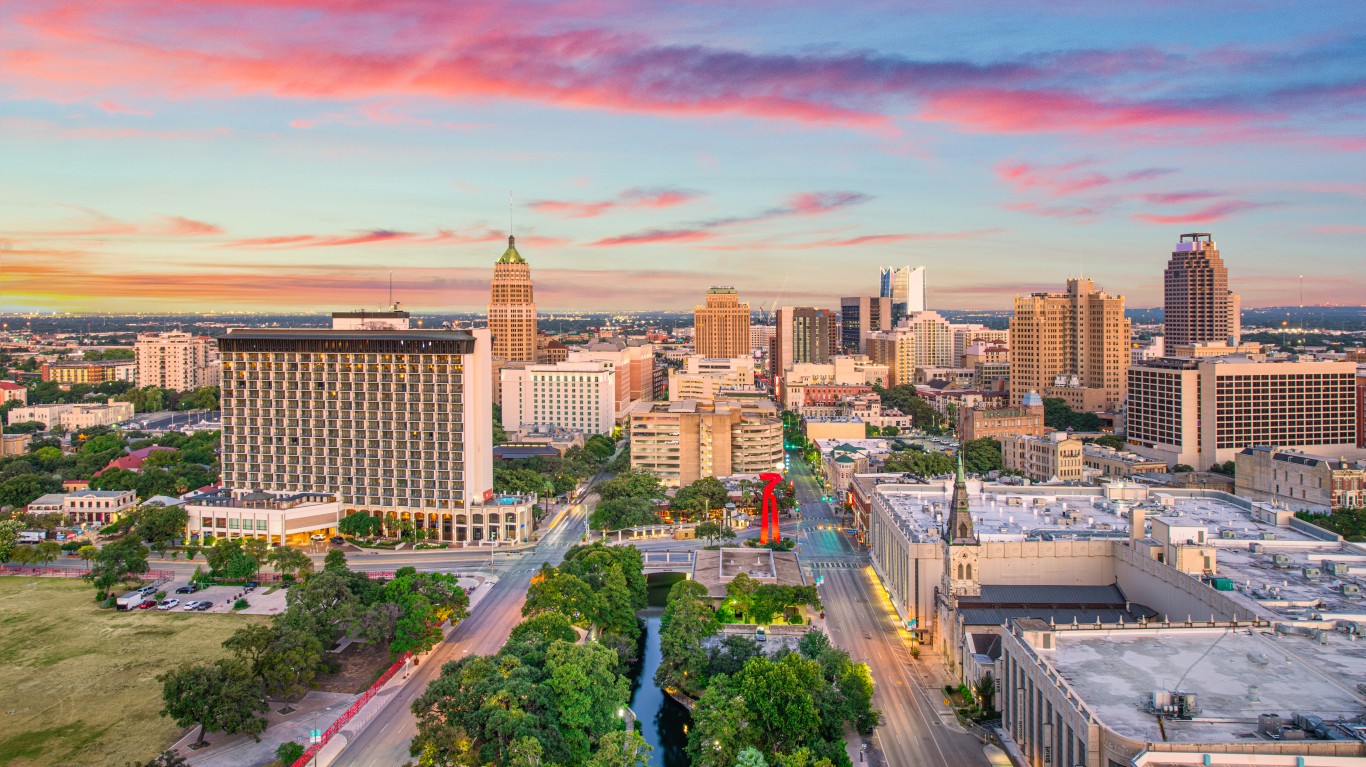
- Population change in downtown tracts from 2012 to 2022: -10.6%
- Population change of non-downtown tracts from 2012 to 2022: +7.5%
- Per capita income change in downtown tracts from 2012 to 2022: +28.5%
- Per capita income change in non-downtown tracts from 2012 to 2022: +8.0%
38. St. Joseph, Missouri
- Population change in downtown tracts from 2012 to 2022: -10.9%
- Population change of non-downtown tracts from 2012 to 2022: -1.7%
- Per capita income change in downtown tracts from 2012 to 2022: +9.1%
- Per capita income change in non-downtown tracts from 2012 to 2022: +11.5%
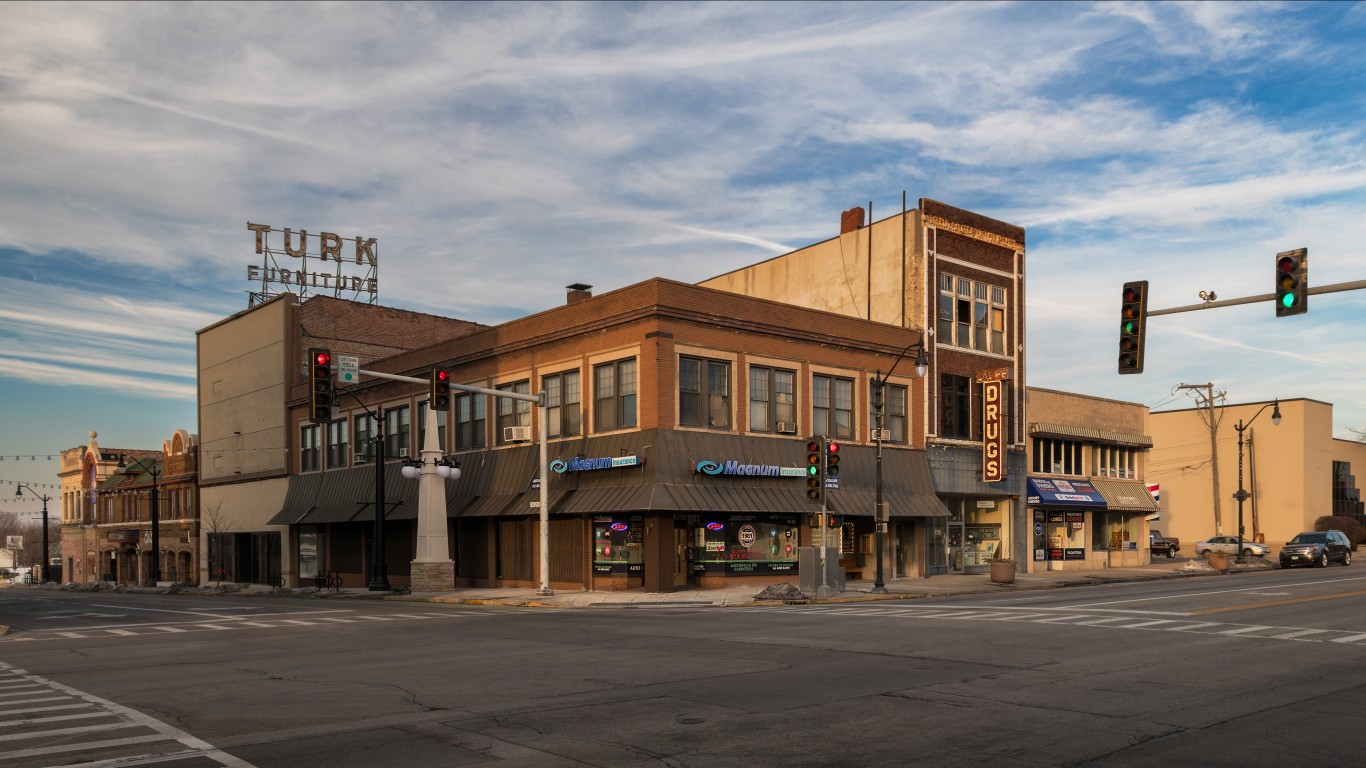
37. Springfield, Illinois

- Population change in downtown tracts from 2012 to 2022: -10.9%
- Population change of non-downtown tracts from 2012 to 2022: -2.0%
- Per capita income change in downtown tracts from 2012 to 2022: +9.5%
- Per capita income change in non-downtown tracts from 2012 to 2022: +8.2%
36. Youngstown, Ohio
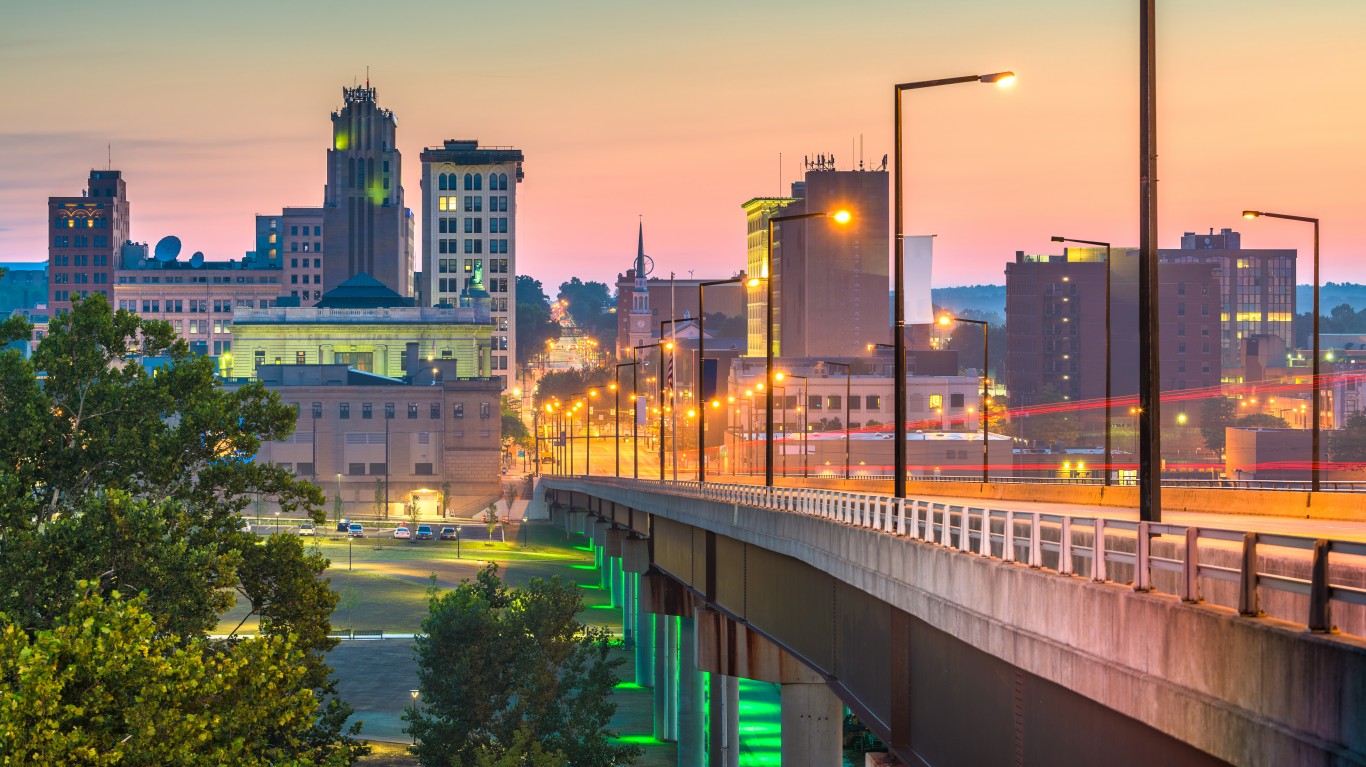
- Population change in downtown tracts from 2012 to 2022: -11.1%
- Population change of non-downtown tracts from 2012 to 2022: -7.4%
- Per capita income change in downtown tracts from 2012 to 2022: +21.5%
- Per capita income change in non-downtown tracts from 2012 to 2022: +2.2%
35. Canton, Ohio

- Population change in downtown tracts from 2012 to 2022: -11.3%
- Population change of non-downtown tracts from 2012 to 2022: -2.8%
- Per capita income change in downtown tracts from 2012 to 2022: +4.6%
- Per capita income change in non-downtown tracts from 2012 to 2022: +11.1%
34. Brownsville, Texas
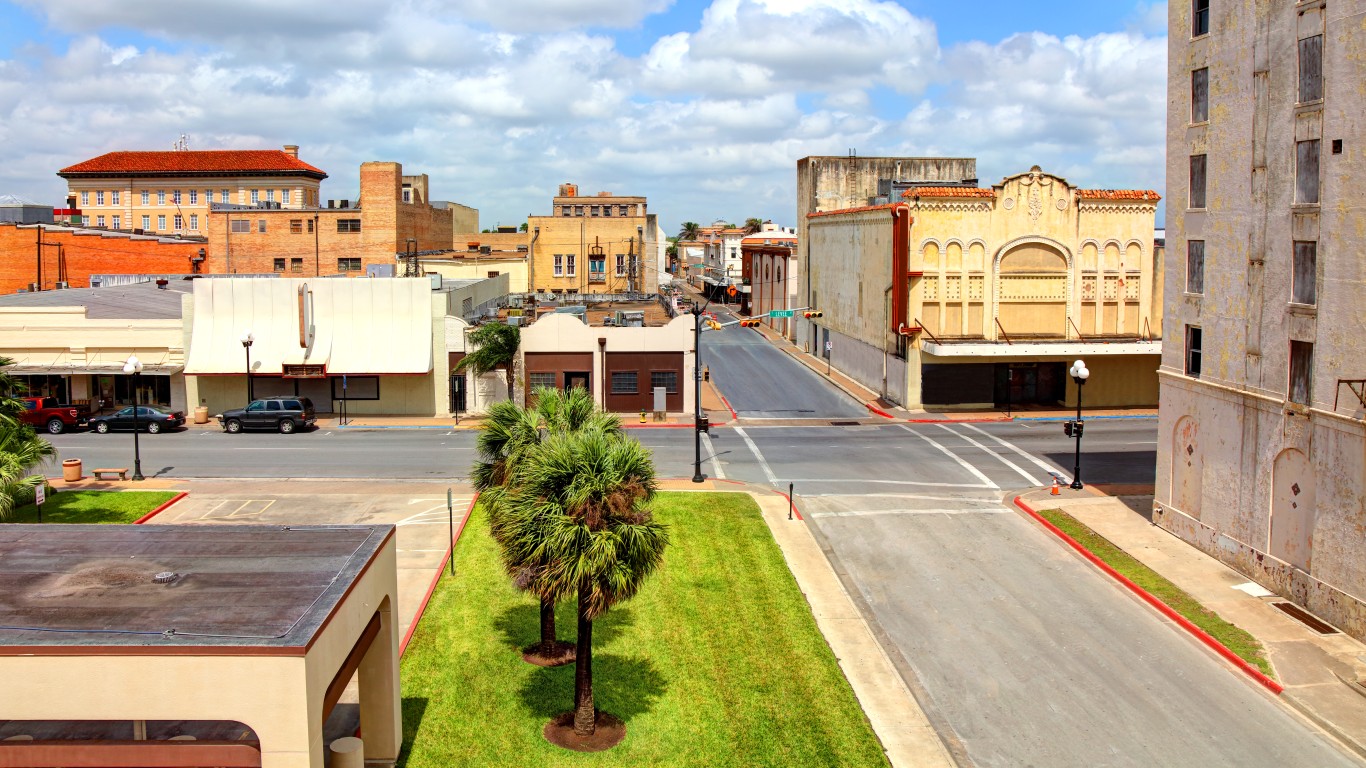
- Population change in downtown tracts from 2012 to 2022: -11.5%
- Population change of non-downtown tracts from 2012 to 2022: +0.6%
- Per capita income change in downtown tracts from 2012 to 2022: +11.5%
- Per capita income change in non-downtown tracts from 2012 to 2022: +9.8%
33. Johnstown, Pennsylvania
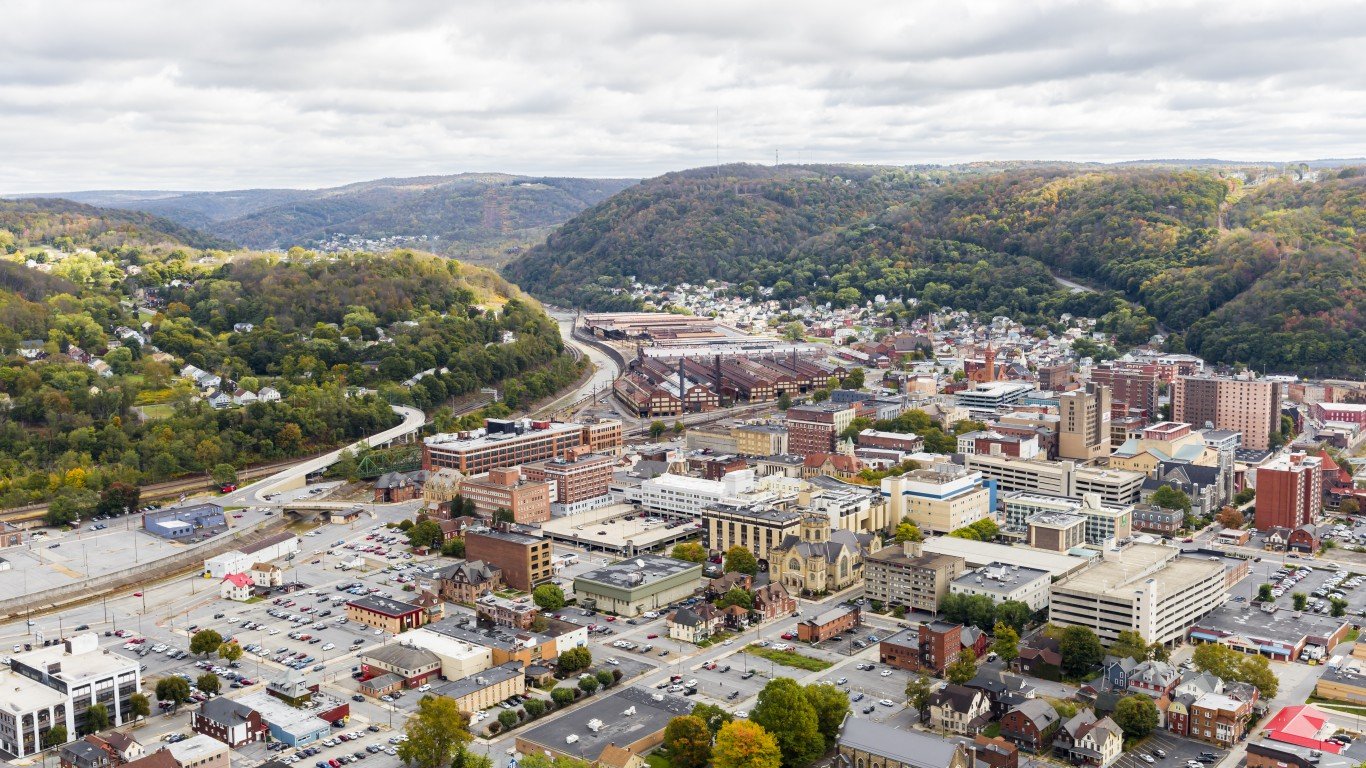
- Population change in downtown tracts from 2012 to 2022: -11.6%
- Population change of non-downtown tracts from 2012 to 2022: -12.4%
- Per capita income change in downtown tracts from 2012 to 2022: +23.9%
- Per capita income change in non-downtown tracts from 2012 to 2022: -1.5%
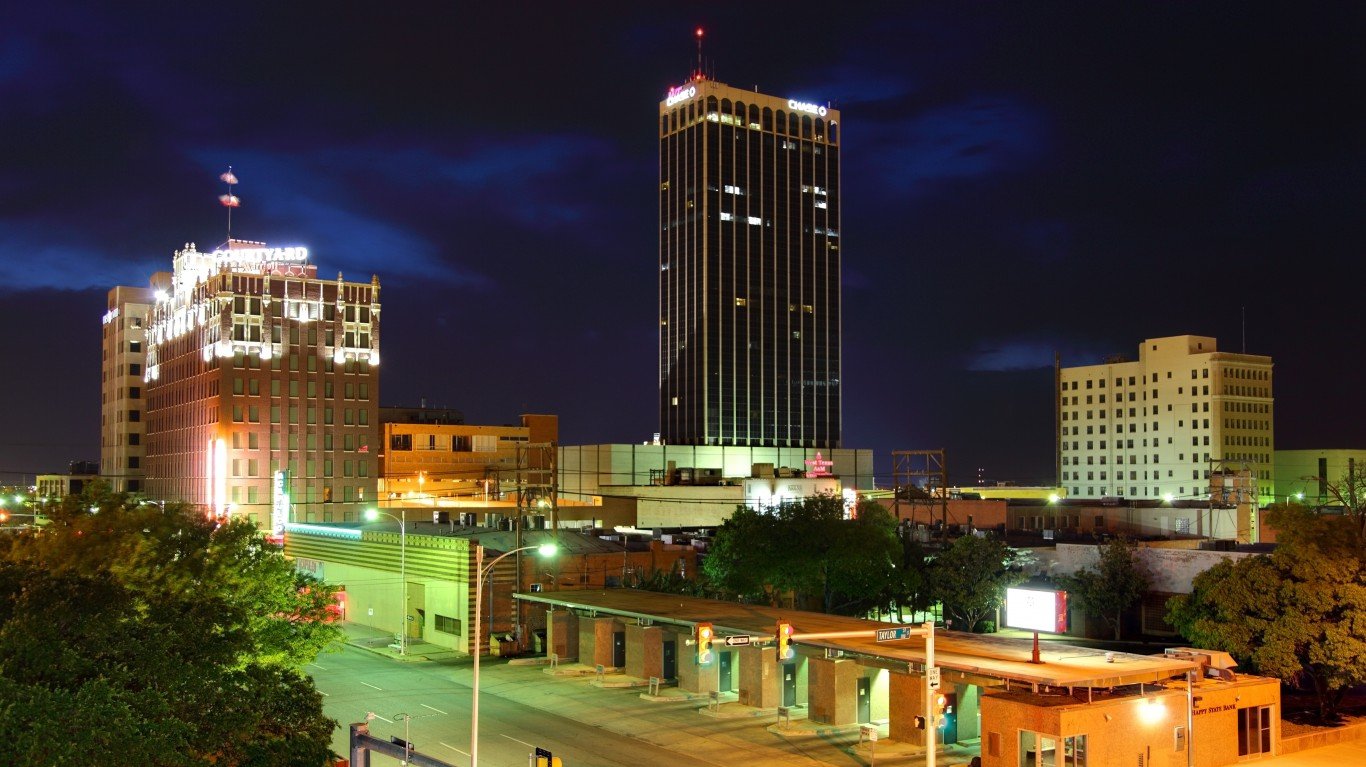
32. Amarillo, Texas
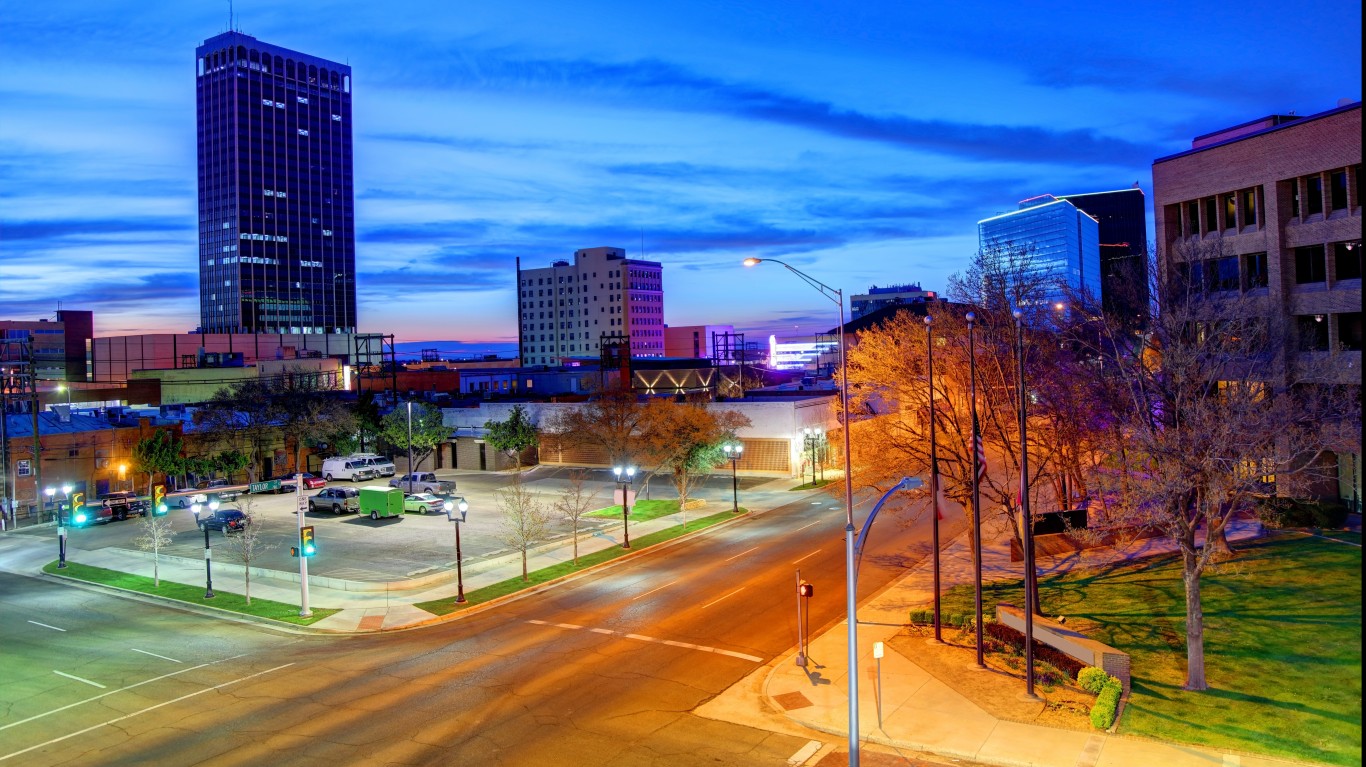
- Population change in downtown tracts from 2012 to 2022: -11.6%
- Population change of non-downtown tracts from 2012 to 2022: +1.8%
- Per capita income change in downtown tracts from 2012 to 2022: +14.1%
- Per capita income change in non-downtown tracts from 2012 to 2022: +6.2%
31. Hattiesburg, Mississippi

- Population change in downtown tracts from 2012 to 2022: -11.7%
- Population change of non-downtown tracts from 2012 to 2022: +9.2%
- Per capita income change in downtown tracts from 2012 to 2022: +21.2%
- Per capita income change in non-downtown tracts from 2012 to 2022: +0.8%
30. Valdosta, Georgia

- Population change in downtown tracts from 2012 to 2022: -12.6%
- Population change of non-downtown tracts from 2012 to 2022: +4.5%
- Per capita income change in downtown tracts from 2012 to 2022: +26.0%
- Per capita income change in non-downtown tracts from 2012 to 2022: +5.0%
29. El Paso, Texas
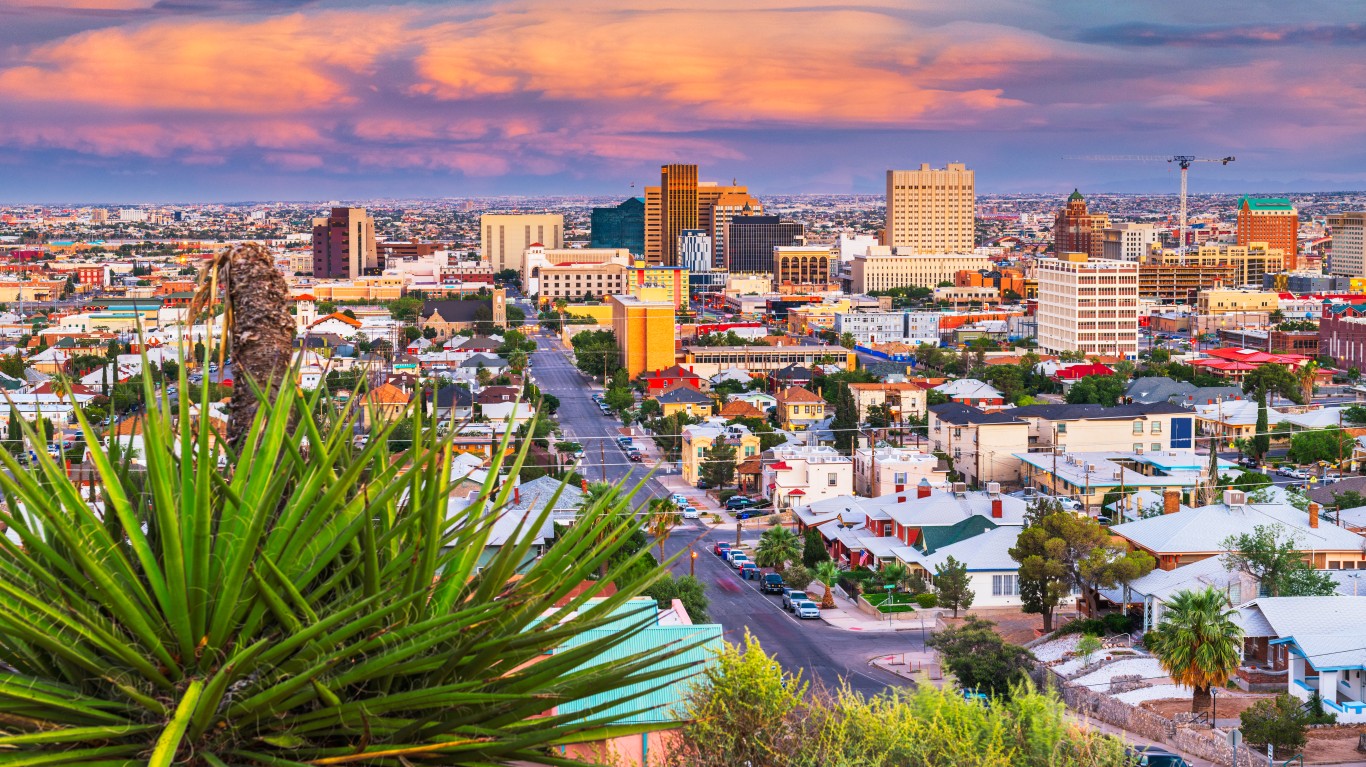
- Population change in downtown tracts from 2012 to 2022: -12.7%
- Population change of non-downtown tracts from 2012 to 2022: -3.2%
- Per capita income change in downtown tracts from 2012 to 2022: +17.9%
- Per capita income change in non-downtown tracts from 2012 to 2022: +8.5%
28. Jackson, Mississippi
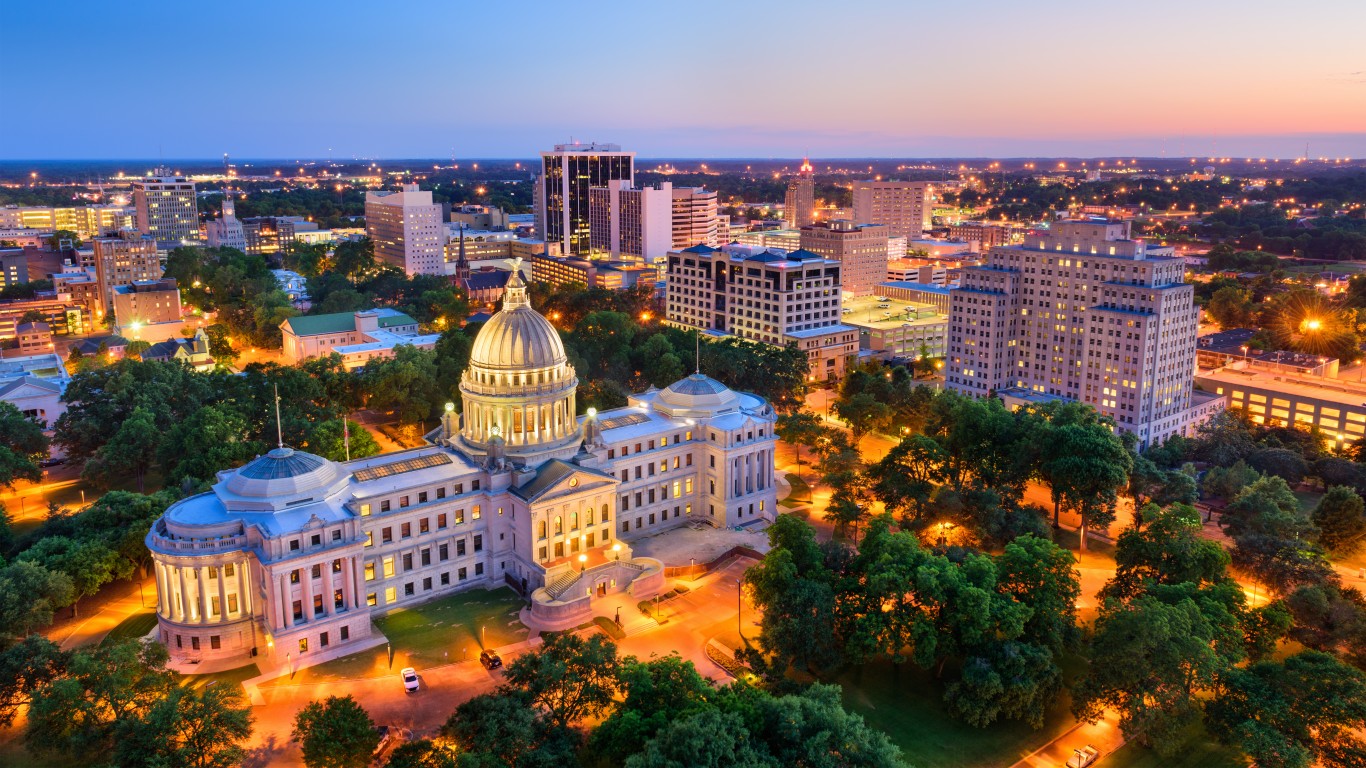
- Population change in downtown tracts from 2012 to 2022: -13.2%
- Population change of non-downtown tracts from 2012 to 2022: -12.6%
- Per capita income change in downtown tracts from 2012 to 2022: +33.1%
- Per capita income change in non-downtown tracts from 2012 to 2022: +5.4%
27. Casper, Wyoming
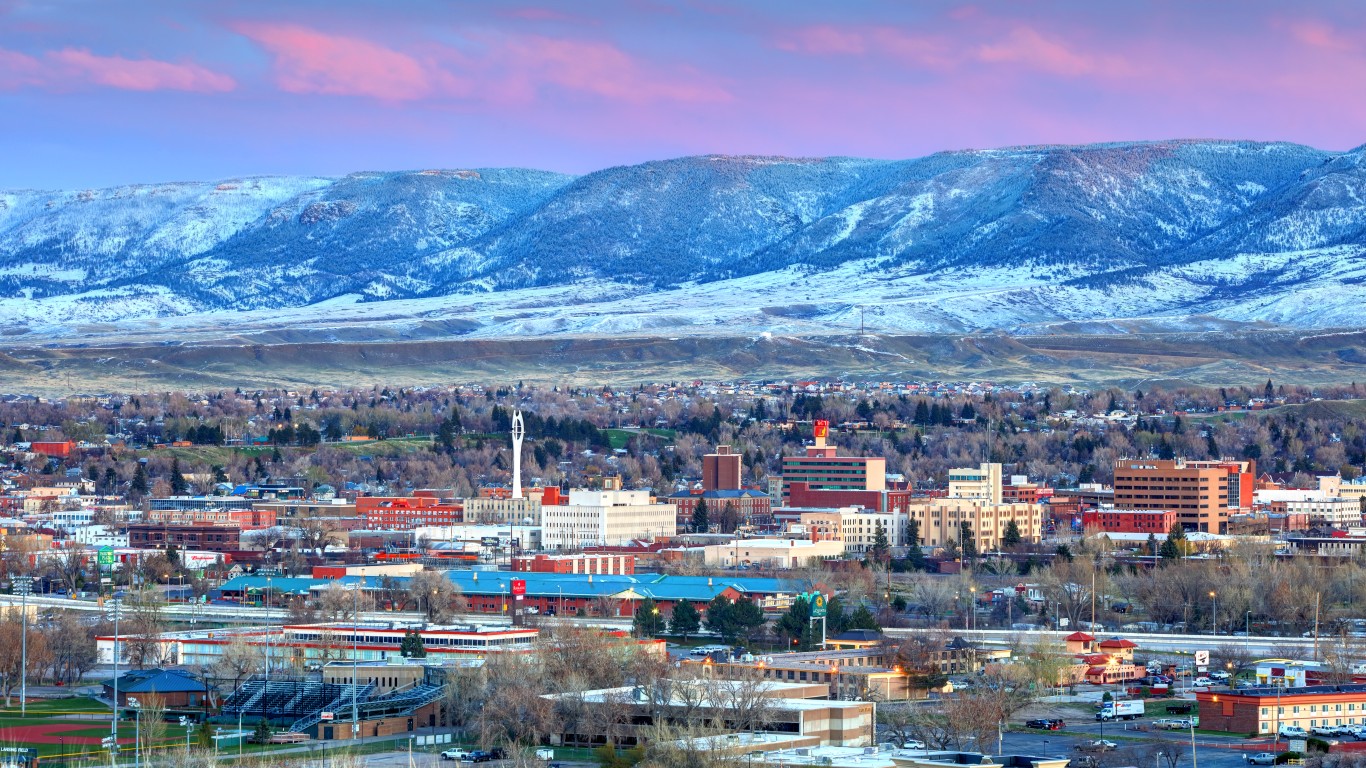
- Population change in downtown tracts from 2012 to 2022: -13.2%
- Population change of non-downtown tracts from 2012 to 2022: +1.5%
- Per capita income change in downtown tracts from 2012 to 2022: +11.6%
- Per capita income change in non-downtown tracts from 2012 to 2022: -3.6%
26. Gadsden, Alabama
- Population change in downtown tracts from 2012 to 2022: -13.3%
- Population change of non-downtown tracts from 2012 to 2022: -6.4%
- Per capita income change in downtown tracts from 2012 to 2022: +5.2%
- Per capita income change in non-downtown tracts from 2012 to 2022: +7.4%
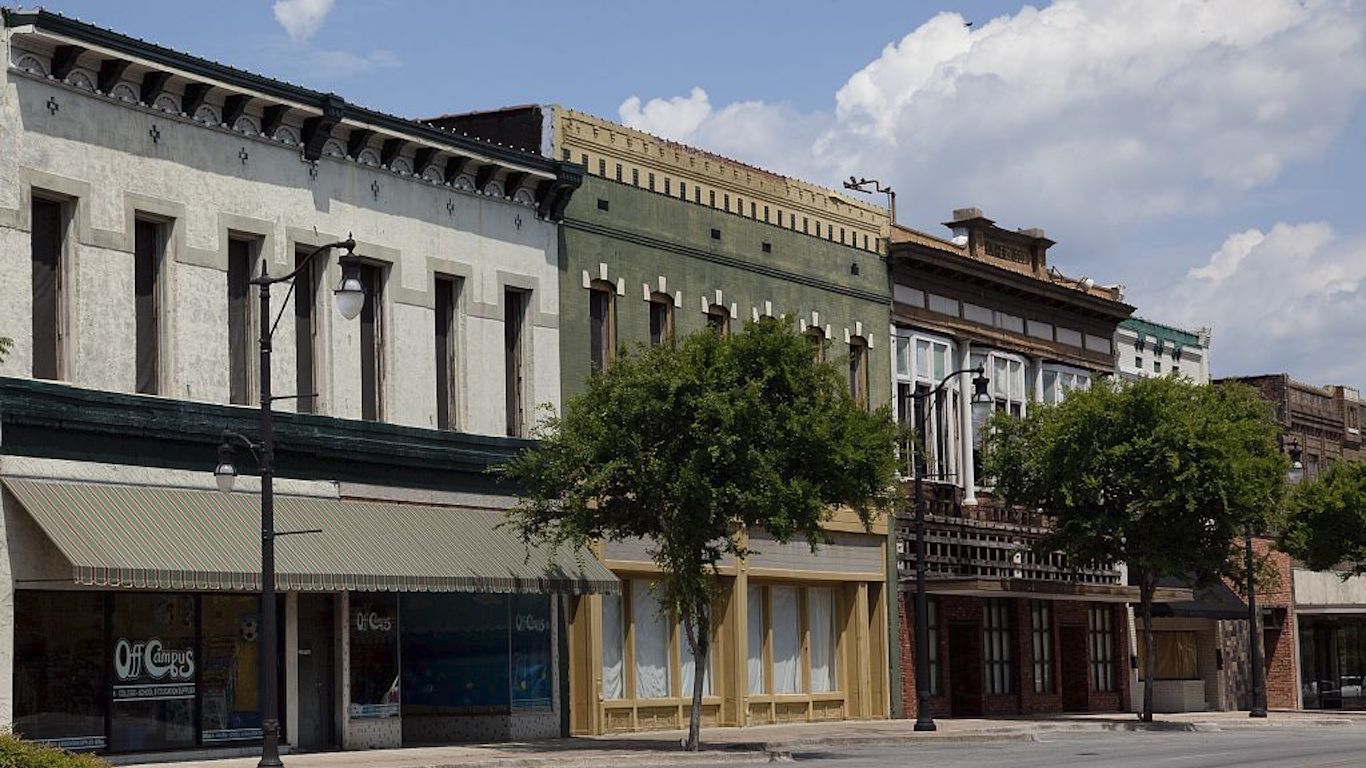
25. Abilene, Texas
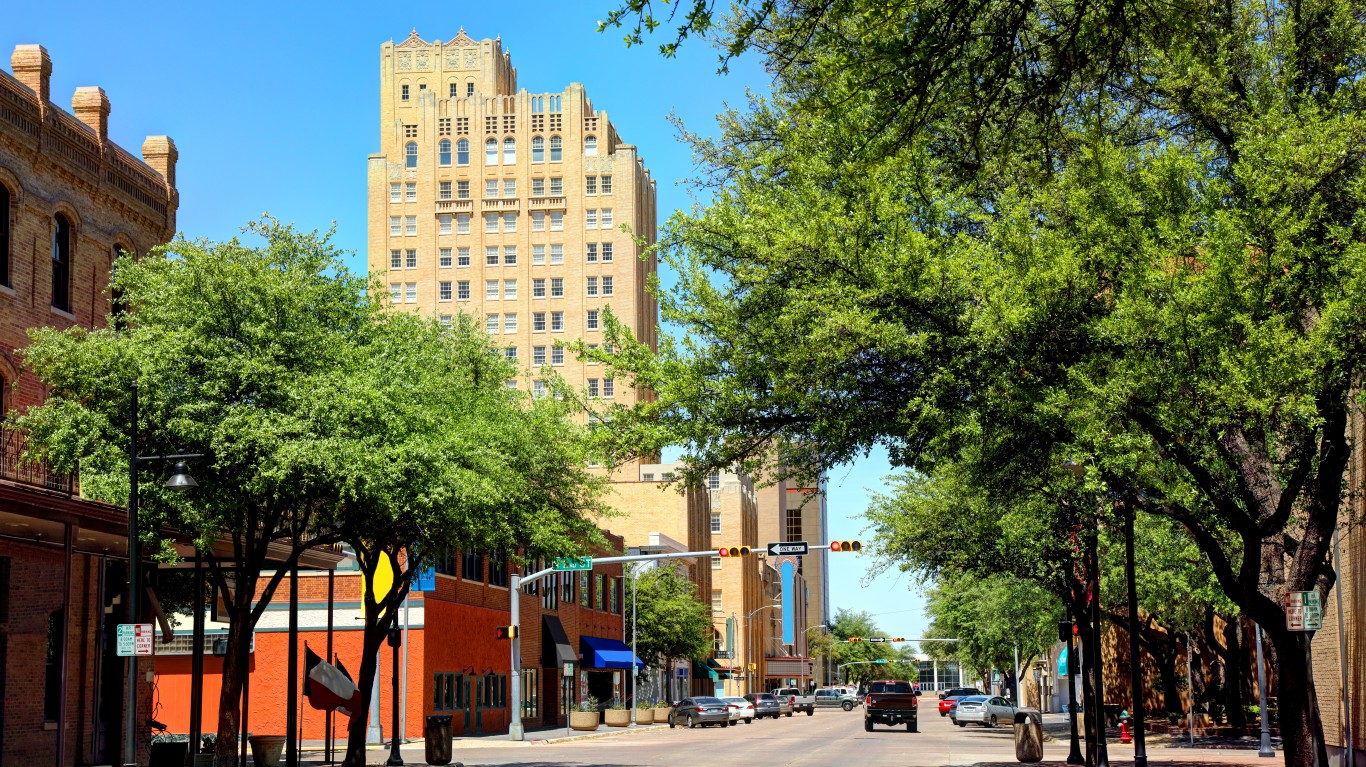
- Population change in downtown tracts from 2012 to 2022: -13.3%
- Population change of non-downtown tracts from 2012 to 2022: +3.3%
- Per capita income change in downtown tracts from 2012 to 2022: +4.8%
- Per capita income change in non-downtown tracts from 2012 to 2022: +7.5%
24. Cumberland, Maryland
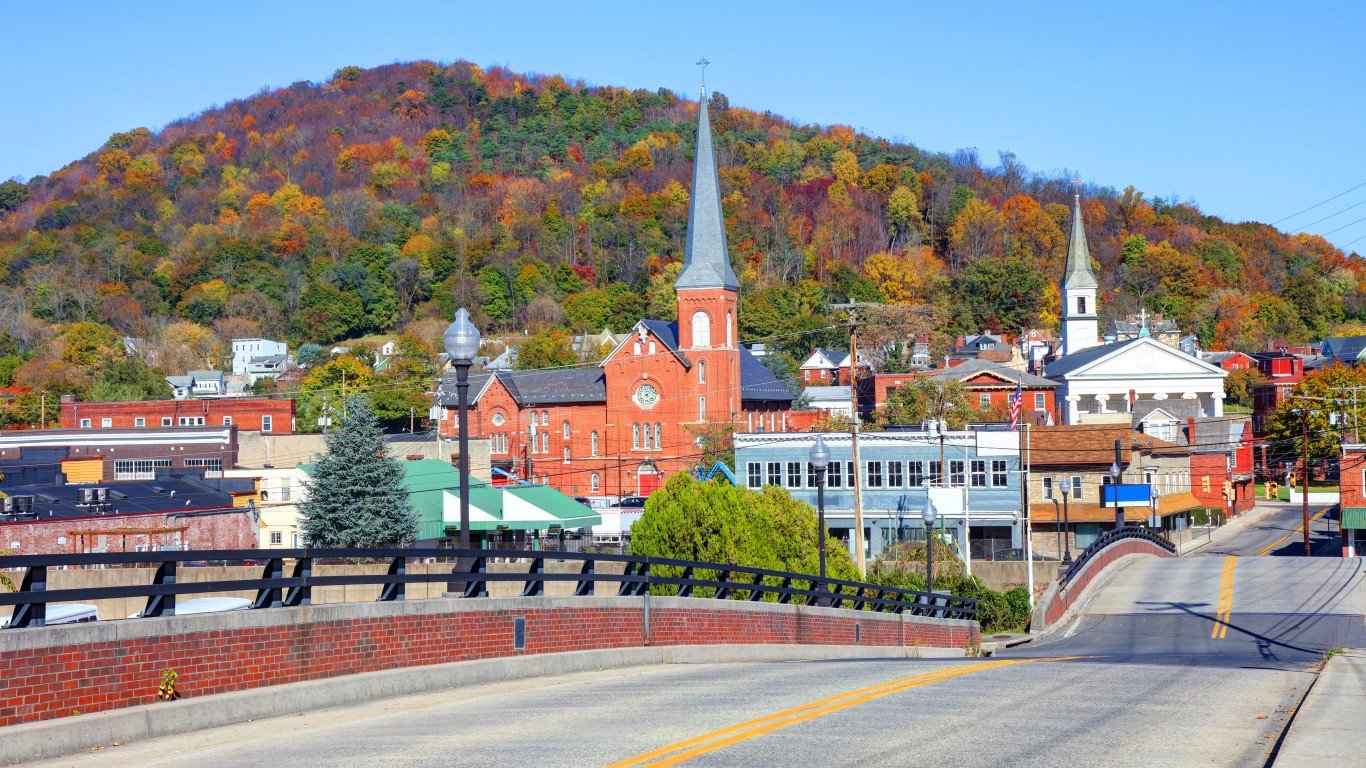
- Population change in downtown tracts from 2012 to 2022: -13.4%
- Population change of non-downtown tracts from 2012 to 2022: -7.4%
- Per capita income change in downtown tracts from 2012 to 2022: +5.1%
- Per capita income change in non-downtown tracts from 2012 to 2022: +14.8%
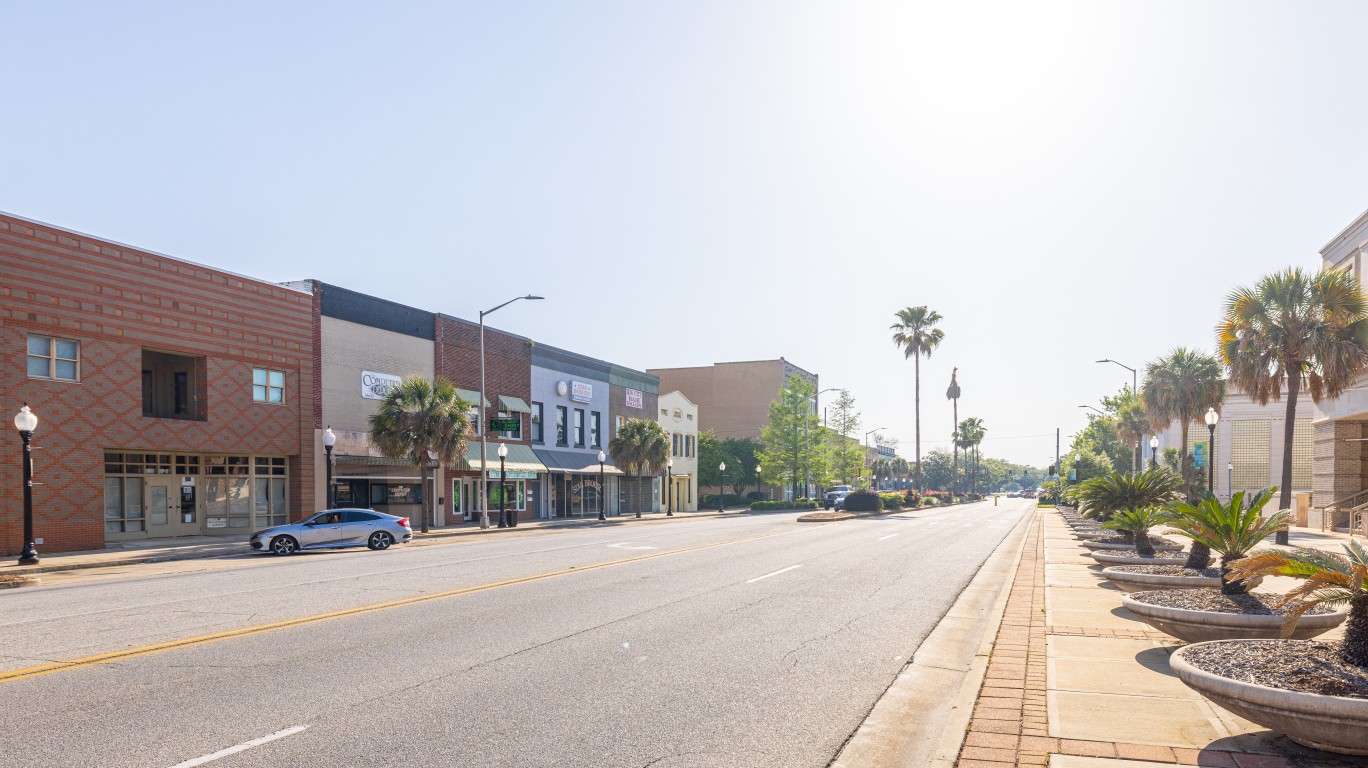
23. Panama City, Florida
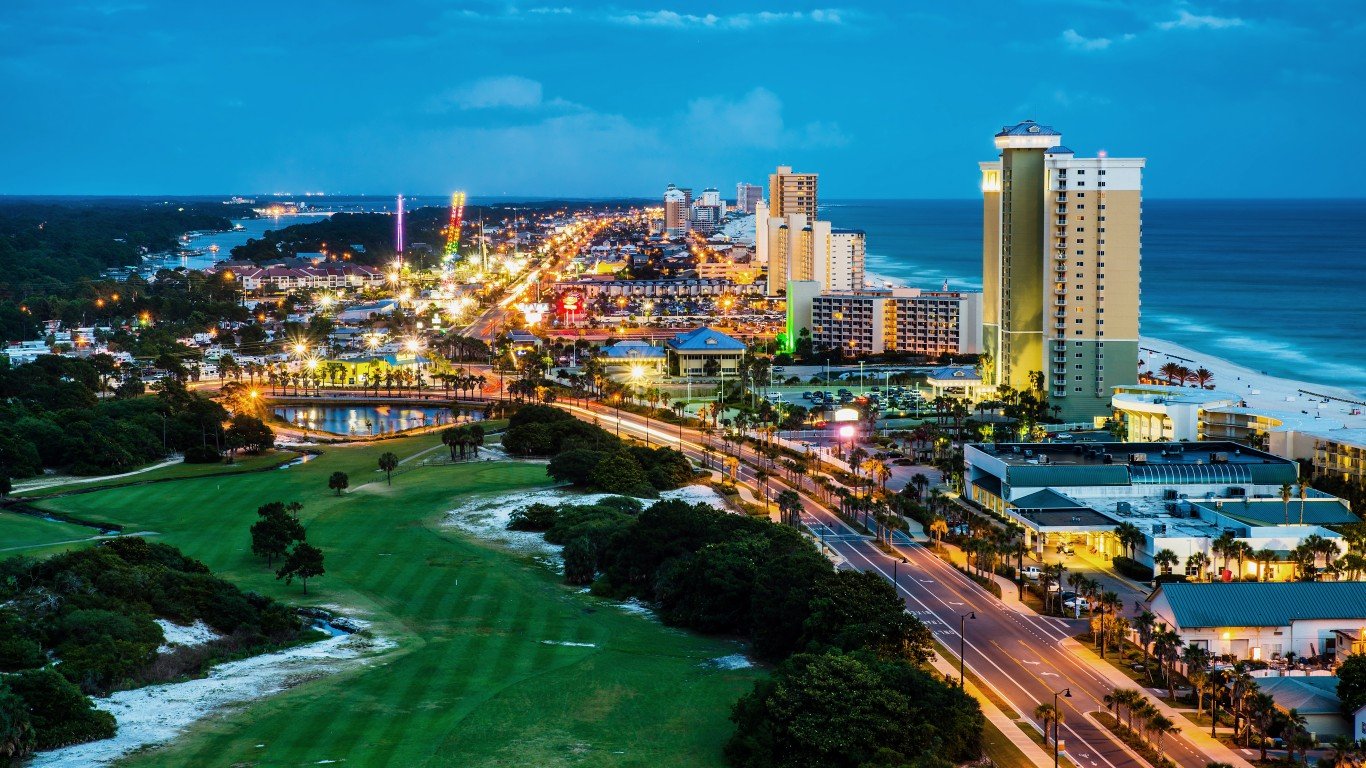
- Population change in downtown tracts from 2012 to 2022: -13.8%
- Population change of non-downtown tracts from 2012 to 2022: -7.9%
- Per capita income change in downtown tracts from 2012 to 2022: +20.6%
- Per capita income change in non-downtown tracts from 2012 to 2022: +17.1%
22. Decatur, Illinois

- Population change in downtown tracts from 2012 to 2022: -14.7%
- Population change of non-downtown tracts from 2012 to 2022: -7.4%
- Per capita income change in downtown tracts from 2012 to 2022: +9.4%
- Per capita income change in non-downtown tracts from 2012 to 2022: +6.2%
21. Kankakee, Illinois
- Population change in downtown tracts from 2012 to 2022: -14.9%
- Population change of non-downtown tracts from 2012 to 2022: +3.6%
- Per capita income change in downtown tracts from 2012 to 2022: +19.4%
- Per capita income change in non-downtown tracts from 2012 to 2022: +2.7%
20. Naples, Florida

- Population change in downtown tracts from 2012 to 2022: -15.0%
- Population change of non-downtown tracts from 2012 to 2022: +3.3%
- Per capita income change in downtown tracts from 2012 to 2022: +31.1%
- Per capita income change in non-downtown tracts from 2012 to 2022: +29.3%
19. Laredo, Texas
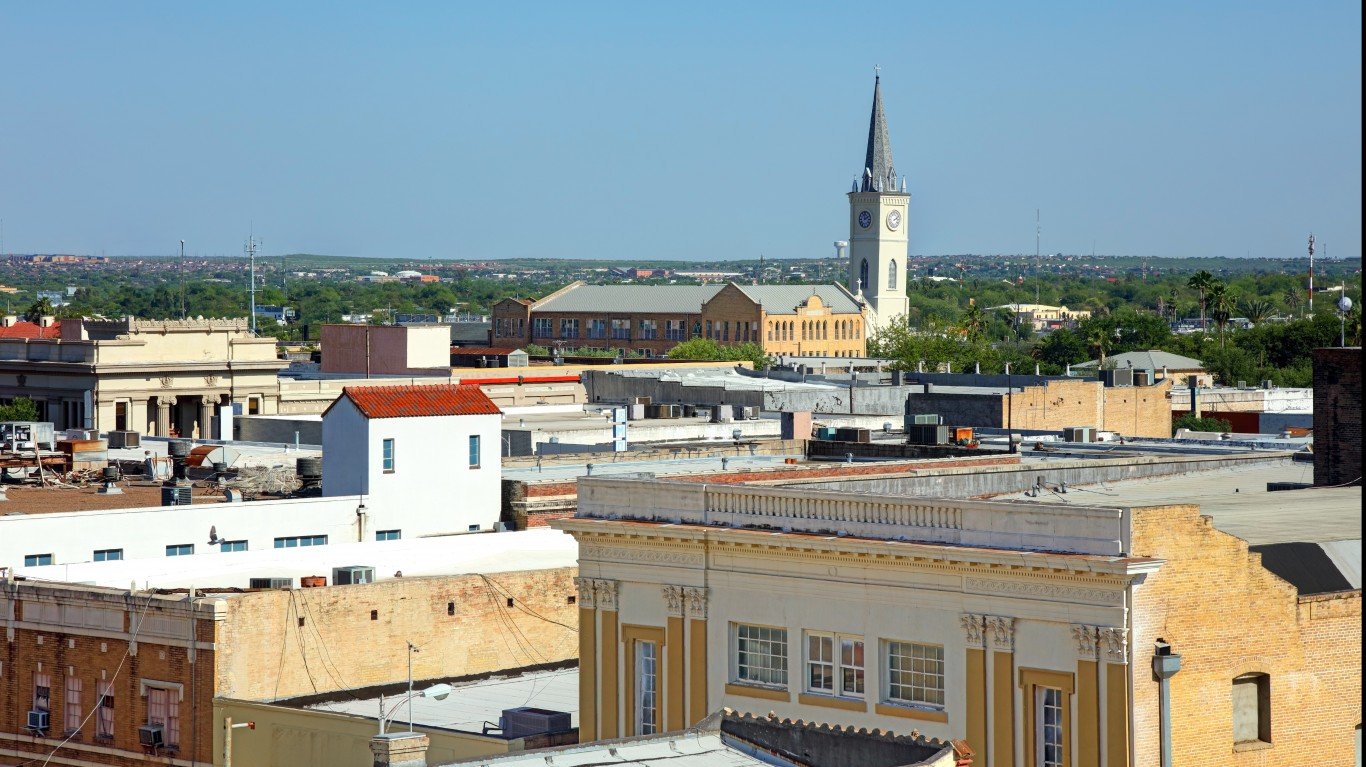
- Population change in downtown tracts from 2012 to 2022: -15.4%
- Population change of non-downtown tracts from 2012 to 2022: +5.4%
- Per capita income change in downtown tracts from 2012 to 2022: +27.8%
- Per capita income change in non-downtown tracts from 2012 to 2022: +22.2%
18. Evansville, Indiana
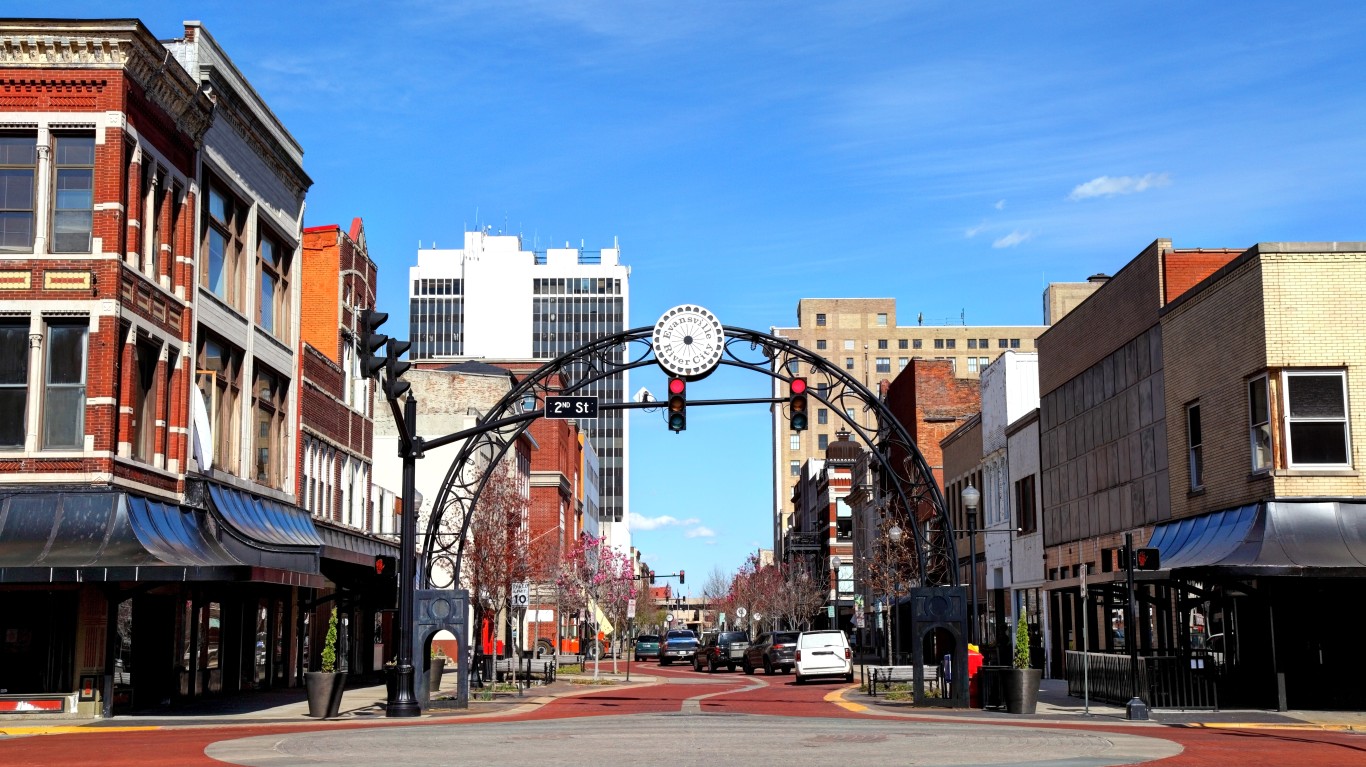
- Population change in downtown tracts from 2012 to 2022: -15.6%
- Population change of non-downtown tracts from 2012 to 2022: +0.2%
- Per capita income change in downtown tracts from 2012 to 2022: +10.5%
- Per capita income change in non-downtown tracts from 2012 to 2022: +8.6%
17. Lima, Ohio
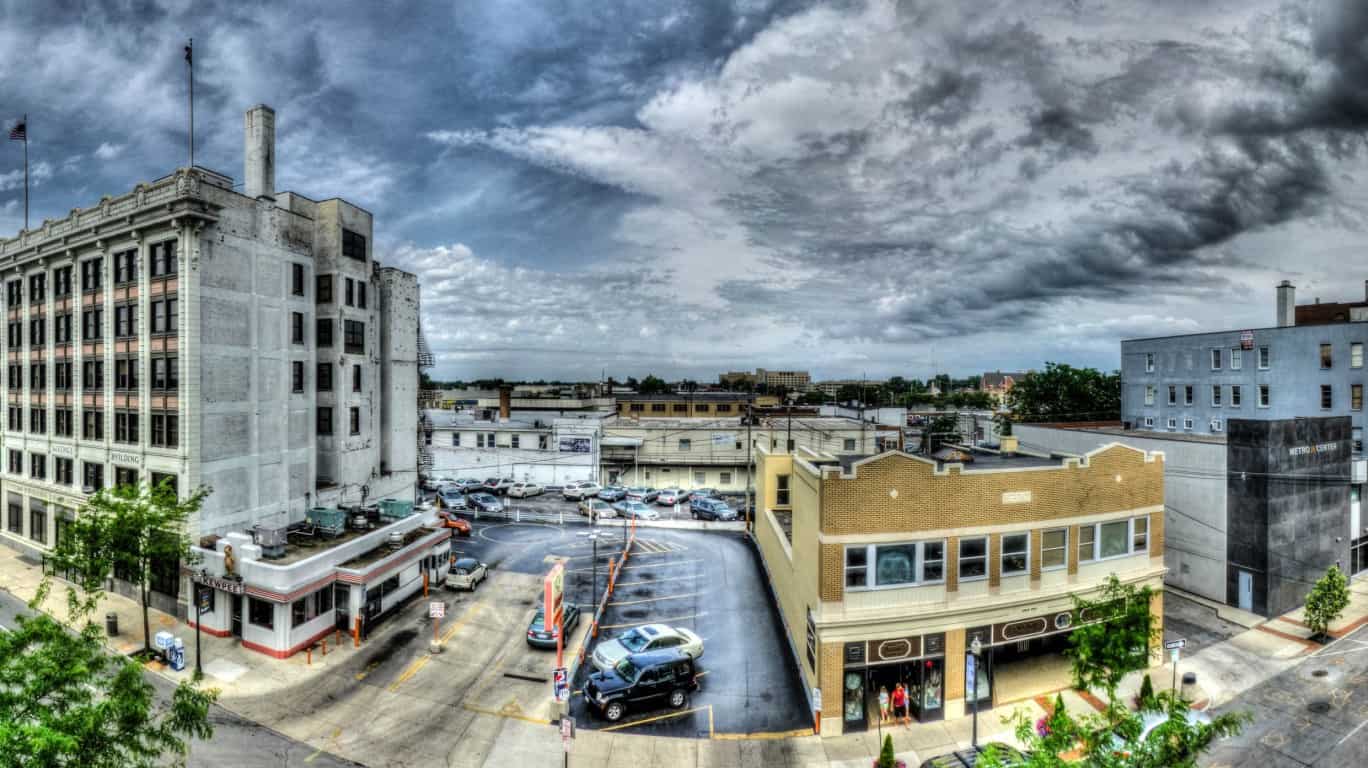
- Population change in downtown tracts from 2012 to 2022: -16.0%
- Population change of non-downtown tracts from 2012 to 2022: +8.3%
- Per capita income change in downtown tracts from 2012 to 2022: +17.7%
- Per capita income change in non-downtown tracts from 2012 to 2022: -1.3%
16. Flint, Michigan

- Population change in downtown tracts from 2012 to 2022: -16.9%
- Population change of non-downtown tracts from 2012 to 2022: -22.0%
- Per capita income change in downtown tracts from 2012 to 2022: +19.1%
- Per capita income change in non-downtown tracts from 2012 to 2022: +7.1%
15. Yuma, Arizona
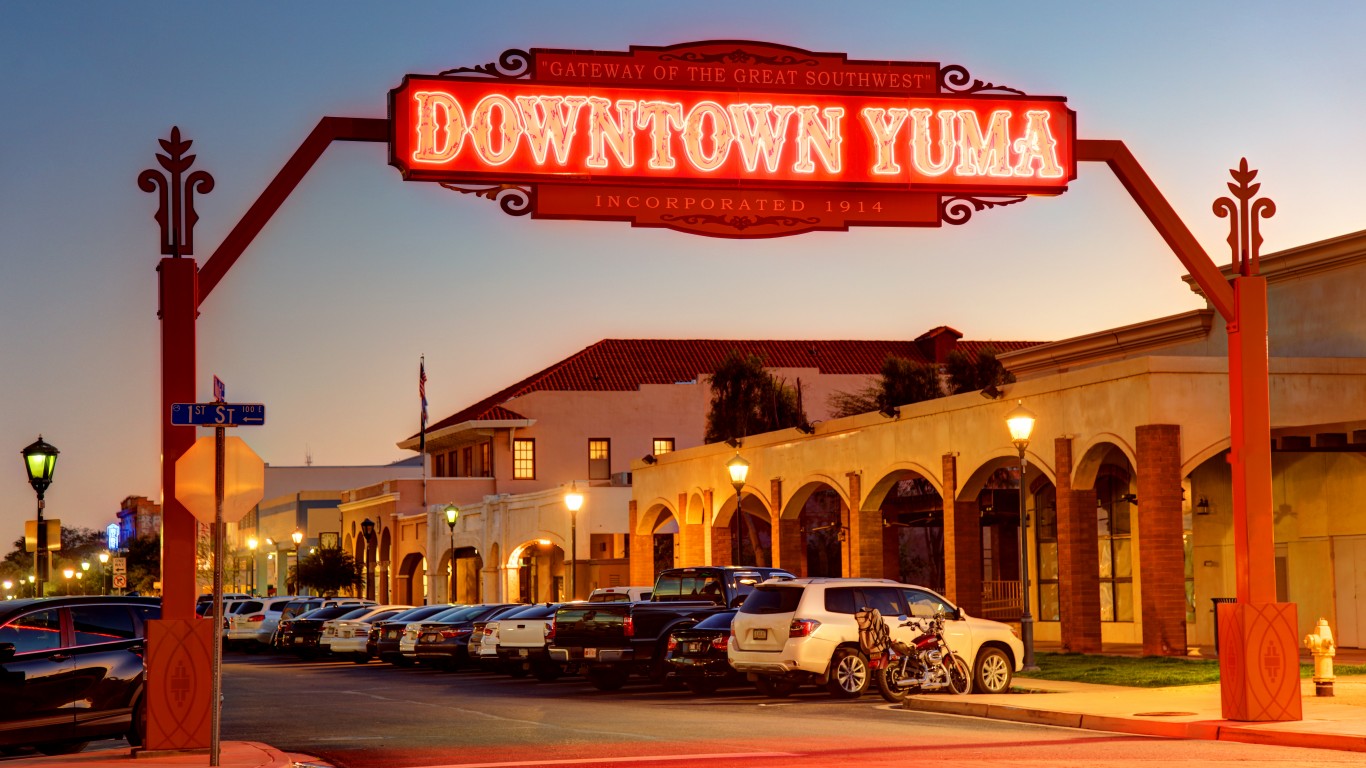
- Population change in downtown tracts from 2012 to 2022: -17.0%
- Population change of non-downtown tracts from 2012 to 2022: -5.4%
- Per capita income change in downtown tracts from 2012 to 2022: +23.6%
- Per capita income change in non-downtown tracts from 2012 to 2022: +19.6%
14. Bangor, Maine
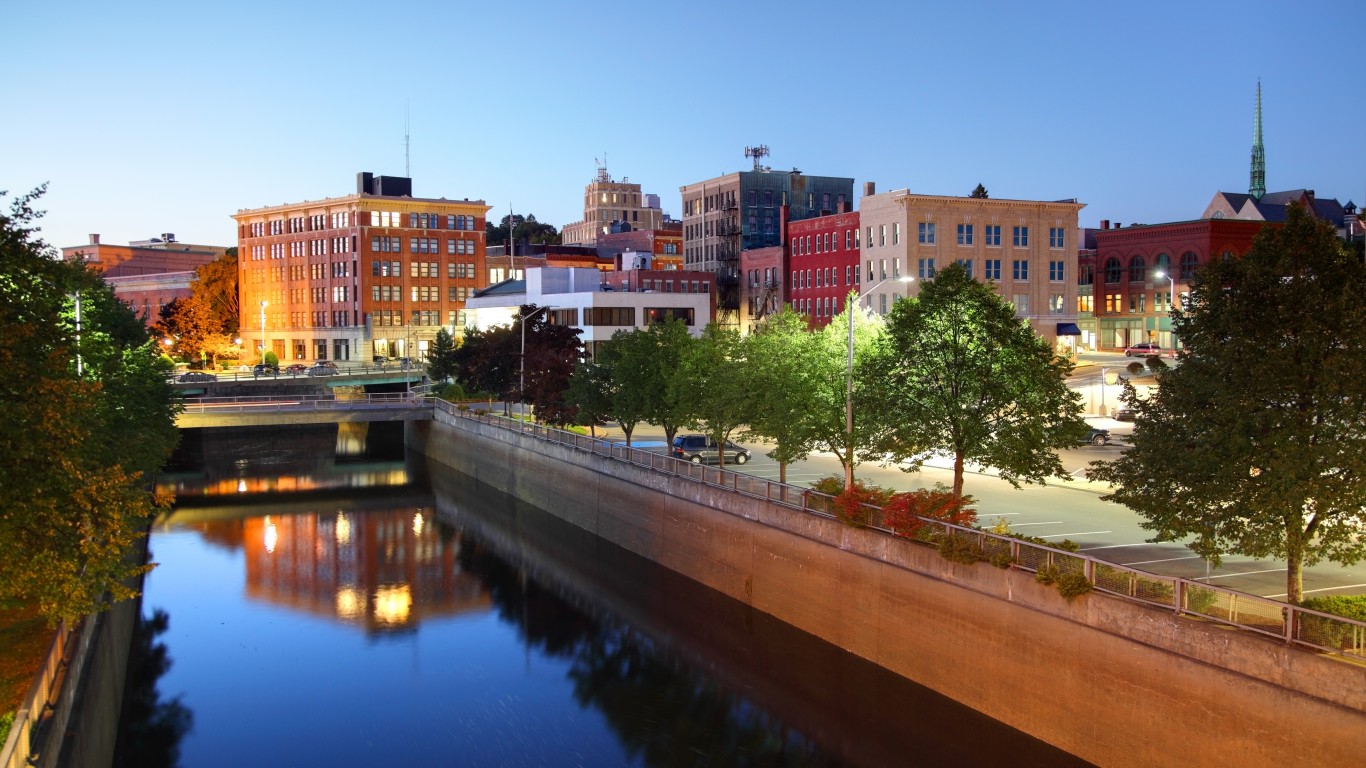
- Population change in downtown tracts from 2012 to 2022: -17.2%
- Population change of non-downtown tracts from 2012 to 2022: +4.4%
- Per capita income change in downtown tracts from 2012 to 2022: +25.7%
- Per capita income change in non-downtown tracts from 2012 to 2022: +16.7%
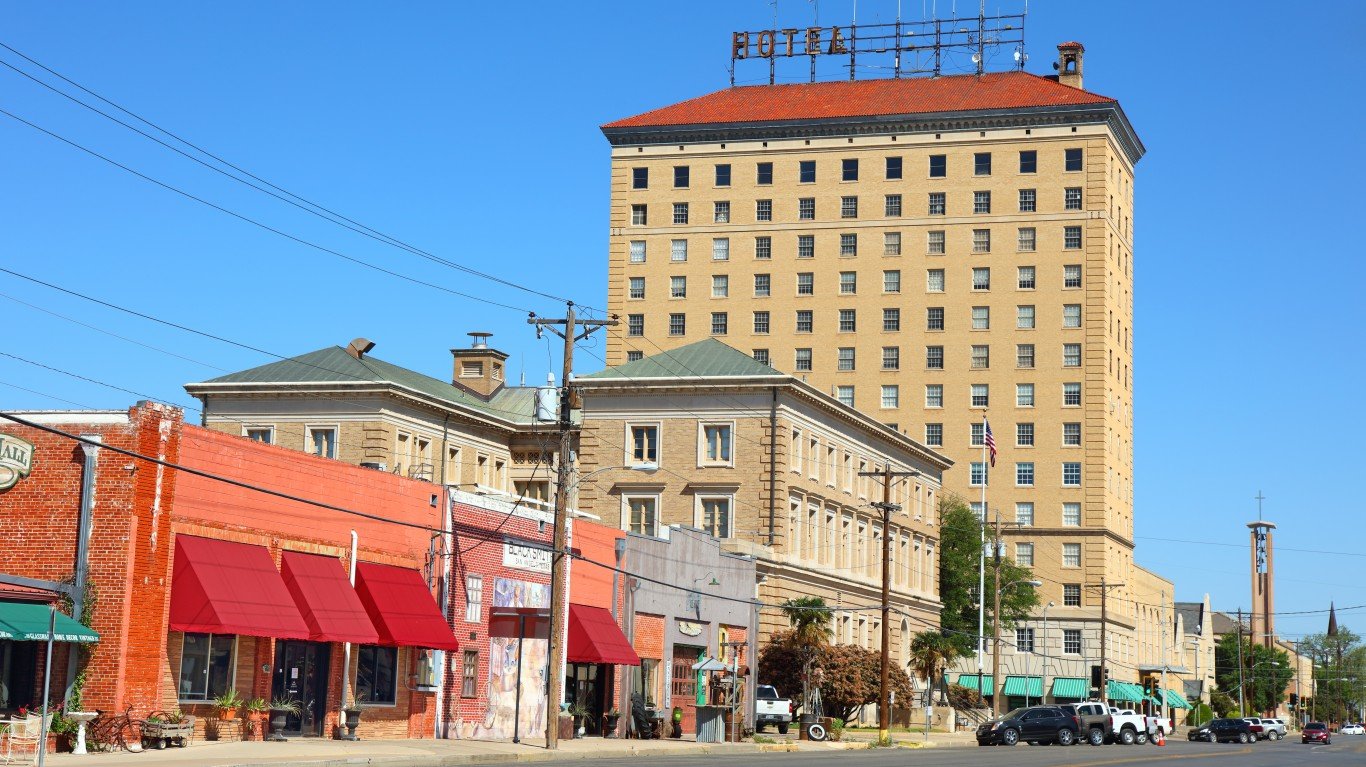
13. Victoria, Texas
- Population change in downtown tracts from 2012 to 2022: -17.8%
- Population change of non-downtown tracts from 2012 to 2022: +5.7%
- Per capita income change in downtown tracts from 2012 to 2022: -6.3%
- Per capita income change in non-downtown tracts from 2012 to 2022: +2.1%
12. Topeka, Kansas
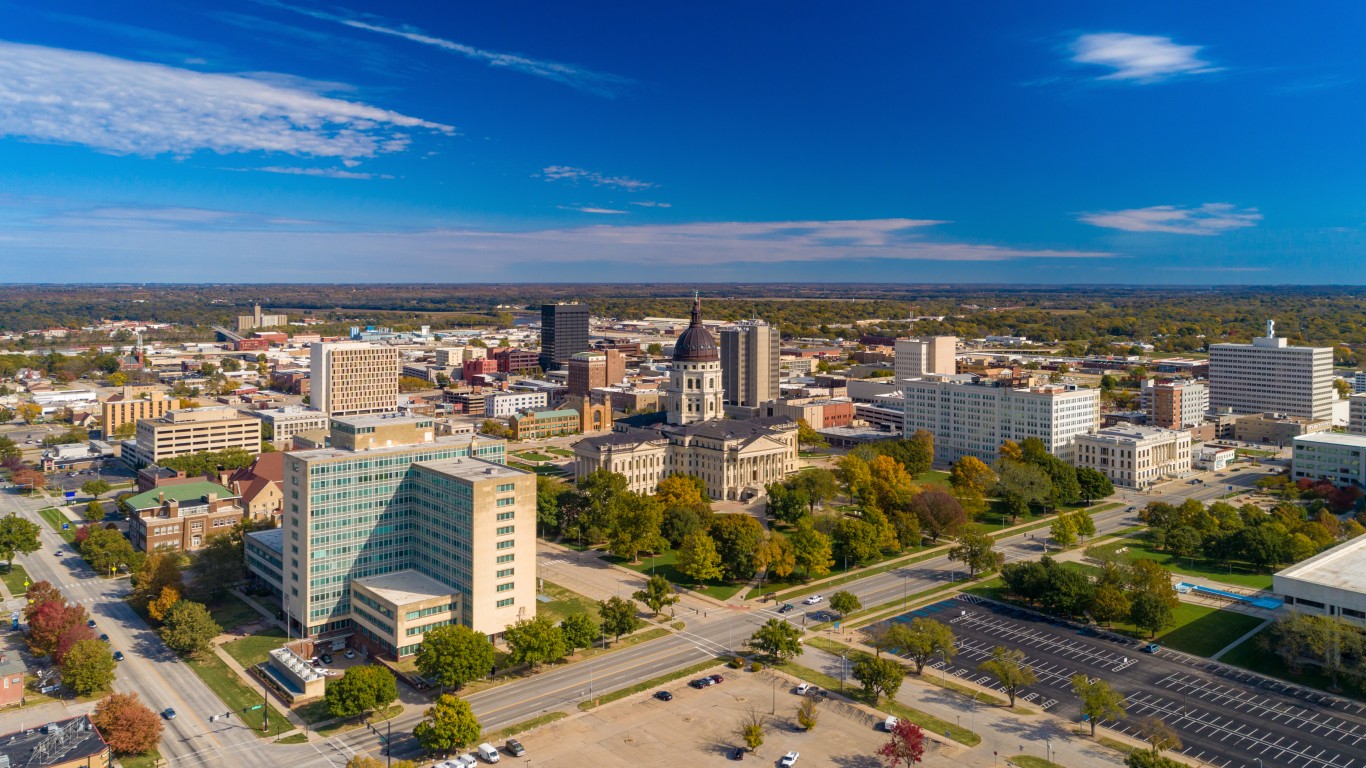
- Population change in downtown tracts from 2012 to 2022: -18.4%
- Population change of non-downtown tracts from 2012 to 2022: +3.2%
- Per capita income change in downtown tracts from 2012 to 2022: +33.2%
- Per capita income change in non-downtown tracts from 2012 to 2022: +5.0%
11. Savannah, Georgia
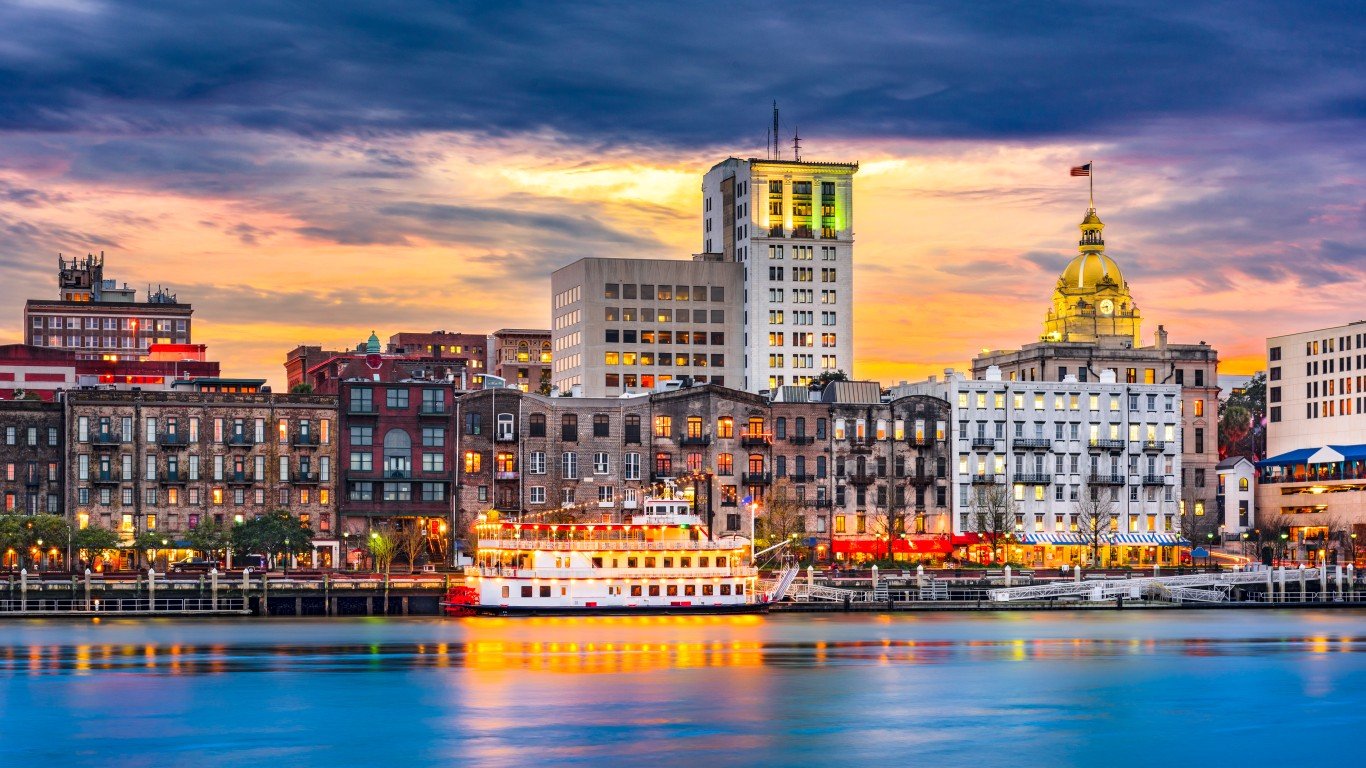
- Population change in downtown tracts from 2012 to 2022: -18.4%
- Population change of non-downtown tracts from 2012 to 2022: +1.8%
- Per capita income change in downtown tracts from 2012 to 2022: +76.9%
- Per capita income change in non-downtown tracts from 2012 to 2022: +15.2%
10. Texarkana, Texas
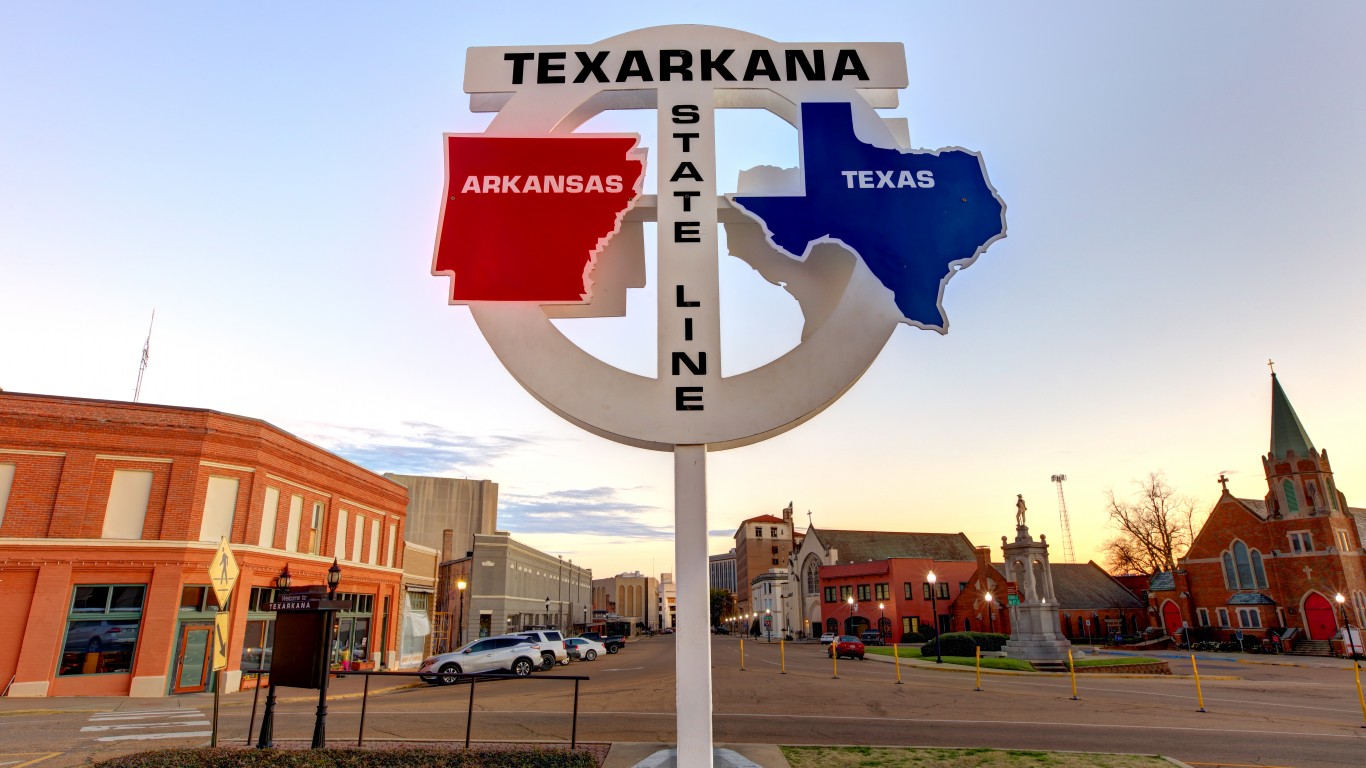
- Population change in downtown tracts from 2012 to 2022: -19.9%
- Population change of non-downtown tracts from 2012 to 2022: -2.2%
- Per capita income change in downtown tracts from 2012 to 2022: +28.7%
- Per capita income change in non-downtown tracts from 2012 to 2022: +1.3%
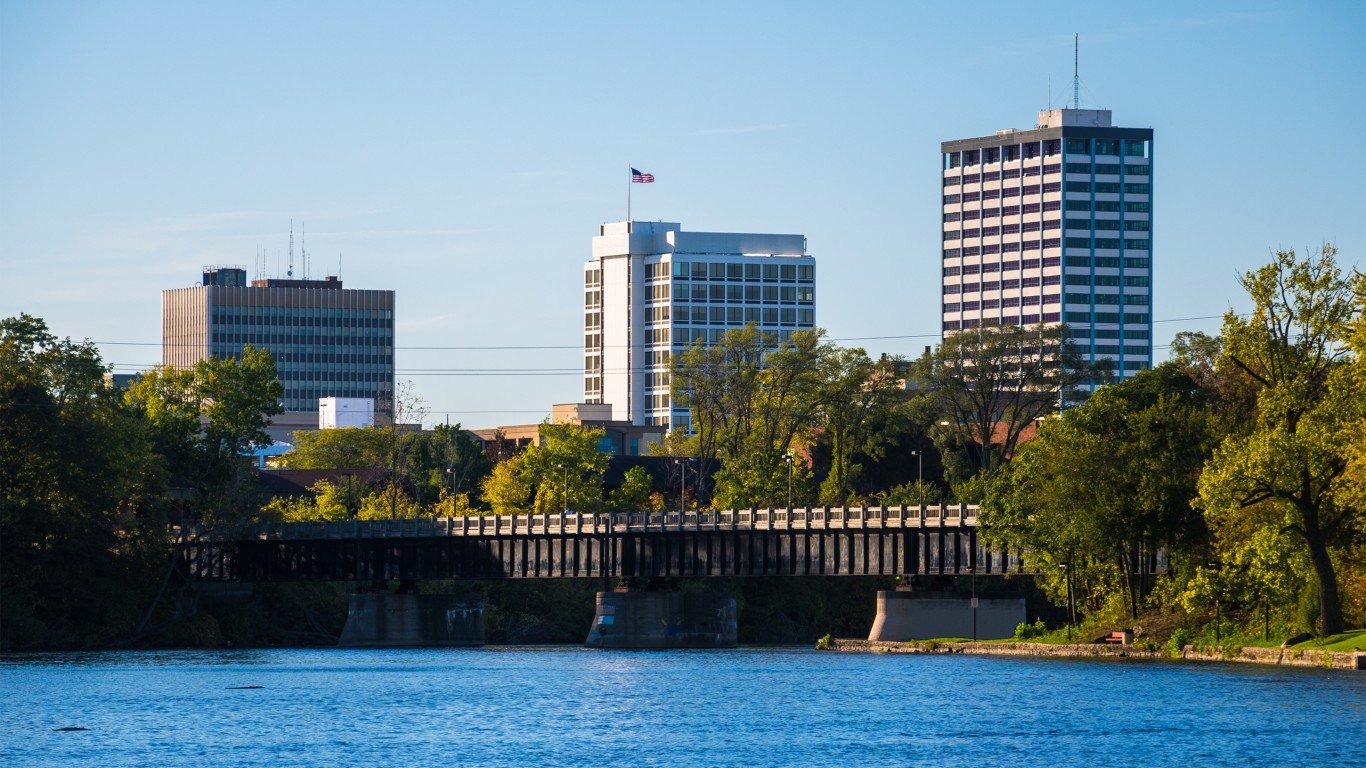
9. Saginaw, Michigan
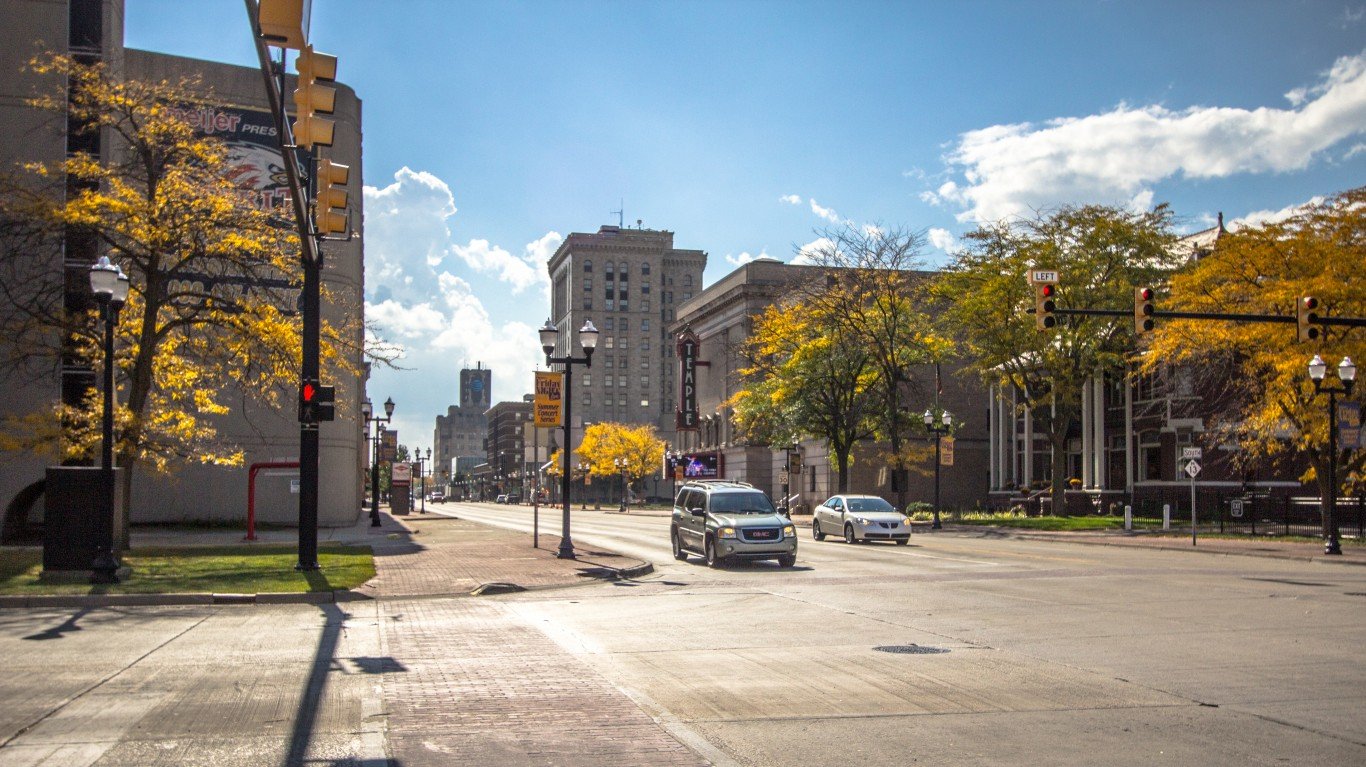
- Population change in downtown tracts from 2012 to 2022: -20.2%
- Population change of non-downtown tracts from 2012 to 2022: -11.8%
- Per capita income change in downtown tracts from 2012 to 2022: +26.4%
- Per capita income change in non-downtown tracts from 2012 to 2022: -0.6%
8. Sumter, South Carolina

- Population change in downtown tracts from 2012 to 2022: -21.0%
- Population change of non-downtown tracts from 2012 to 2022: +9.6%
- Per capita income change in downtown tracts from 2012 to 2022: -7.5%
- Per capita income change in non-downtown tracts from 2012 to 2022: -9.5%
7. Shreveport, Louisiana
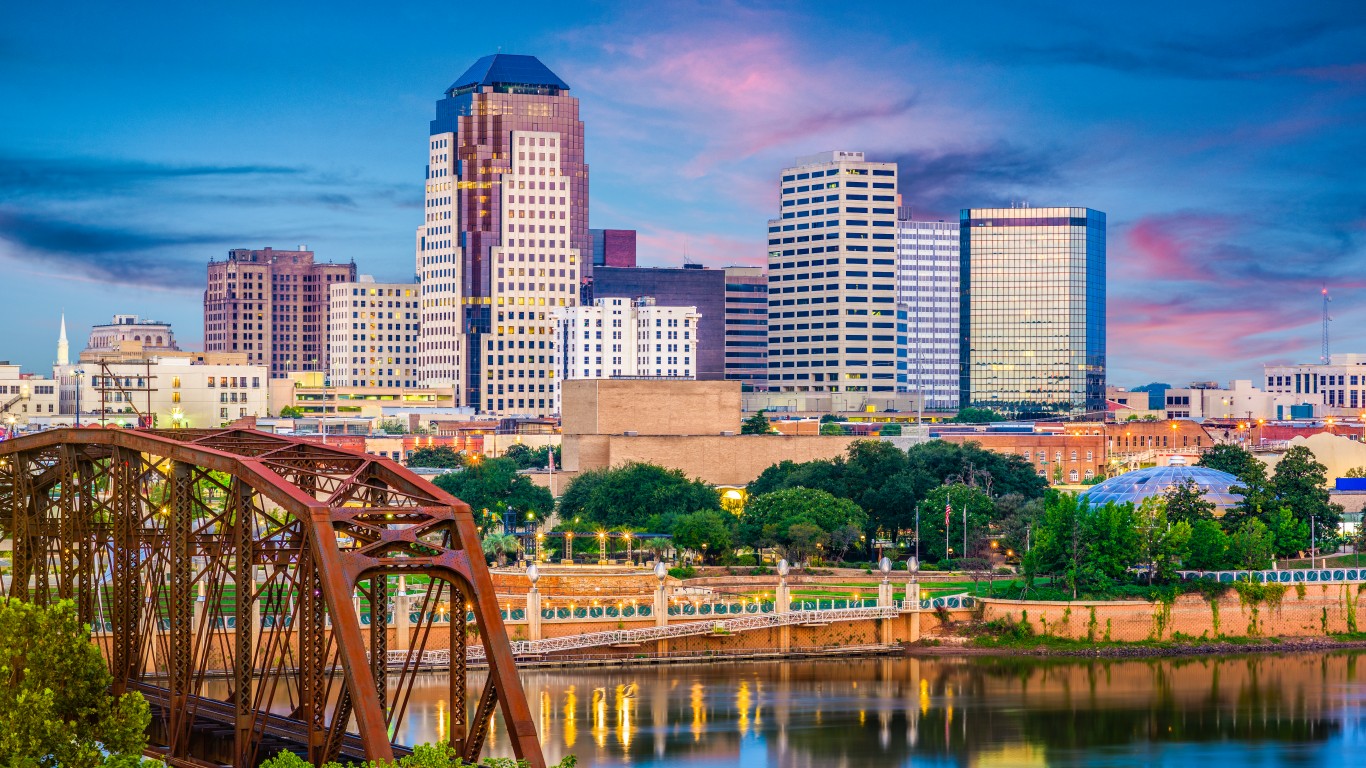
- Population change in downtown tracts from 2012 to 2022: -21.0%
- Population change of non-downtown tracts from 2012 to 2022: -8.9%
- Per capita income change in downtown tracts from 2012 to 2022: +92.2%
- Per capita income change in non-downtown tracts from 2012 to 2022: -1.2%
6. Alexandria, Louisiana
- Population change in downtown tracts from 2012 to 2022: -21.3%
- Population change of non-downtown tracts from 2012 to 2022: -1.0%
- Per capita income change in downtown tracts from 2012 to 2022: +29.3%
- Per capita income change in non-downtown tracts from 2012 to 2022: -10.3%
5. Anniston, Alabama
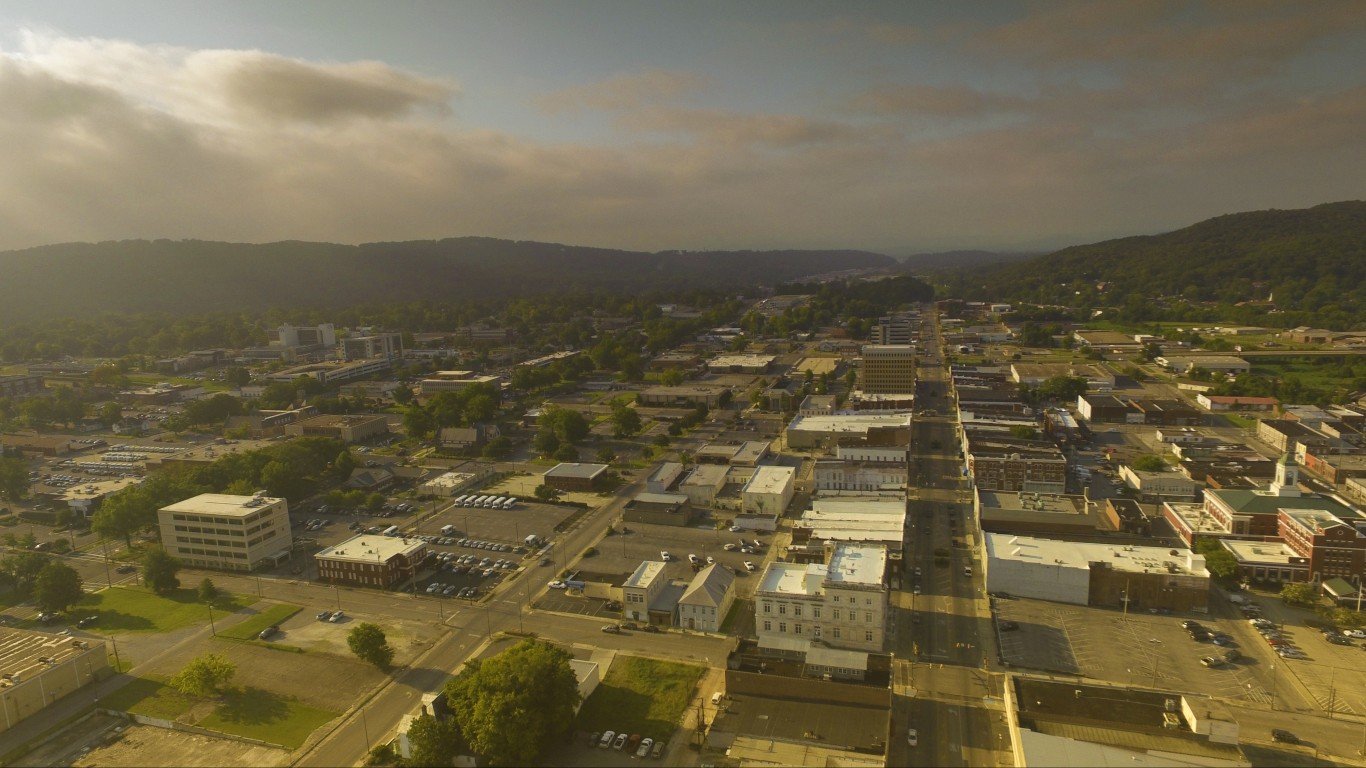
- Population change in downtown tracts from 2012 to 2022: -22.2%
- Population change of non-downtown tracts from 2012 to 2022: +5.9%
- Per capita income change in downtown tracts from 2012 to 2022: +10.5%
- Per capita income change in non-downtown tracts from 2012 to 2022: +4.9%
4. Birmingham, Alabama

- Population change in downtown tracts from 2012 to 2022: -22.5%
- Population change of non-downtown tracts from 2012 to 2022: -9.6%
- Per capita income change in downtown tracts from 2012 to 2022: +28.7%
- Per capita income change in non-downtown tracts from 2012 to 2022: +15.6%
3. Columbus, Georgia
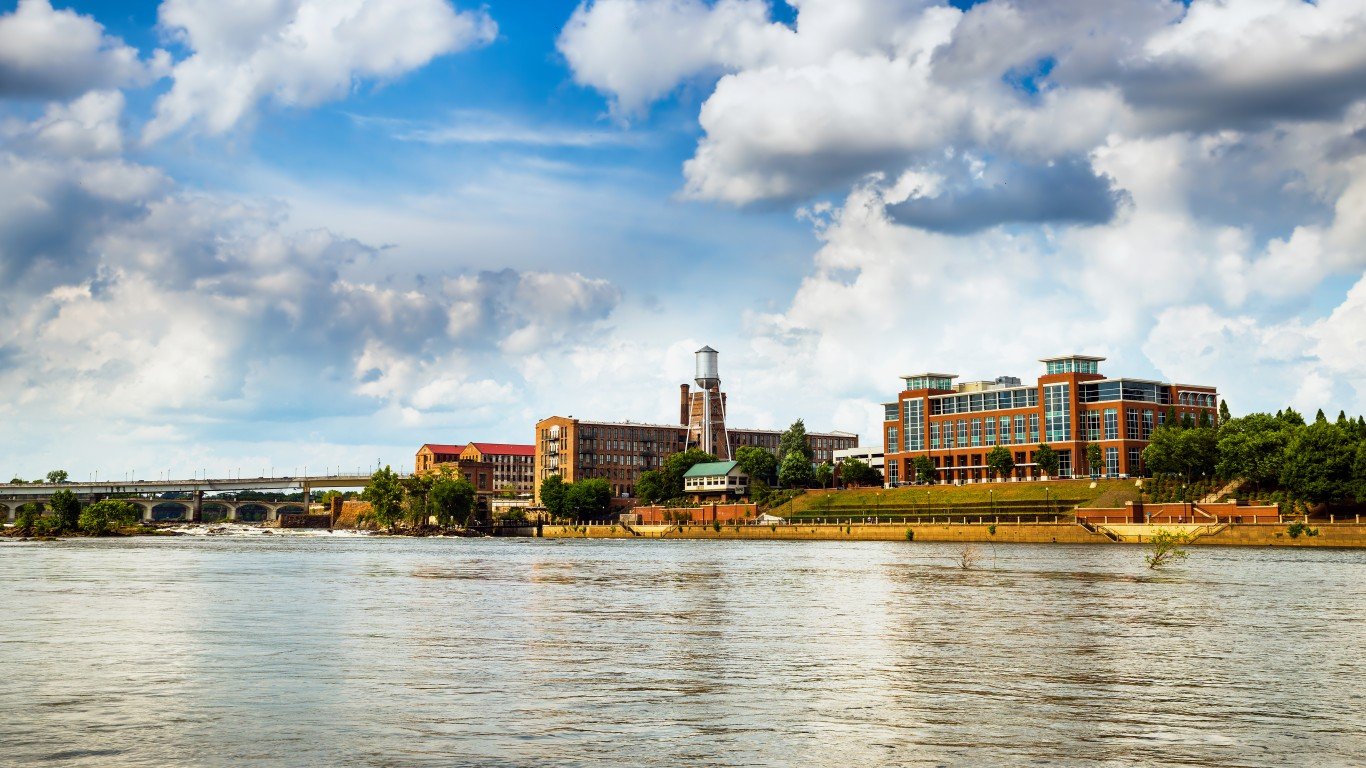
- Population change in downtown tracts from 2012 to 2022: -25.4%
- Population change of non-downtown tracts from 2012 to 2022: +3.6%
- Per capita income change in downtown tracts from 2012 to 2022: +41.4%
- Per capita income change in non-downtown tracts from 2012 to 2022: +1.0%
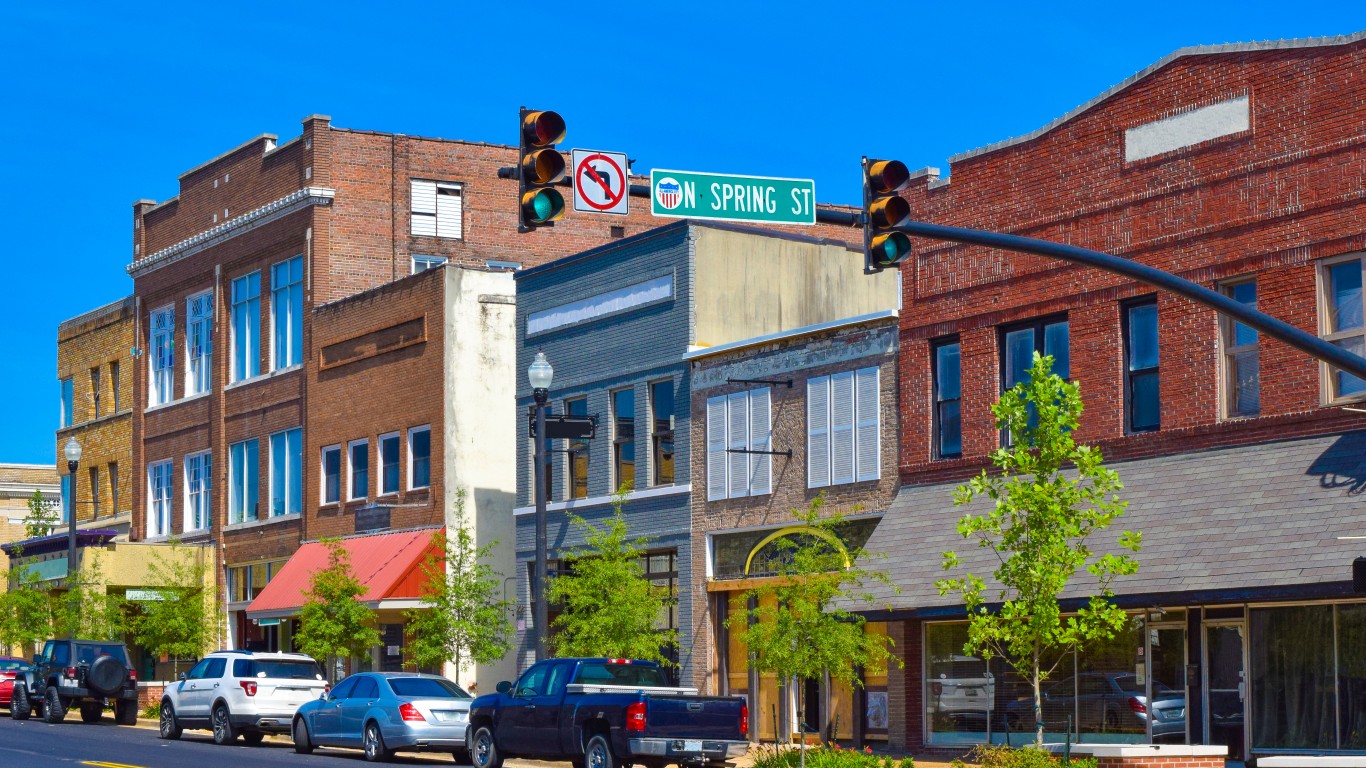
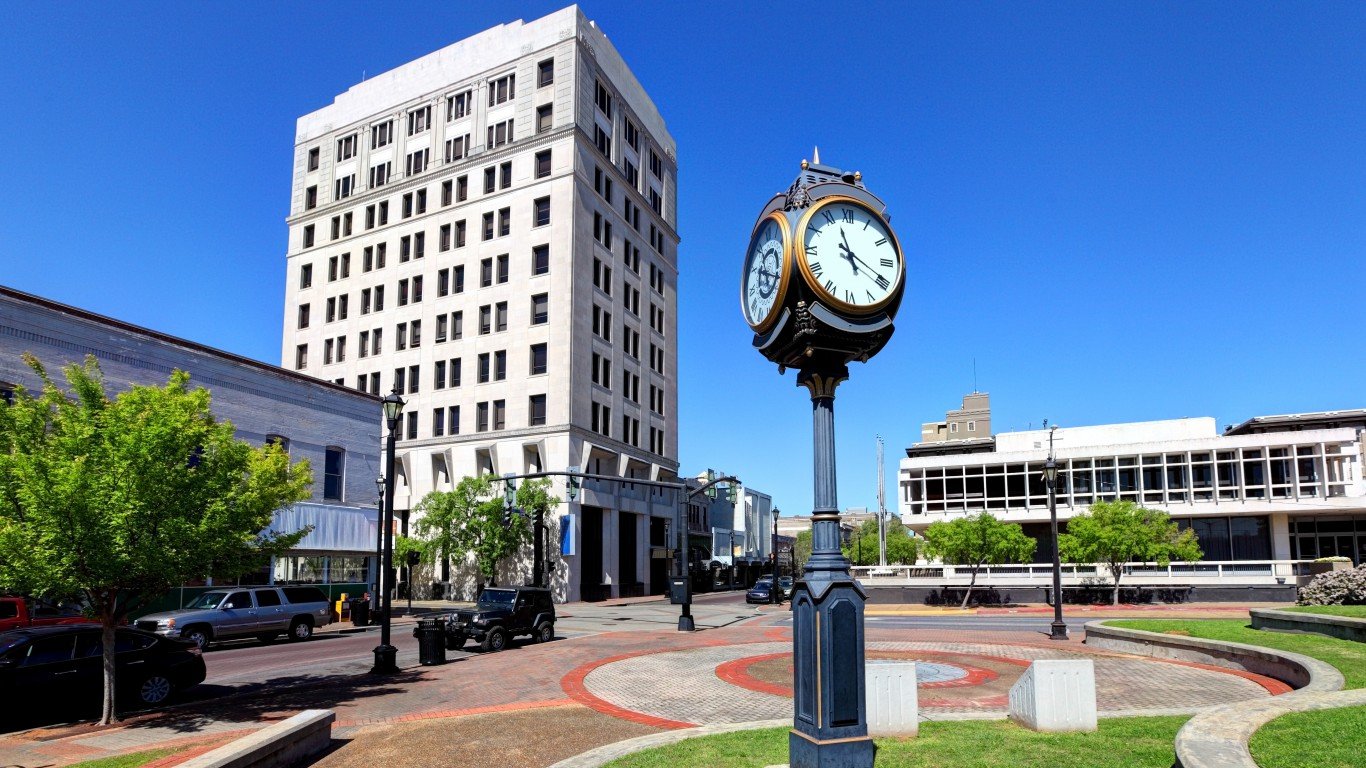
2. Pine Bluff, Arkansas
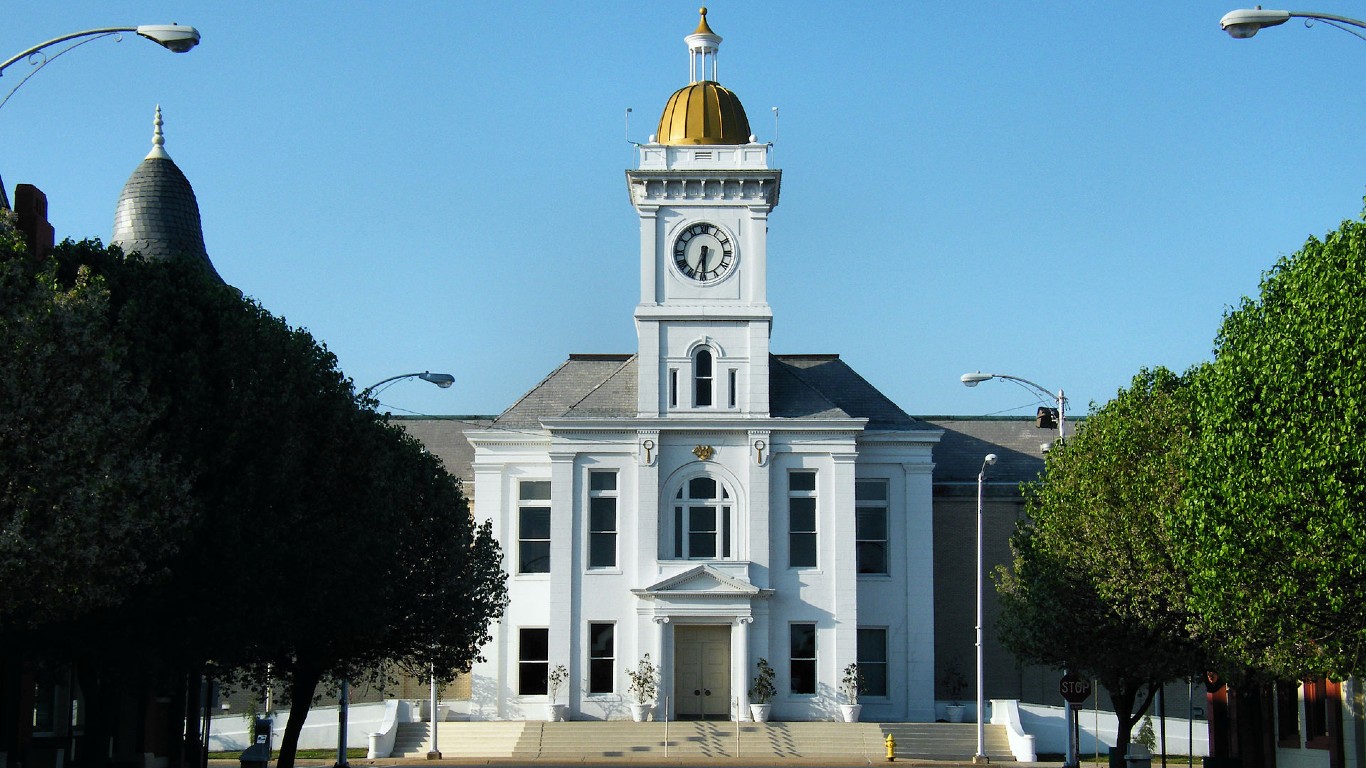
- Population change in downtown tracts from 2012 to 2022: -30.5%
- Population change of non-downtown tracts from 2012 to 2022: -10.0%
- Per capita income change in downtown tracts from 2012 to 2022: +19.1%
- Per capita income change in non-downtown tracts from 2012 to 2022: +1.4%
1. Albany, Georgia
- Population change in downtown tracts from 2012 to 2022: -39.3%
- Population change of non-downtown tracts from 2012 to 2022: -4.0%
- Per capita income change in downtown tracts from 2012 to 2022: +23.7%
- Per capita income change in non-downtown tracts from 2012 to 2022: +1.9%
The post This American City Has Lost Nearly 40% of Its Downtown’s Population in Just 10 Years appeared first on 24/7 Wall St..