


These Are the Cities Hit Hardest by Poverty in Every U.S. State
President Trump had previously fired many employees at the Department of Health and Human Services (HHS). It was later revealed that the firings included the entire office responsible for setting federal poverty guidelines. These guidelines are used by government assistance programs to determine eligibility for benefits such as food assistance (SNAP), Head Start, the National […] The post These Are the Cities Hit Hardest by Poverty in Every U.S. State appeared first on 24/7 Wall St..
President Trump had previously fired many employees at the Department of Health and Human Services (HHS). It was later revealed that the firings included the entire office responsible for setting federal poverty guidelines. These guidelines are used by government assistance programs to determine eligibility for benefits such as food assistance (SNAP), Head Start, the National School Lunch Program, Medicaid, and other services. Experts say that firing the team of employees responsible for issuing the poverty guidelines may affect the benefits of nearly 80 million Americans. It’s also the legal duty of the HHS to issue updated poverty guidelines each year. The poverty level must be adjusted each year to account for inflation and other factors.
The possible disruption of measuring the poverty level comes at a time when Americans are being hit by rising inflation. Inflation affects everyone, but those at lower income levels are hit the hardest. According to the U.S. Census Bureau, 36.8 million people lived in poverty in 2023.)
24/7 Wall St. identified the poorest city within each state by reviewing data from the U.S. Census Bureau’s 2023 American Community Survey. Each city on the list has the lowest median household income in the state. All cities, towns, municipalities, and unincorporated communities with populations of at least 50,000 were considered. Neither Vermont nor West Virginia is home to a community with a population of 50,000 or more, and as a result, these states were excluded from analysis. In three states, Alaska, Delaware, and Maine, only one city met the population threshold. As a result, the listed city in these states ranks as the poorest by default only, and is noted as such. All supplemental data is also from the ACS. In some states, median household incomes are higher than in others. As a result, there are states where even the lowest-income city has a relatively high-earning population. Still, except for Alaska and Maine (states where the listed city ranks by default only), the median income in every state’s poorest city is less than the comparable statewide median income, often by tens of thousands of dollars.
(This article was updated on April 22, 2025, to reflect recent political news regarding the firing of the HHS employees who are responsible for setting federal poverty guidelines.)
Why It Matters Now
Consumer prices have surged in recent years, and while no American has been spared, inflation has a disproportionate impact on lower-income households. While cities are generally economic engines, nearly every state is home to at least one city where incomes are well below what is typical across the state as a whole. Residents of these places are more likely to report inflation-related stress and difficulty paying for usual expenses.
These are the poorest cities in each state:
Alabama: Birmingham

- Median household income in 2023: $44,376 (statewide: $62,027)
- Median home value in 2023: $138,600 (statewide: $195,100)
- Adults with a bachelor’s degree or higher: 30.7% (statewide: 27.8%)
- Poverty rate: 25.2% (statewide: 15.6%)
Alaska: Anchorage (poorest by default)

- Median household income in 2023: $98,152 (statewide: $89,336)
- Median home value in 2023: $375,900 (statewide: $333,300)
- Adults with a bachelor’s degree or higher: 37.7% (statewide: 31.2%)
- Poverty rate: 9.3% (statewide: 10.2%)
Arizona: Tucson
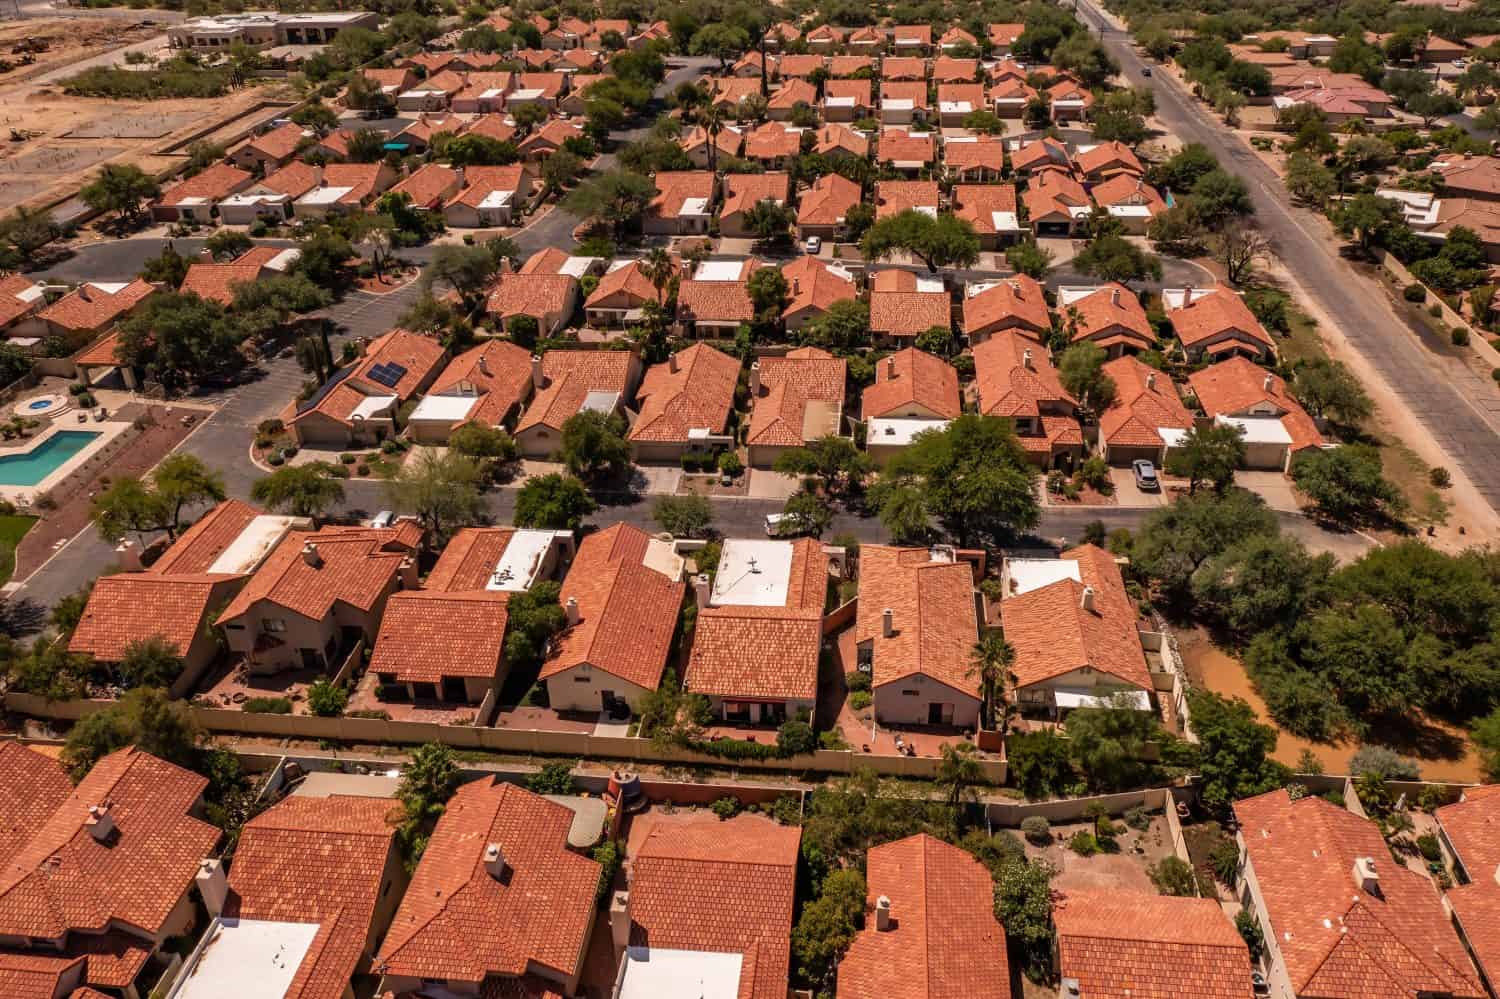
- Median household income in 2023: $54,546 (statewide: $76,872)
- Median home value in 2023: $242,200 (statewide: $358,900)
- Adults with a bachelor’s degree or higher: 30.2% (statewide: 32.6%)
- Poverty rate: 18.8% (statewide: 12.8%)
Arkansas: North Little Rock

- Median household income in 2023: $51,236 (statewide: $58,773)
- Median home value in 2023: $169,500 (statewide: $175,300)
- Adults with a bachelor’s degree or higher: 30.1% (statewide: 25.1%)
- Poverty rate: 20.8% (statewide: 16.0%)
California: Hemet
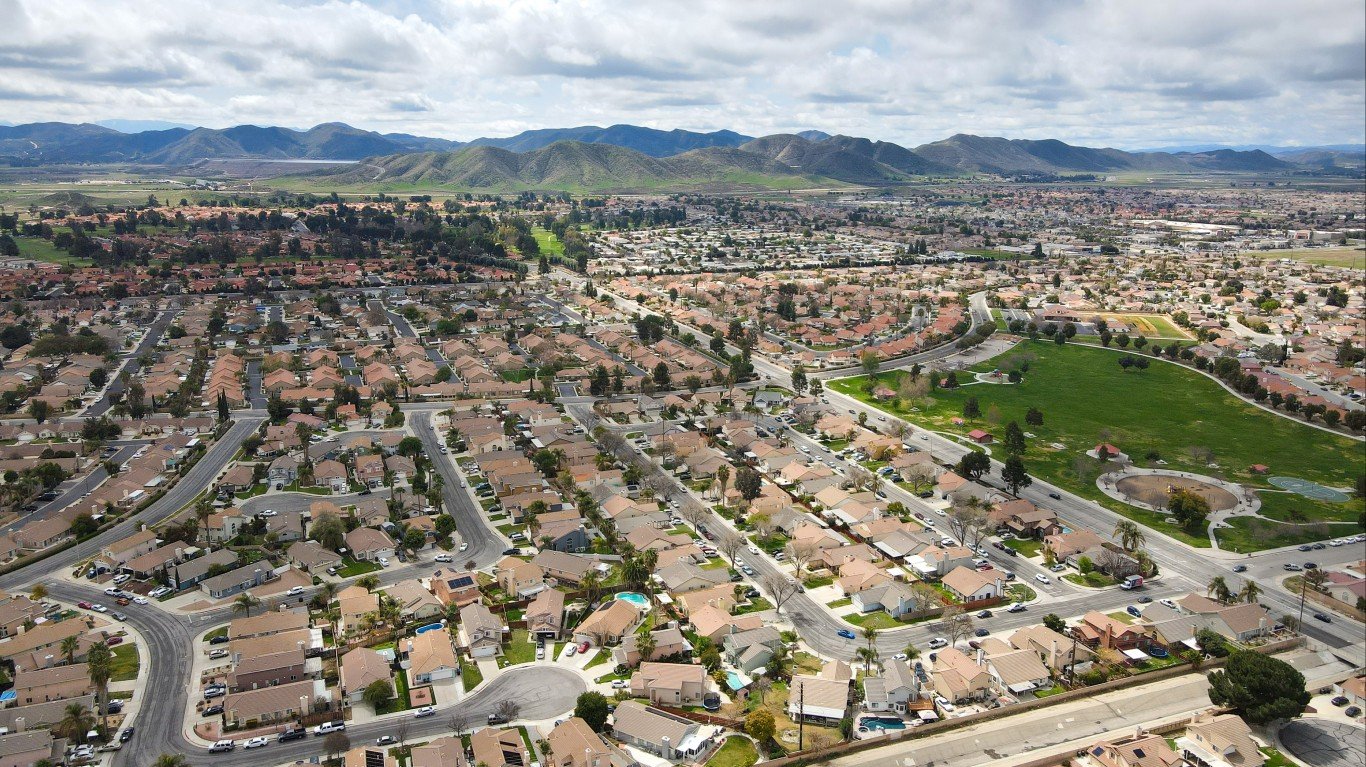
- Median household income in 2023: $53,623 (statewide: $96,334)
- Median home value in 2023: $314,200 (statewide: $695,400)
- Adults with a bachelor’s degree or higher: 15.2% (statewide: 36.5%)
- Poverty rate: 16.0% (statewide: 12.0%)
Colorado: Pueblo
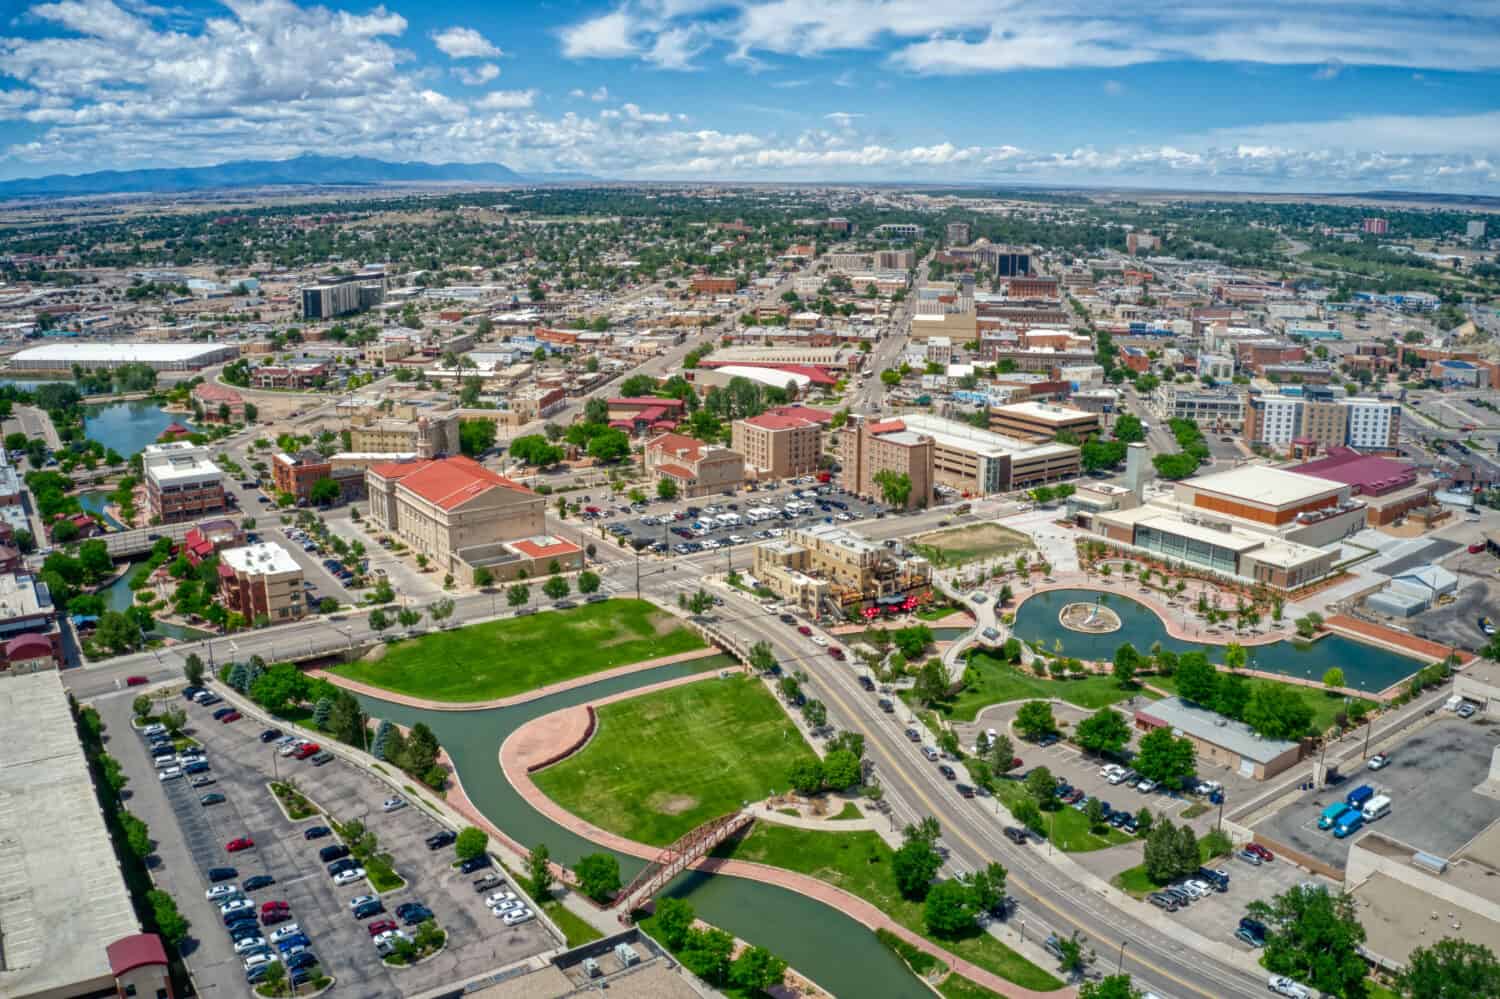
- Median household income in 2023: $55,305 (statewide: $92,470)
- Median home value in 2023: $230,900 (statewide: $502,200)
- Adults with a bachelor’s degree or higher: 22.8% (statewide: 44.7%)
- Poverty rate: 19.2% (statewide: 9.4%)
Connecticut: Hartford

- Median household income in 2023: $45,300 (statewide: $93,760)
- Median home value in 2023: $217,200 (statewide: $343,200)
- Adults with a bachelor’s degree or higher: 18.3% (statewide: 41.9%)
- Poverty rate: 25.5% (statewide: 10.0%)
Delaware: Wilmington (poorest by default)

- Median household income in 2023: $55,269 (statewide: $82,855)
- Median home value in 2023: $224,500 (statewide: $326,800)
- Adults with a bachelor’s degree or higher: 33.1% (statewide: 35.3%)
- Poverty rate: 23.2% (statewide: 10.7%)
Florida: Gainesville
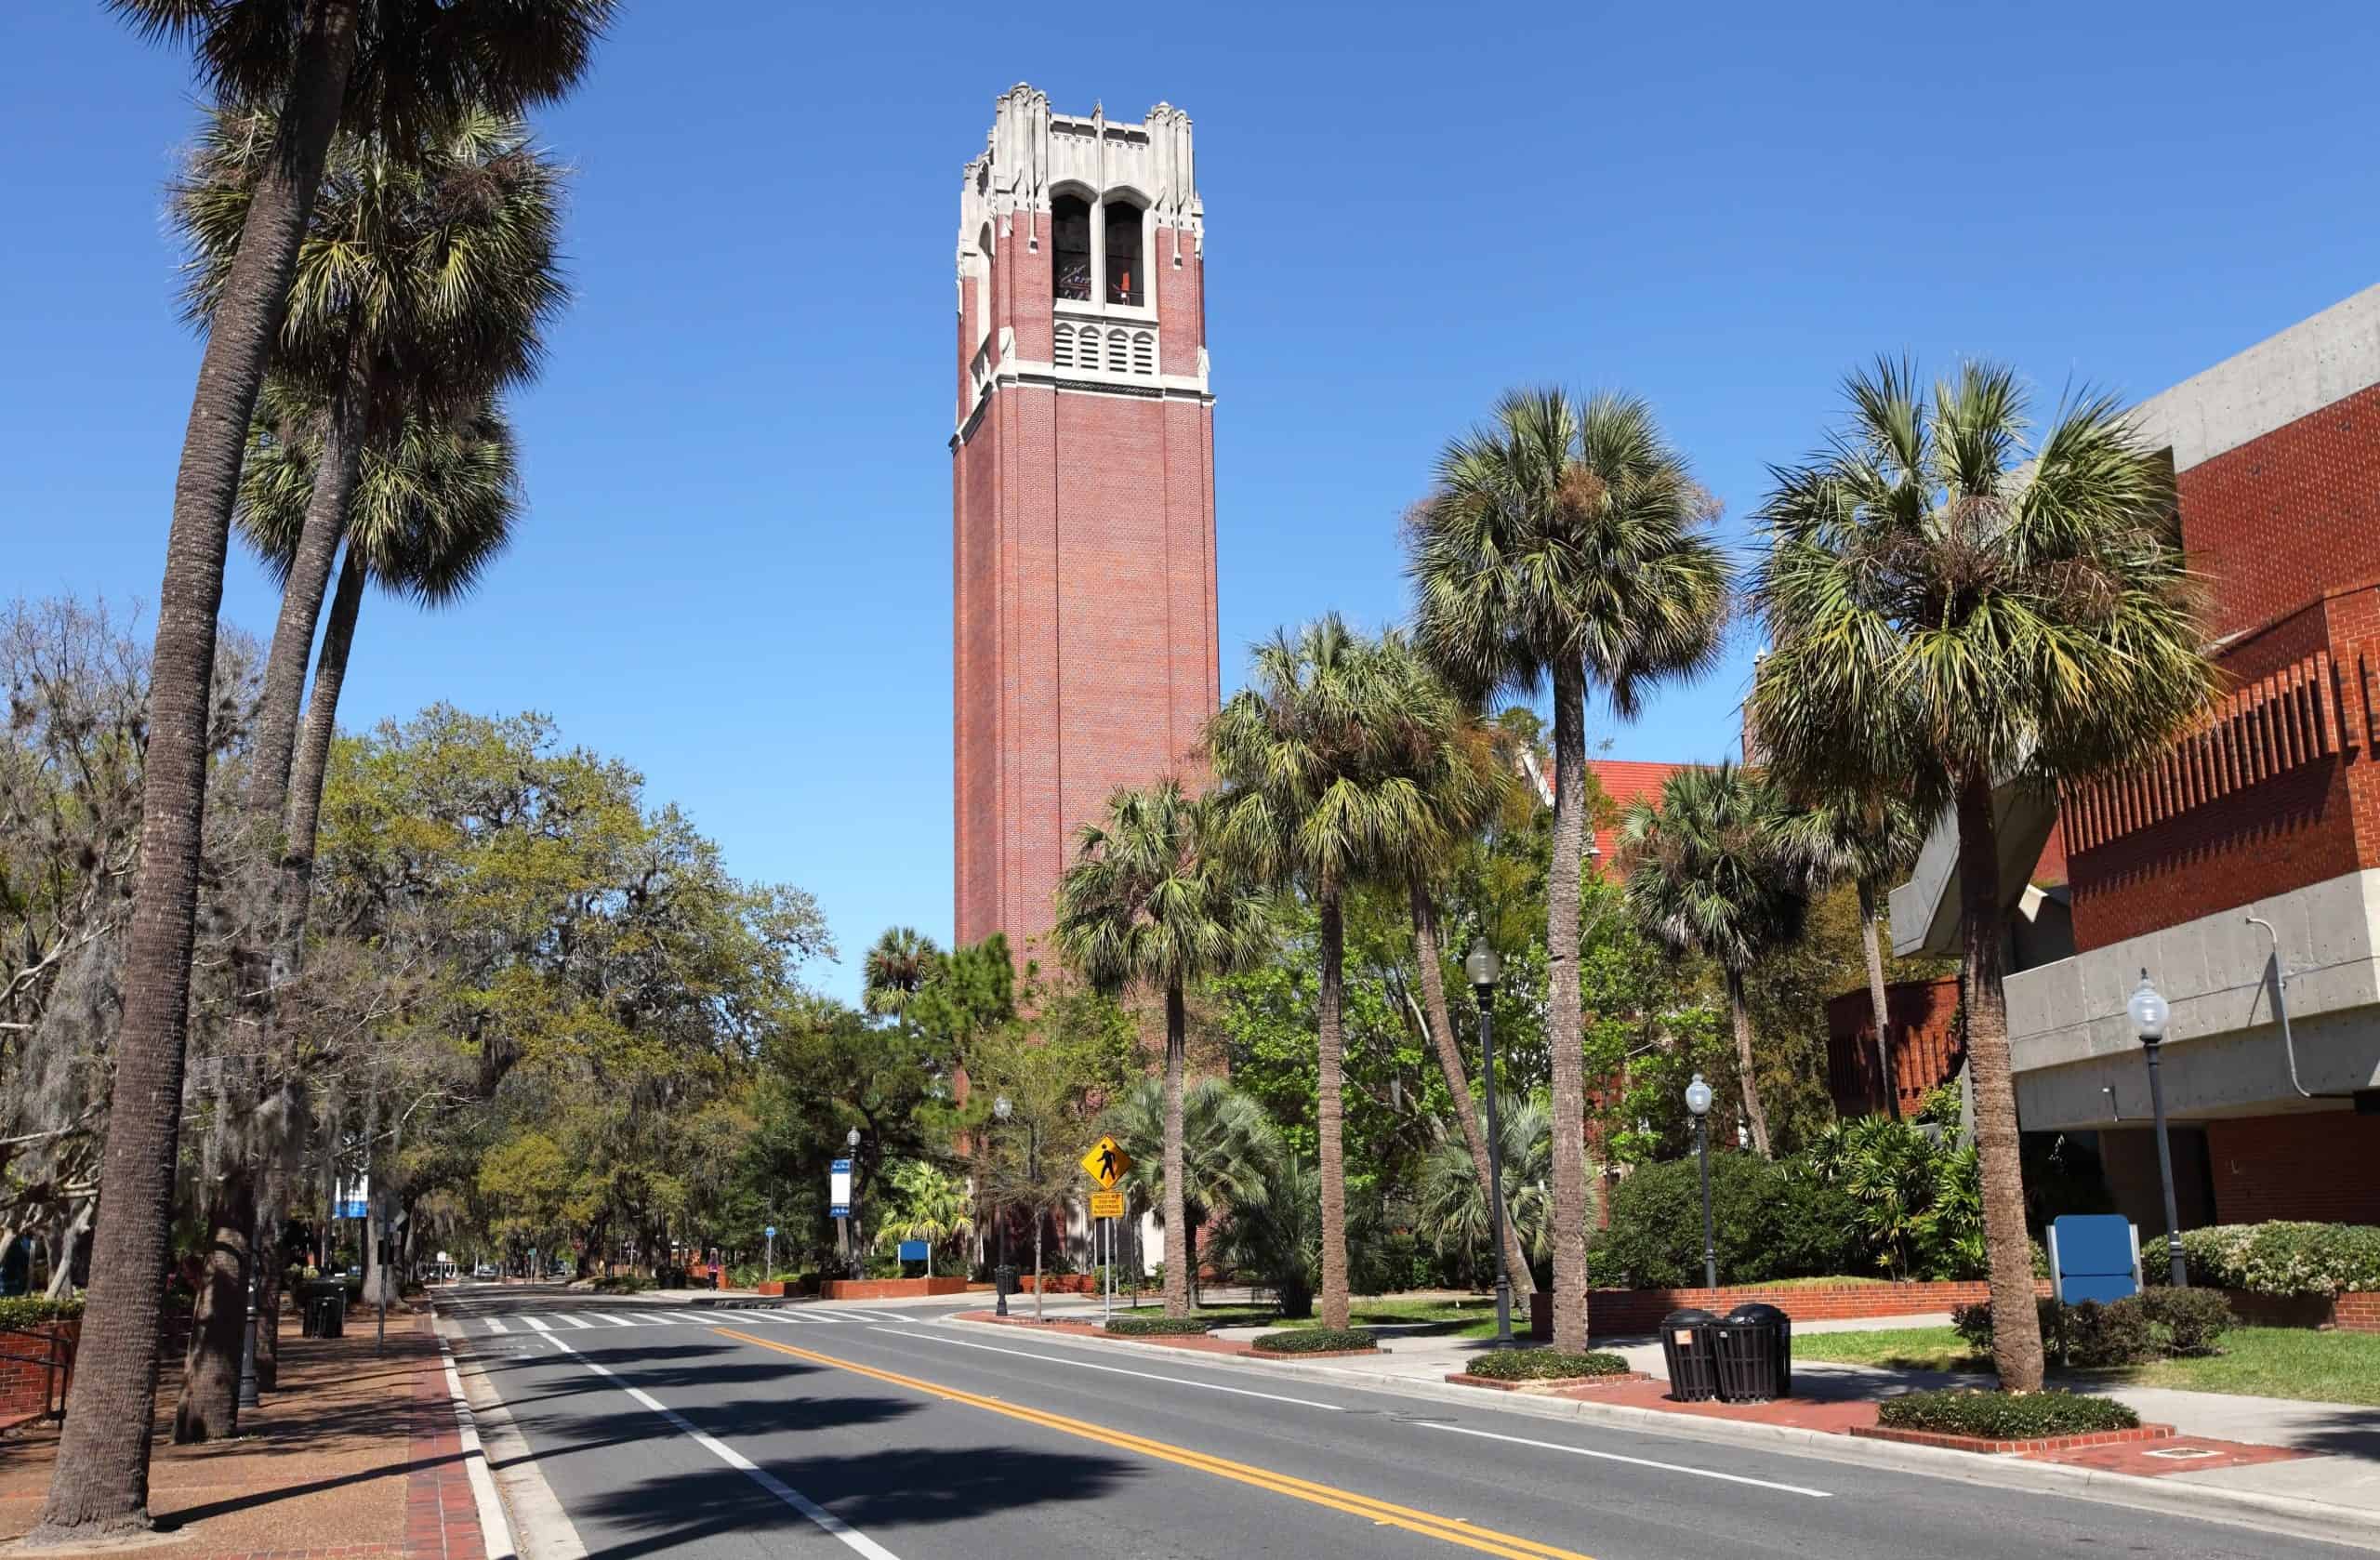
- Median household income in 2023: $45,611 (statewide: $71,711)
- Median home value in 2023: $235,000 (statewide: $325,000)
- Adults with a bachelor’s degree or higher: 51.7% (statewide: 33.2%)
- Poverty rate: 28.0% (statewide: 12.6%)
Georgia: Albany

- Median household income in 2023: $45,201 (statewide: $74,664)
- Median home value in 2023: $118,700 (statewide: $272,900)
- Adults with a bachelor’s degree or higher: 21.5% (statewide: 34.2%)
- Poverty rate: 29.2% (statewide: 13.5%)
Hawaii: Honolulu

- Median household income in 2023: $85,428 (statewide: $98,317)
- Median home value in 2023: $834,100 (statewide: $808,200)
- Adults with a bachelor’s degree or higher: 40.8% (statewide: 35.5%)
- Poverty rate: 11.9% (statewide: 10.0%)
Idaho: Pocatello

- Median household income in 2023: $57,931 (statewide: $74,636)
- Median home value in 2023: $240,600 (statewide: $376,000)
- Adults with a bachelor’s degree or higher: 32.9% (statewide: 31.2%)
- Poverty rate: 13.9% (statewide: 10.6%)
Illinois: Decatur

- Median household income in 2023: $50,809 (statewide: $81,702)
- Median home value in 2023: $97,300 (statewide: $250,500)
- Adults with a bachelor’s degree or higher: 21.3% (statewide: 37.2%)
- Poverty rate: 19.1% (statewide: 11.7%)
Indiana: Gary
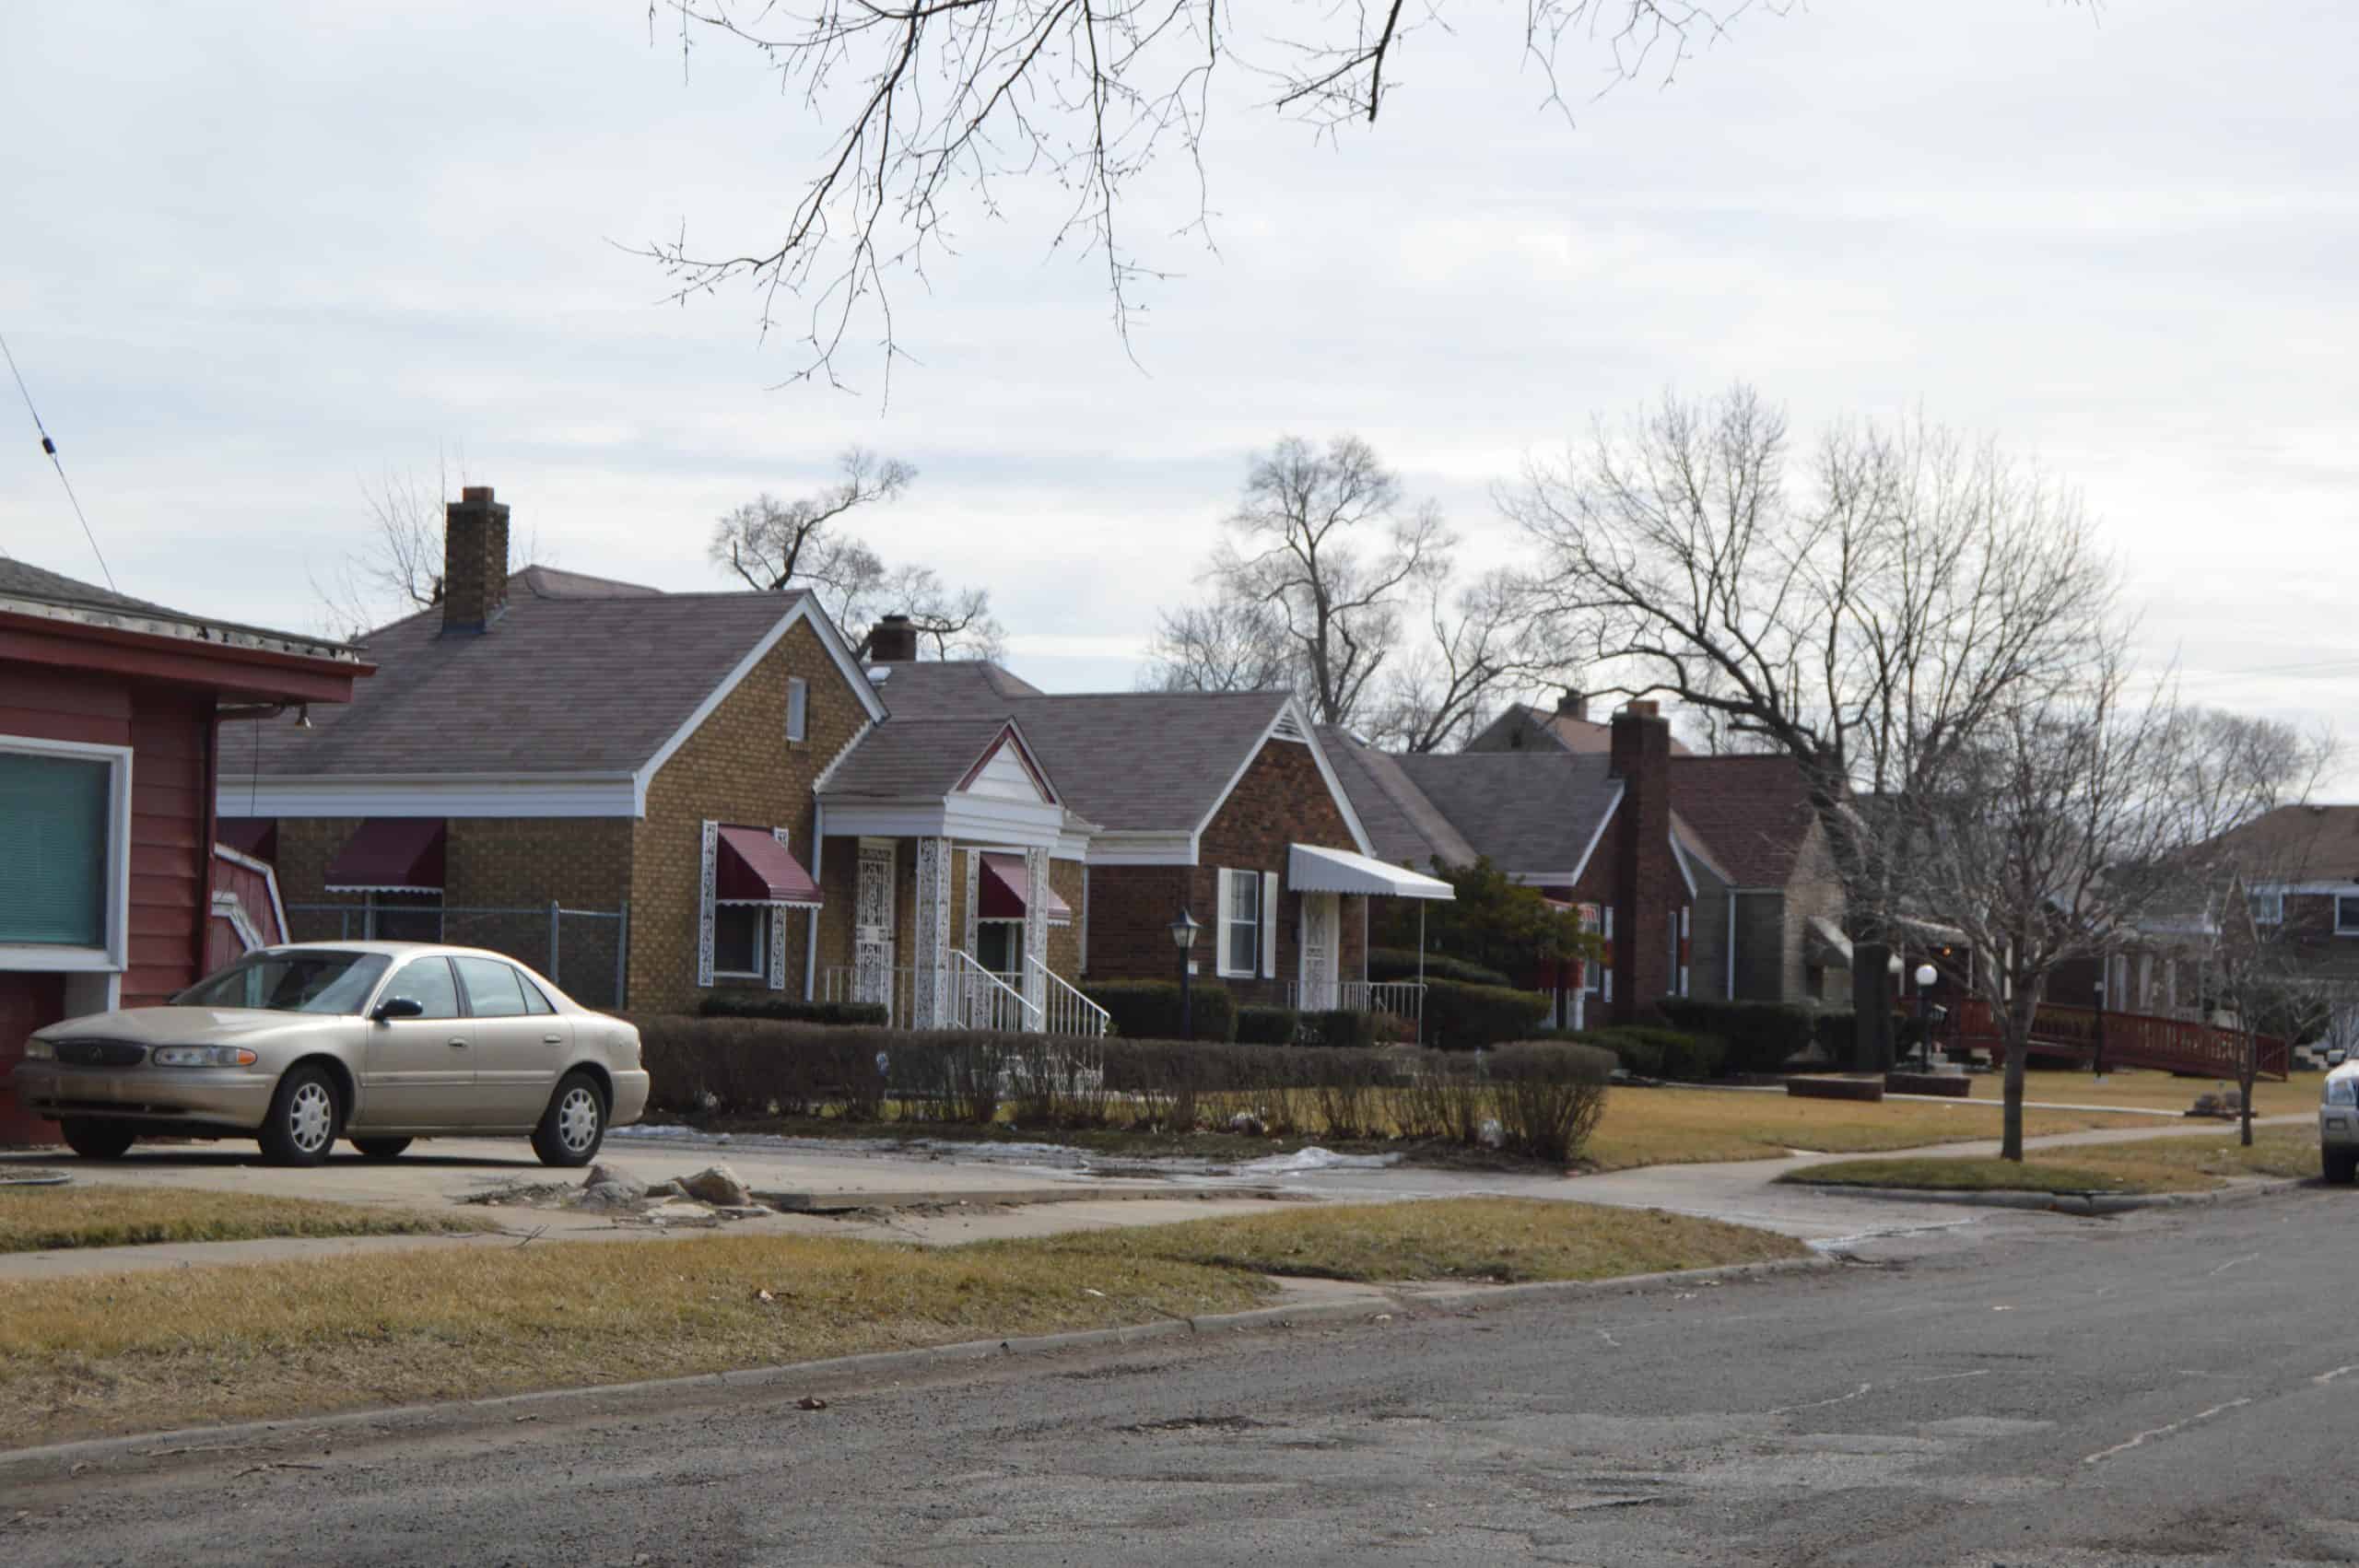
- Median household income in 2023: $37,380 (statewide: $70,051)
- Median home value in 2023: $85,300 (statewide: $201,600)
- Adults with a bachelor’s degree or higher: 14.3% (statewide: 28.8%)
- Poverty rate: 32.9% (statewide: 12.2%)
Iowa: Waterloo

- Median household income in 2023: $56,344 (statewide: $73,147)
- Median home value in 2023: $150,200 (statewide: $195,900)
- Adults with a bachelor’s degree or higher: 22.6% (statewide: 30.9%)
- Poverty rate: 16.4% (statewide: 11.0%)
Kansas: Topeka
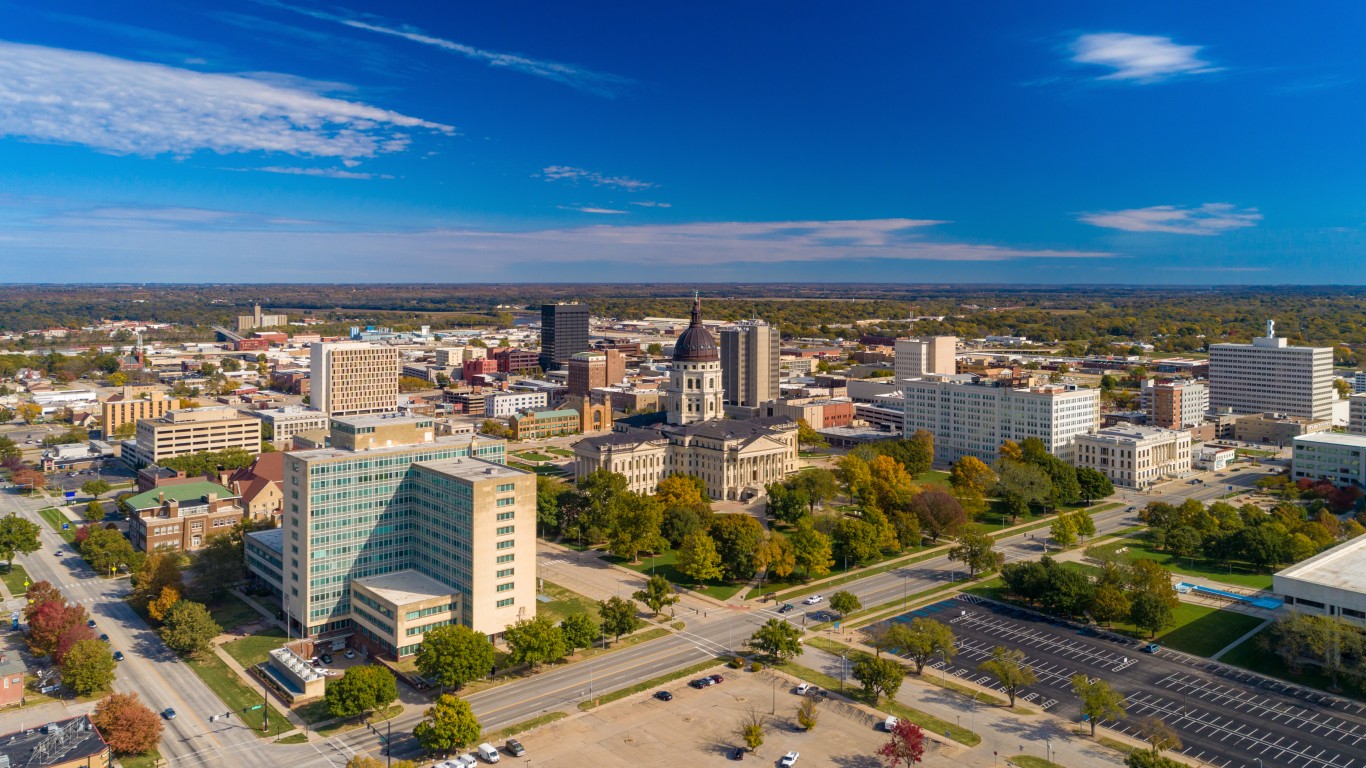
- Median household income in 2023: $55,902 (statewide: $72,639)
- Median home value in 2023: $130,600 (statewide: $203,400)
- Adults with a bachelor’s degree or higher: 29.1% (statewide: 35.2%)
- Poverty rate: 15.6% (statewide: 11.5%)
Kentucky: Bowling Green
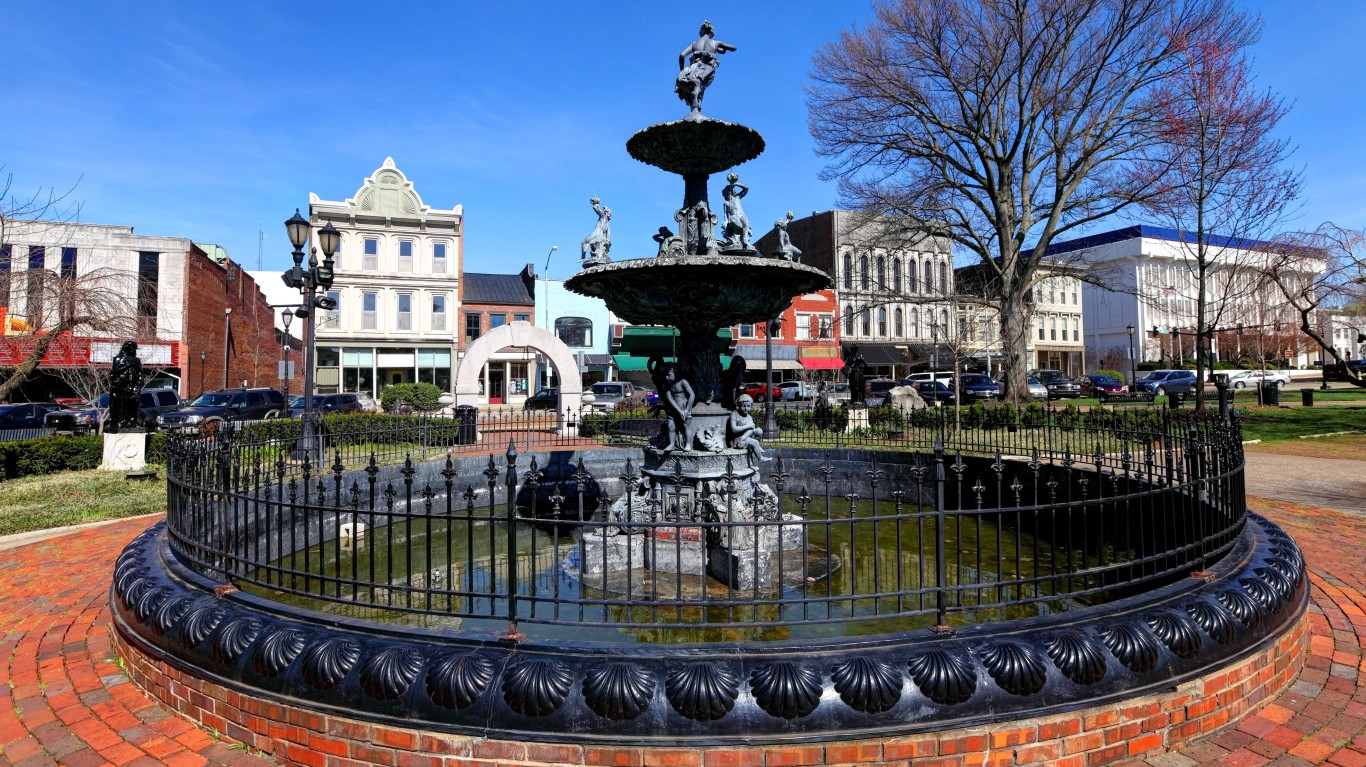
- Median household income in 2023: $48,419 (statewide: $62,417)
- Median home value in 2023: $232,100 (statewide: $192,300)
- Adults with a bachelor’s degree or higher: 32.0% (statewide: 27.0%)
- Poverty rate: 25.4% (statewide: 16.1%)
Louisiana: Shreveport

- Median household income in 2023: $48,465 (statewide: $60,023)
- Median home value in 2023: $178,100 (statewide: $208,700)
- Adults with a bachelor’s degree or higher: 27.5% (statewide: 26.6%)
- Poverty rate: 23.6% (statewide: 18.9%)
Maine: Portland (poorest by default)
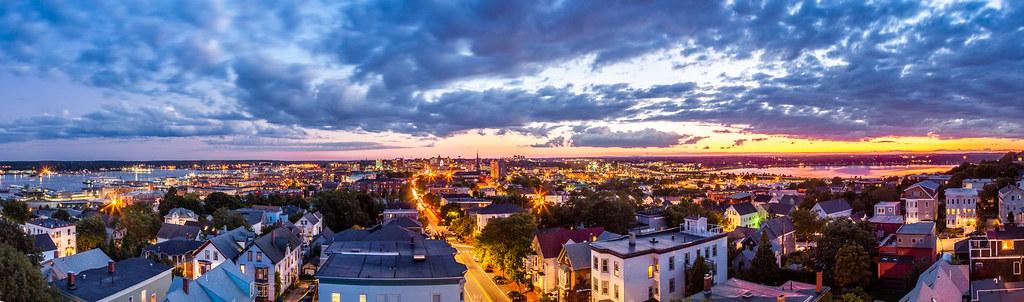
- Median household income in 2023: $76,174 (statewide: $71,773)
- Median home value in 2023: $452,600 (statewide: $266,400)
- Adults with a bachelor’s degree or higher: 59.2% (statewide: 35.3%)
- Poverty rate: 11.2% (statewide: 10.8%)
Maryland: Baltimore

- Median household income in 2023: $59,623 (statewide: $101,652)
- Median home value in 2023: $219,300 (statewide: $397,700)
- Adults with a bachelor’s degree or higher: 35.4% (statewide: 42.7%)
- Poverty rate: 20.1% (statewide: 9.3%)
Massachusetts: Springfield

- Median household income in 2023: $51,339 (statewide: $101,341)
- Median home value in 2023: $222,700 (statewide: $525,800)
- Adults with a bachelor’s degree or higher: 19.7% (statewide: 46.6%)
- Poverty rate: 25.3% (statewide: 10.0%)
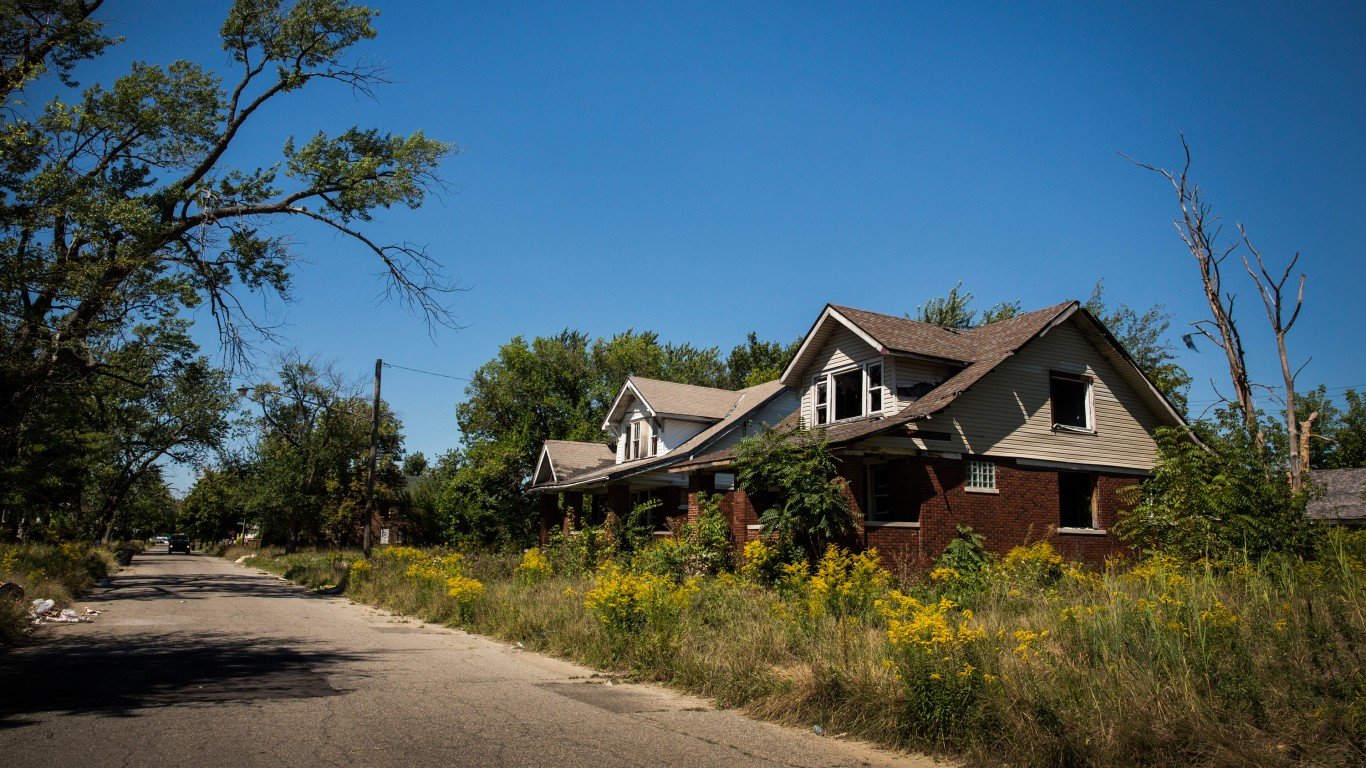
Michigan: Flint

- Median household income in 2023: $36,194 (statewide: $71,149)
- Median home value in 2023: $47,600 (statewide: $217,600)
- Adults with a bachelor’s degree or higher: 13.1% (statewide: 31.8%)
- Poverty rate: 34.4% (statewide: 13.1%)
Minnesota: St. Cloud
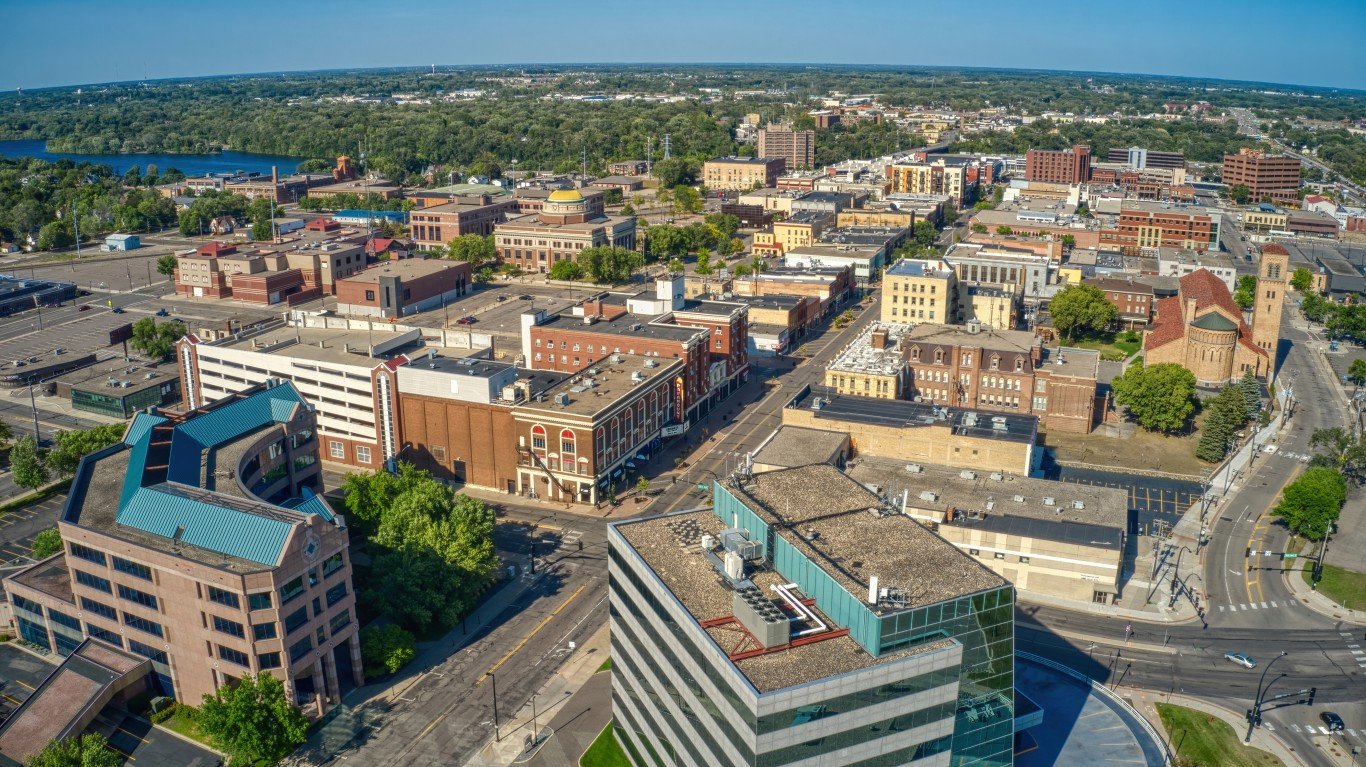
- Median household income in 2023: $61,112 (statewide: $87,556)
- Median home value in 2023: $212,800 (statewide: $305,500)
- Adults with a bachelor’s degree or higher: 29.4% (statewide: 38.8%)
- Poverty rate: 18.5% (statewide: 9.2%)
Mississippi: Jackson

- Median household income in 2023: $43,238 (statewide: $54,915)
- Median home value in 2023: $108,200 (statewide: $161,400)
- Adults with a bachelor’s degree or higher: 28.6% (statewide: 24.2%)
- Poverty rate: 26.8% (statewide: 19.1%)
Missouri: Springfield

- Median household income in 2023: $45,984 (statewide: $68,920)
- Median home value in 2023: $165,200 (statewide: $215,600)
- Adults with a bachelor’s degree or higher: 30.3% (statewide: 31.9%)
- Poverty rate: 19.4% (statewide: 12.6%)
Montana: Great Falls

- Median household income in 2023: $63,934 (statewide: $69,922)
- Median home value in 2023: $237,400 (statewide: $338,100)
- Adults with a bachelor’s degree or higher: 28.3% (statewide: 34.5%)
- Poverty rate: 14.0% (statewide: 12.0%)
Nebraska: Grand Island
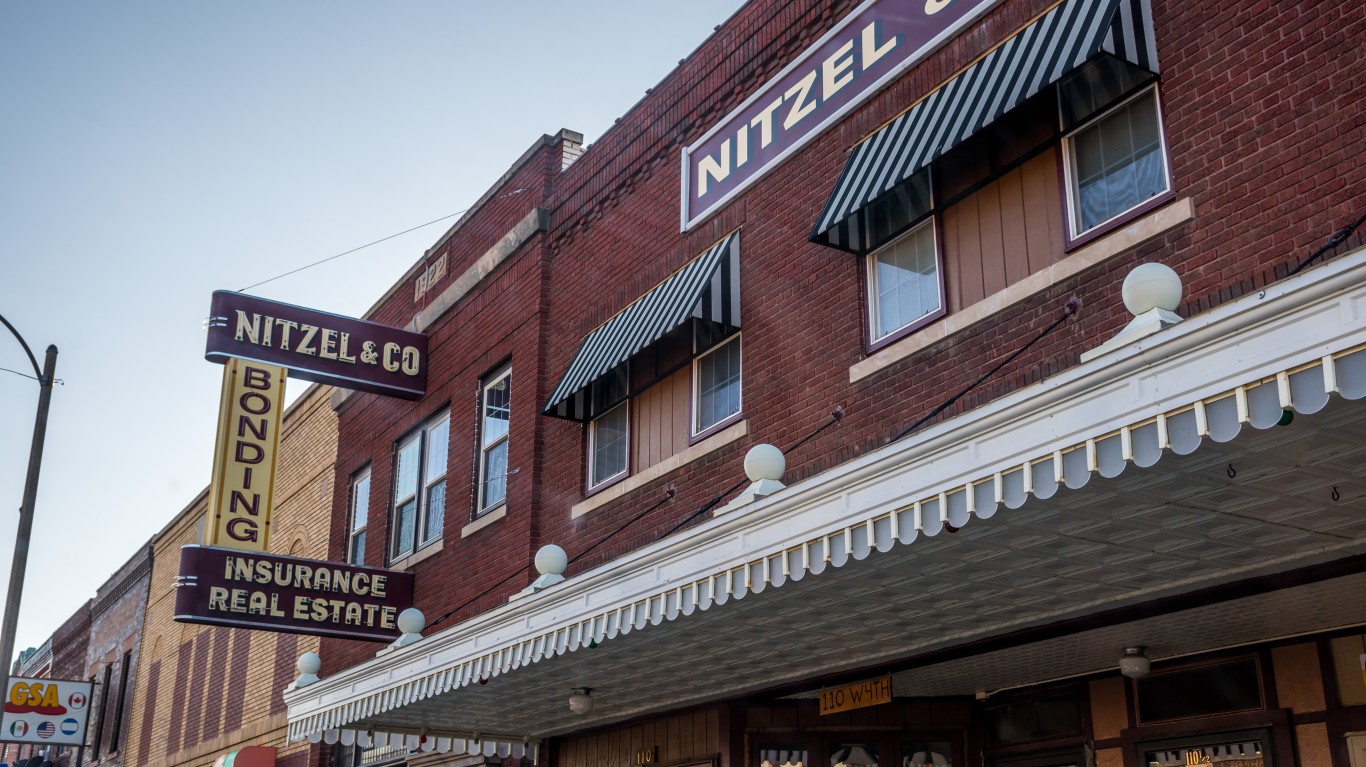
- Median household income in 2023: $62,439 (statewide: $74,985)
- Median home value in 2023: $202,600 (statewide: $223,800)
- Adults with a bachelor’s degree or higher: 20.7% (statewide: 34.1%)
- Poverty rate: 12.5% (statewide: 10.3%)
Nevada: Sunrise Manor

- Median household income in 2023: $55,034 (statewide: $75,561)
- Median home value in 2023: $290,900 (statewide: $406,100)
- Adults with a bachelor’s degree or higher: 11.9% (statewide: 27.4%)
- Poverty rate: 20.4% (statewide: 12.6%)
New Hampshire: Manchester

- Median household income in 2023: $77,415 (statewide: $95,628)
- Median home value in 2023: $336,300 (statewide: $367,200)
- Adults with a bachelor’s degree or higher: 33.5% (statewide: 39.8%)
- Poverty rate: 10.7% (statewide: 7.2%)
New Jersey: Camden

- Median household income in 2023: $40,450 (statewide: $101,050)
- Median home value in 2023: $100,400 (statewide: $427,600)
- Adults with a bachelor’s degree or higher: 9.6% (statewide: 42.9%)
- Poverty rate: 28.5% (statewide: 9.8%)
New Mexico: Las Cruces
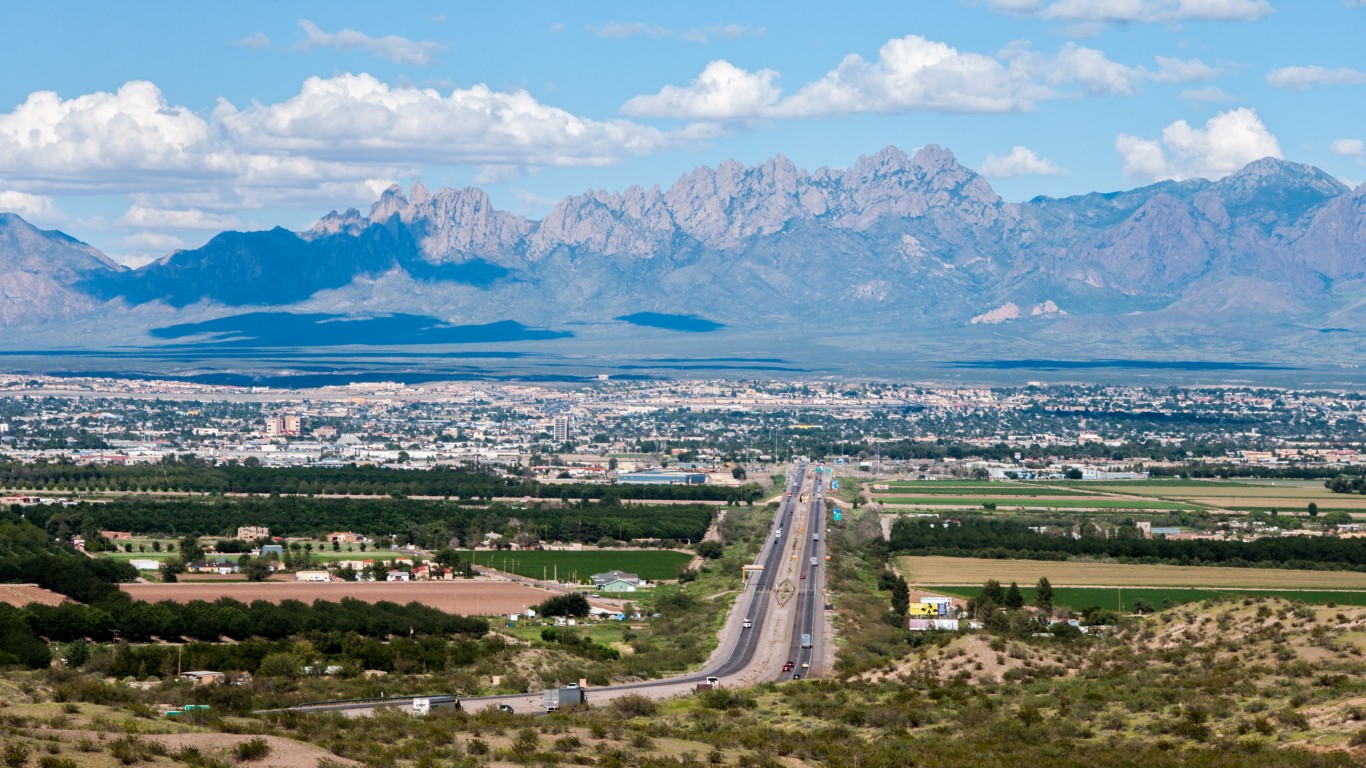
- Median household income in 2023: $55,176 (statewide: $62,125)
- Median home value in 2023: $217,400 (statewide: $232,200)
- Adults with a bachelor’s degree or higher: 37.3% (statewide: 30.2%)
- Poverty rate: 22.0% (statewide: 18.1%)
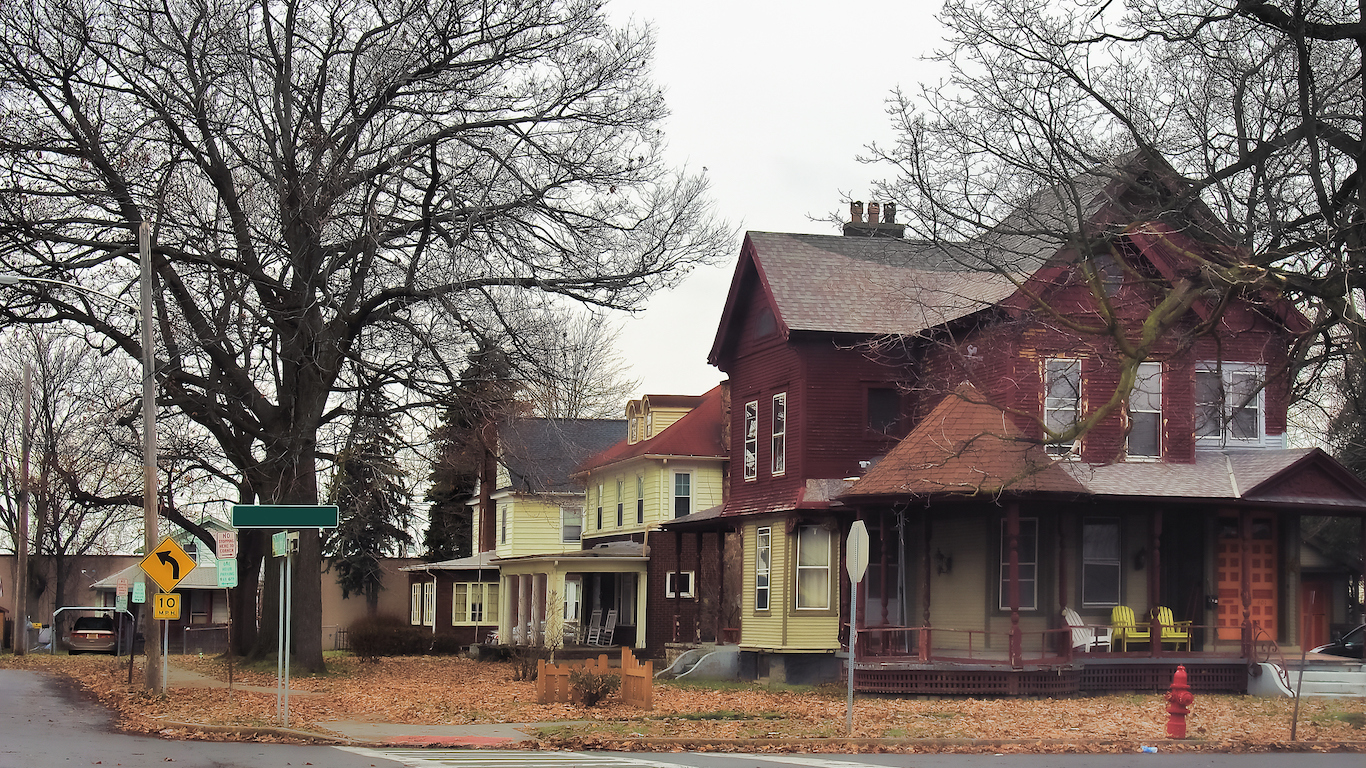
New York: Syracuse

- Median household income in 2023: $45,845 (statewide: $84,578)
- Median home value in 2023: $125,100 (statewide: $403,000)
- Adults with a bachelor’s degree or higher: 30.5% (statewide: 39.6%)
- Poverty rate: 29.6% (statewide: 13.7%)
North Carolina: Greenville

- Median household income in 2023: $50,564 (statewide: $69,904)
- Median home value in 2023: $213,100 (statewide: $259,400)
- Adults with a bachelor’s degree or higher: 39.3% (statewide: 34.7%)
- Poverty rate: 24.5% (statewide: 13.2%)
North Dakota: Grand Forks
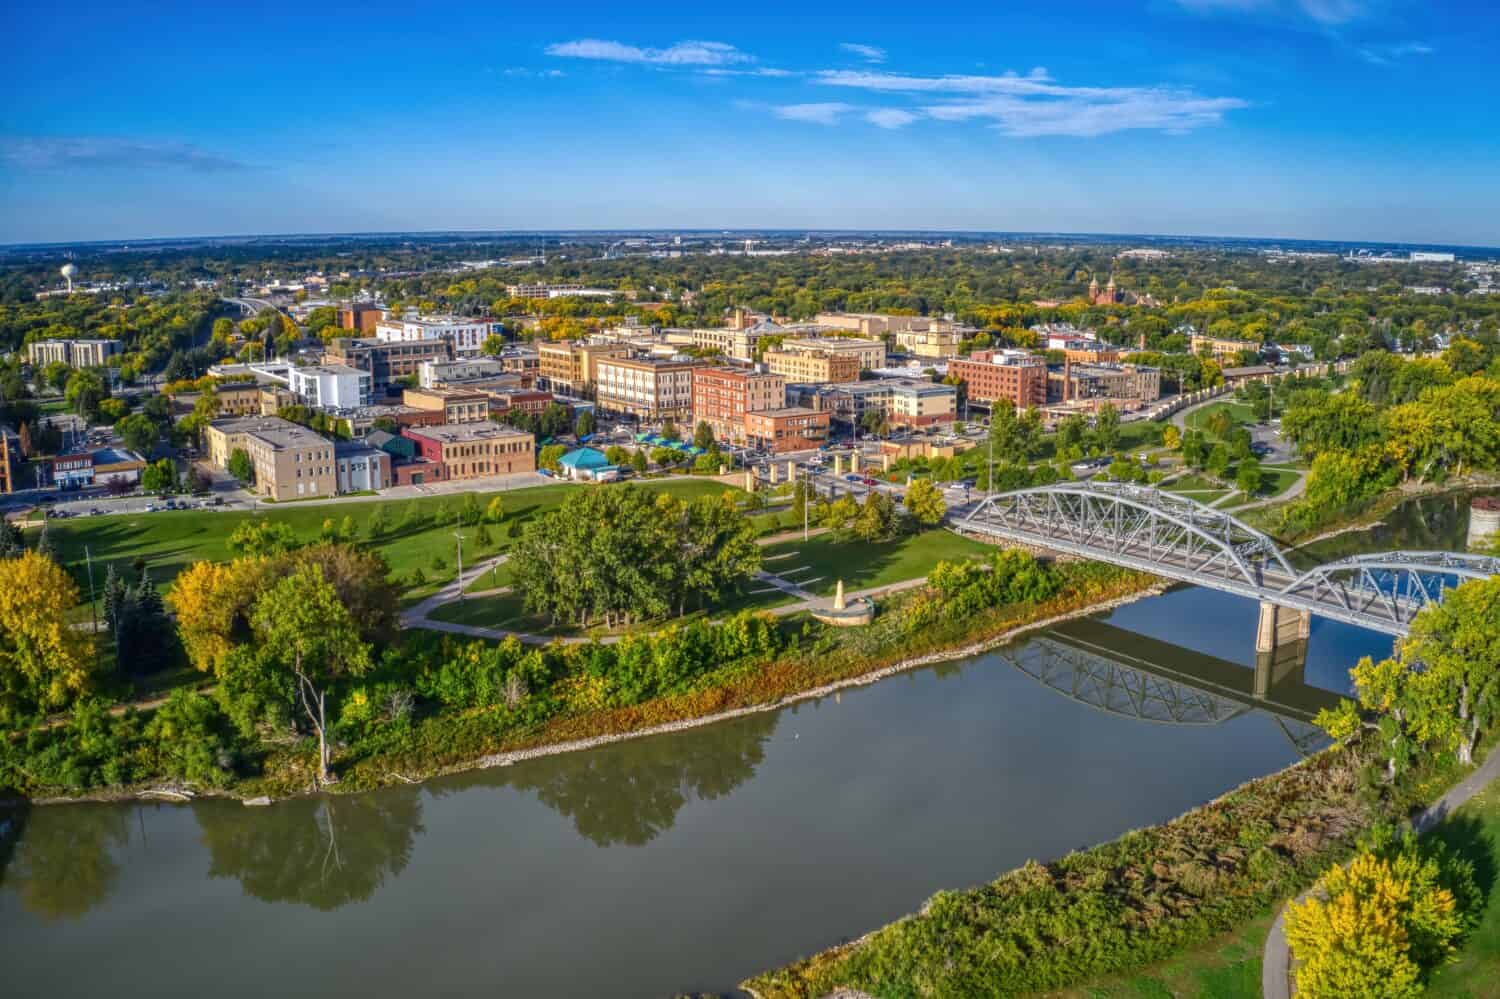
- Median household income in 2023: $63,838 (statewide: $75,949)
- Median home value in 2023: $243,300 (statewide: $241,100)
- Adults with a bachelor’s degree or higher: 39.2% (statewide: 32.3%)
- Poverty rate: 16.3% (statewide: 10.6%)
Ohio: Youngstown

- Median household income in 2023: $34,746 (statewide: $69,680)
- Median home value in 2023: $58,400 (statewide: $199,200)
- Adults with a bachelor’s degree or higher: 15.2% (statewide: 30.9%)
- Poverty rate: 36.2% (statewide: 13.2%)
Oklahoma: Lawton

- Median household income in 2023: $53,588 (statewide: $63,603)
- Median home value in 2023: $134,200 (statewide: $185,900)
- Adults with a bachelor’s degree or higher: 22.9% (statewide: 27.8%)
- Poverty rate: 20.8% (statewide: 15.3%)
Oregon: Corvallis

- Median household income in 2023: $63,807 (statewide: $80,426)
- Median home value in 2023: $480,600 (statewide: $454,200)
- Adults with a bachelor’s degree or higher: 60.9% (statewide: 36.2%)
- Poverty rate: 25.9% (statewide: 11.9%)
Pennsylvania: Erie

- Median household income in 2023: $43,397 (statewide: $76,081)
- Median home value in 2023: $108,200 (statewide: $240,500)
- Adults with a bachelor’s degree or higher: 22.3% (statewide: 34.5%)
- Poverty rate: 24.6% (statewide: 11.8%)
Rhode Island: Providence

- Median household income in 2023: $66,772 (statewide: $86,372)
- Median home value in 2023: $322,800 (statewide: $368,800)
- Adults with a bachelor’s degree or higher: 34.7% (statewide: 37.3%)
- Poverty rate: 20.1% (statewide: 10.9%)
South Carolina: Columbia

- Median household income in 2023: $55,653 (statewide: $66,818)
- Median home value in 2023: $243,500 (statewide: $236,700)
- Adults with a bachelor’s degree or higher: 46.1% (statewide: 31.5%)
- Poverty rate: 23.3% (statewide: 14.2%)
South Dakota: Rapid City

- Median household income in 2023: $65,712 (statewide: $72,421)
- Median home value in 2023: $270,000 (statewide: $236,800)
- Adults with a bachelor’s degree or higher: 36.4% (statewide: 31.1%)
- Poverty rate: 13.3% (statewide: 12.0%)
Tennessee: Kingsport

- Median household income in 2023: $50,436 (statewide: $67,097)
- Median home value in 2023: $203,000 (statewide: $256,800)
- Adults with a bachelor’s degree or higher: 31.0% (statewide: 30.4%)
- Poverty rate: 20.8% (statewide: 13.8%)
Texas: Port Arthur

- Median household income in 2023: $45,752 (statewide: $76,292)
- Median home value in 2023: $96,900 (statewide: $260,400)
- Adults with a bachelor’s degree or higher: 11.2% (statewide: 33.1%)
- Poverty rate: 29.1% (statewide: 13.8%)
Utah: Logan

- Median household income in 2023: $56,764 (statewide: $91,750)
- Median home value in 2023: $341,000 (statewide: $455,000)
- Adults with a bachelor’s degree or higher: 38.8% (statewide: 36.9%)
- Poverty rate: 23.0% (statewide: 8.6%)
Virginia: Roanoke

- Median household income in 2023: $52,671 (statewide: $90,974)
- Median home value in 2023: $180,500 (statewide: $360,700)
- Adults with a bachelor’s degree or higher: 28.9% (statewide: 41.5%)
- Poverty rate: 19.7% (statewide: 9.9%)
Washington: Yakima

- Median household income in 2023: $59,228 (statewide: $94,952)
- Median home value in 2023: $273,400 (statewide: $519,800)
- Adults with a bachelor’s degree or higher: 20.8% (statewide: 38.8%)
- Poverty rate: 17.0% (statewide: 9.9%)
Wisconsin: Milwaukee

- Median household income in 2023: $51,888 (statewide: $75,670)
- Median home value in 2023: $172,000 (statewide: $247,400)
- Adults with a bachelor’s degree or higher: 26.6% (statewide: 32.8%)
- Poverty rate: 23.3% (statewide: 10.6%)
Wyoming: Casper
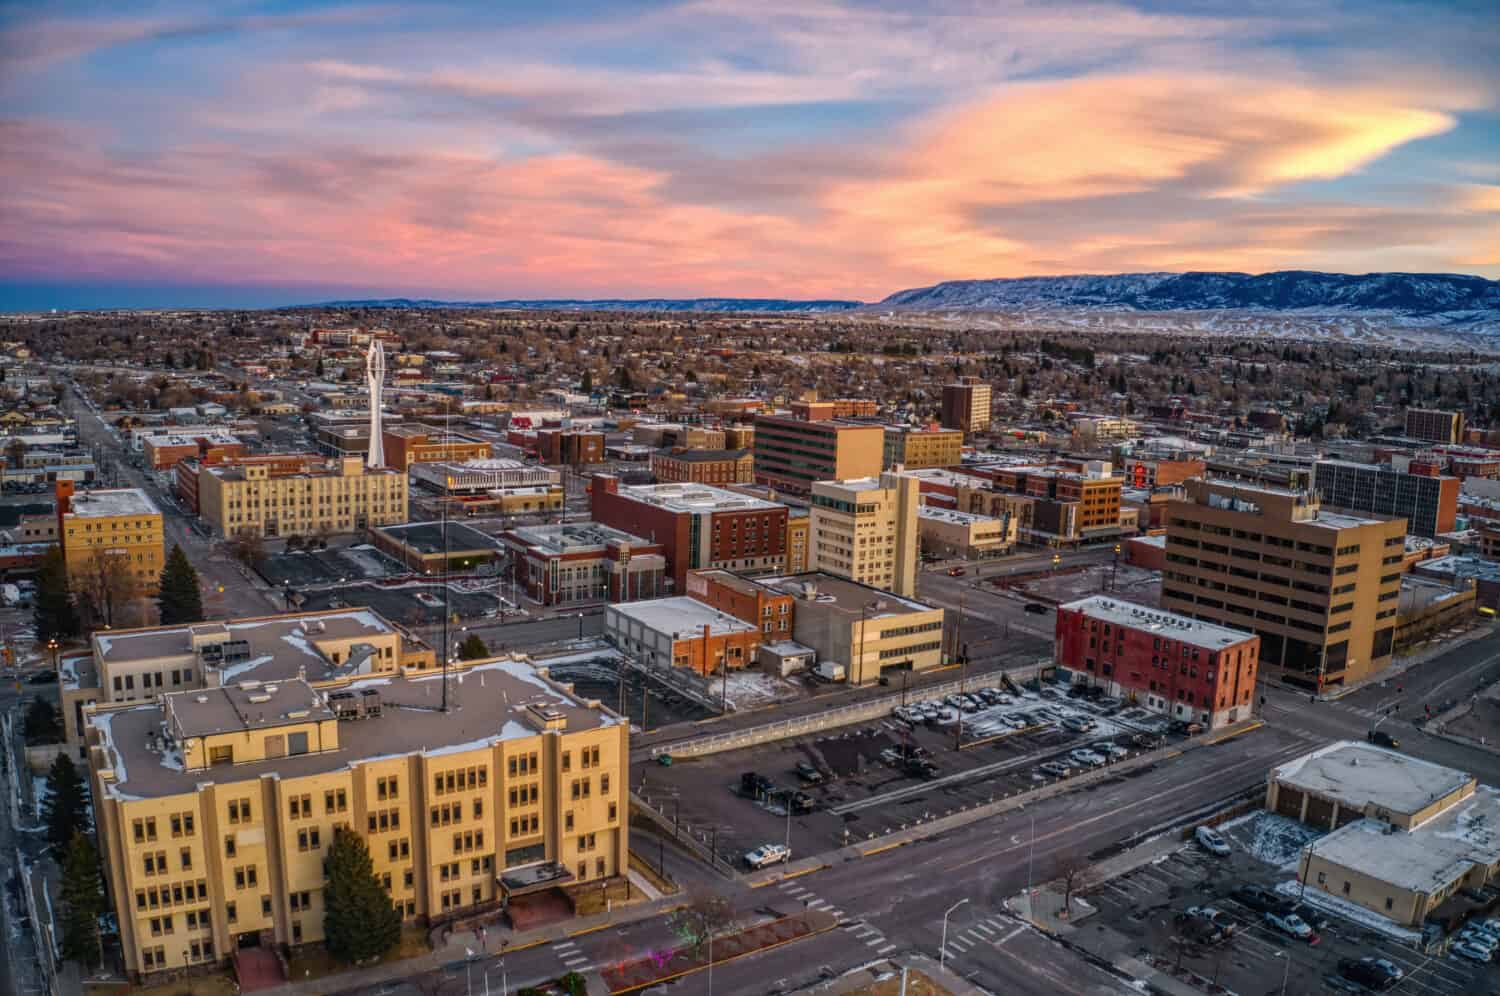
- Median household income in 2023: $69,171 (statewide: $74,815)
- Median home value in 2023: $250,700 (statewide: $285,100)
- Adults with a bachelor’s degree or higher: 30.0% (statewide: 29.9%)
- Poverty rate: 11.2% (statewide: 10.7%)
The post These Are the Cities Hit Hardest by Poverty in Every U.S. State appeared first on 24/7 Wall St..