


These Are America’s Hotspots for Deadly Police Incidents
A report released last month by Mapping Police Violence found that 2024 was a record year for the number of people killed by police officers. So far for 2025, the website reports that 233 people have been killed by police this year, as of March 5, 2025. According to the data, the number was higher […] The post These Are America’s Hotspots for Deadly Police Incidents appeared first on 24/7 Wall St..
A report released last month by Mapping Police Violence found that 2024 was a record year for the number of people killed by police officers. So far for 2025, the website reports that 233 people have been killed by police this year, as of March 5, 2025. According to the data, the number was higher in February 2025 than at the same time last year. (Also see police killings by state.) While the data varies by state, it also varies by city with some areas seeing increases, while others had no police killings. For example, Rhode Island had no police killings in 2024.
24/7 Wall St. identified the 40 American cities where police kill the most people by reviewing data from Mapping Police Violence, a research collaborative that collects data on police killings. We ranked cities by the population-adjusted number of people killed by police officers between January 2020 and October 2024. Population data used to calculate the rate of police killings are five-year estimates from the U.S. Census Bureau’s 2022 American Community Survey. Nationwide, there have been a total of 1.8 police killings for every 100,000 people since the beginning of 2020. Meanwhile, among the 50 cities on this list, the rate of police killings over the same period ranges from about 3 for every 100,000 people to well over 10 per 100,000.
(This article was updated on March 21, 2025, to reflect recent news regarding the record for killings by police in 2024.)
Why It Matters Now
Sadly, 2024 was a record year for the number of people killed by police officers. This was reported by the website, Mapping Police Violence. Recently, the U.S. Justice Department removed a database that tracked misconduct by federal law enforcement. While the website was not accessible to the public, it was used by law enforcement agencies. To create data for the Mapping Police Violence website, researchers must analyze data from media reports. We have summarized the findings below to find the 40 American cities with the most known police killings.
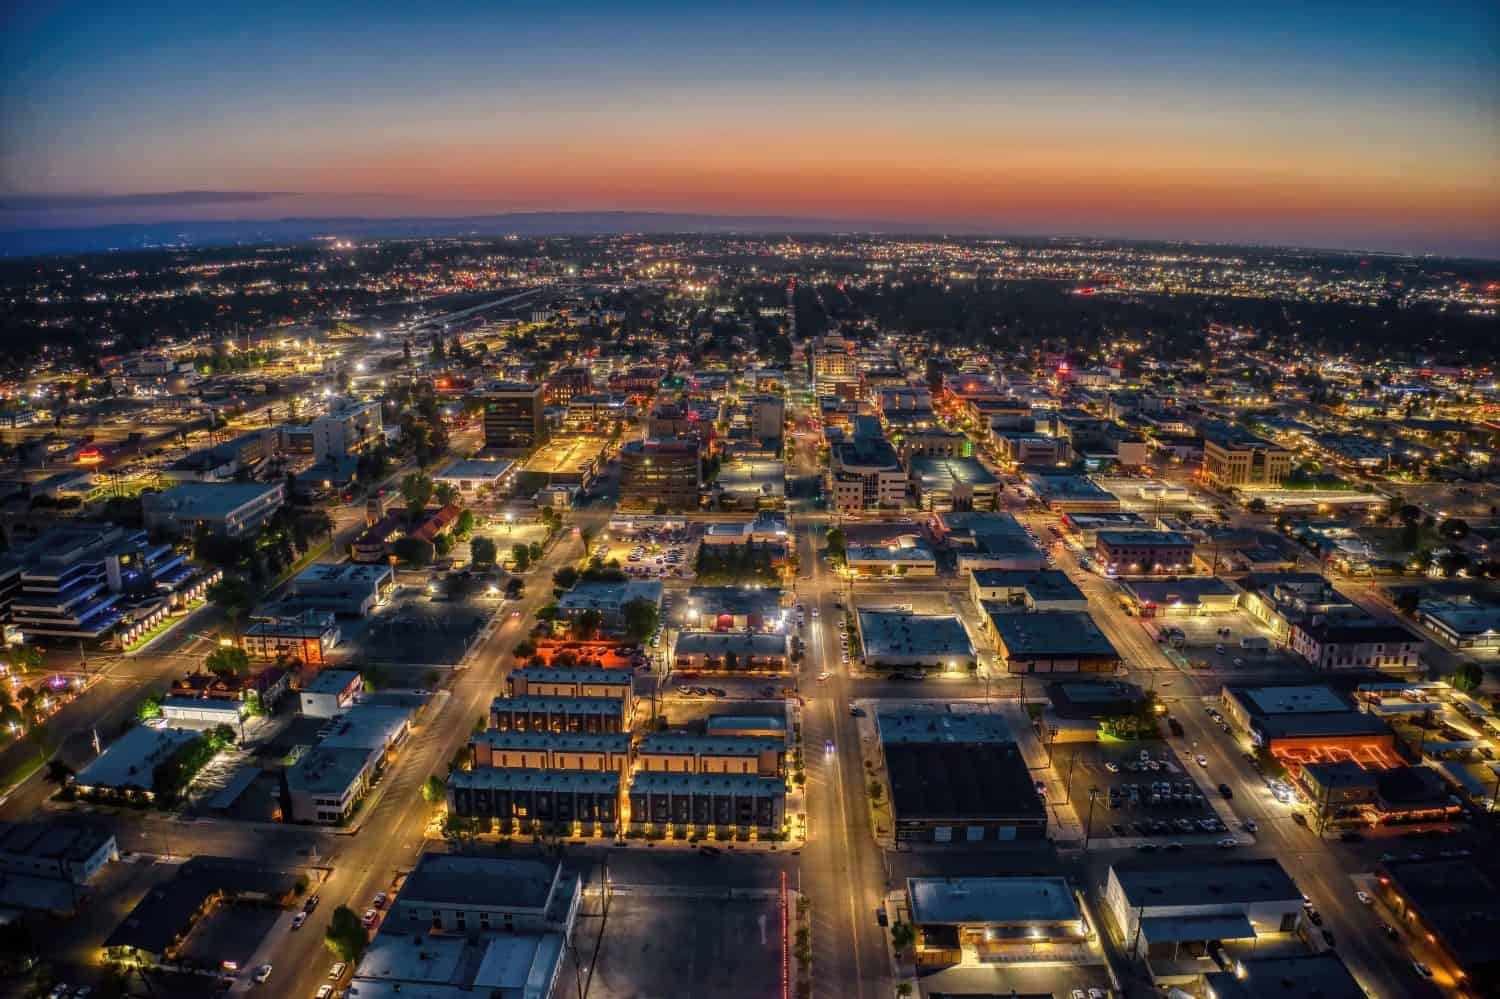
40. Fresno, California
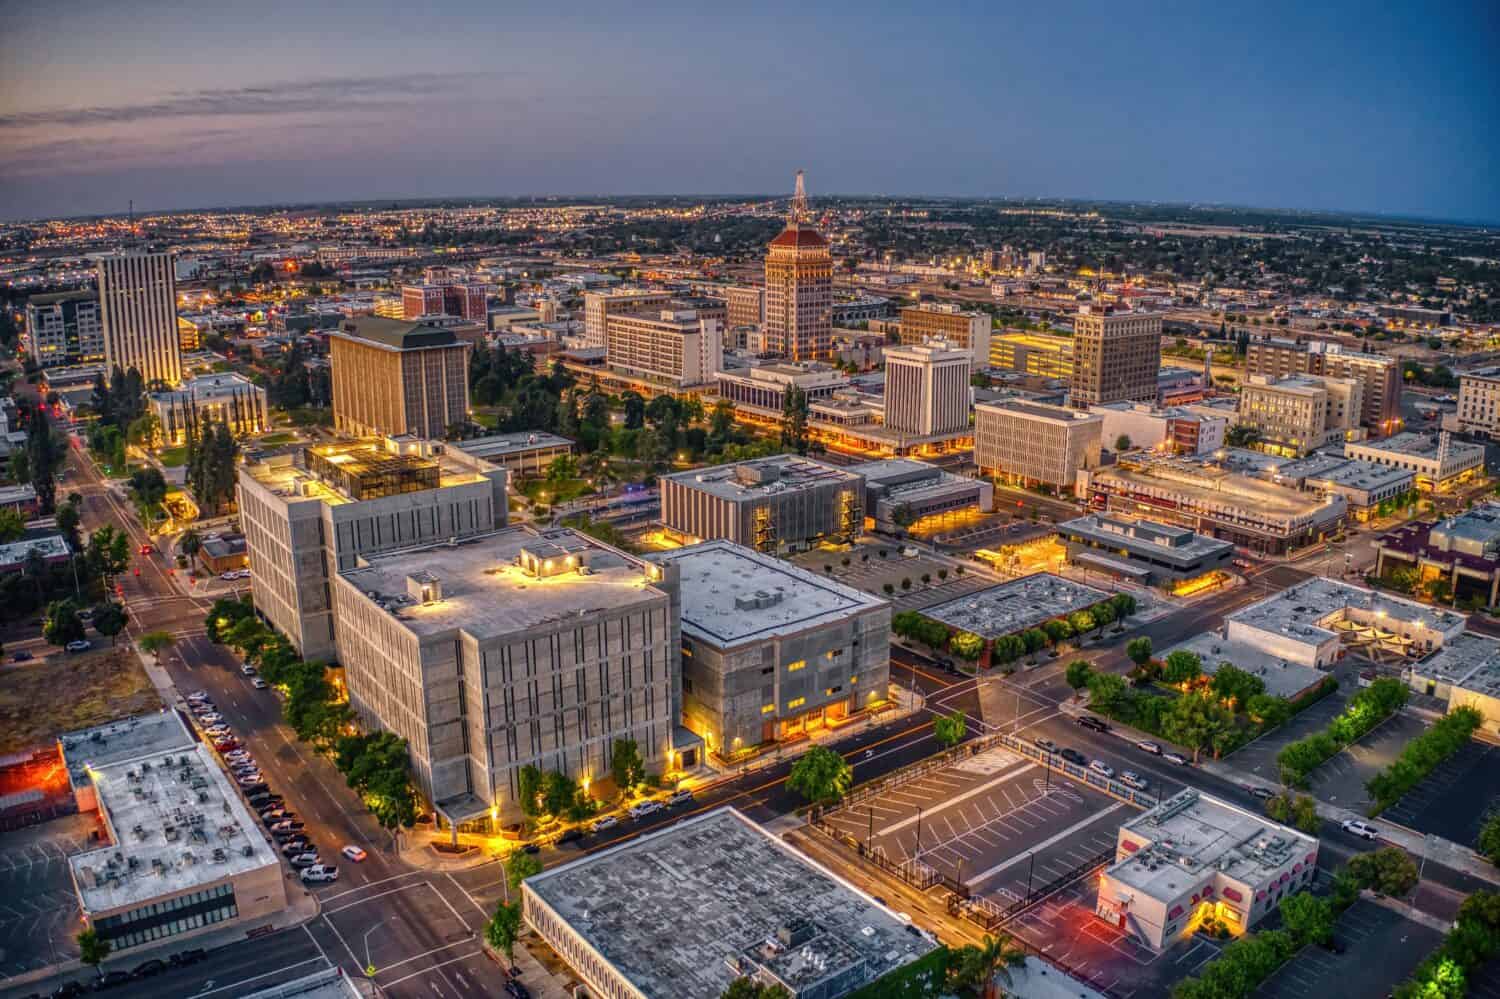
- Documented police killings, Jan. 2020 – Oct. 2024: 3.7 per 100,000 people (20 total)
- Gender of those killed: 100.0% male, 0.0% female
- Race/ethnicity of those killed: 15.0% White, 10.0% Black, 70.0% Hispanic, 0.0% Native American, 5.0% Asian
- Share of those killed with signs of a mental illness: 15.0%
- Share of those killed who were unarmed: 20.0%
- City population: 541,528
39. Kansas CIty, Missouri
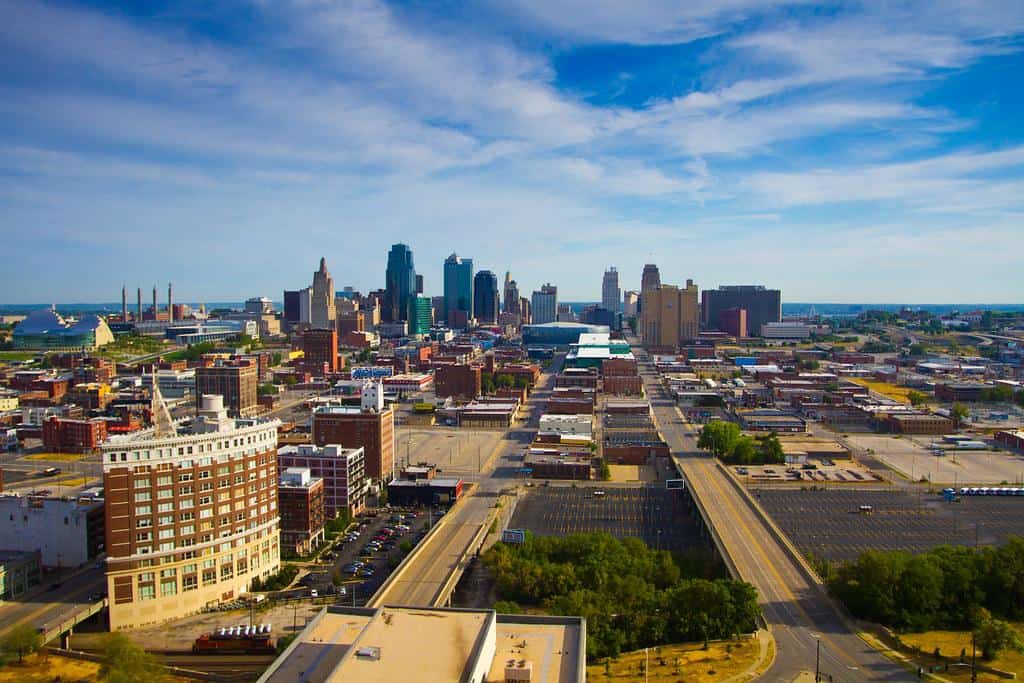
- Documented police killings, Jan. 2020 – Oct. 2024: 3.8 per 100,000 people (19 total)
- Gender of those killed: 94.7% male, 5.3% female
- Race/ethnicity of those killed: 21.1% White, 57.9% Black, 0.0% Hispanic, 0.0% Native American, 0.0% Asian
- Share of those killed with signs of a mental illness: 10.5%
- Share of those killed who were unarmed: 5.3%
- City population: 505,958
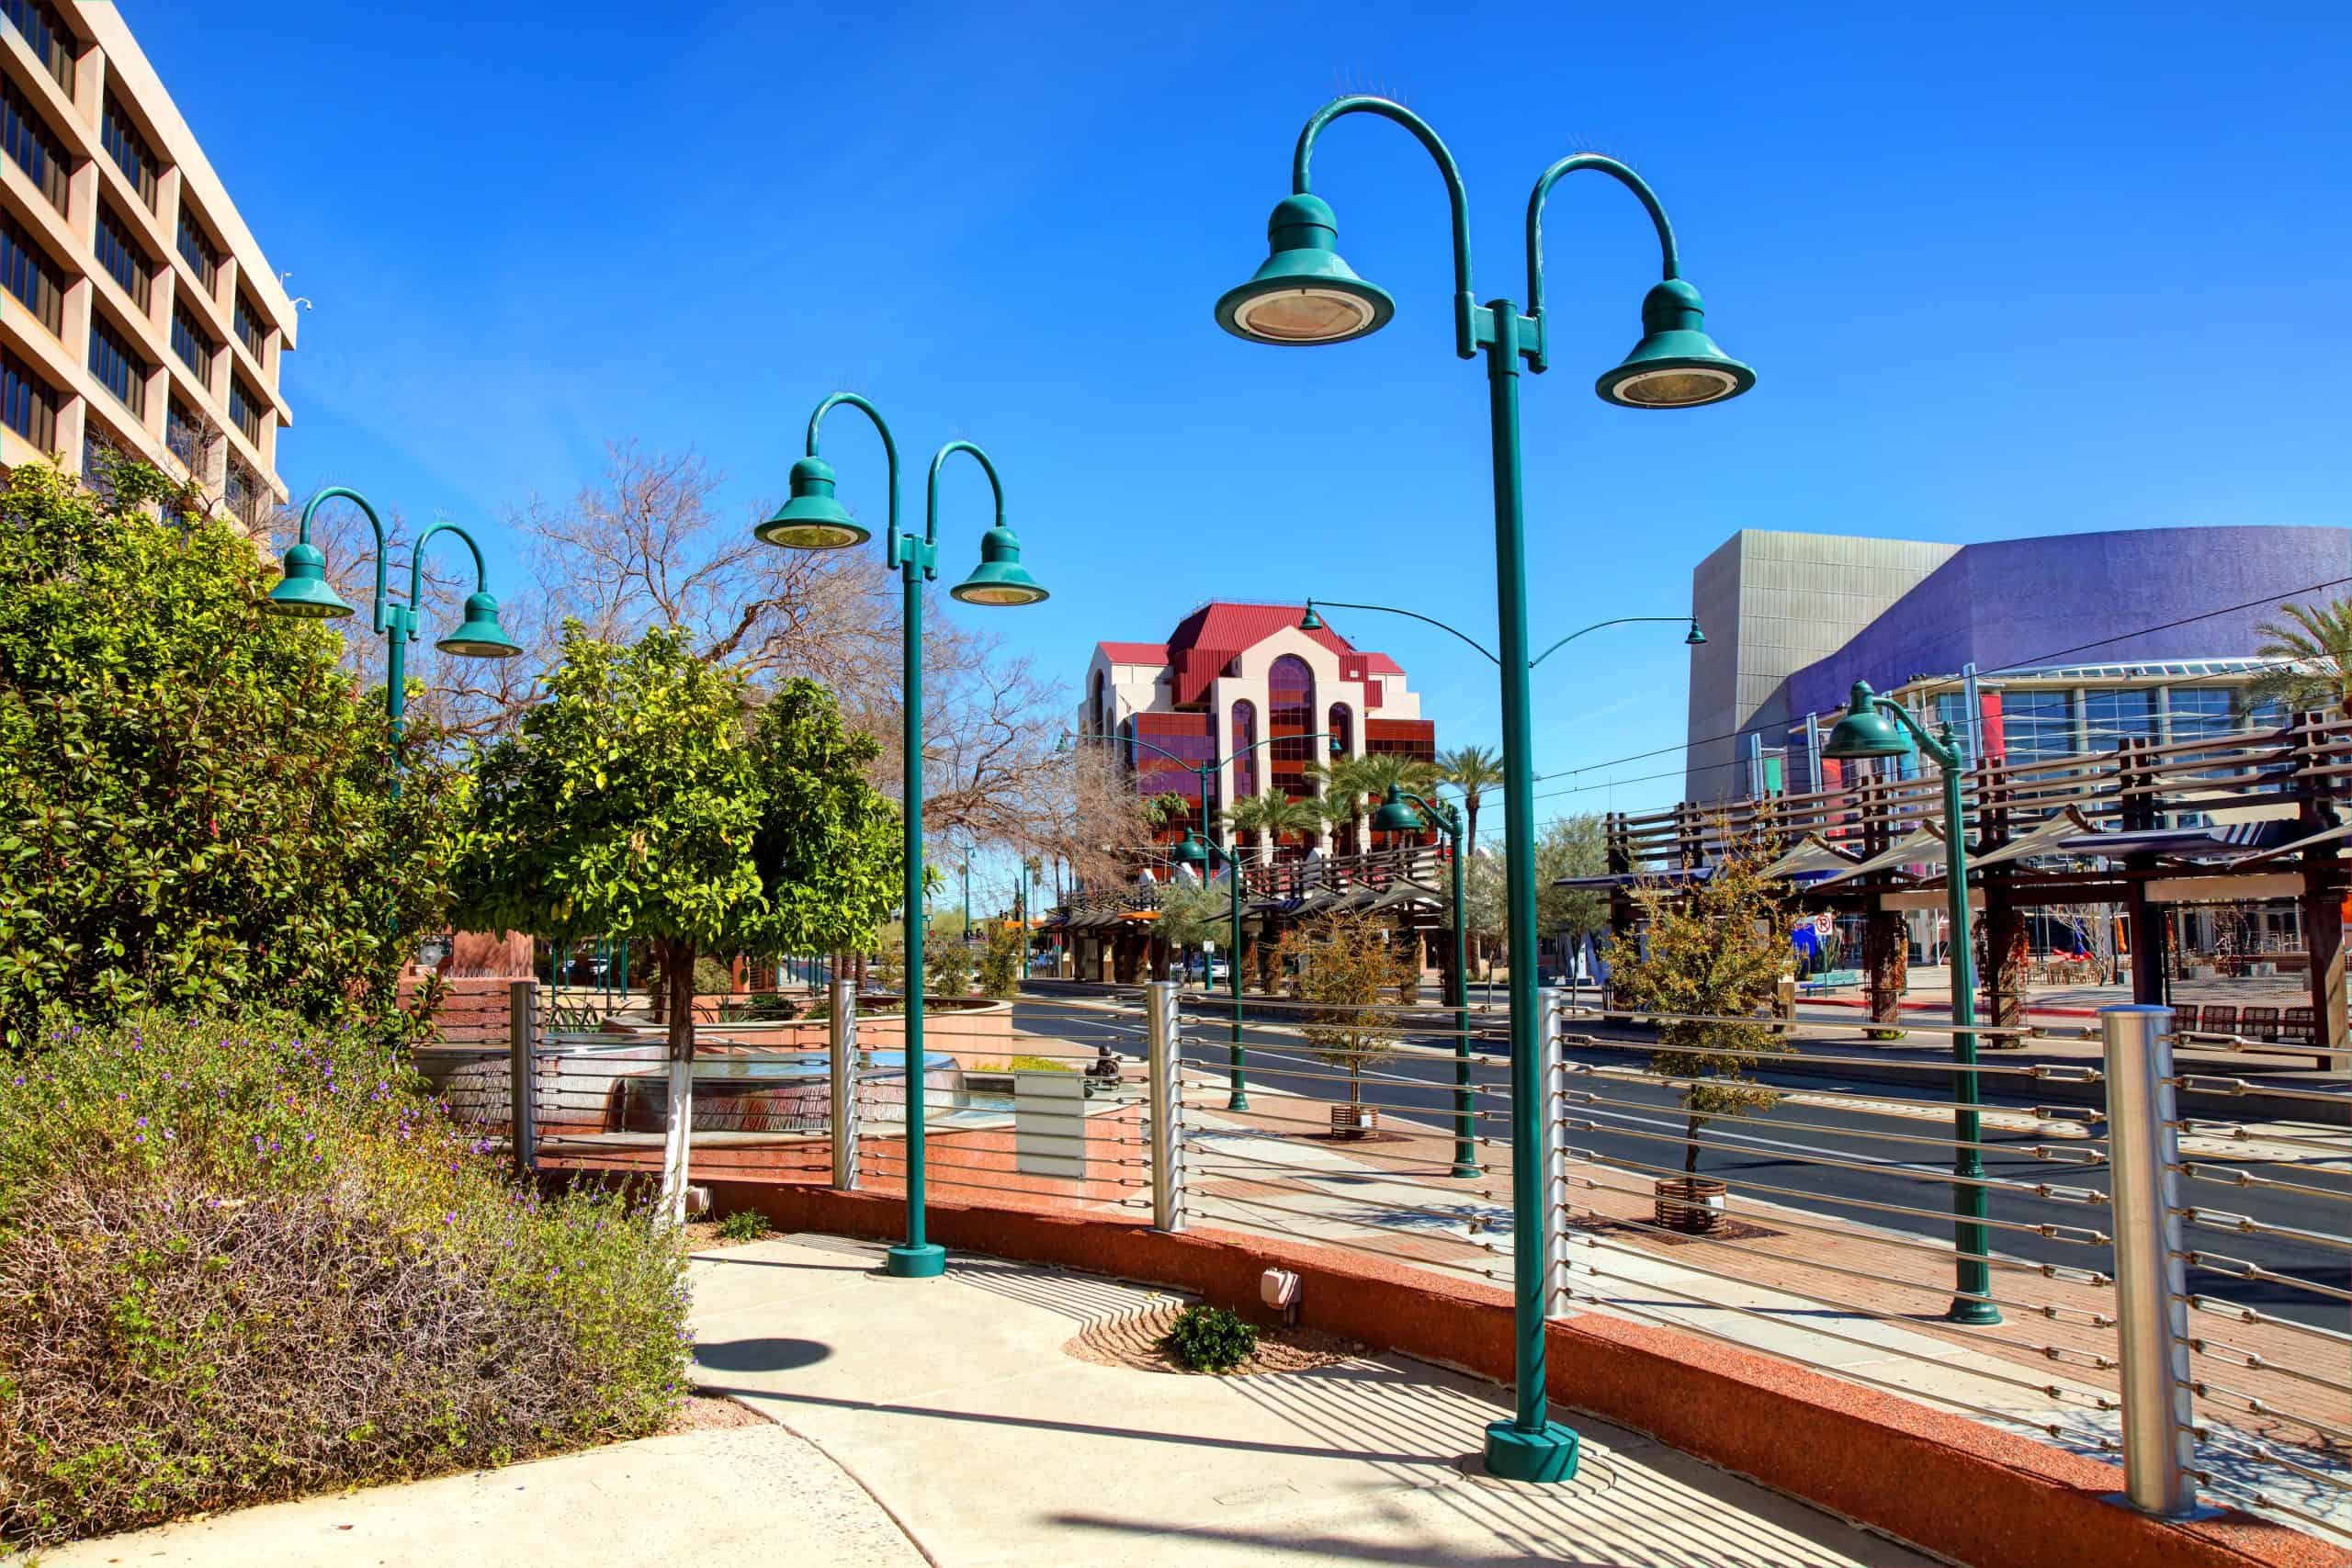
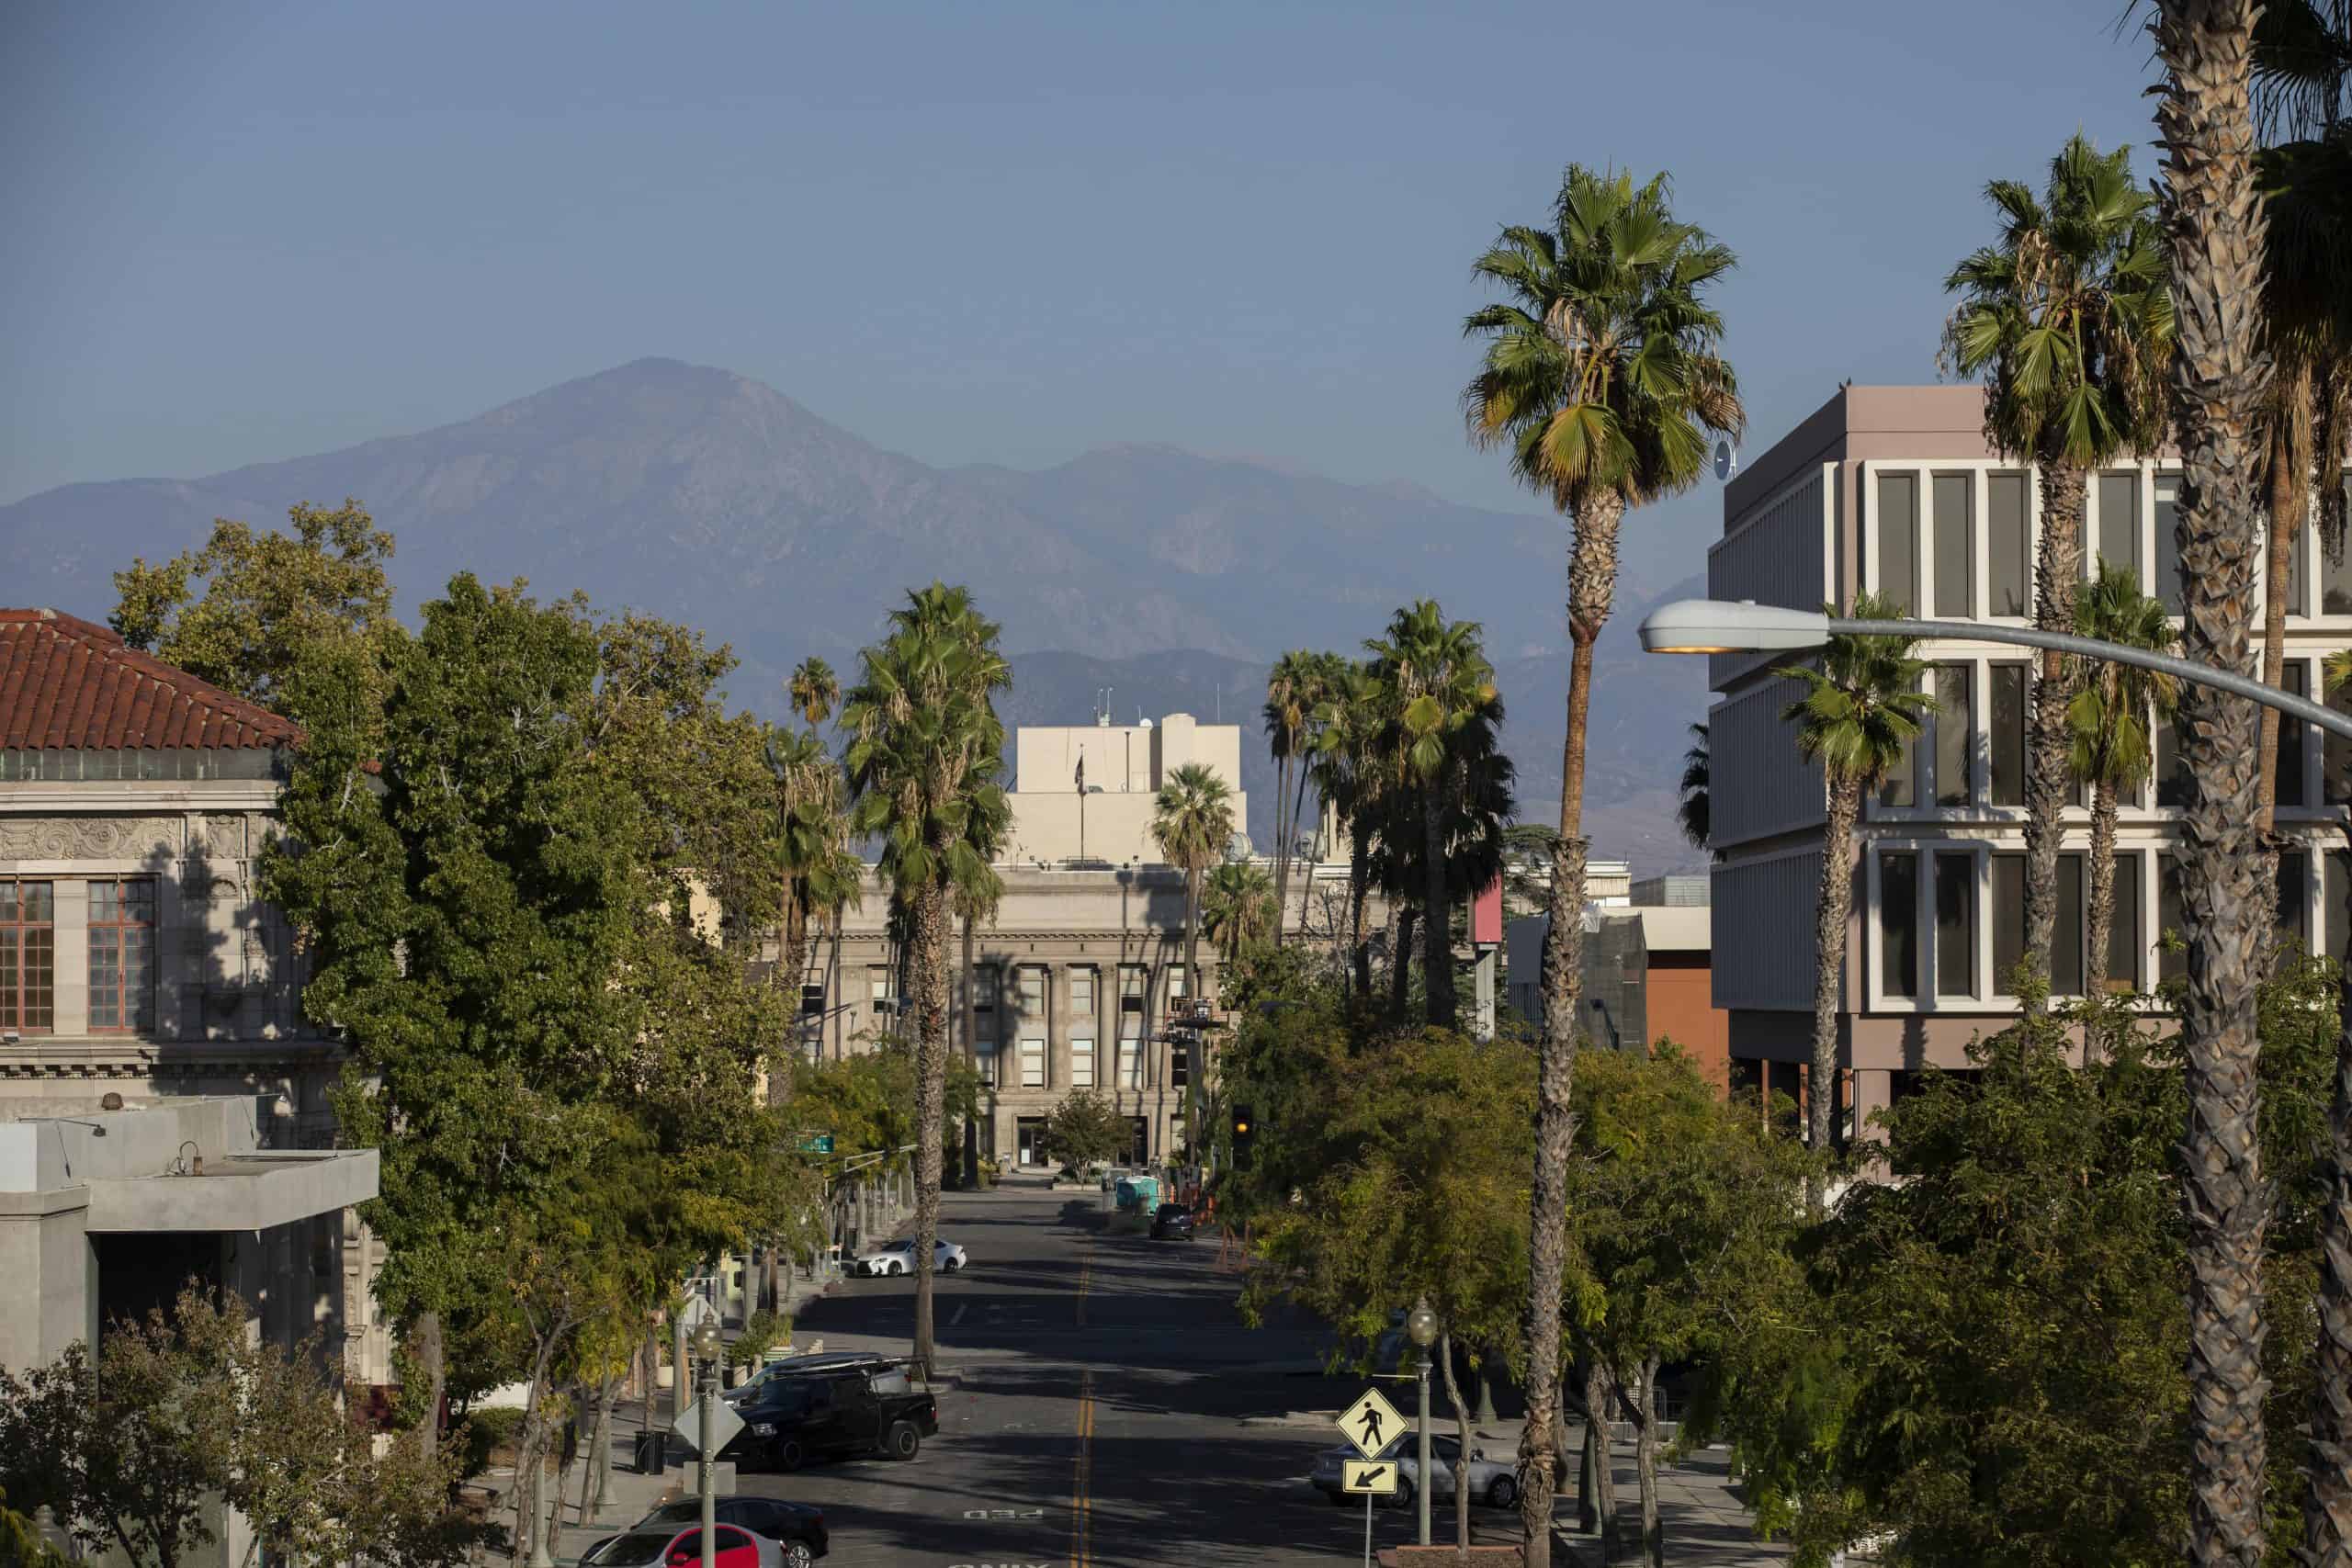
38. Phoenix, Arizona
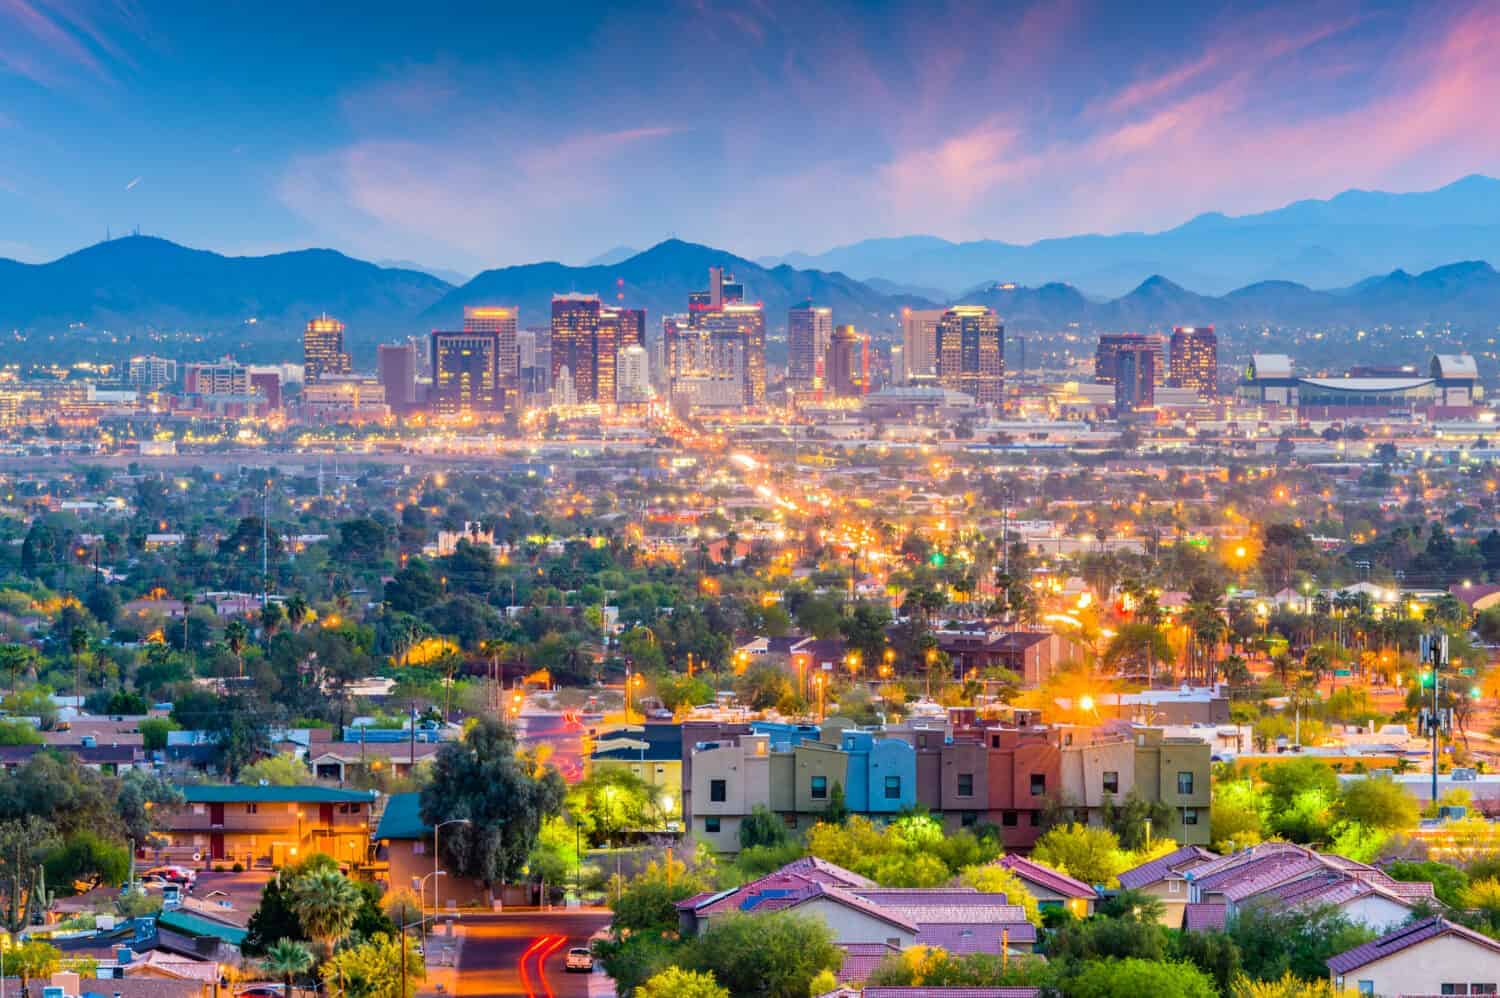
- Documented police killings, Jan. 2020 – Oct. 2024: 3.9 per 100,000 people (63 total)
- Gender of those killed: 93.7% male, 6.3% female
- Race/ethnicity of those killed: 28.6% White, 23.8% Black, 41.3% Hispanic, 3.2% Native American, 0.0% Asian
- Share of those killed with signs of a mental illness: 17.5%
- Share of those killed who were unarmed: 19.0%
- City population: 1,609,456
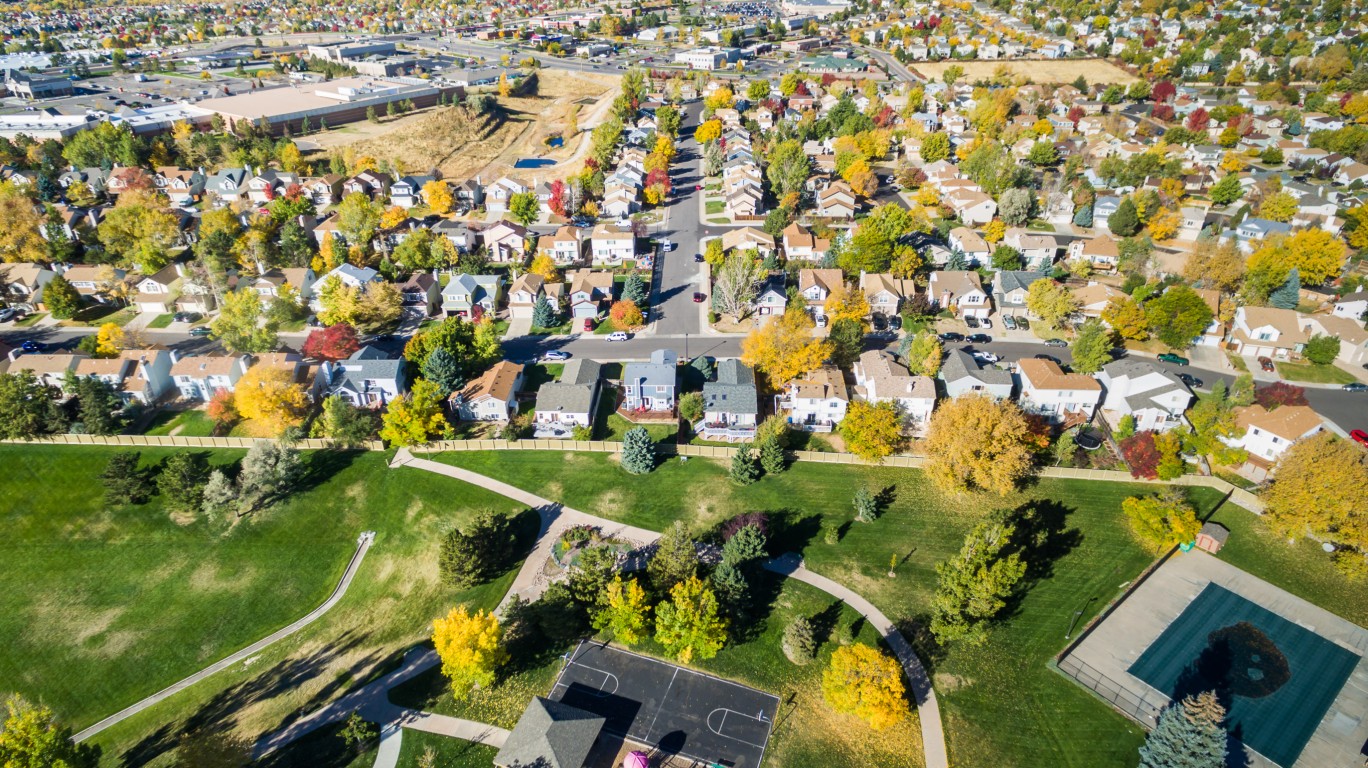
37. Denver, Colorado
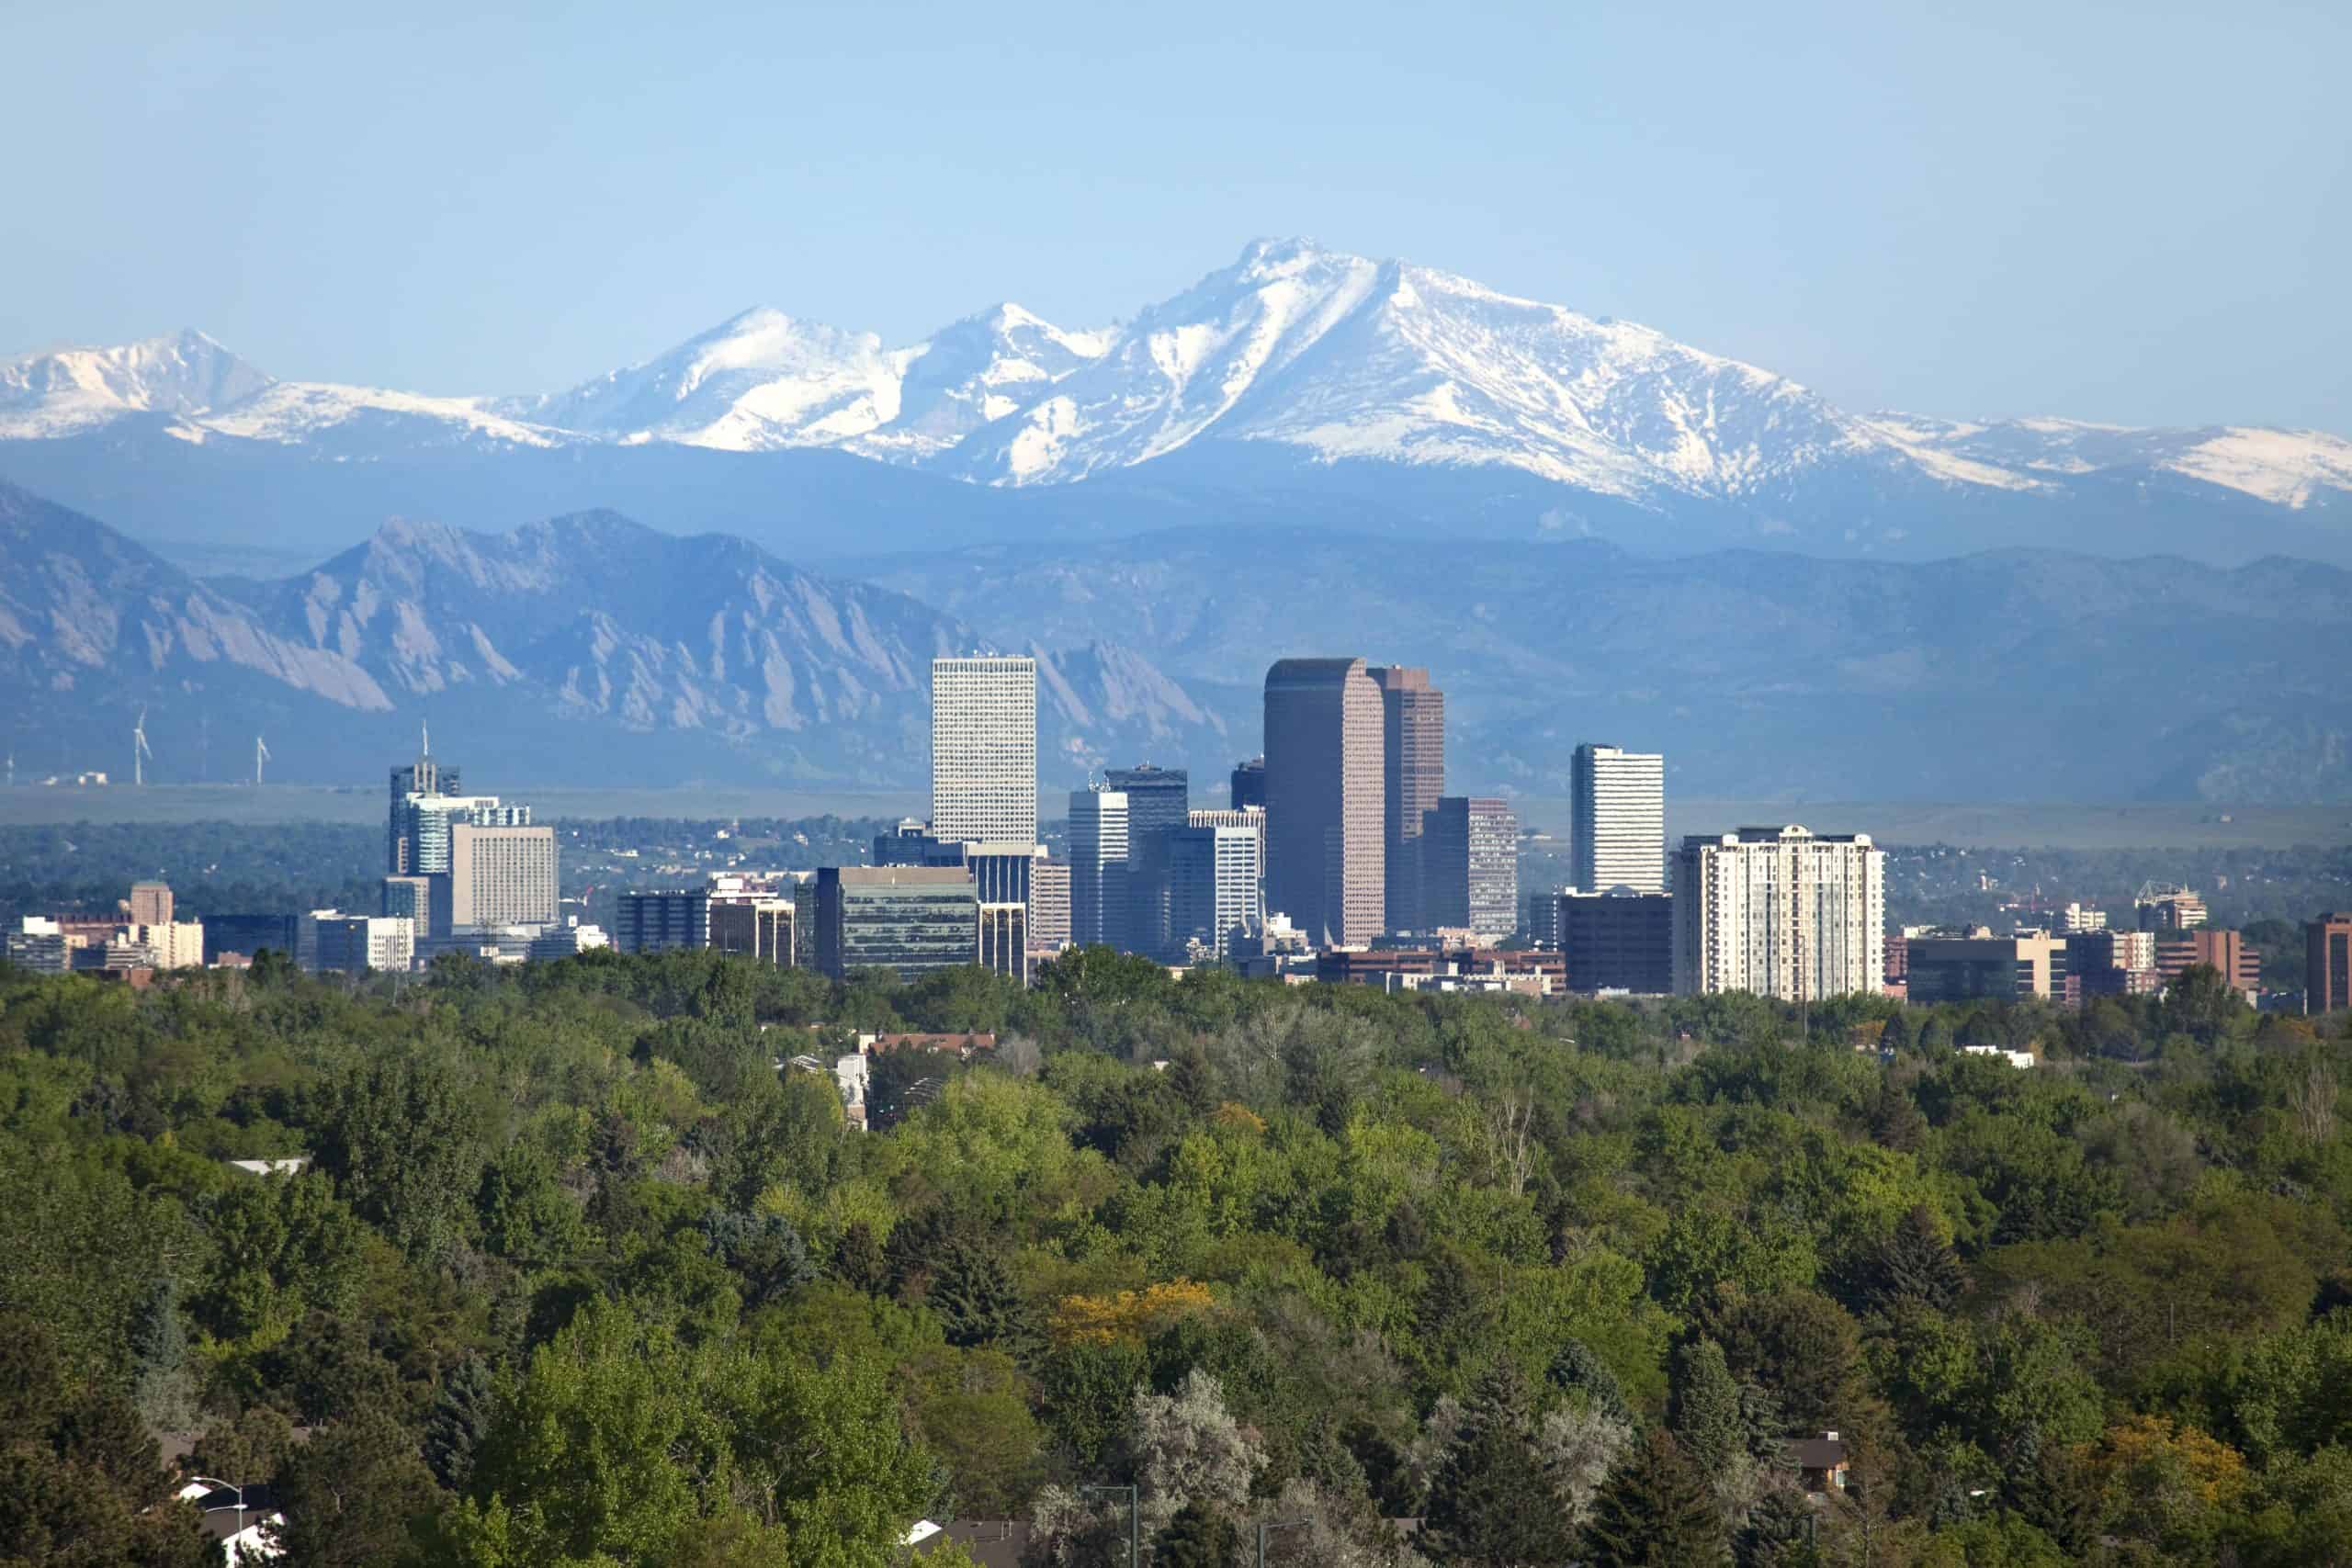
- Documented police killings, Jan. 2020 – Oct. 2024: 3.9 per 100,000 people (28 total)
- Gender of those killed: 92.9% male, 3.6% female
- Race/ethnicity of those killed: 10.7% White, 25.0% Black, 35.7% Hispanic, 3.6% Native American, 0.0% Asian
- Share of those killed with signs of a mental illness: 7.1%
- Share of those killed who were unarmed: 14.3%
- City population: 710,800
36. Houston, Texas
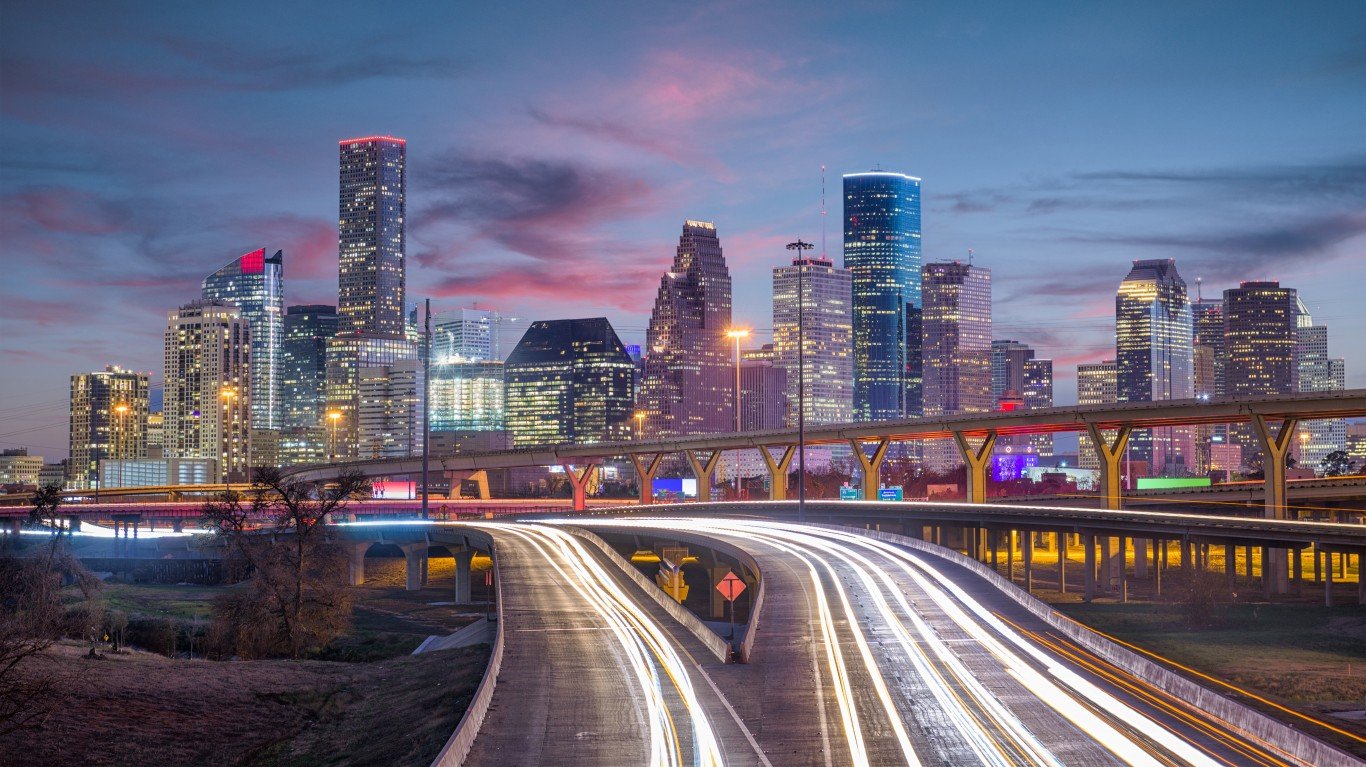
- Documented police killings, Jan. 2020 – Oct. 2024: 4.1 per 100,000 people (93 total)
- Gender of those killed: 95.7% male, 4.3% female
- Race/ethnicity of those killed: 6.5% White, 45.2% Black, 33.3% Hispanic, 0.0% Native American, 2.2% Asian
- Share of those killed with signs of a mental illness: 15.1%
- Share of those killed who were unarmed: 19.4%
- City population: 2,296,253
35. Detroit, Michigan
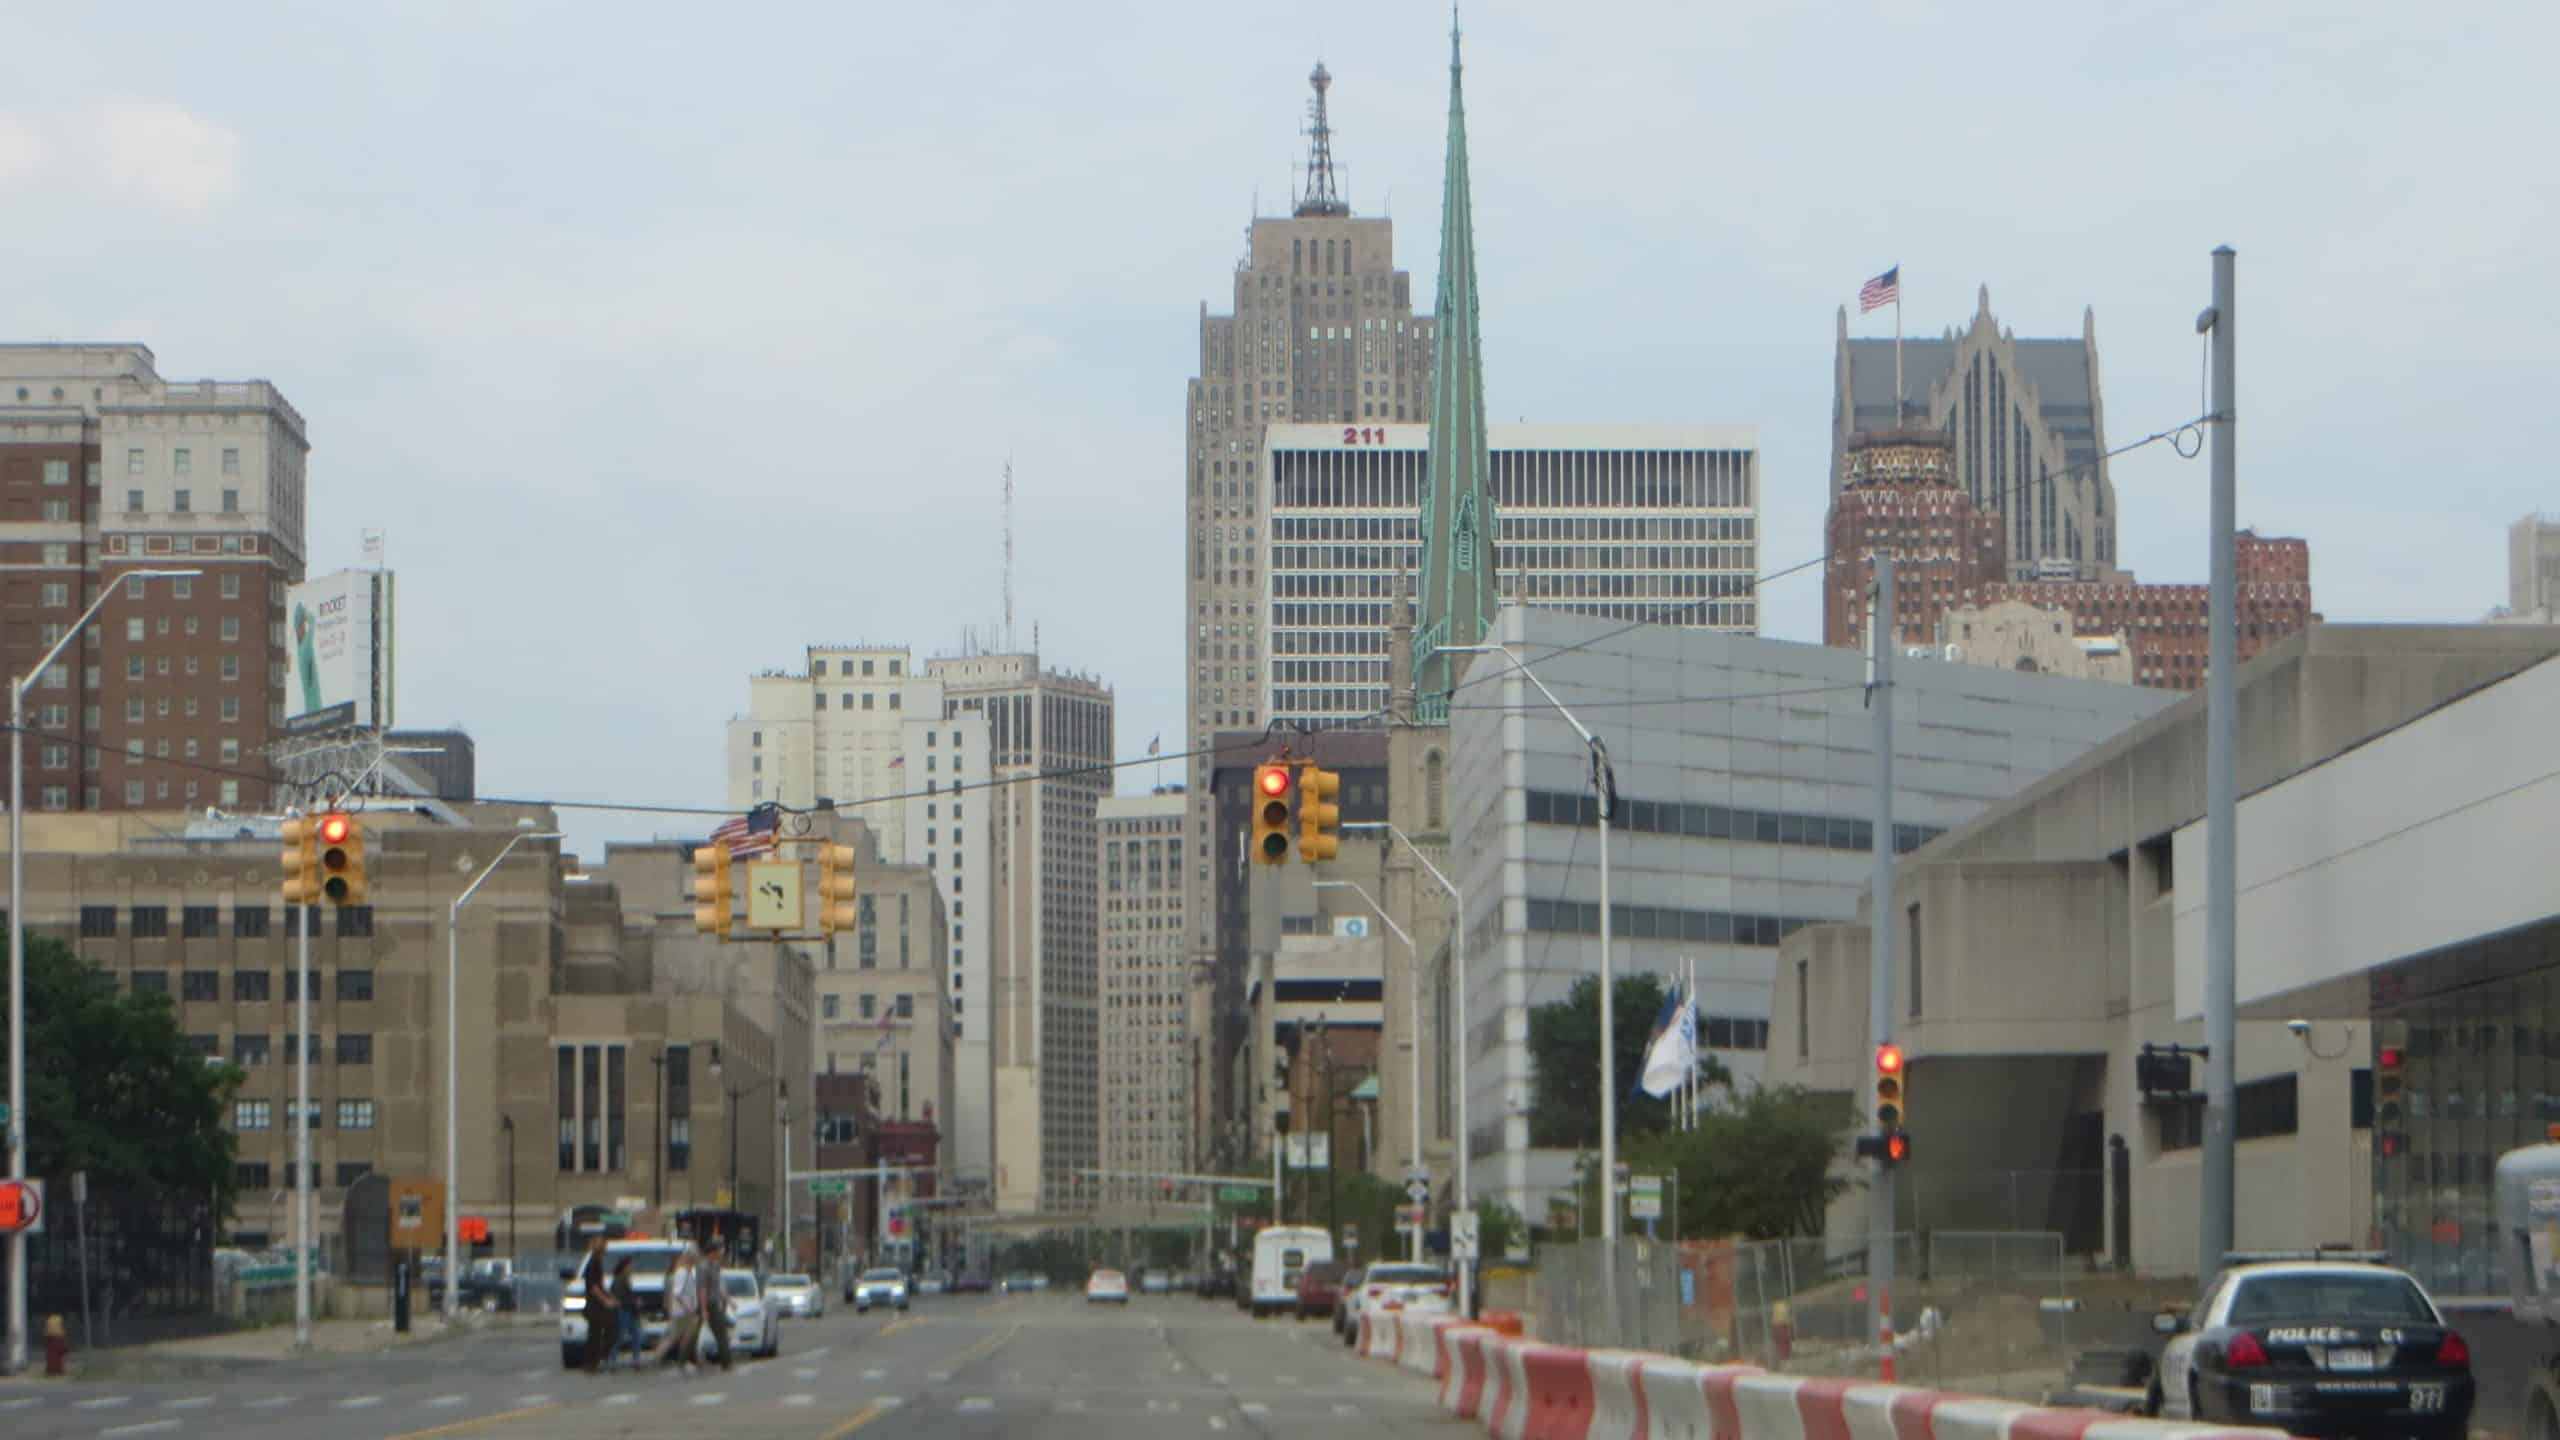
- Documented police killings, Jan. 2020 – Oct. 2024: 4.1 per 100,000 people (26 total)
- Gender of those killed: 92.3% male, 7.7% female
- Race/ethnicity of those killed: 19.2% White, 65.4% Black, 0.0% Hispanic, 0.0% Native American, 0.0% Asian
- Share of those killed with signs of a mental illness: 23.1%
- Share of those killed who were unarmed: 11.5%
- City population: 636,787
34. North Las Vegas, Nevada
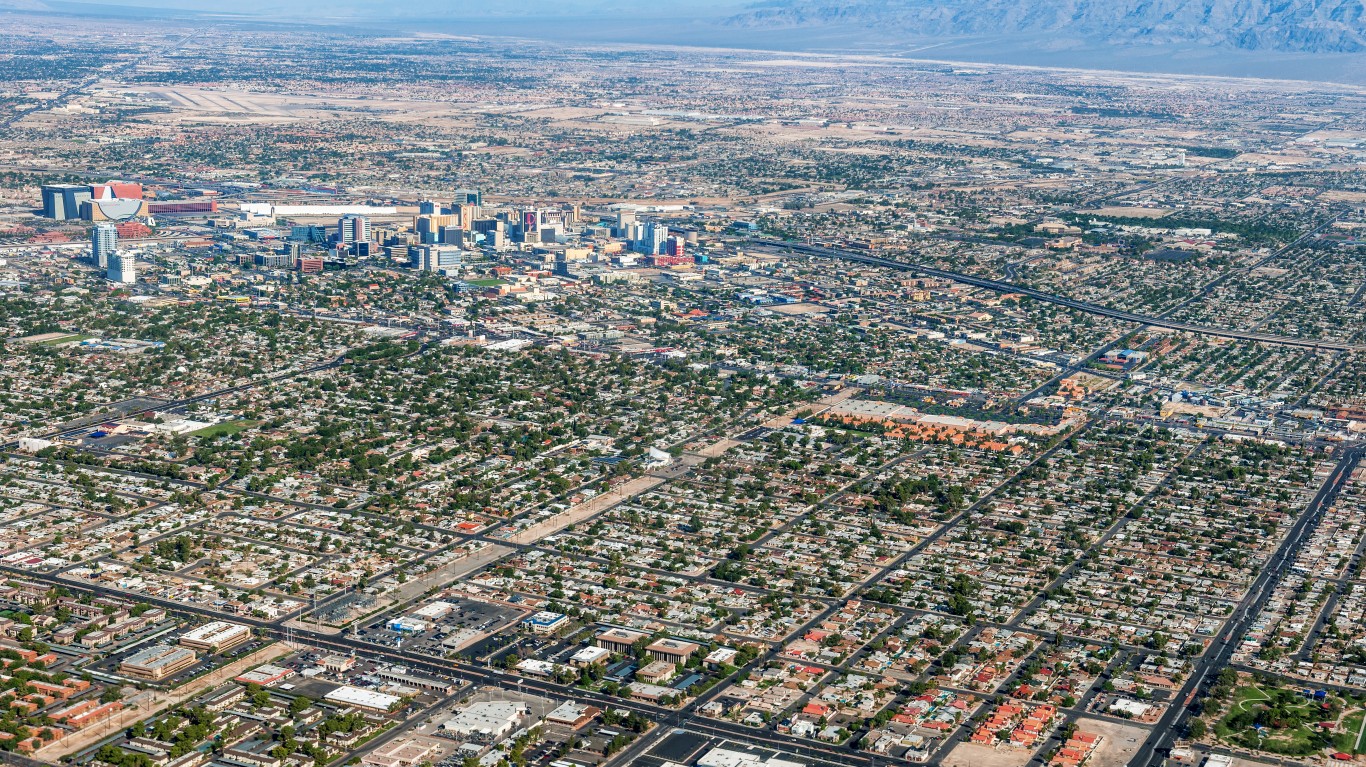
- Documented police killings, Jan. 2020 – Oct. 2024: 4.2 per 100,000 people (11 total)
- Gender of those killed: 90.9% male, 9.1% female
- Race/ethnicity of those killed: 36.4% White, 36.4% Black, 9.1% Hispanic, 0.0% Native American, 0.0% Asian
- Share of those killed with signs of a mental illness: 0.0%
- Share of those killed who were unarmed: 9.1%
- City population: 264,022
33. Colorado Springs, Colorado
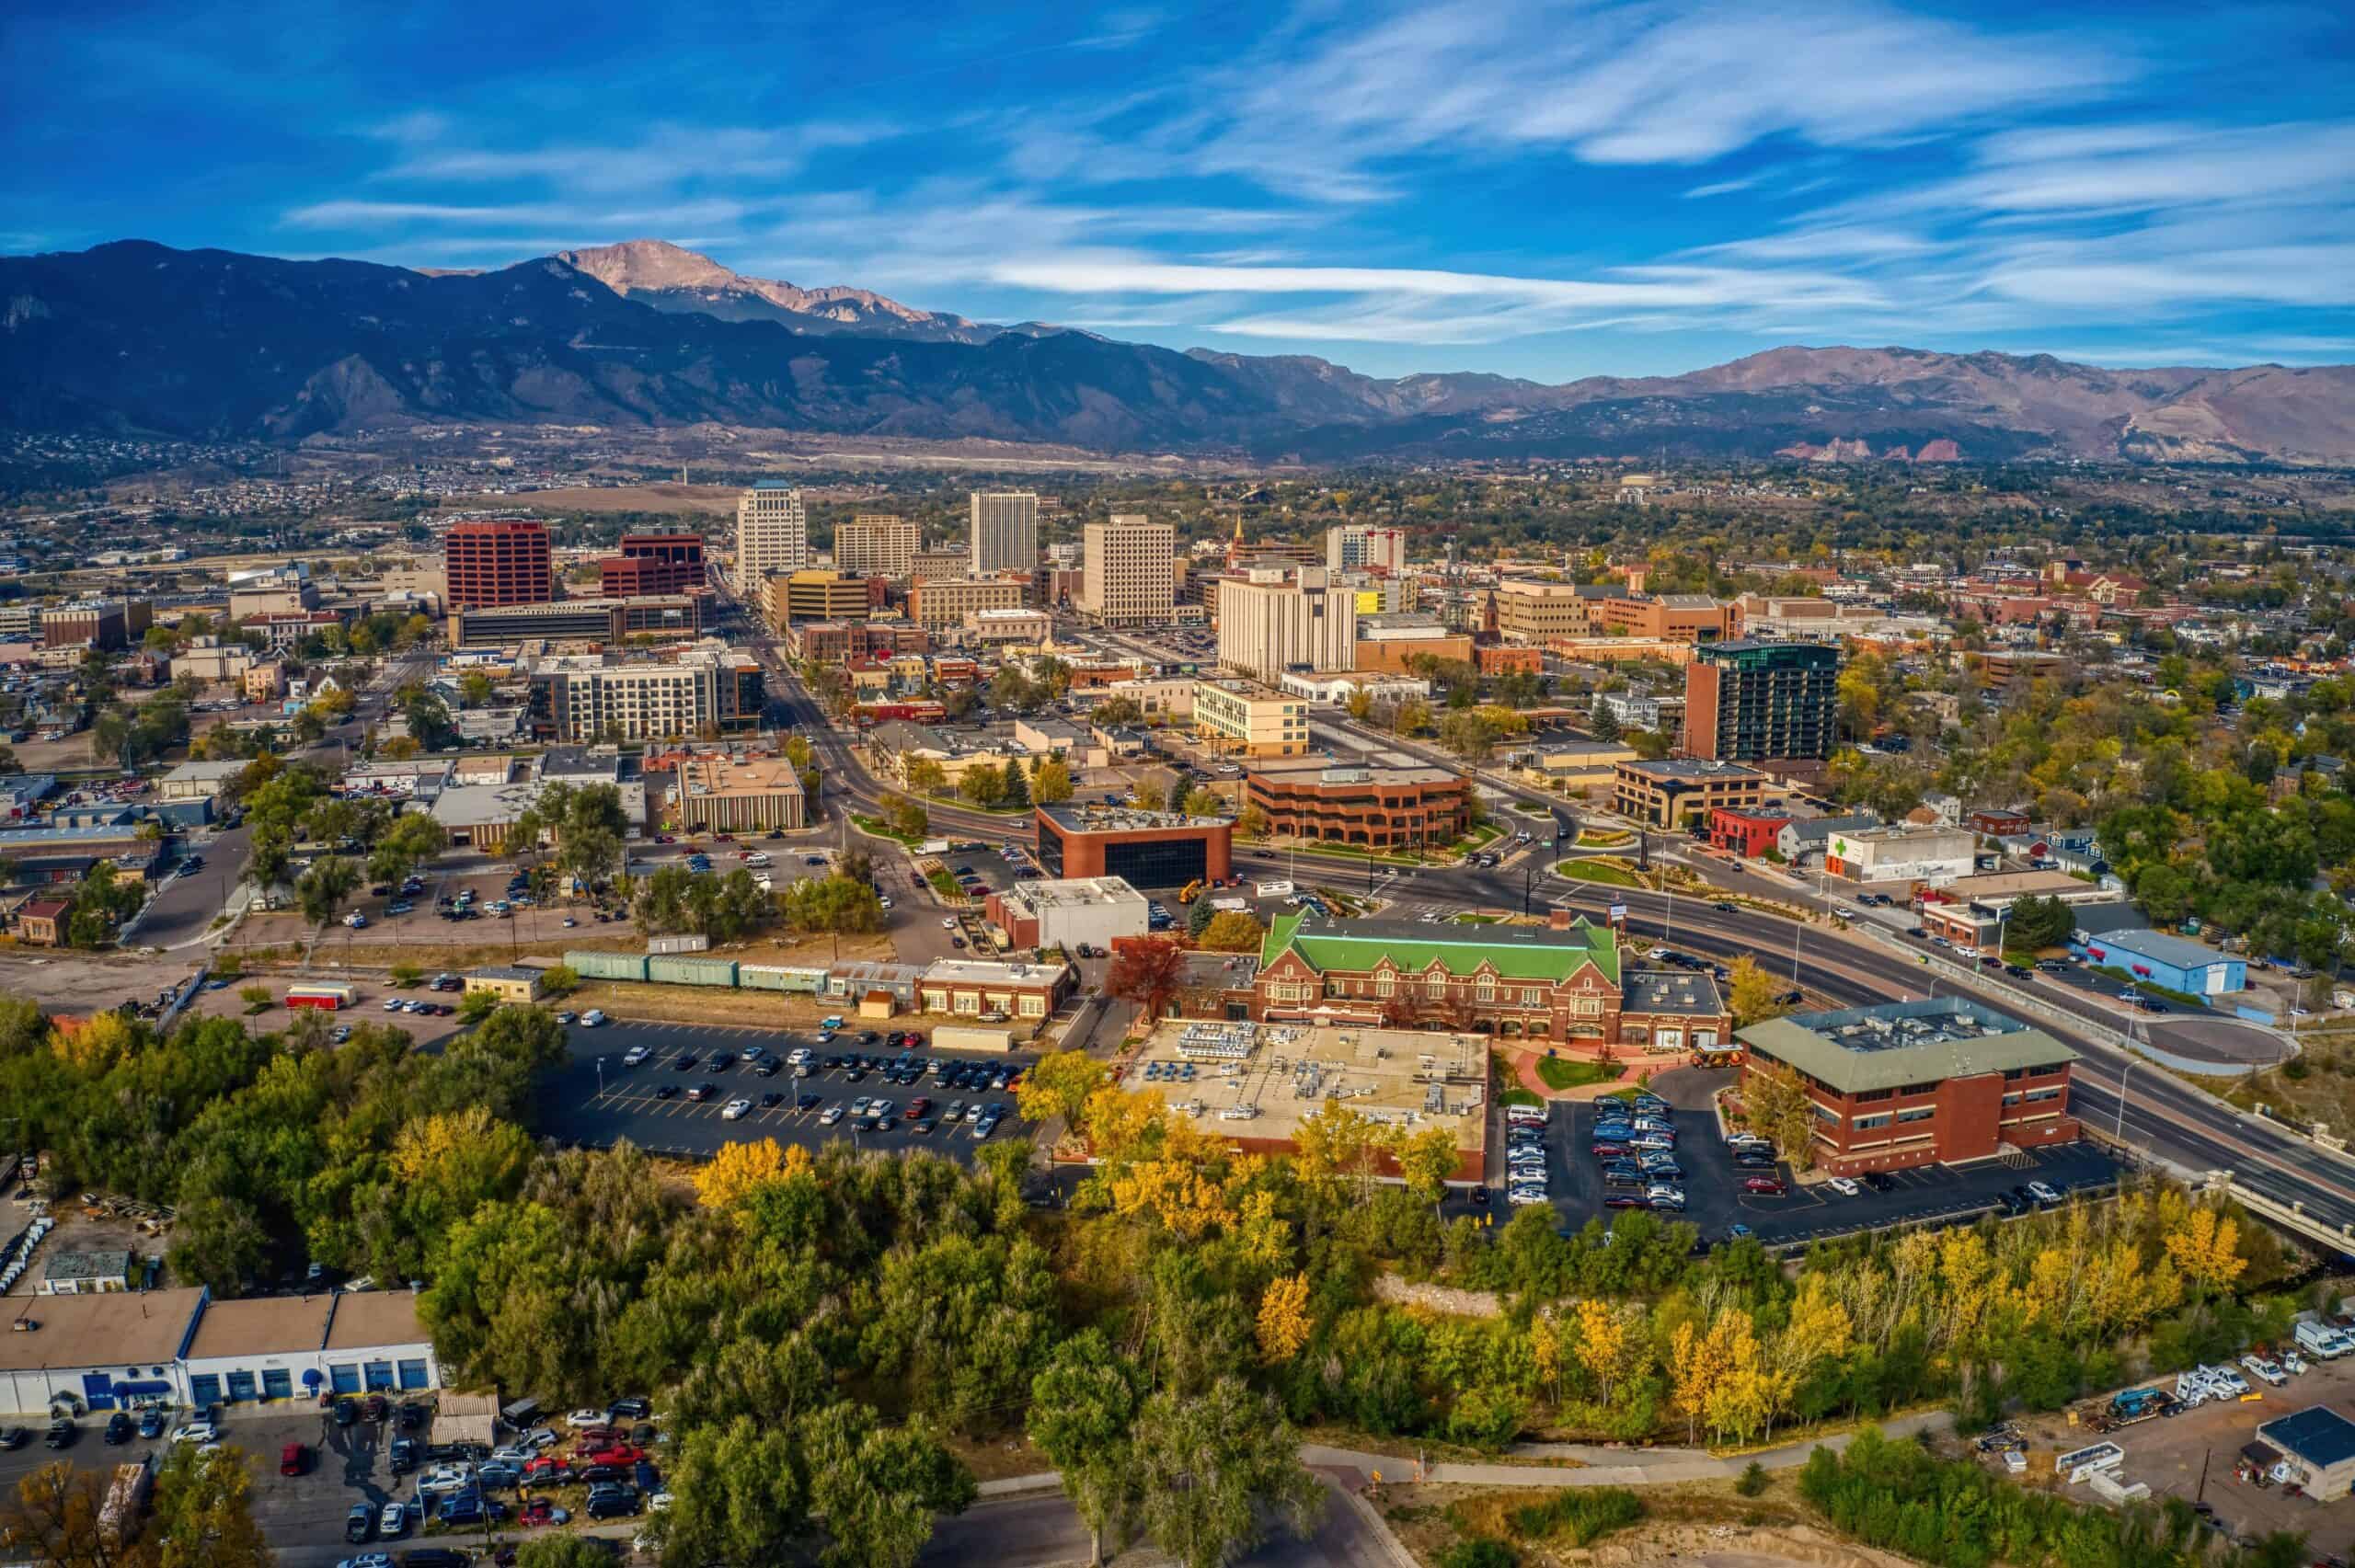
- Documented police killings, Jan. 2020 – Oct. 2024: 4.2 per 100,000 people (20 total)
- Gender of those killed: 100.0% male, 0.0% female
- Race/ethnicity of those killed: 45.0% White, 25.0% Black, 15.0% Hispanic, 0.0% Native American, 0.0% Asian
- Share of those killed with signs of a mental illness: 25.0%
- Share of those killed who were unarmed: 15.0%
- City population: 479,612
32. Mesa, Arizona
- Documented police killings, Jan. 2020 – Oct. 2024: 4.2 per 100,000 people (21 total)
- Gender of those killed: 90.5% male, 9.5% female
- Race/ethnicity of those killed: 33.3% White, 4.8% Black, 28.6% Hispanic, 0.0% Native American, 0.0% Asian
- Share of those killed with signs of a mental illness: 14.3%
- Share of those killed who were unarmed: 23.8%
- City population: 503,390
31. Lubbock, Texas
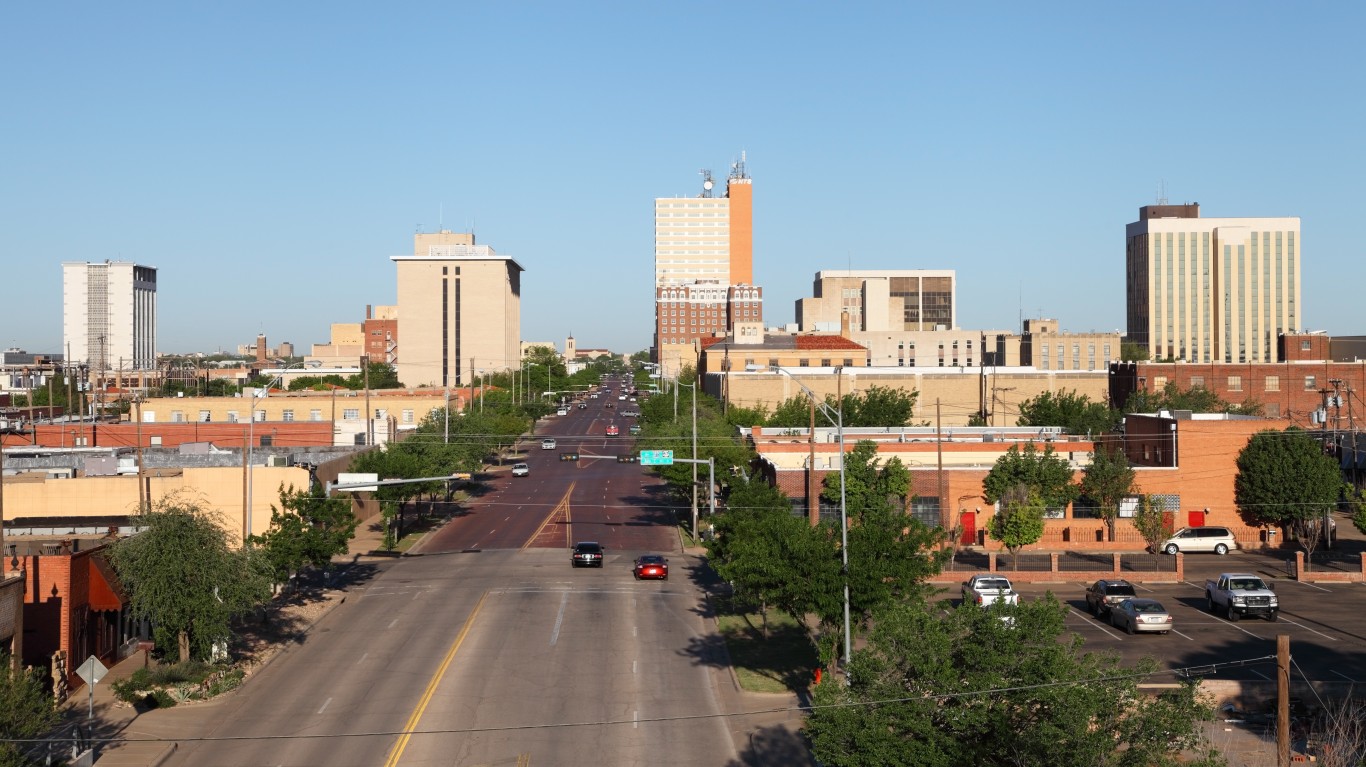
- Documented police killings, Jan. 2020 – Oct. 2024: 4.3 per 100,000 people (11 total)
- Gender of those killed: 90.9% male, 9.1% female
- Race/ethnicity of those killed: 27.3% White, 9.1% Black, 54.5% Hispanic, 0.0% Native American, 0.0% Asian
- Share of those killed with signs of a mental illness: 18.2%
- Share of those killed who were unarmed: 0.0%
- City population: 258,190
30. Aurora, Colorado
- Documented police killings, Jan. 2020 – Oct. 2024: 4.4 per 100,000 people (17 total)
- Gender of those killed: 94.1% male, 5.9% female
- Race/ethnicity of those killed: 23.5% White, 35.3% Black, 29.4% Hispanic, 5.9% Native American, 0.0% Asian
- Share of those killed with signs of a mental illness: 11.8%
- Share of those killed who were unarmed: 23.5%
- City population: 387,349
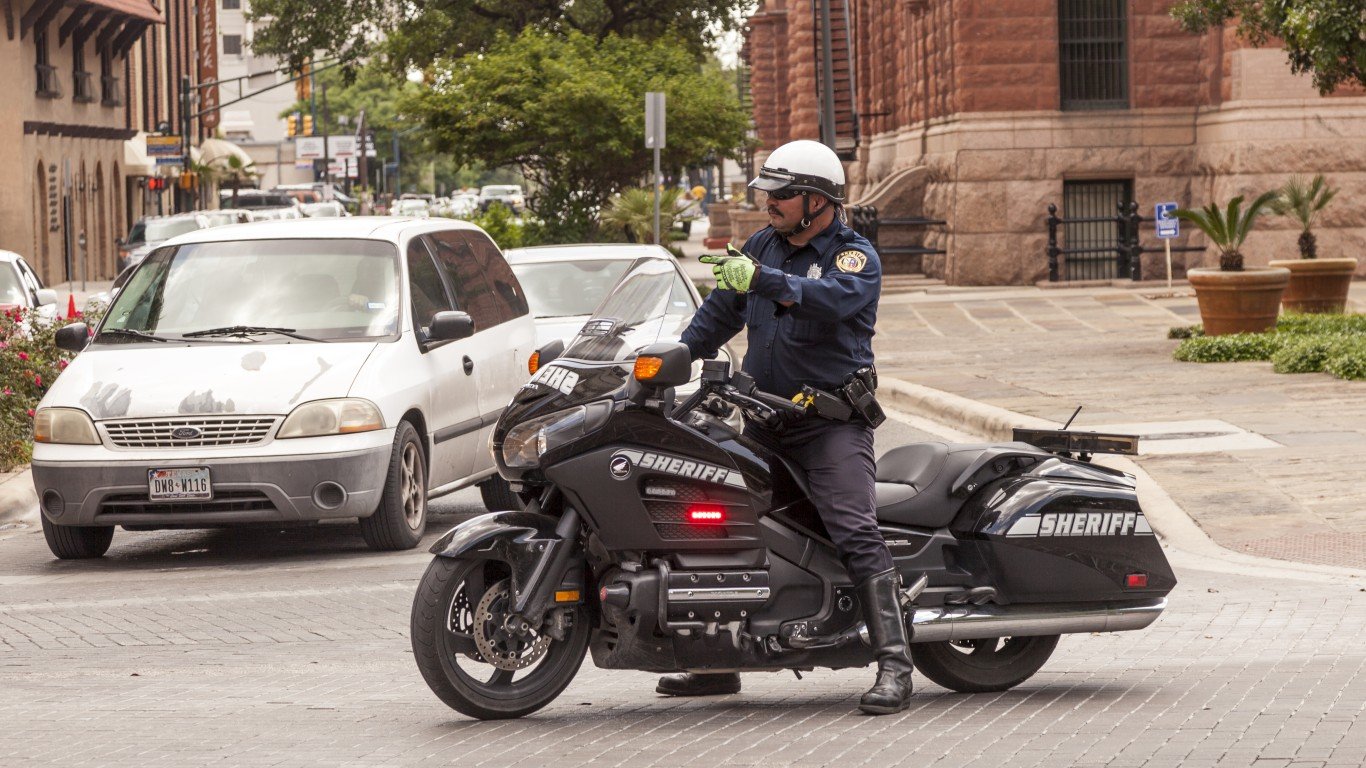
29. San Antonio, Texas
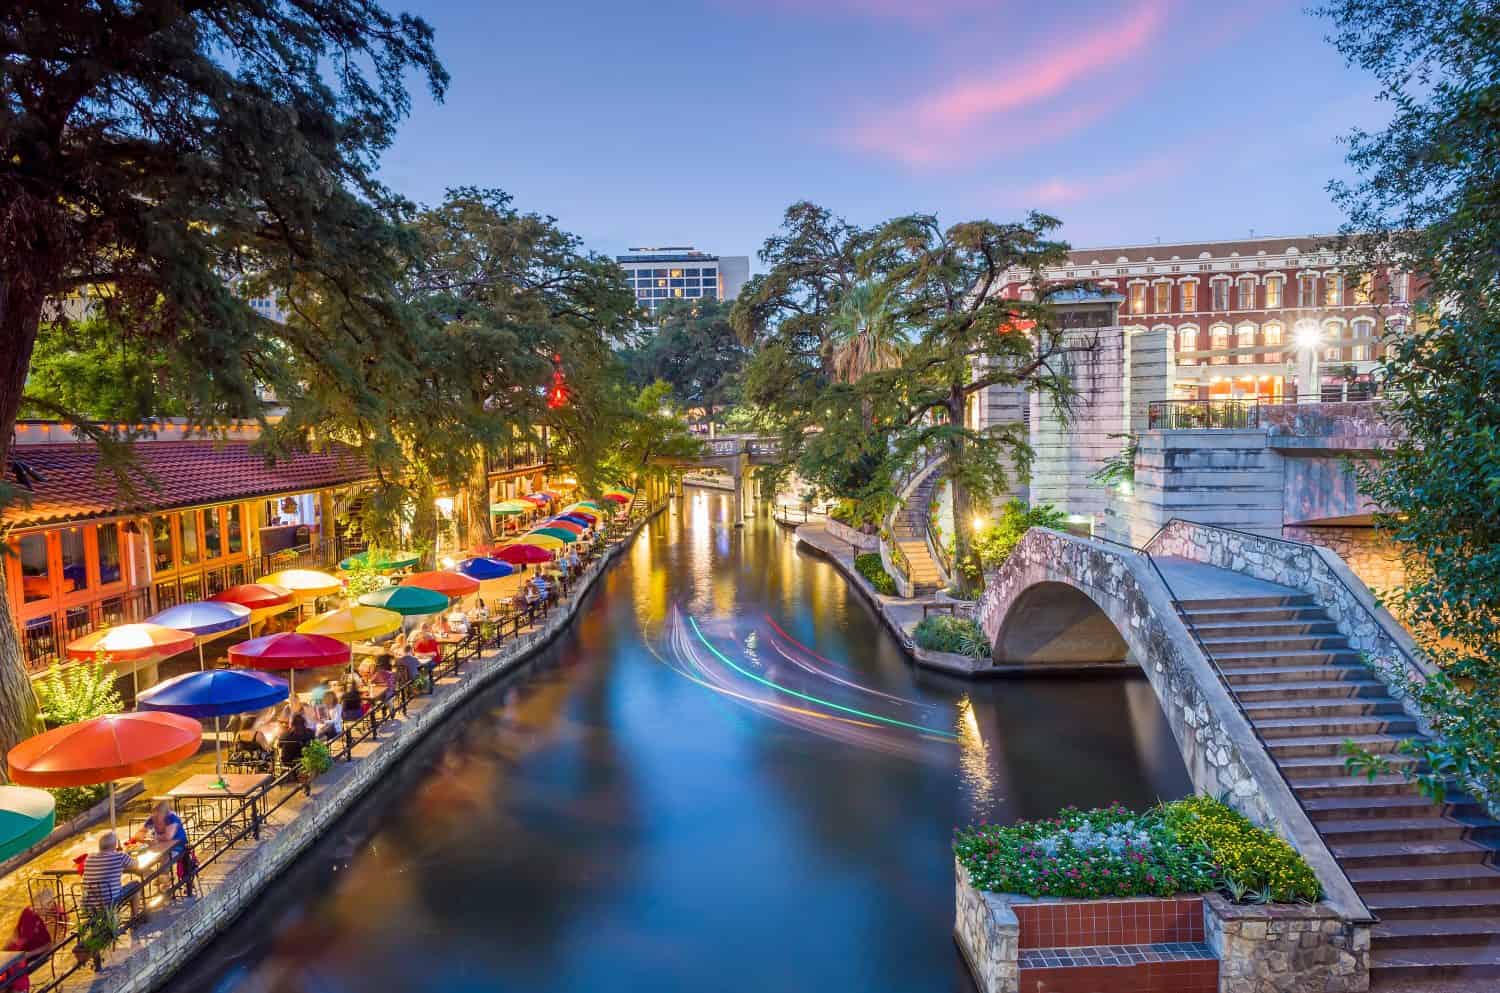
- Documented police killings, Jan. 2020 – Oct. 2024: 4.5 per 100,000 people (65 total)
- Gender of those killed: 93.8% male, 6.2% female
- Race/ethnicity of those killed: 13.8% White, 10.8% Black, 69.2% Hispanic, 0.0% Native American, 3.1% Asian
- Share of those killed with signs of a mental illness: 10.8%
- Share of those killed who were unarmed: 12.3%
- City population: 1,445,662
28. Boise, Idaho

- Documented police killings, Jan. 2020 – Oct. 2024: 4.7 per 100,000 people (11 total)
- Gender of those killed: 100.0% male, 0.0% female
- Race/ethnicity of those killed: 63.6% White, 0.0% Black, 9.1% Hispanic, 0.0% Native American, 0.0% Asian
- Share of those killed with signs of a mental illness: 36.4%
- Share of those killed who were unarmed: 9.1%
- City population: 234,192
27. Fontana, California
- Documented police killings, Jan. 2020 – Oct. 2024: 4.8 per 100,000 people (10 total)
- Gender of those killed: 100.0% male, 0.0% female
- Race/ethnicity of those killed: 10.0% White, 20.0% Black, 50.0% Hispanic, 0.0% Native American, 0.0% Asian
- Share of those killed with signs of a mental illness: 20.0%
- Share of those killed who were unarmed: 30.0%
- City population: 209,279
26. Fayetteville, North Carolina
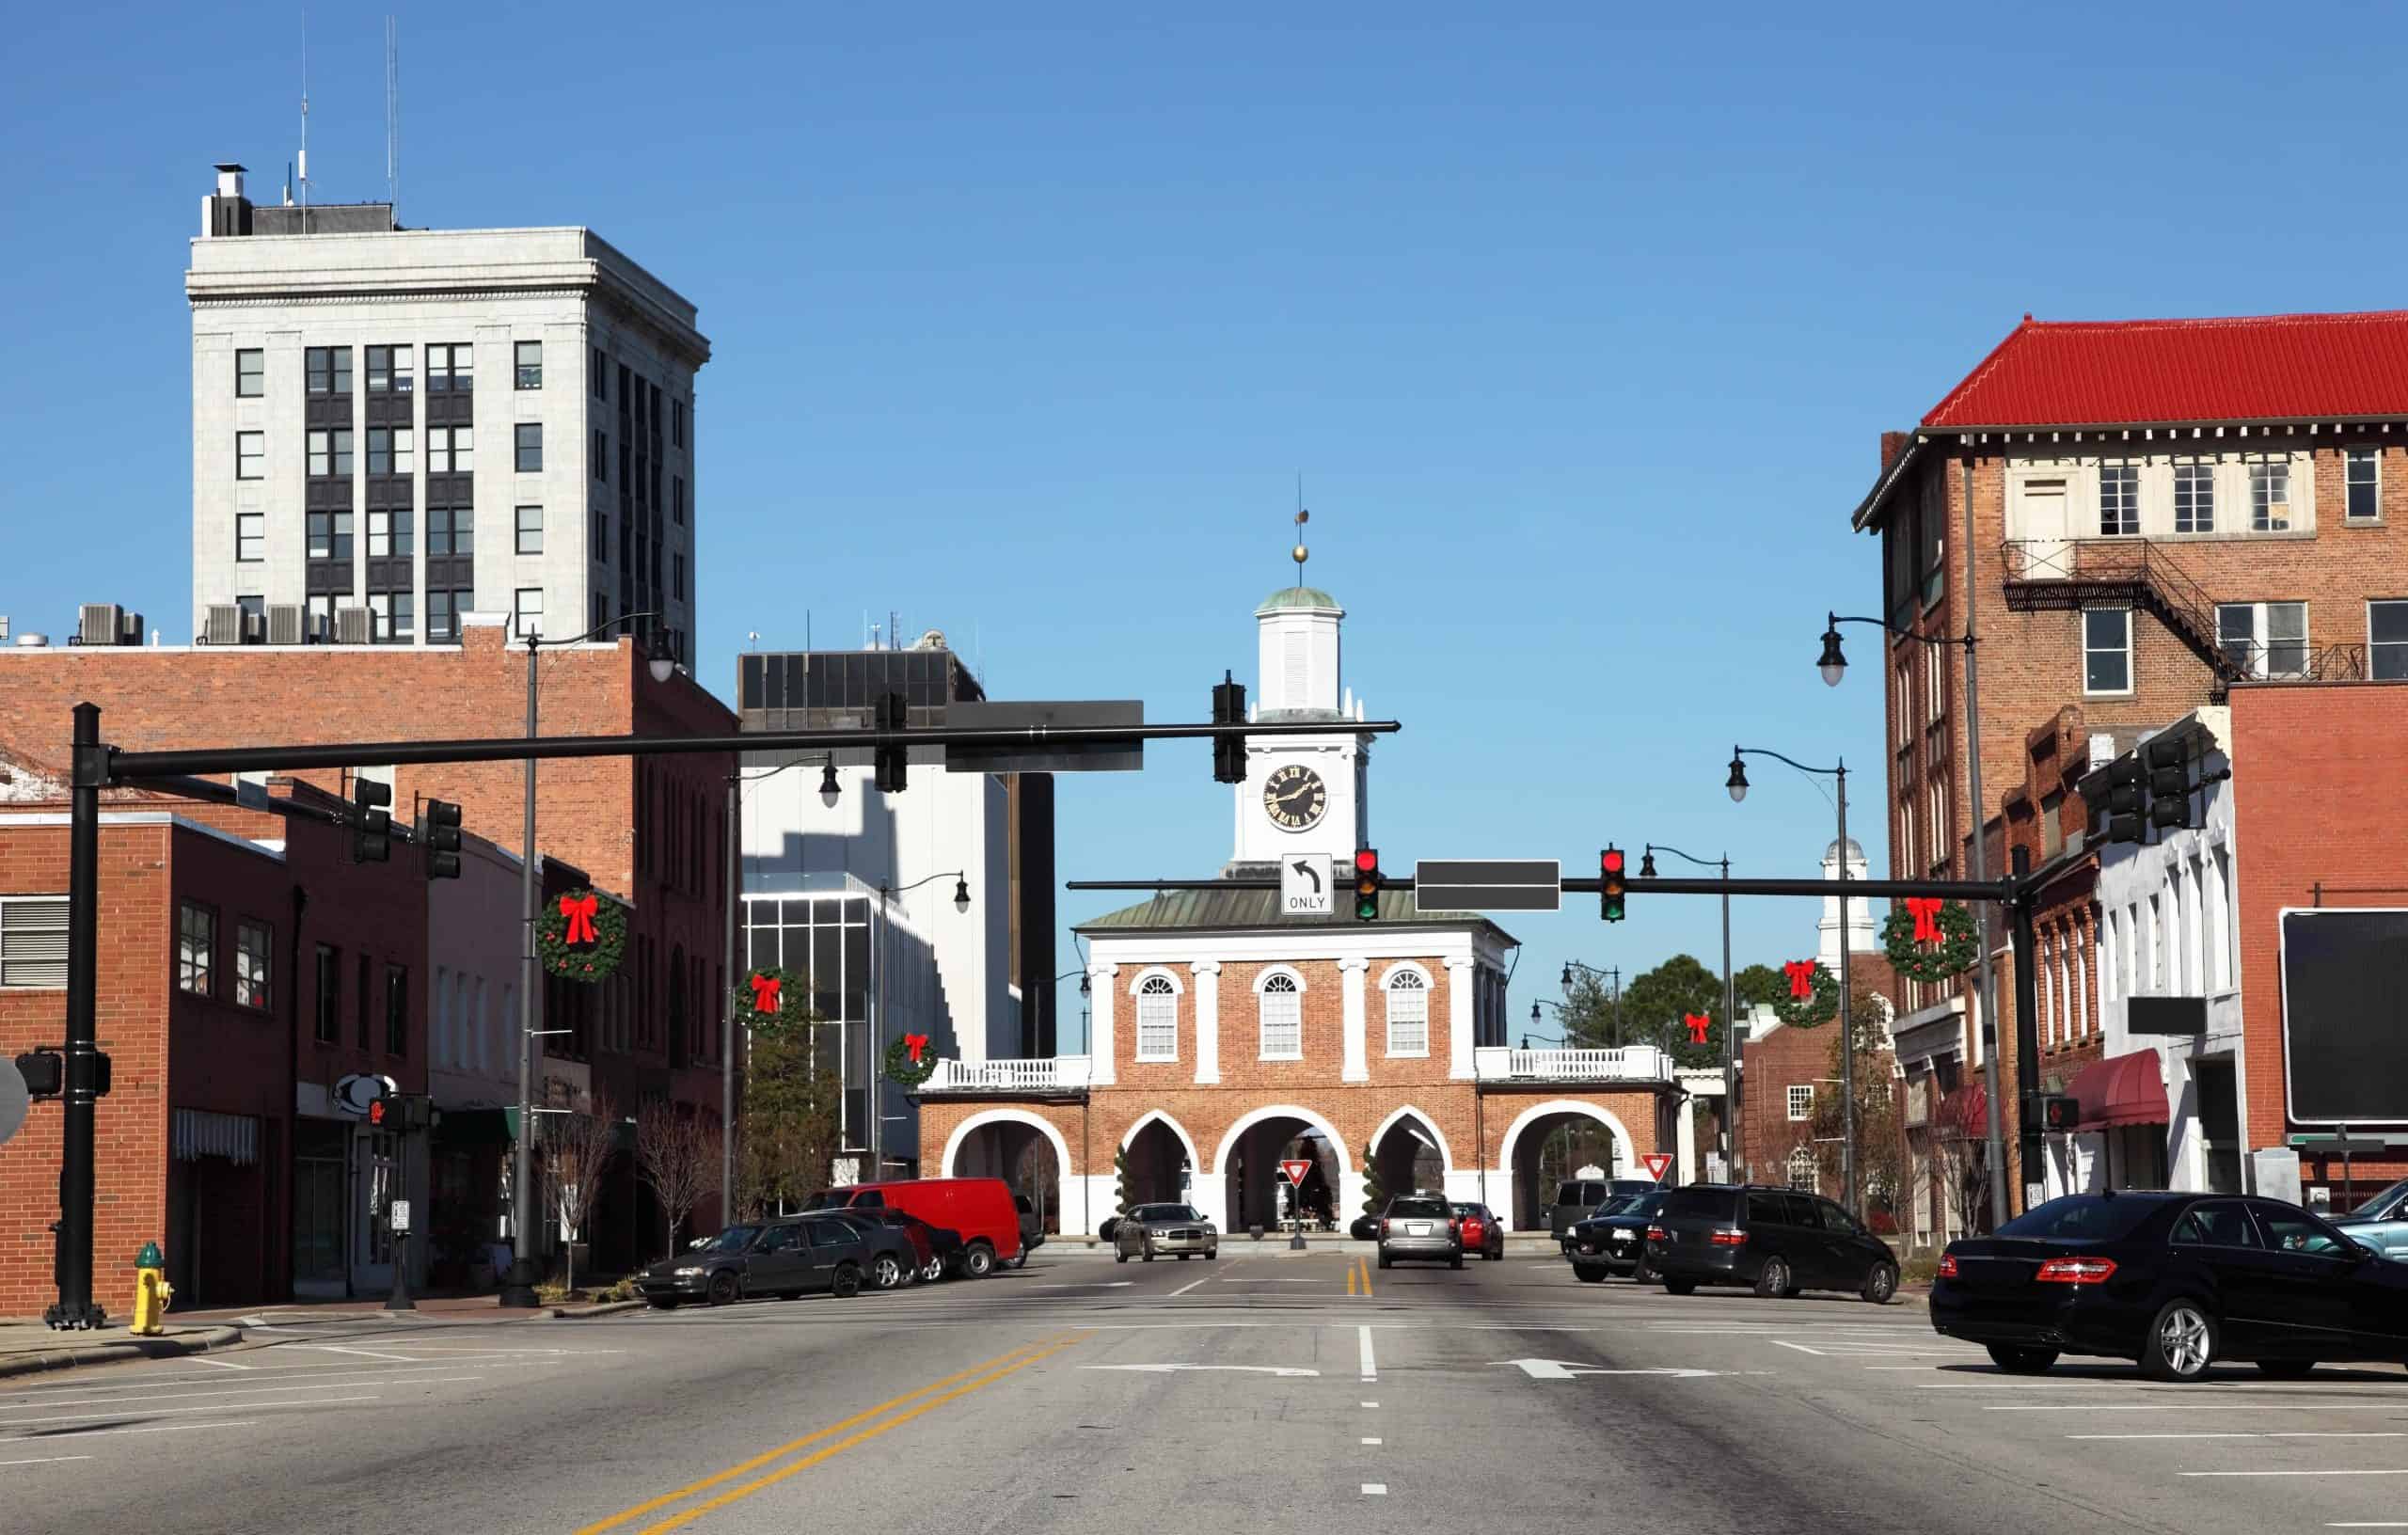
- Documented police killings, Jan. 2020 – Oct. 2024: 4.8 per 100,000 people (10 total)
- Gender of those killed: 70.0% male, 30.0% female
- Race/ethnicity of those killed: 40.0% White, 50.0% Black, 10.0% Hispanic, 0.0% Native American, 0.0% Asian
- Share of those killed with signs of a mental illness: 30.0%
- Share of those killed who were unarmed: 40.0%
- City population: 208,697
25. Little Rock, Arkansas

- Documented police killings, Jan. 2020 – Oct. 2024: 4.9 per 100,000 people (10 total)
- Gender of those killed: 100.0% male, 0.0% female
- Race/ethnicity of those killed: 40.0% White, 60.0% Black, 0.0% Hispanic, 0.0% Native American, 0.0% Asian
- Share of those killed with signs of a mental illness: 30.0%
- Share of those killed who were unarmed: 20.0%
- City population: 202,218
24. Tacoma, Washington
- Documented police killings, Jan. 2020 – Oct. 2024: 5.0 per 100,000 people (11 total)
- Gender of those killed: 90.9% male, 9.1% female
- Race/ethnicity of those killed: 45.5% White, 27.3% Black, 9.1% Hispanic, 0.0% Native American, 0.0% Asian
- Share of those killed with signs of a mental illness: 36.4%
- Share of those killed who were unarmed: 9.1%
- City population: 219,234
23. Tulsa, Oklahoma

- Documented police killings, Jan. 2020 – Oct. 2024: 5.1 per 100,000 people (21 total)
- Gender of those killed: 95.2% male, 4.8% female
- Race/ethnicity of those killed: 47.6% White, 14.3% Black, 28.6% Hispanic, 4.8% Native American, 0.0% Asian
- Share of those killed with signs of a mental illness: 28.6%
- Share of those killed who were unarmed: 4.8%
- City population: 411,938
22. Tucson, Arizona
- Documented police killings, Jan. 2020 – Oct. 2024: 5.2 per 100,000 people (28 total)
- Gender of those killed: 100.0% male, 0.0% female
- Race/ethnicity of those killed: 25.0% White, 21.4% Black, 39.3% Hispanic, 0.0% Native American, 0.0% Asian
- Share of those killed with signs of a mental illness: 21.4%
- Share of those killed who were unarmed: 7.1%
- City population: 541,033
21. St. Louis, Missouri
- Documented police killings, Jan. 2020 – Oct. 2024: 5.4 per 100,000 people (16 total)
- Gender of those killed: 87.5% male, 12.5% female
- Race/ethnicity of those killed: 12.5% White, 43.8% Black, 6.3% Hispanic, 0.0% Native American, 0.0% Asian
- Share of those killed with signs of a mental illness: 18.8%
- Share of those killed who were unarmed: 18.8%
- City population: 298,018
20. Atlanta, Georgia
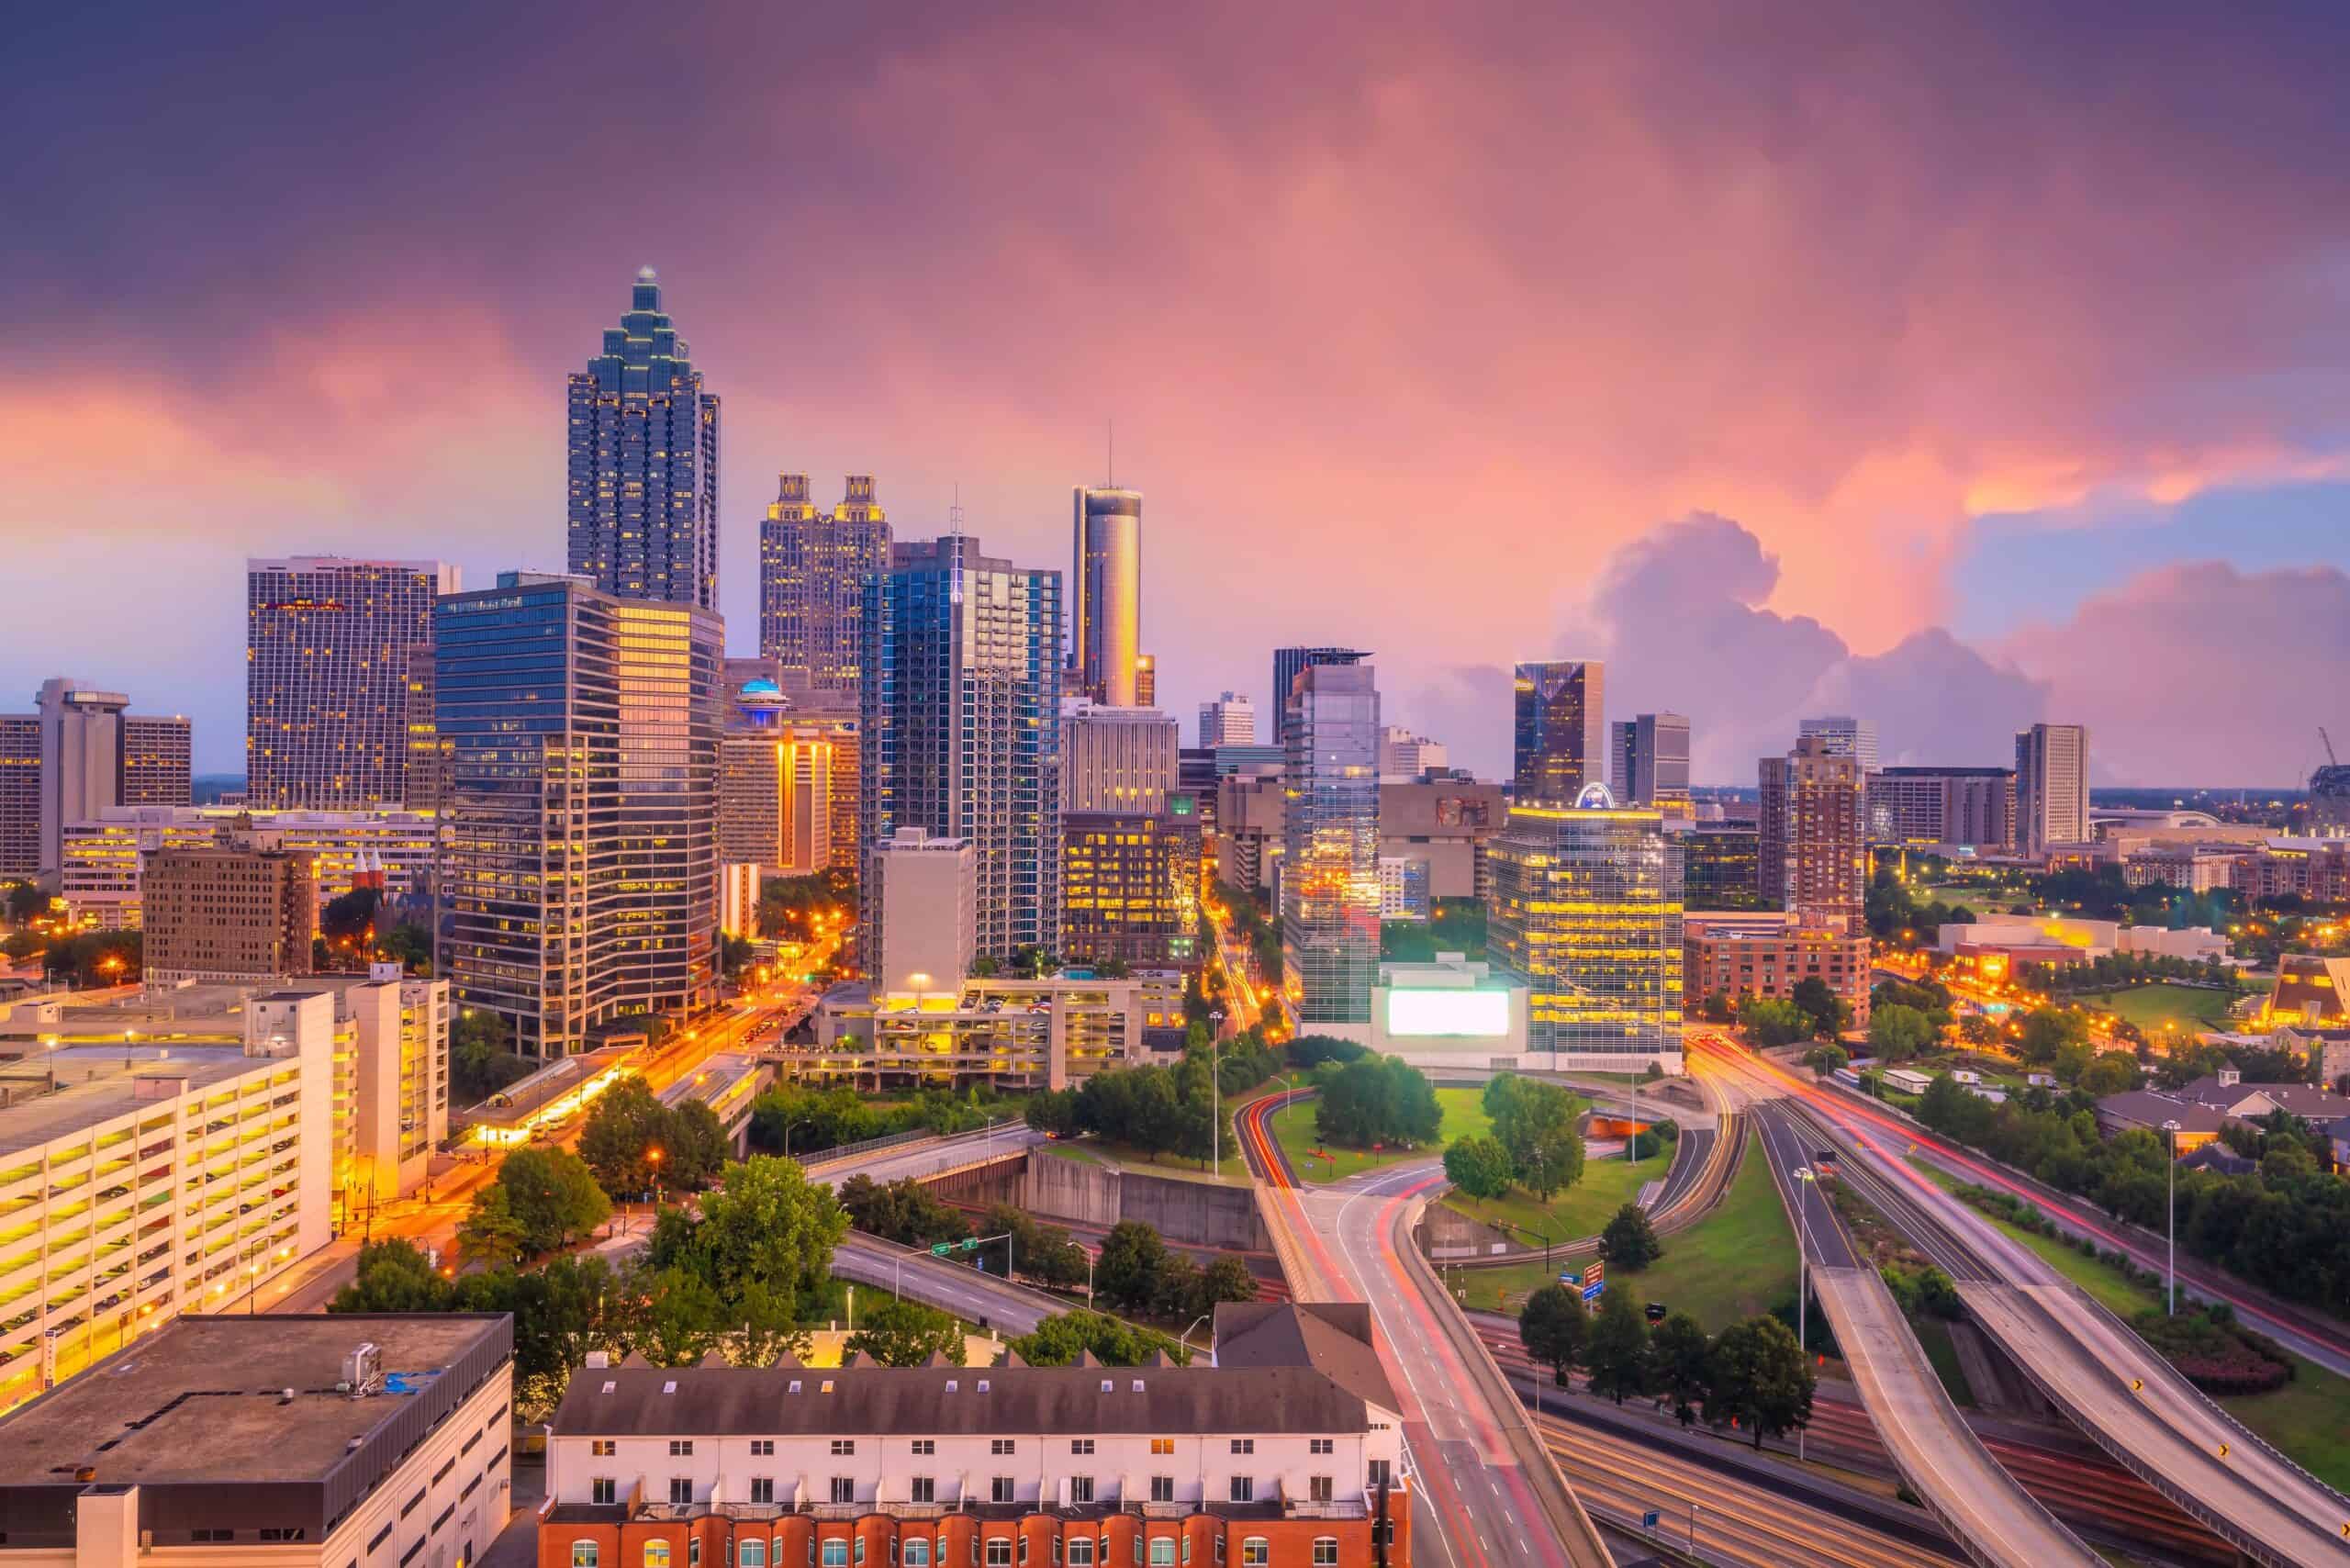
- Documented police killings, Jan. 2020 – Oct. 2024: 5.7 per 100,000 people (28 total)
- Gender of those killed: 96.4% male, 0.0% female
- Race/ethnicity of those killed: 3.6% White, 82.1% Black, 7.1% Hispanic, 0.0% Native American, 0.0% Asian
- Share of those killed with signs of a mental illness: 3.6%
- Share of those killed who were unarmed: 21.4%
- City population: 494,838
19. Corpus Christi, Texas
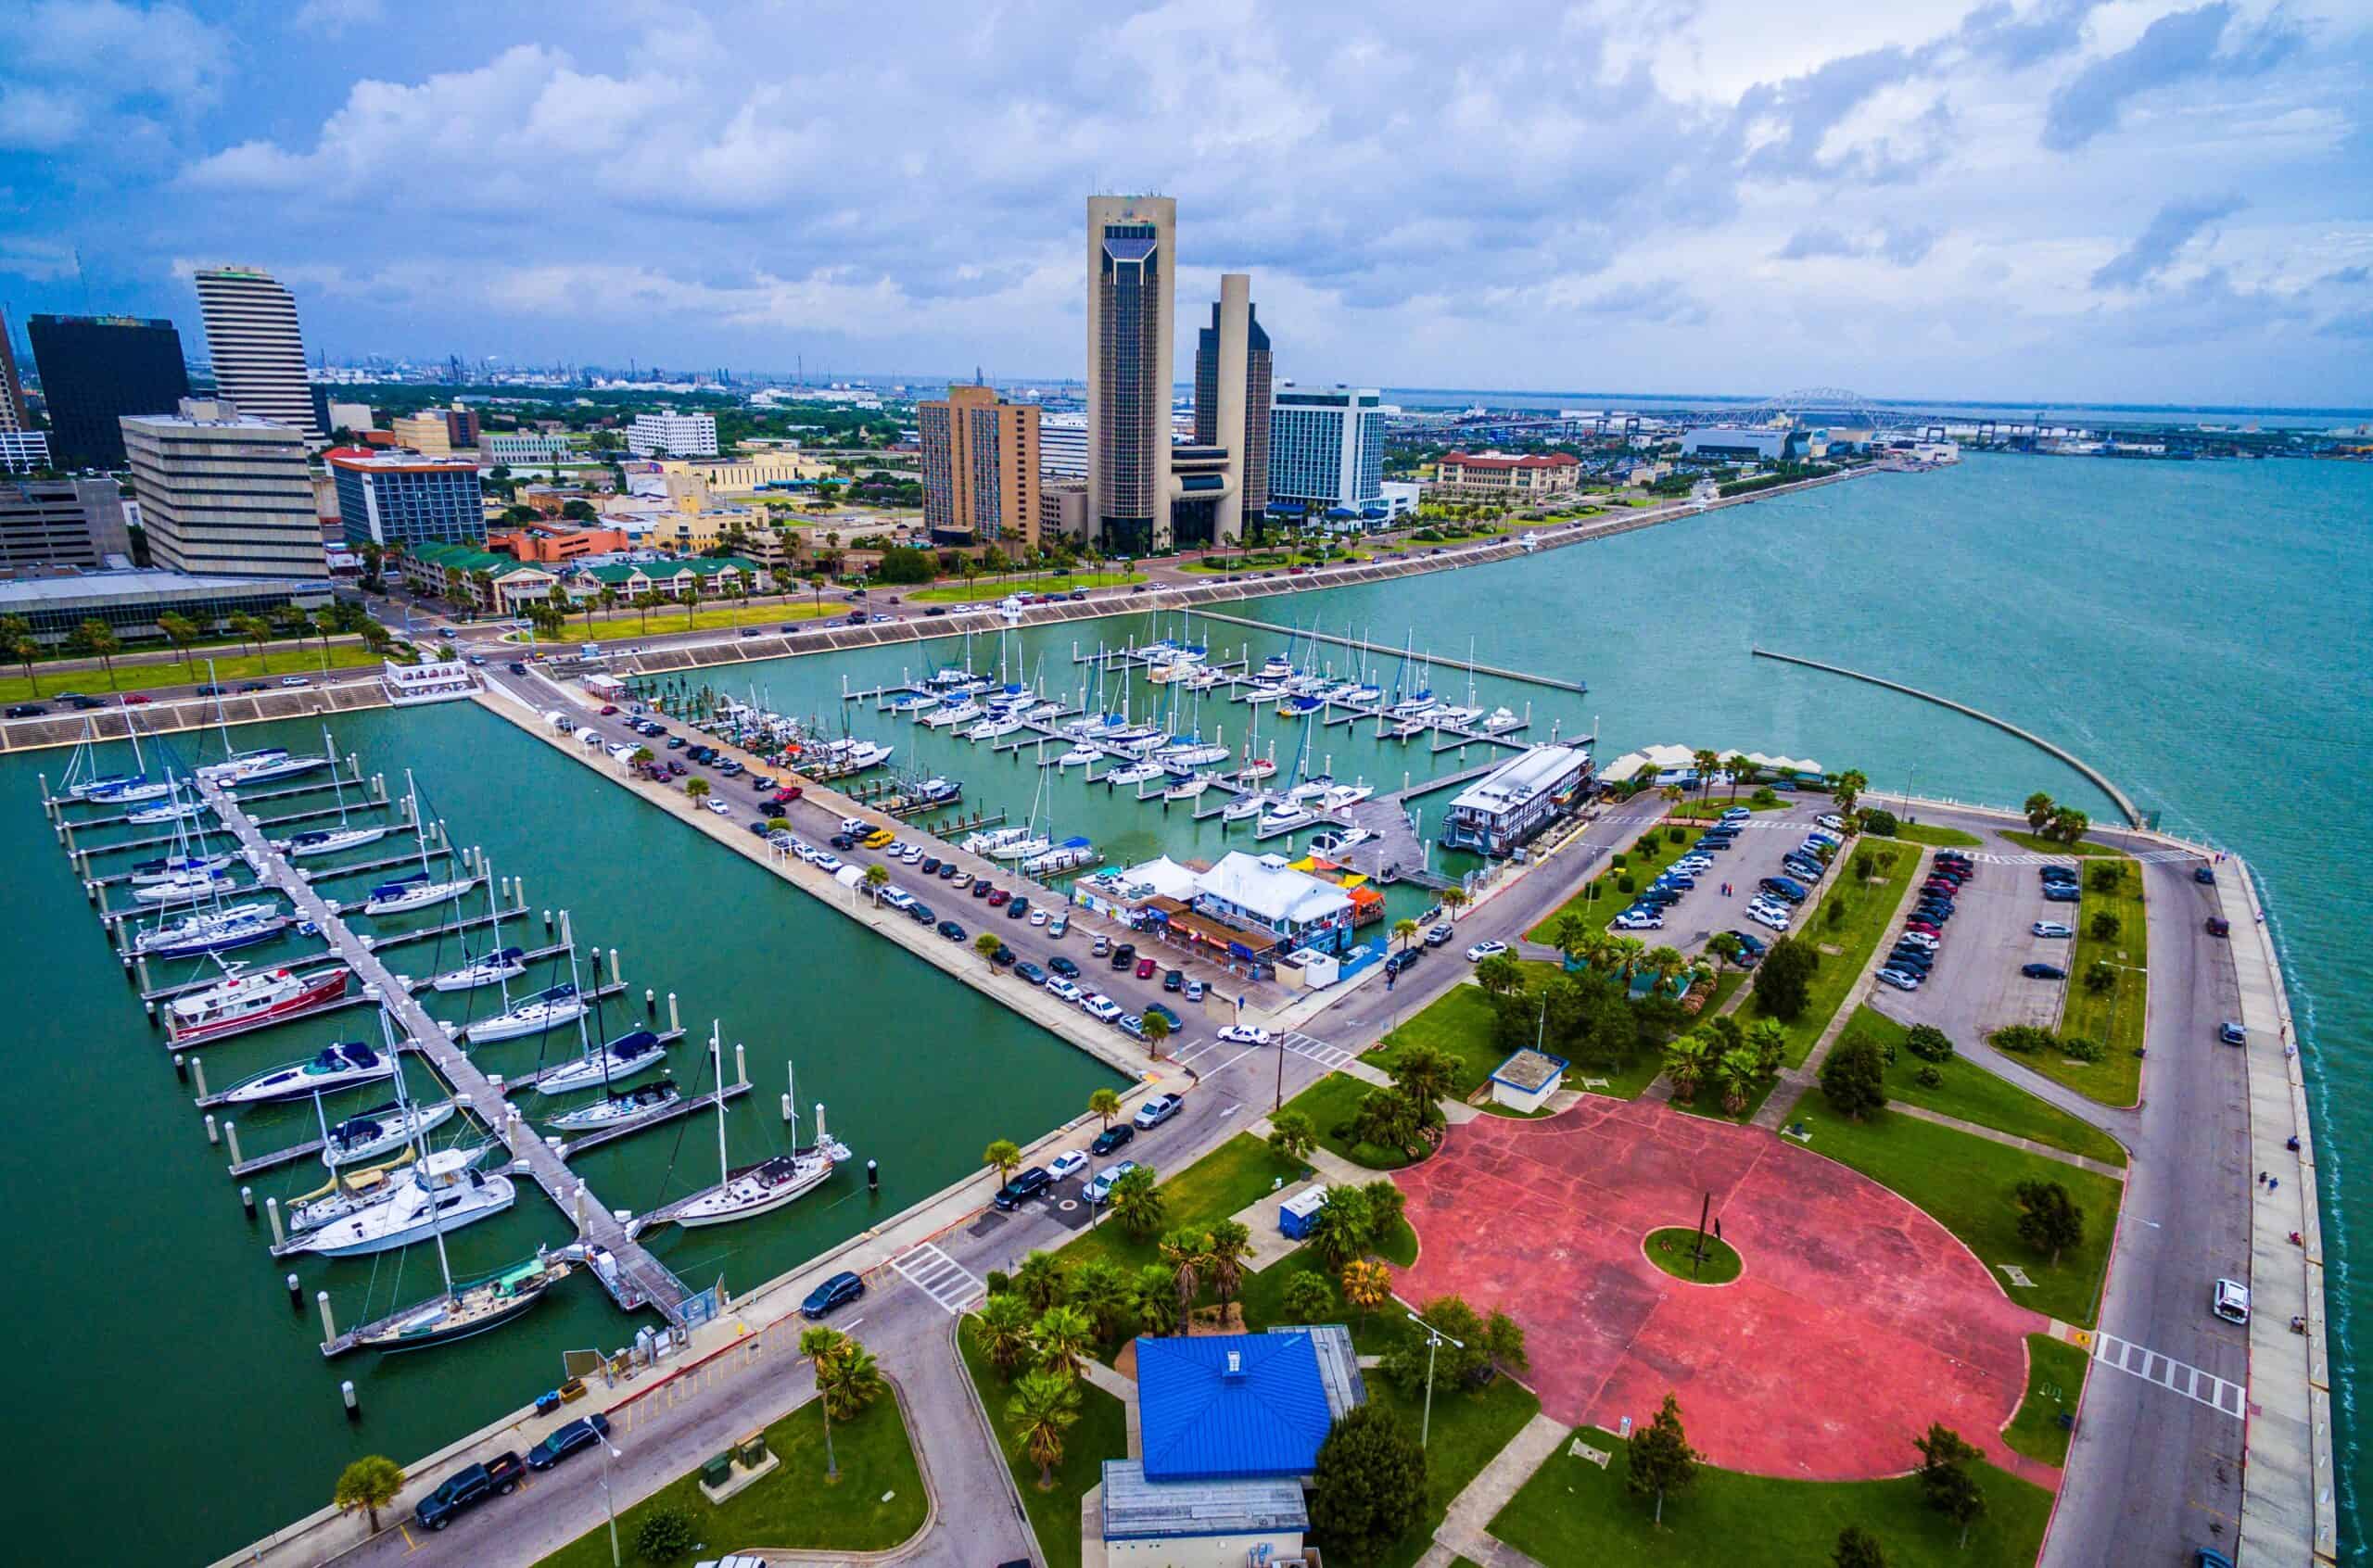
- Documented police killings, Jan. 2020 – Oct. 2024: 5.7 per 100,000 people (18 total)
- Gender of those killed: 94.4% male, 5.6% female
- Race/ethnicity of those killed: 22.2% White, 16.7% Black, 44.4% Hispanic, 0.0% Native American, 5.6% Asian
- Share of those killed with signs of a mental illness: 5.6%
- Share of those killed who were unarmed: 11.1%
- City population: 317,804
18. Knoxville, Tennessee
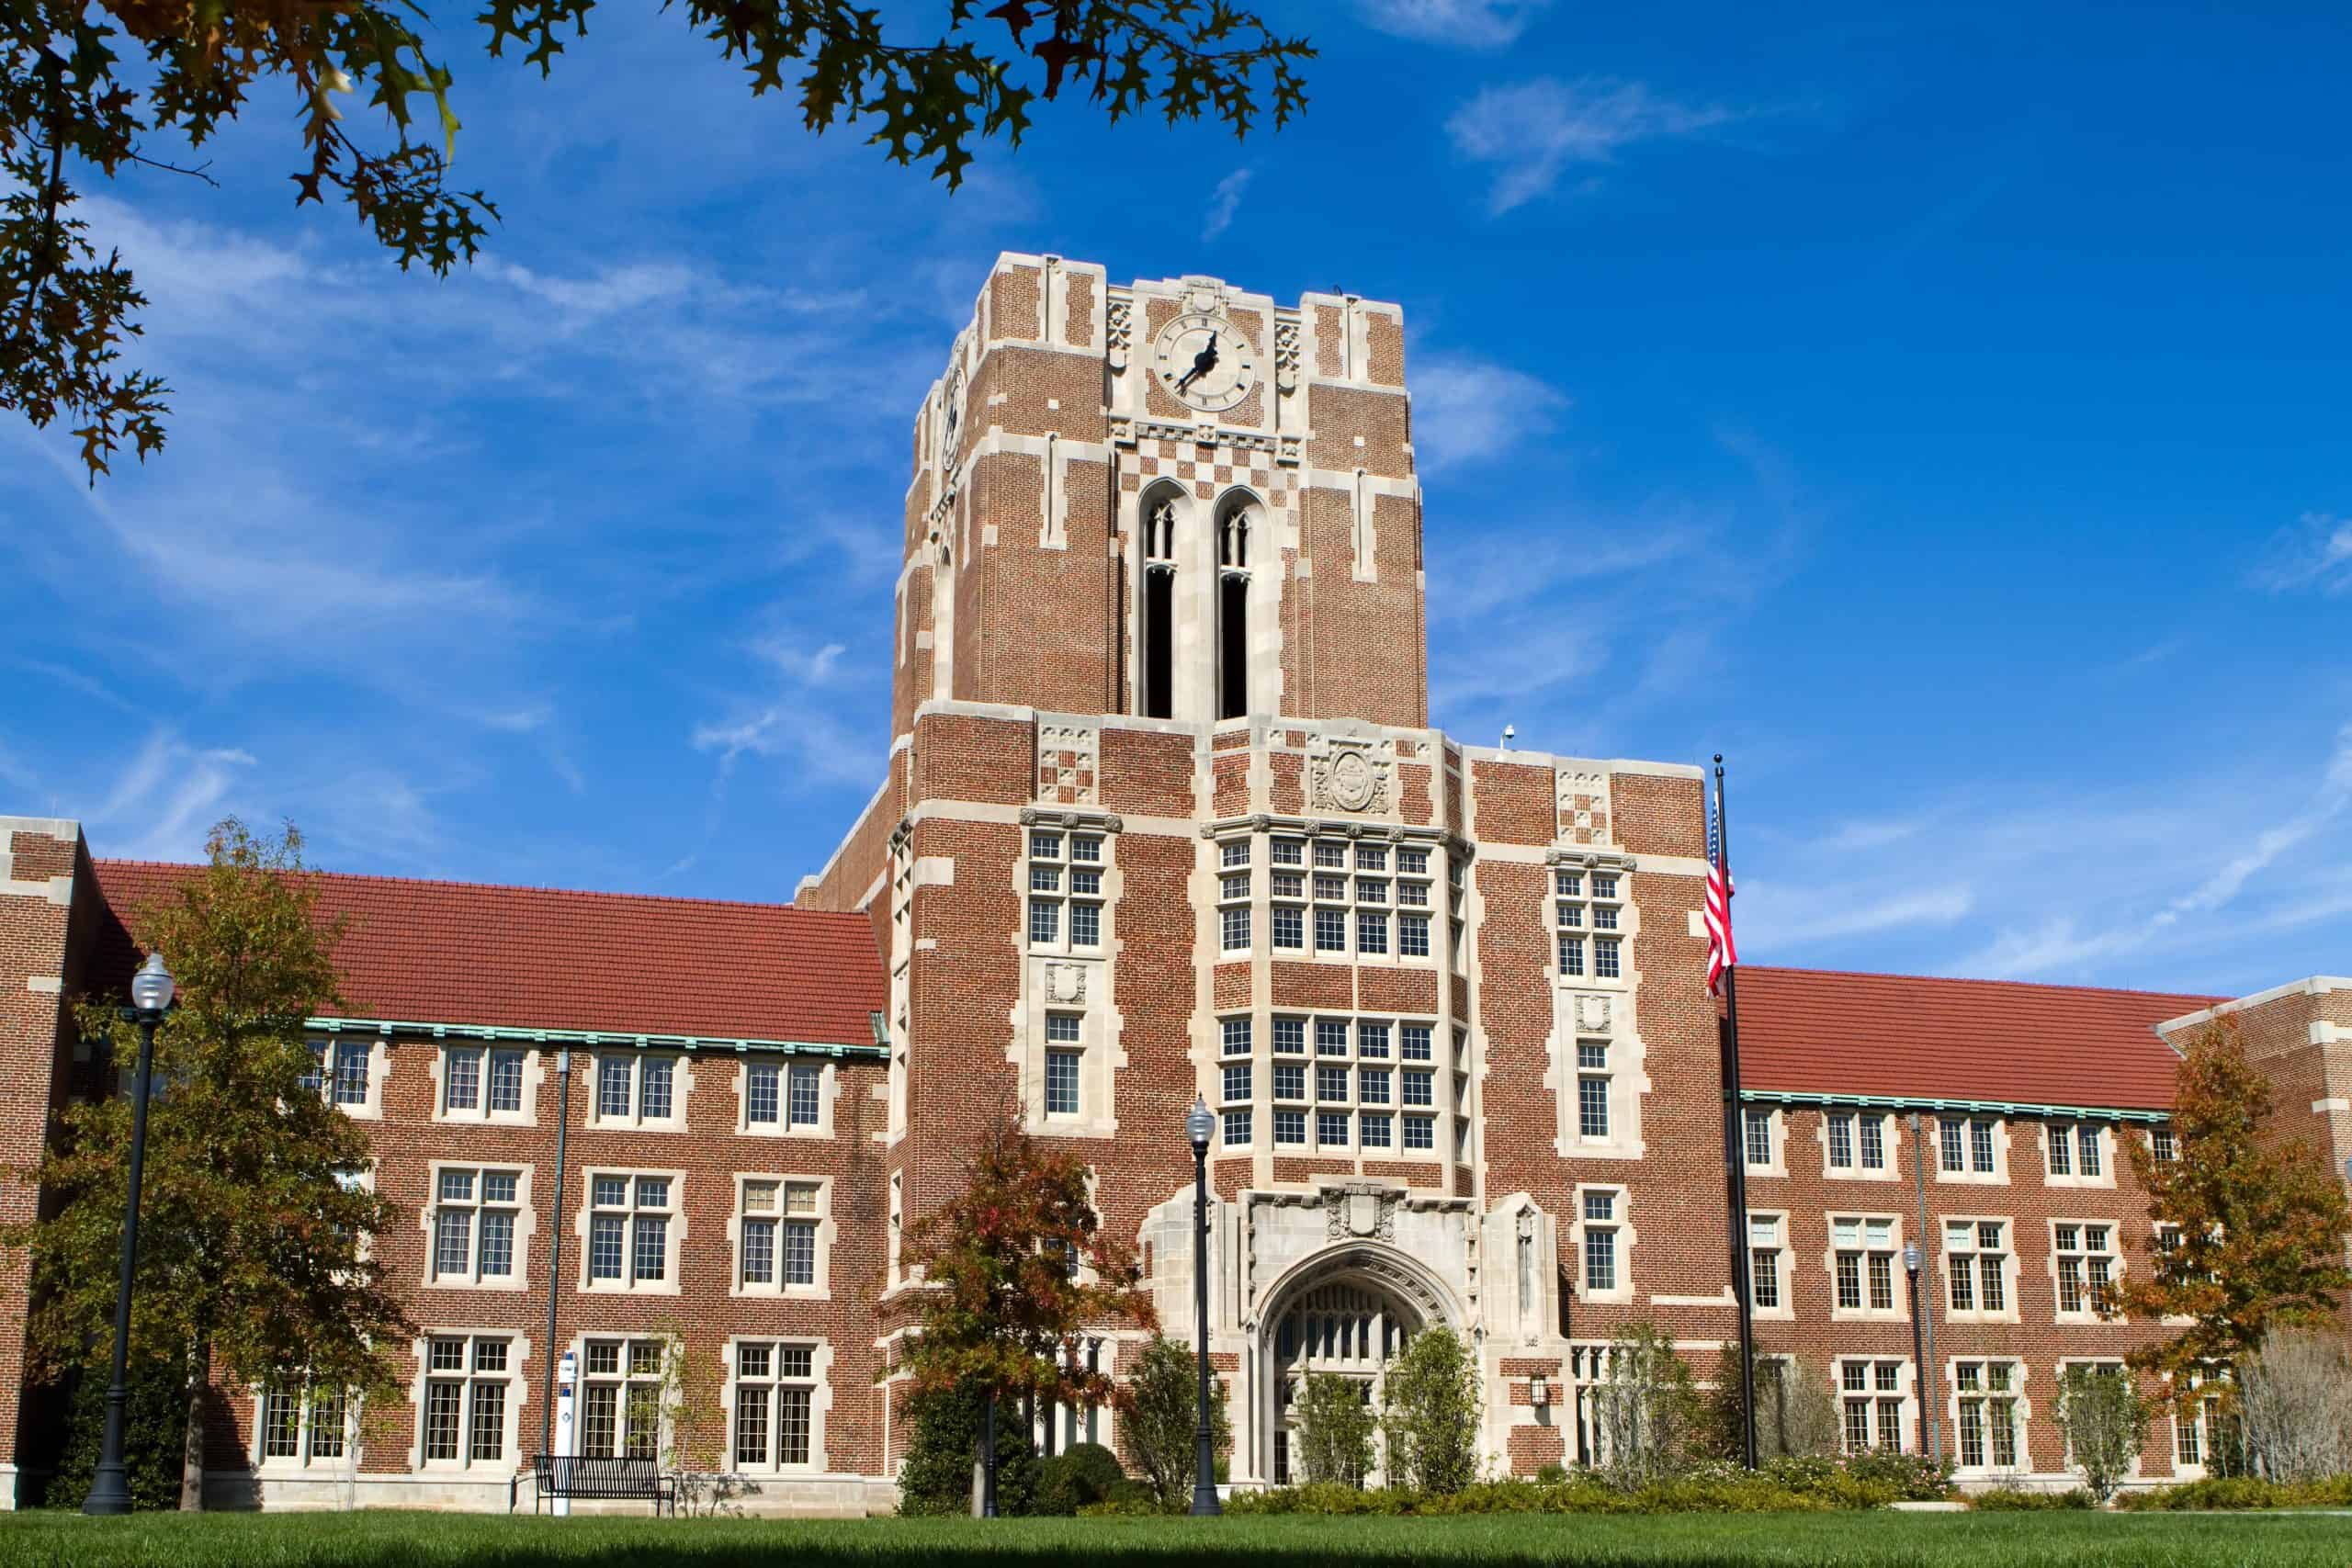
- Documented police killings, Jan. 2020 – Oct. 2024: 5.7 per 100,000 people (11 total)
- Gender of those killed: 90.9% male, 9.1% female
- Race/ethnicity of those killed: 36.4% White, 45.5% Black, 18.2% Hispanic, 0.0% Native American, 0.0% Asian
- Share of those killed with signs of a mental illness: 36.4%
- Share of those killed who were unarmed: 18.2%
- City population: 191,857
17. Miami, Florida
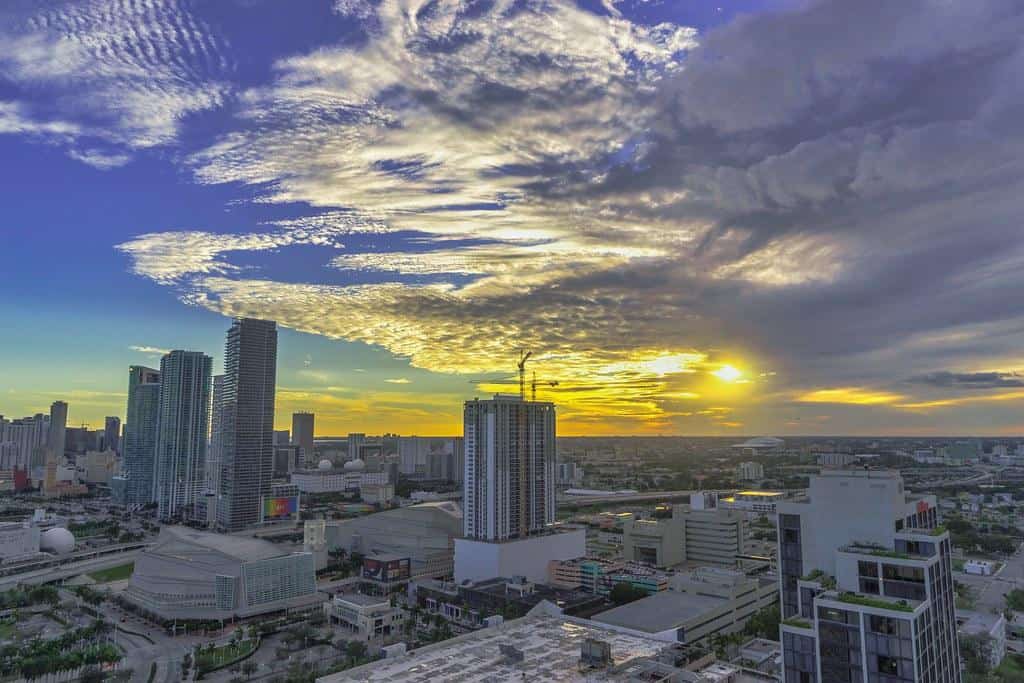
- Documented police killings, Jan. 2020 – Oct. 2024: 5.9 per 100,000 people (26 total)
- Gender of those killed: 92.3% male, 7.7% female
- Race/ethnicity of those killed: 11.5% White, 23.1% Black, 50.0% Hispanic, 0.0% Native American, 0.0% Asian
- Share of those killed with signs of a mental illness: 19.2%
- Share of those killed who were unarmed: 15.4%
- City population: 443,665
16. Shreveport, Louisiana

- Documented police killings, Jan. 2020 – Oct. 2024: 6.4 per 100,000 people (12 total)
- Gender of those killed: 100.0% male, 0.0% female
- Race/ethnicity of those killed: 25.0% White, 58.3% Black, 8.3% Hispanic, 0.0% Native American, 0.0% Asian
- Share of those killed with signs of a mental illness: 8.3%
- Share of those killed who were unarmed: 33.3%
- City population: 186,183
15. Orlando, Florida
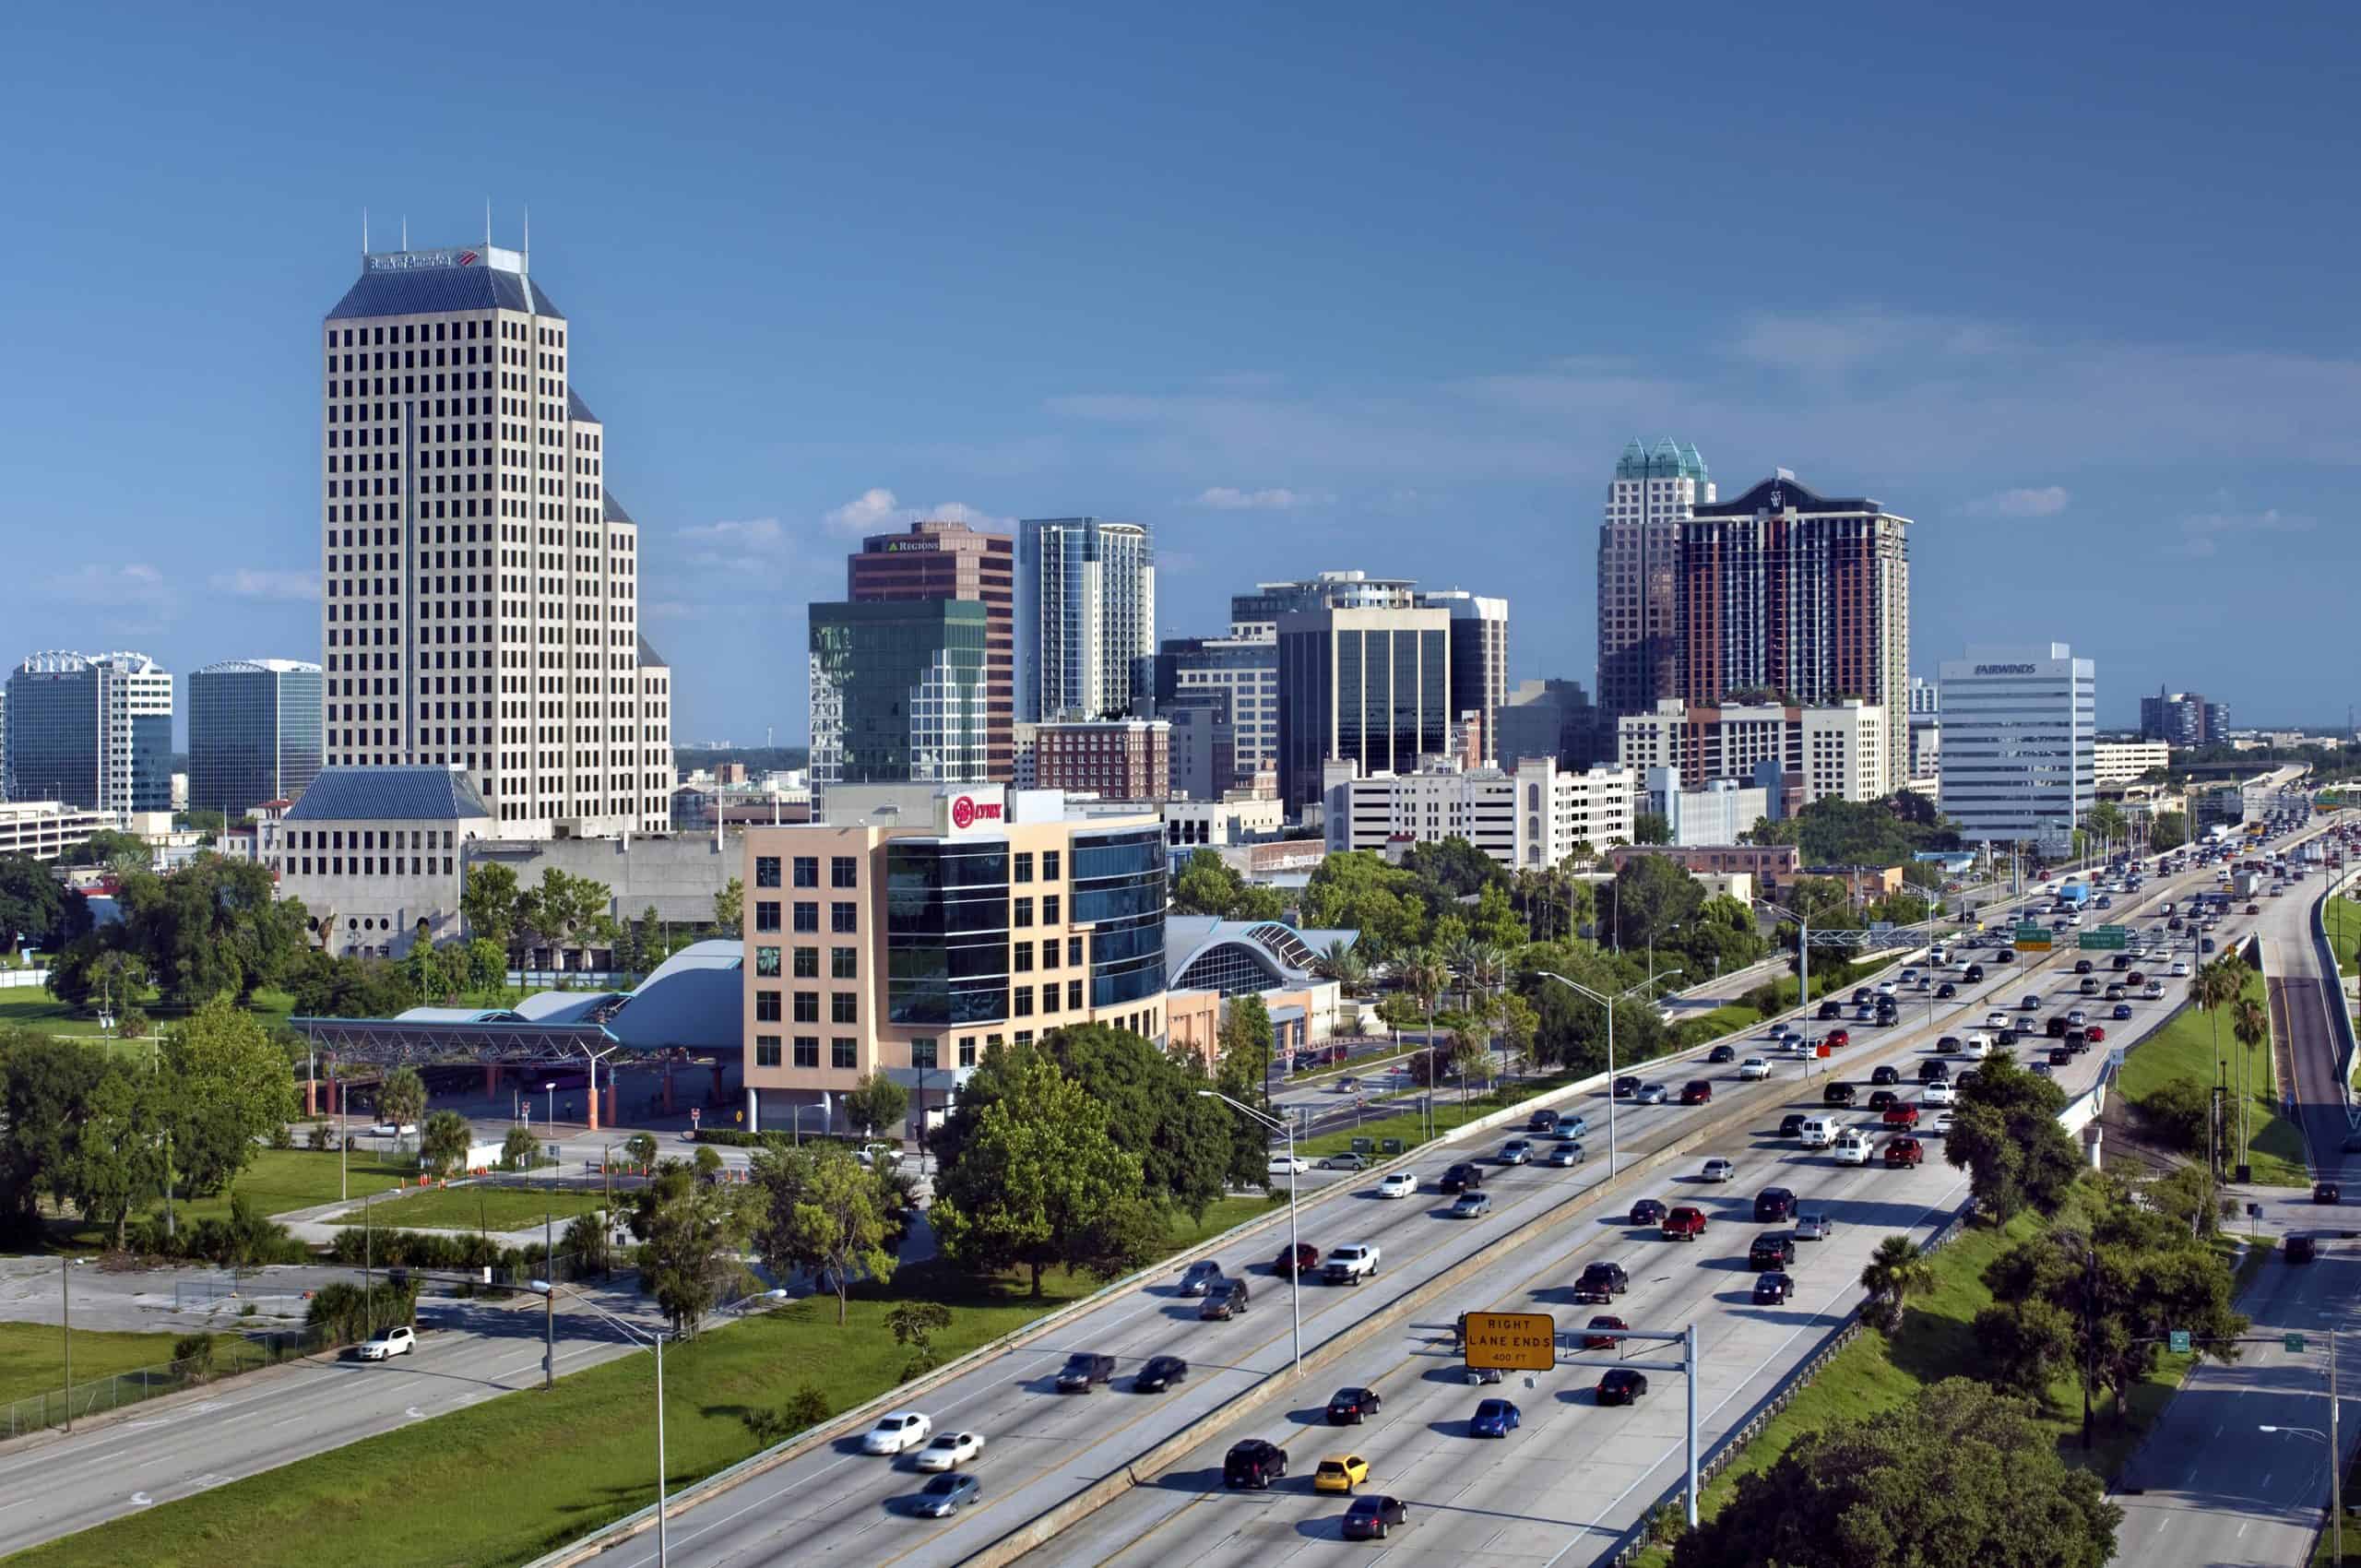
- Documented police killings, Jan. 2020 – Oct. 2024: 6.5 per 100,000 people (20 total)
- Gender of those killed: 90.0% male, 10.0% female
- Race/ethnicity of those killed: 30.0% White, 45.0% Black, 10.0% Hispanic, 0.0% Native American, 0.0% Asian
- Share of those killed with signs of a mental illness: 30.0%
- Share of those killed who were unarmed: 15.0%
- City population: 307,738
14. Spokane, Washington

- Documented police killings, Jan. 2020 – Oct. 2024: 6.6 per 100,000 people (15 total)
- Gender of those killed: 93.3% male, 6.7% female
- Race/ethnicity of those killed: 66.7% White, 6.7% Black, 6.7% Hispanic, 0.0% Native American, 0.0% Asian
- Share of those killed with signs of a mental illness: 13.3%
- Share of those killed who were unarmed: 6.7%
- City population: 227,922
13. Bakersfield, California
- Documented police killings, Jan. 2020 – Oct. 2024: 6.7 per 100,000 people (27 total)
- Gender of those killed: 100.0% male, 0.0% female
- Race/ethnicity of those killed: 11.1% White, 0.0% Black, 74.1% Hispanic, 0.0% Native American, 3.7% Asian
- Share of those killed with signs of a mental illness: 14.8%
- Share of those killed who were unarmed: 22.2%
- City population: 404,321
12. Salem, Oregon
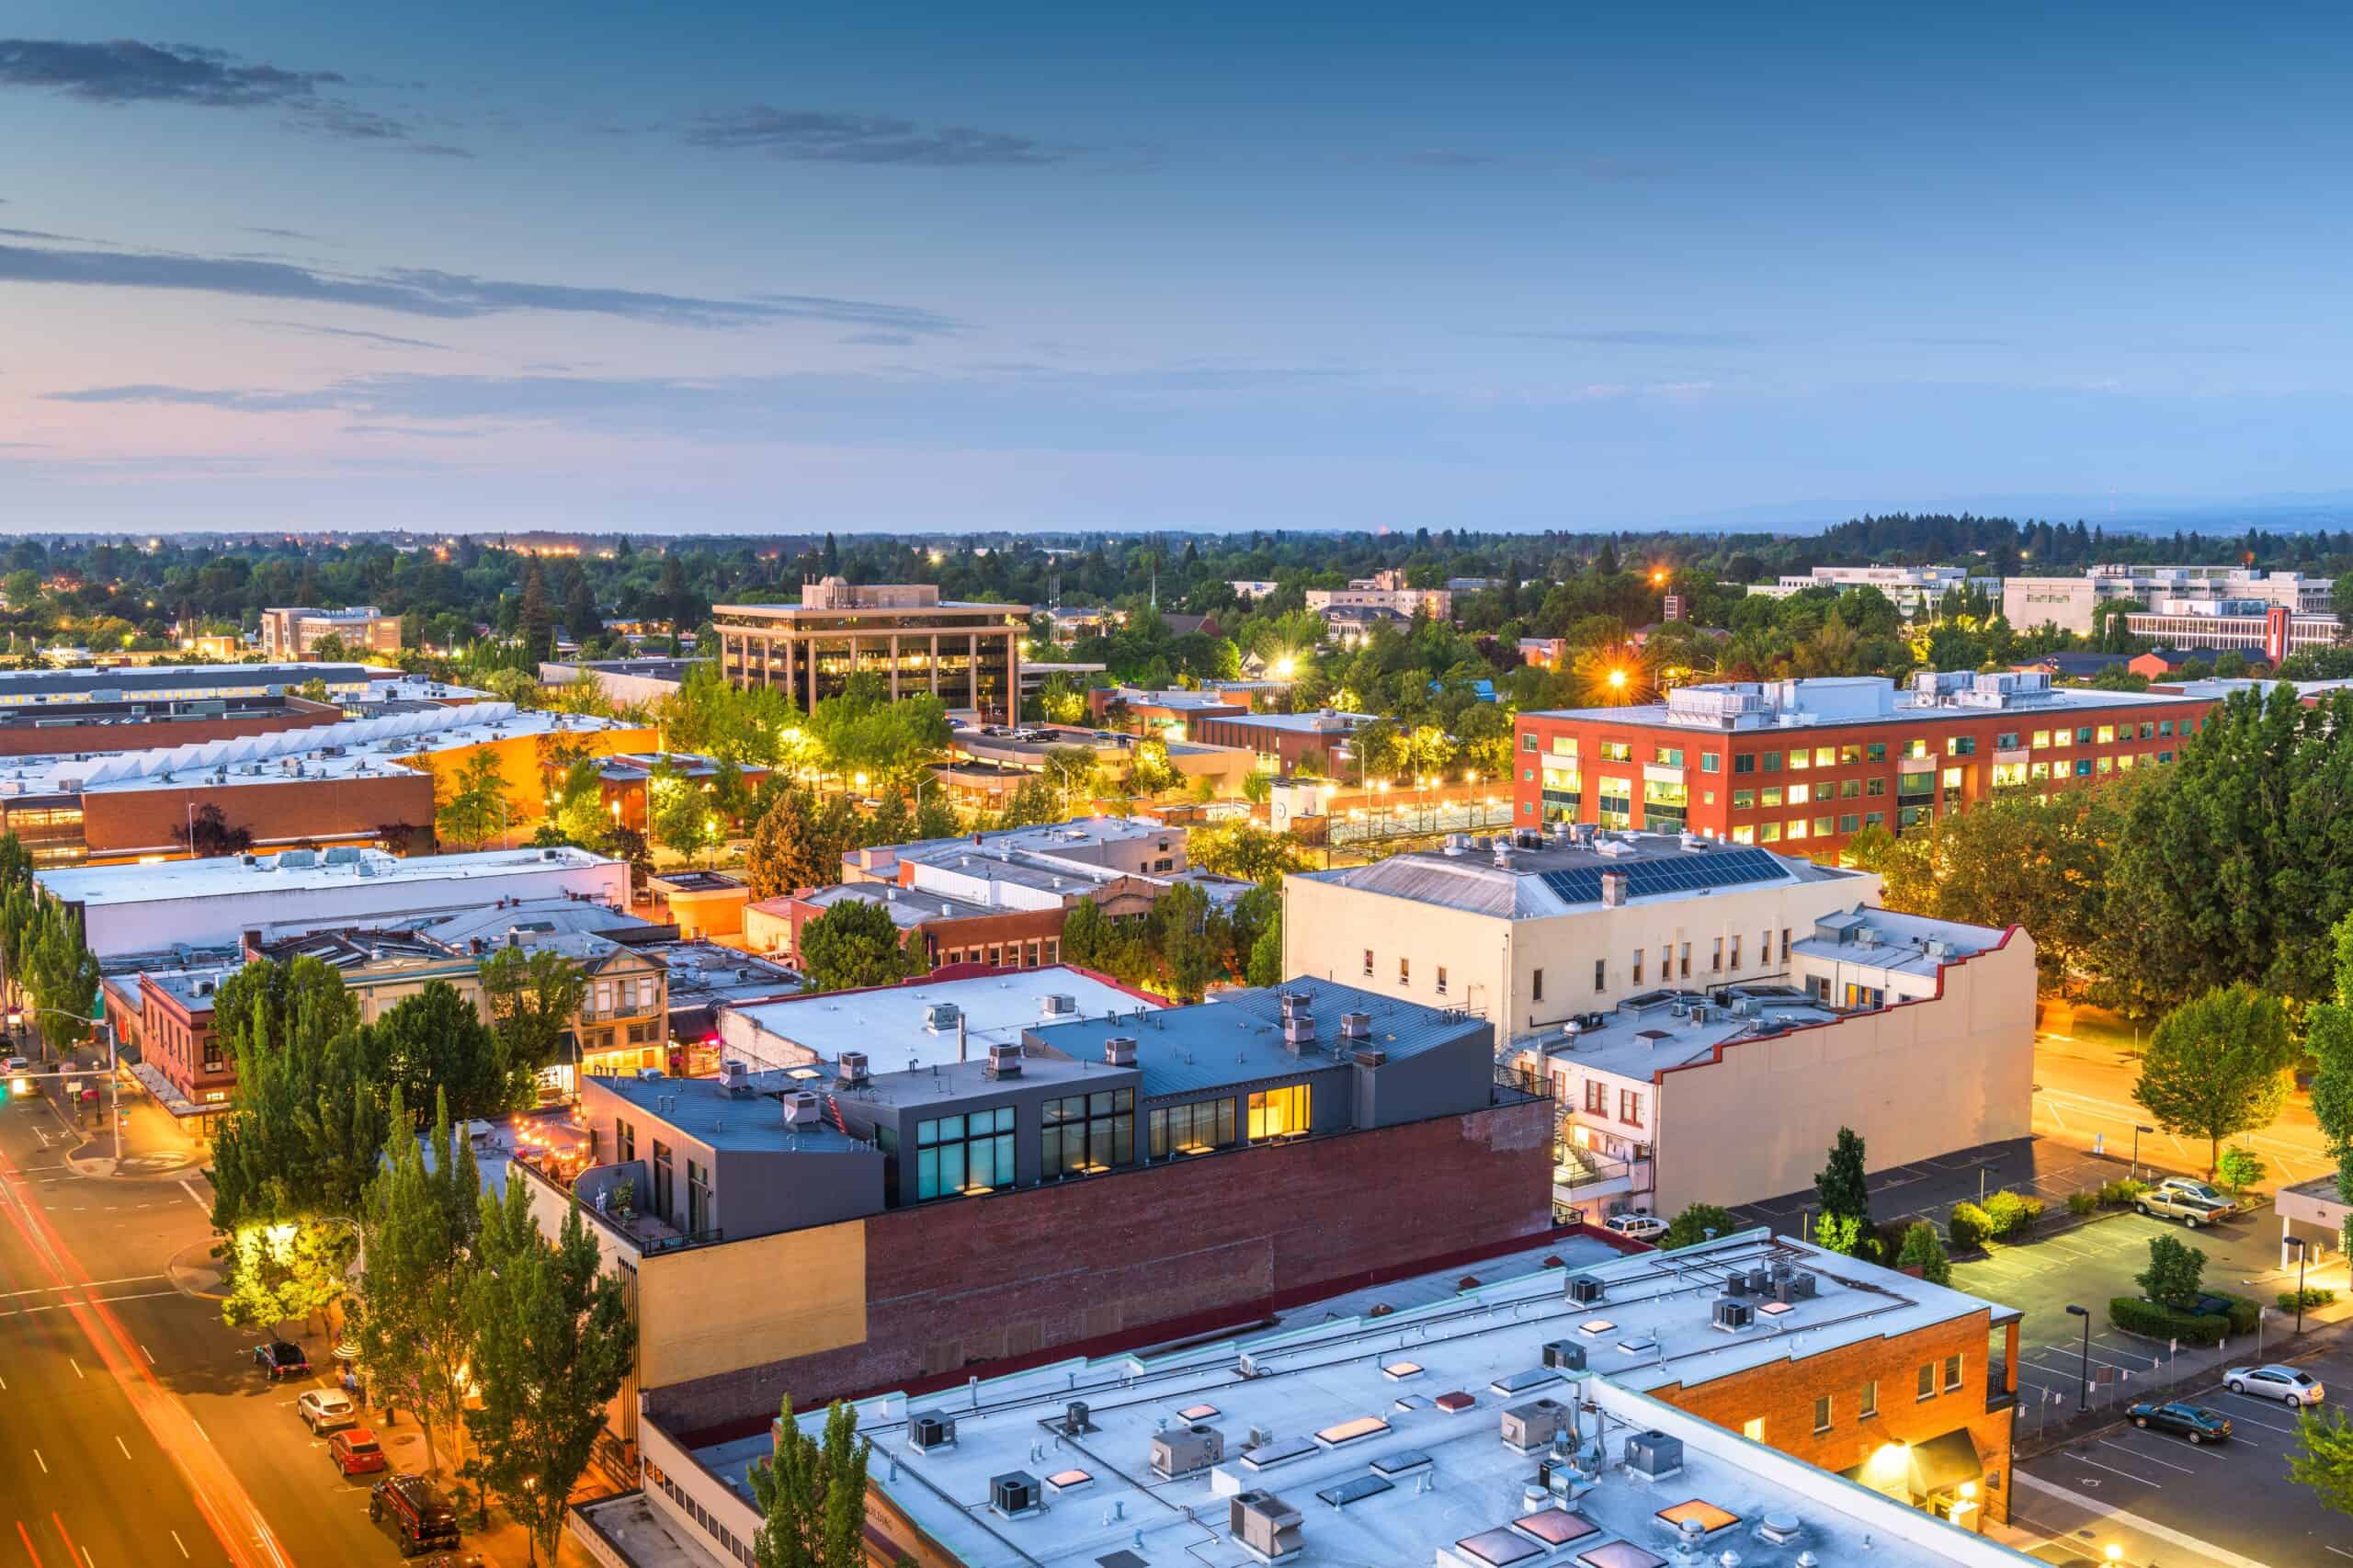
- Documented police killings, Jan. 2020 – Oct. 2024: 6.8 per 100,000 people (12 total)
- Gender of those killed: 91.7% male, 8.3% female
- Race/ethnicity of those killed: 58.3% White, 0.0% Black, 41.7% Hispanic, 0.0% Native American, 0.0% Asian
- Share of those killed with signs of a mental illness: 33.3%
- Share of those killed who were unarmed: 8.3%
- City population: 175,754
11. Las Vegas, Nevada
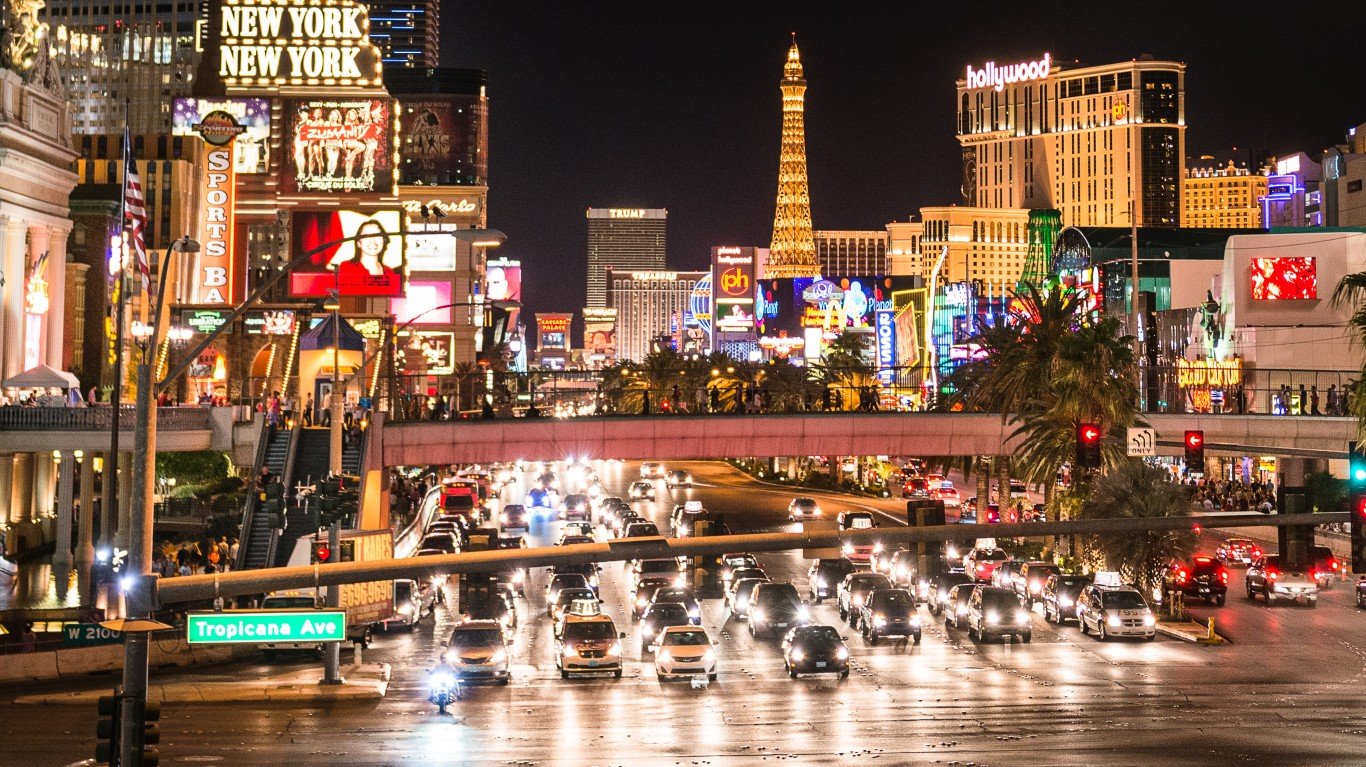
- Documented police killings, Jan. 2020 – Oct. 2024: 7.0 per 100,000 people (45 total)
- Gender of those killed: 95.6% male, 4.4% female
- Race/ethnicity of those killed: 44.4% White, 20.0% Black, 28.9% Hispanic, 0.0% Native American, 0.0% Asian
- Share of those killed with signs of a mental illness: 22.2%
- Share of those killed who were unarmed: 11.1%
- City population: 644,835
10. Jackson, Mississippi
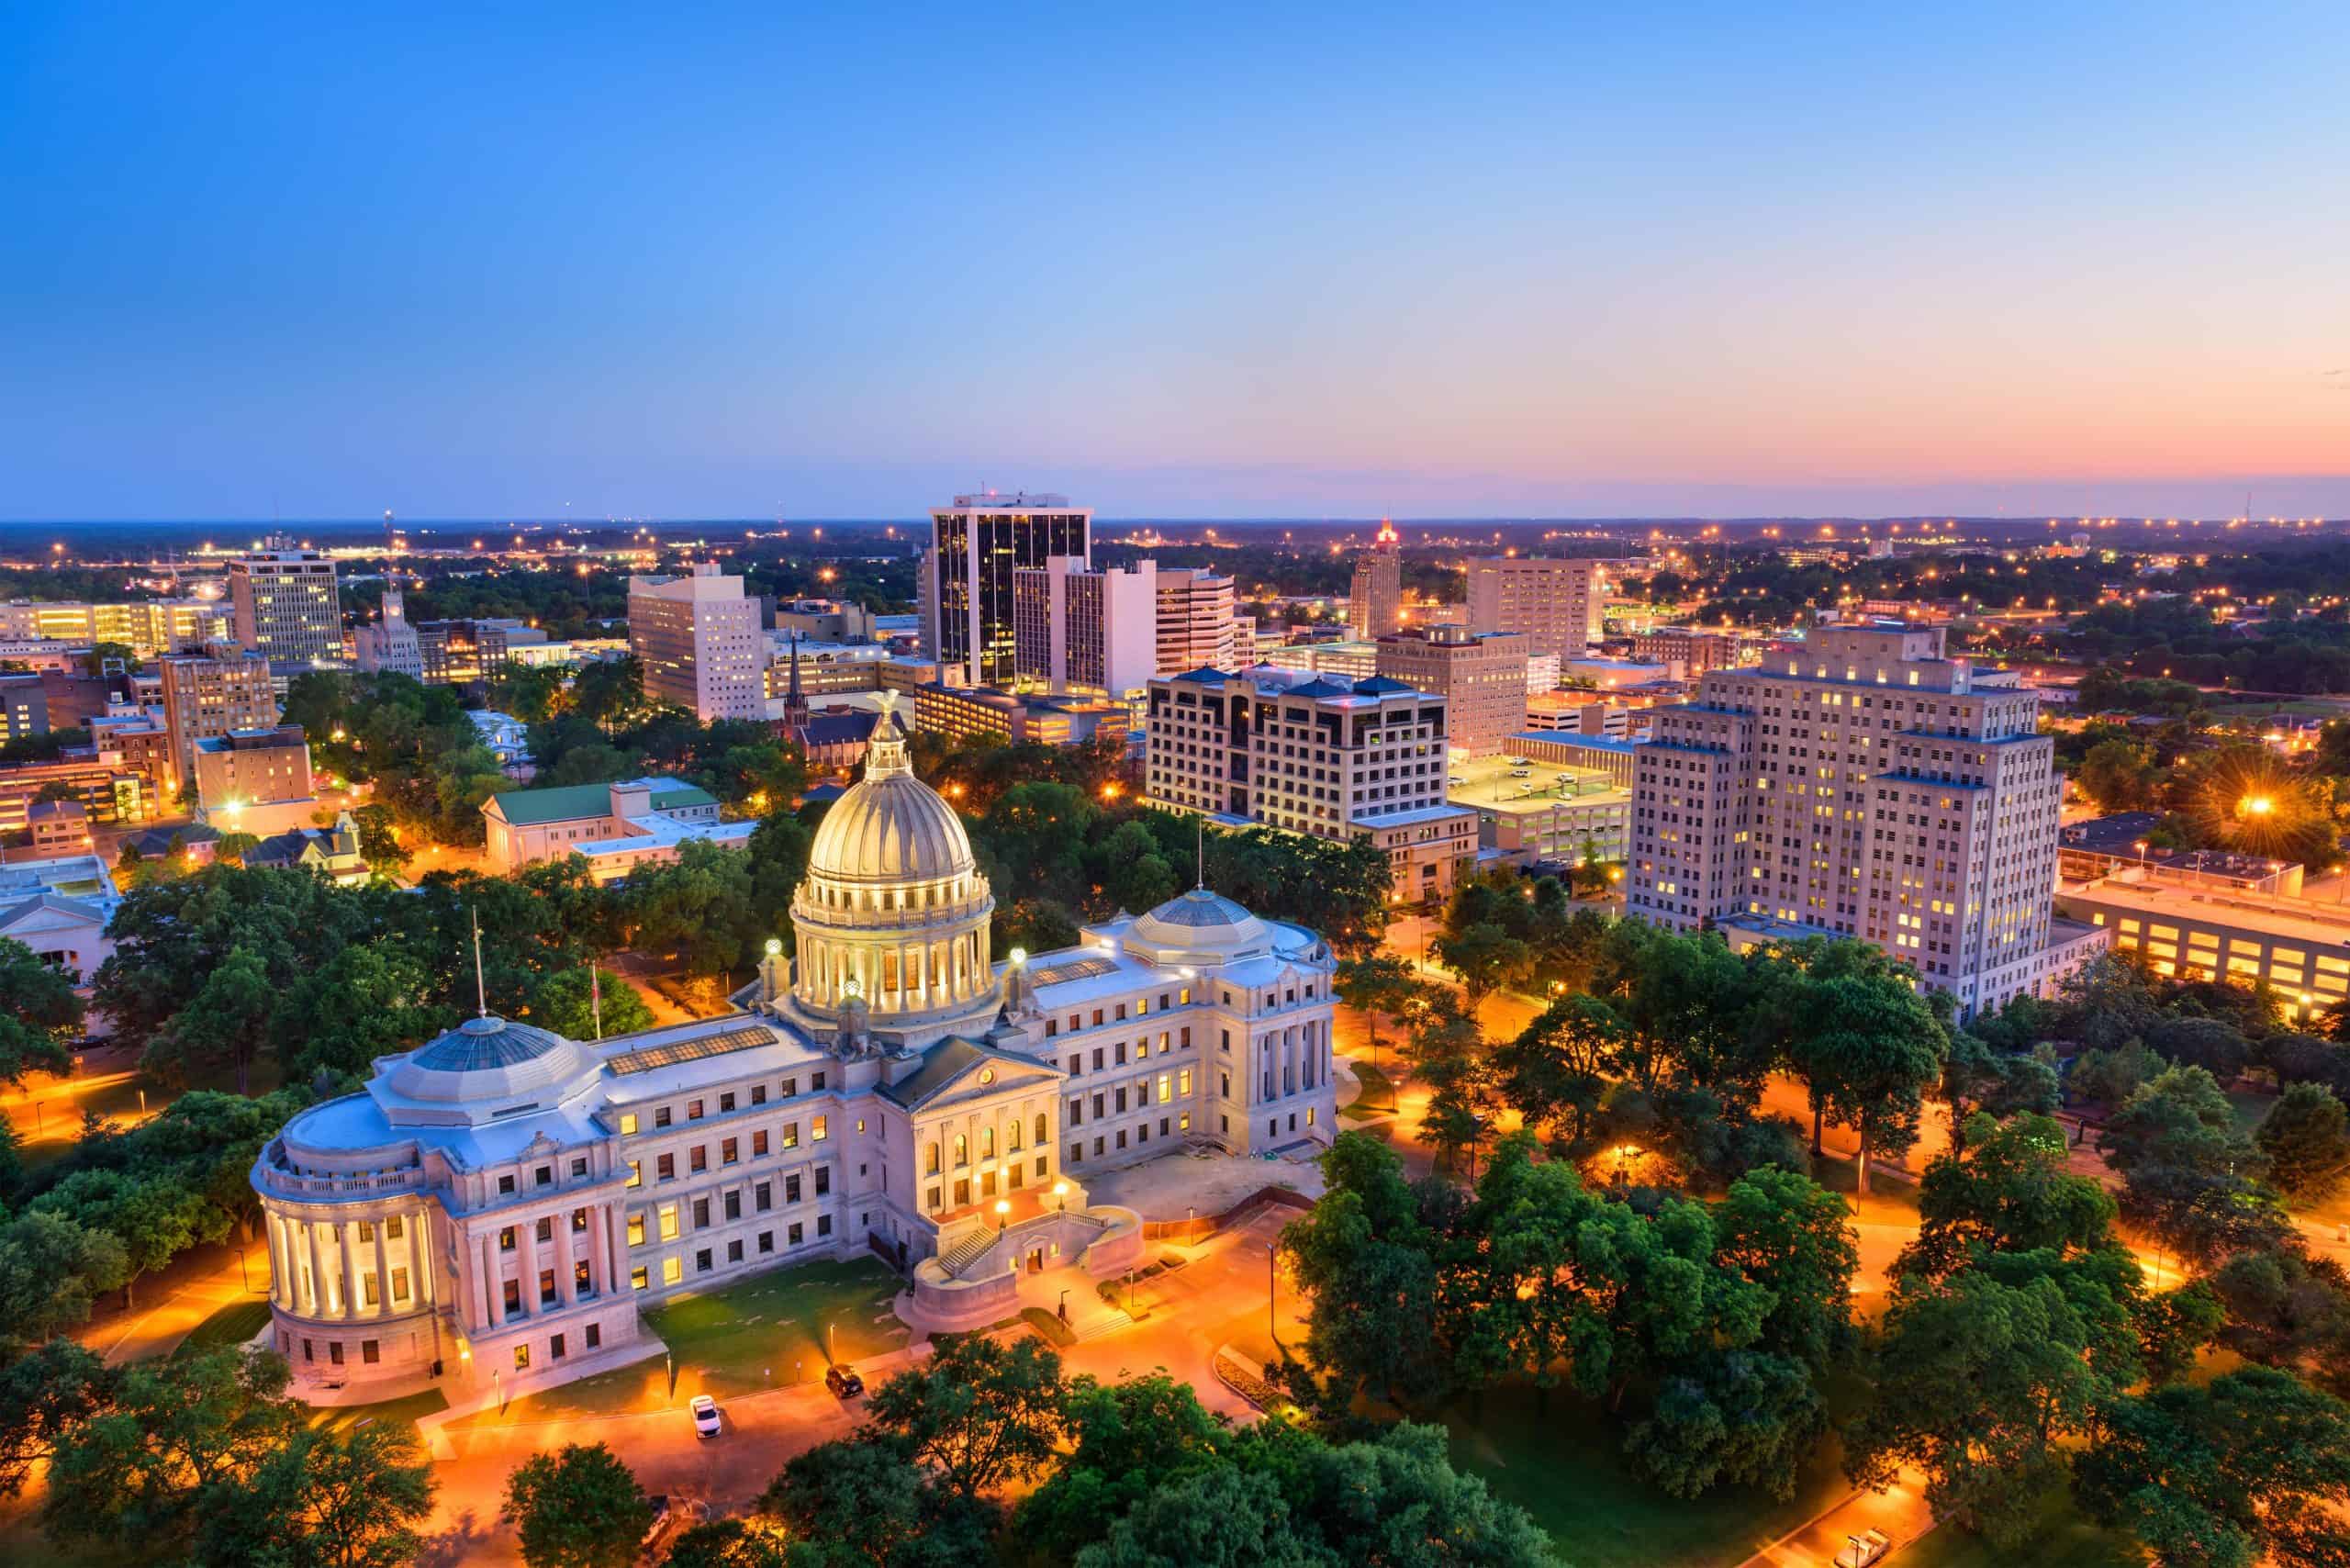
- Documented police killings, Jan. 2020 – Oct. 2024: 7.2 per 100,000 people (11 total)
- Gender of those killed: 100.0% male, 0.0% female
- Race/ethnicity of those killed: 0.0% White, 72.7% Black, 0.0% Hispanic, 0.0% Native American, 0.0% Asian
- Share of those killed with signs of a mental illness: 9.1%
- Share of those killed who were unarmed: 36.4%
- City population: 153,271
9. Victorville, California
- Documented police killings, Jan. 2020 – Oct. 2024: 7.4 per 100,000 people (10 total)
- Gender of those killed: 90.0% male, 10.0% female
- Race/ethnicity of those killed: 20.0% White, 0.0% Black, 50.0% Hispanic, 0.0% Native American, 0.0% Asian
- Share of those killed with signs of a mental illness: 20.0%
- Share of those killed who were unarmed: 20.0%
- City population: 134,417
8. Salt Lake City, Utah
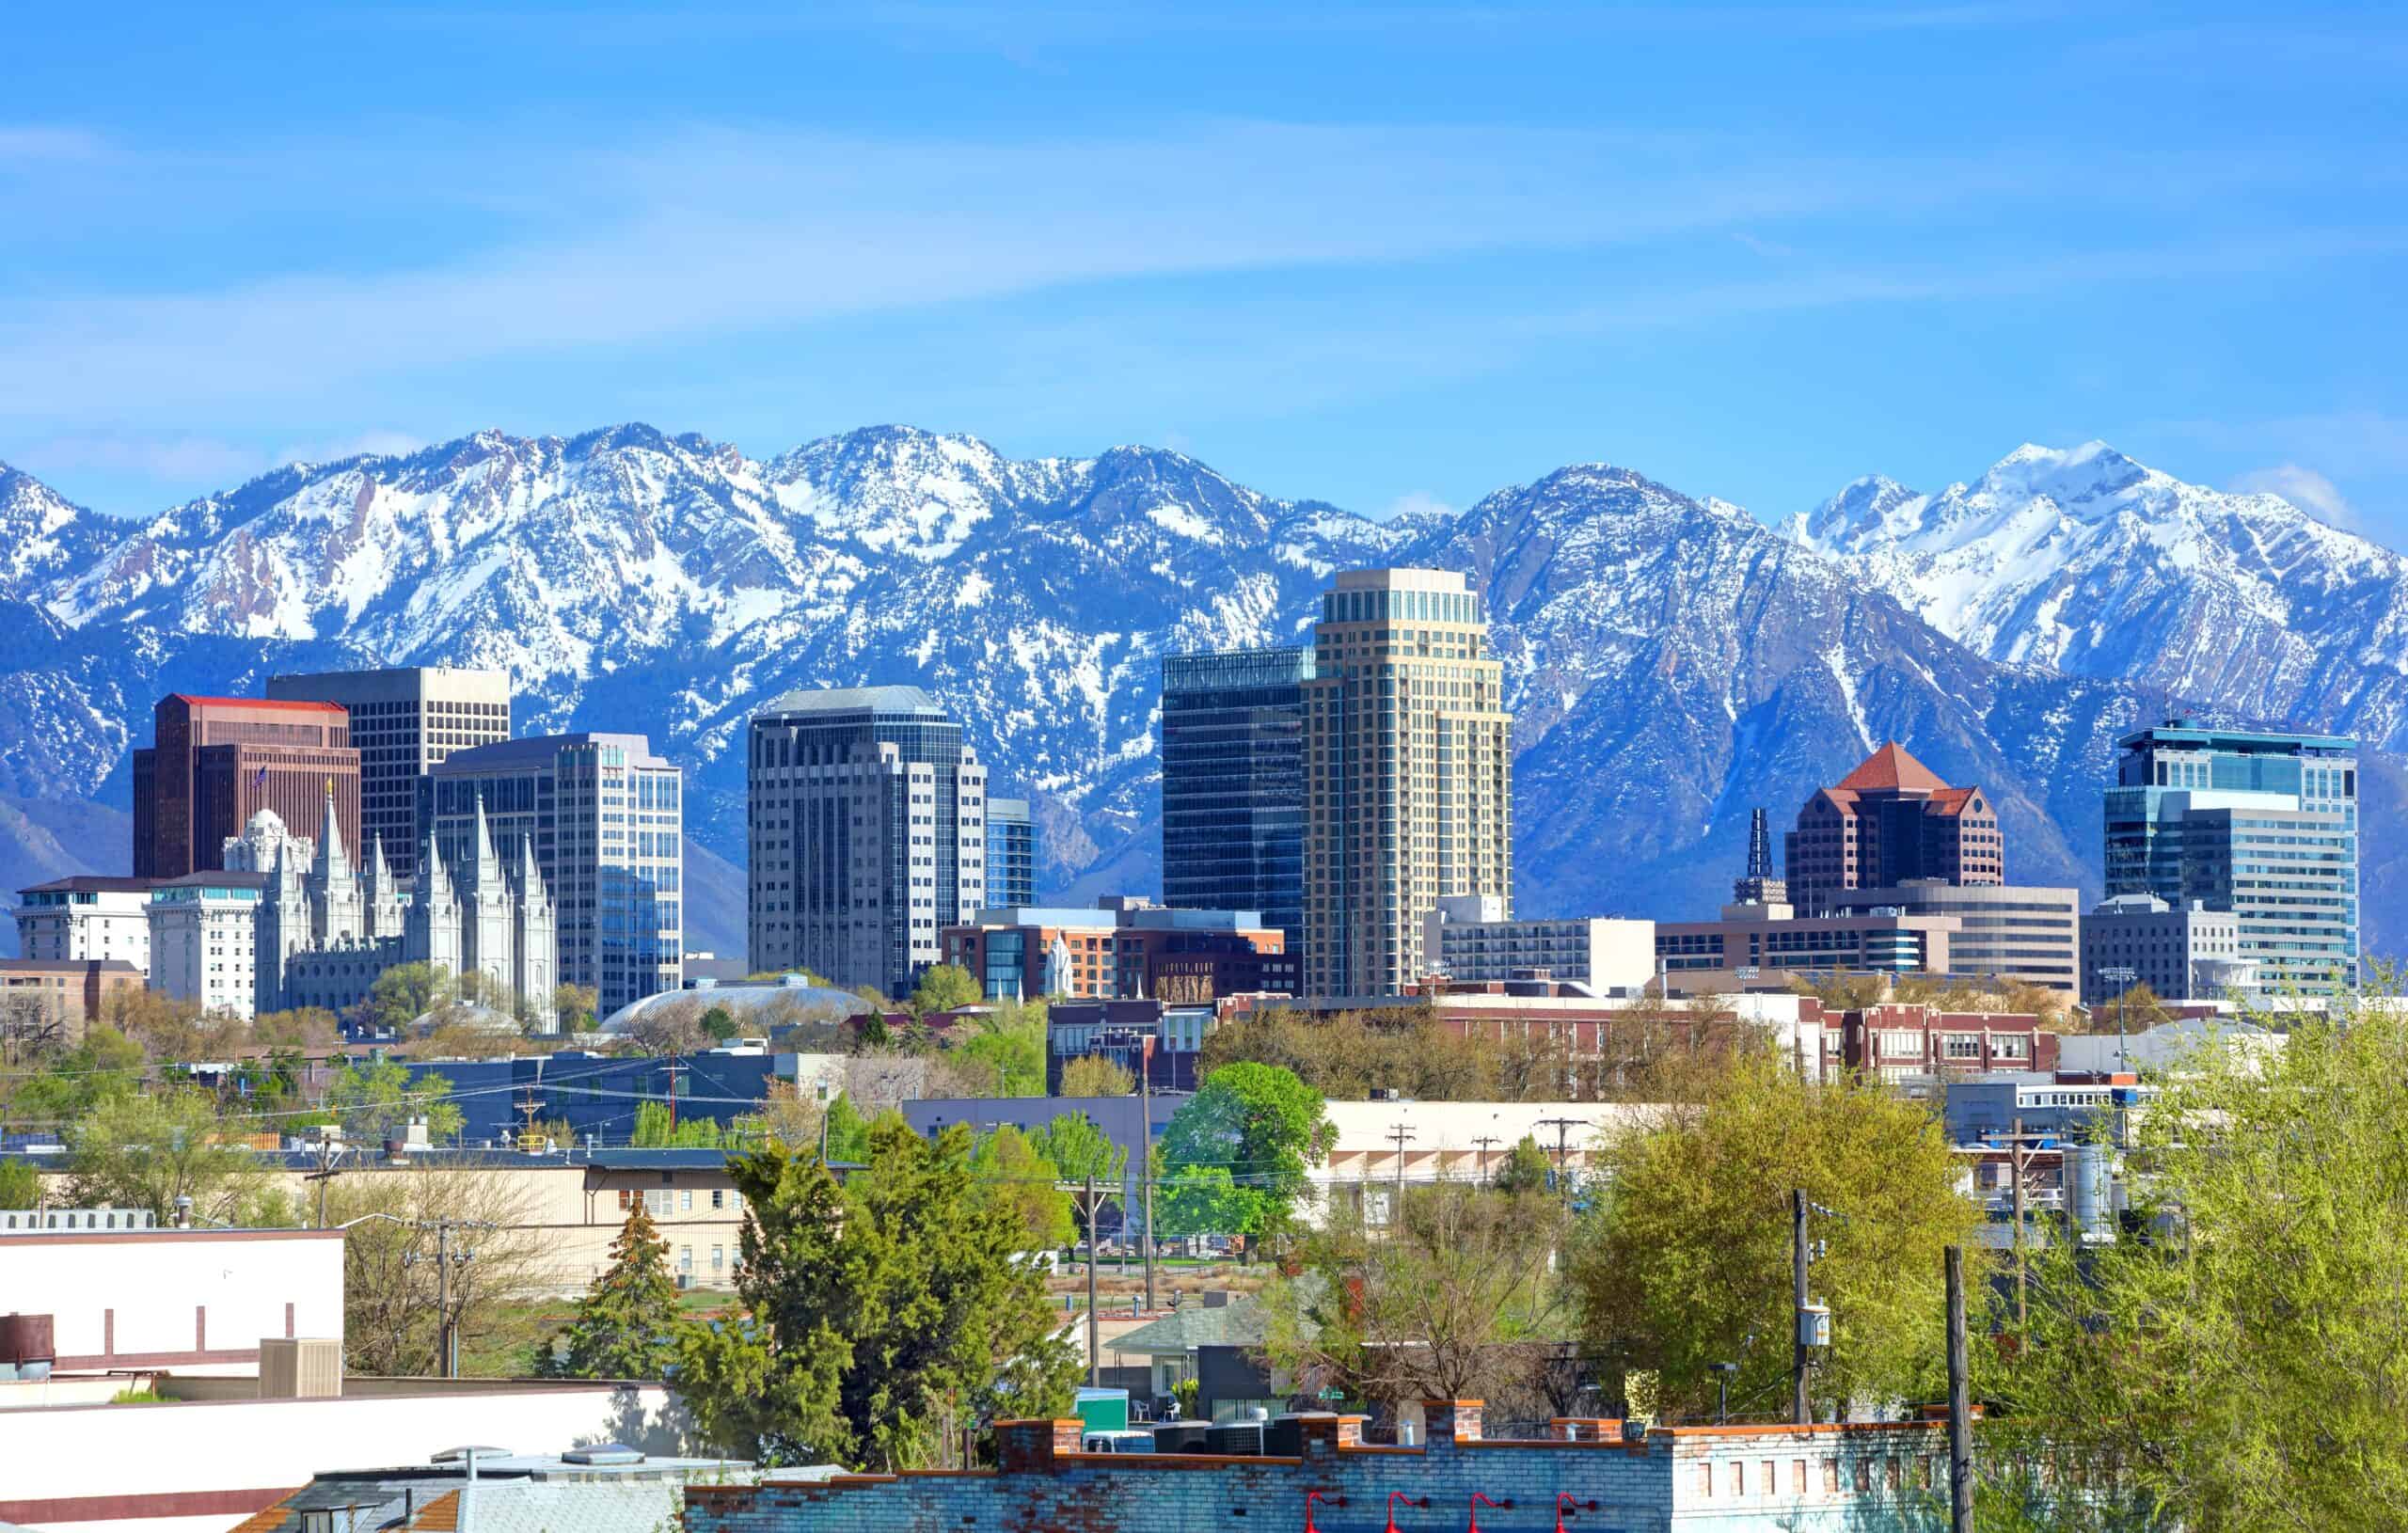
- Documented police killings, Jan. 2020 – Oct. 2024: 7.5 per 100,000 people (15 total)
- Gender of those killed: 93.3% male, 6.7% female
- Race/ethnicity of those killed: 60.0% White, 13.3% Black, 13.3% Hispanic, 0.0% Native American, 0.0% Asian
- Share of those killed with signs of a mental illness: 33.3%
- Share of those killed who were unarmed: 13.3%
- City population: 201,269
7. Savannah, Georgia
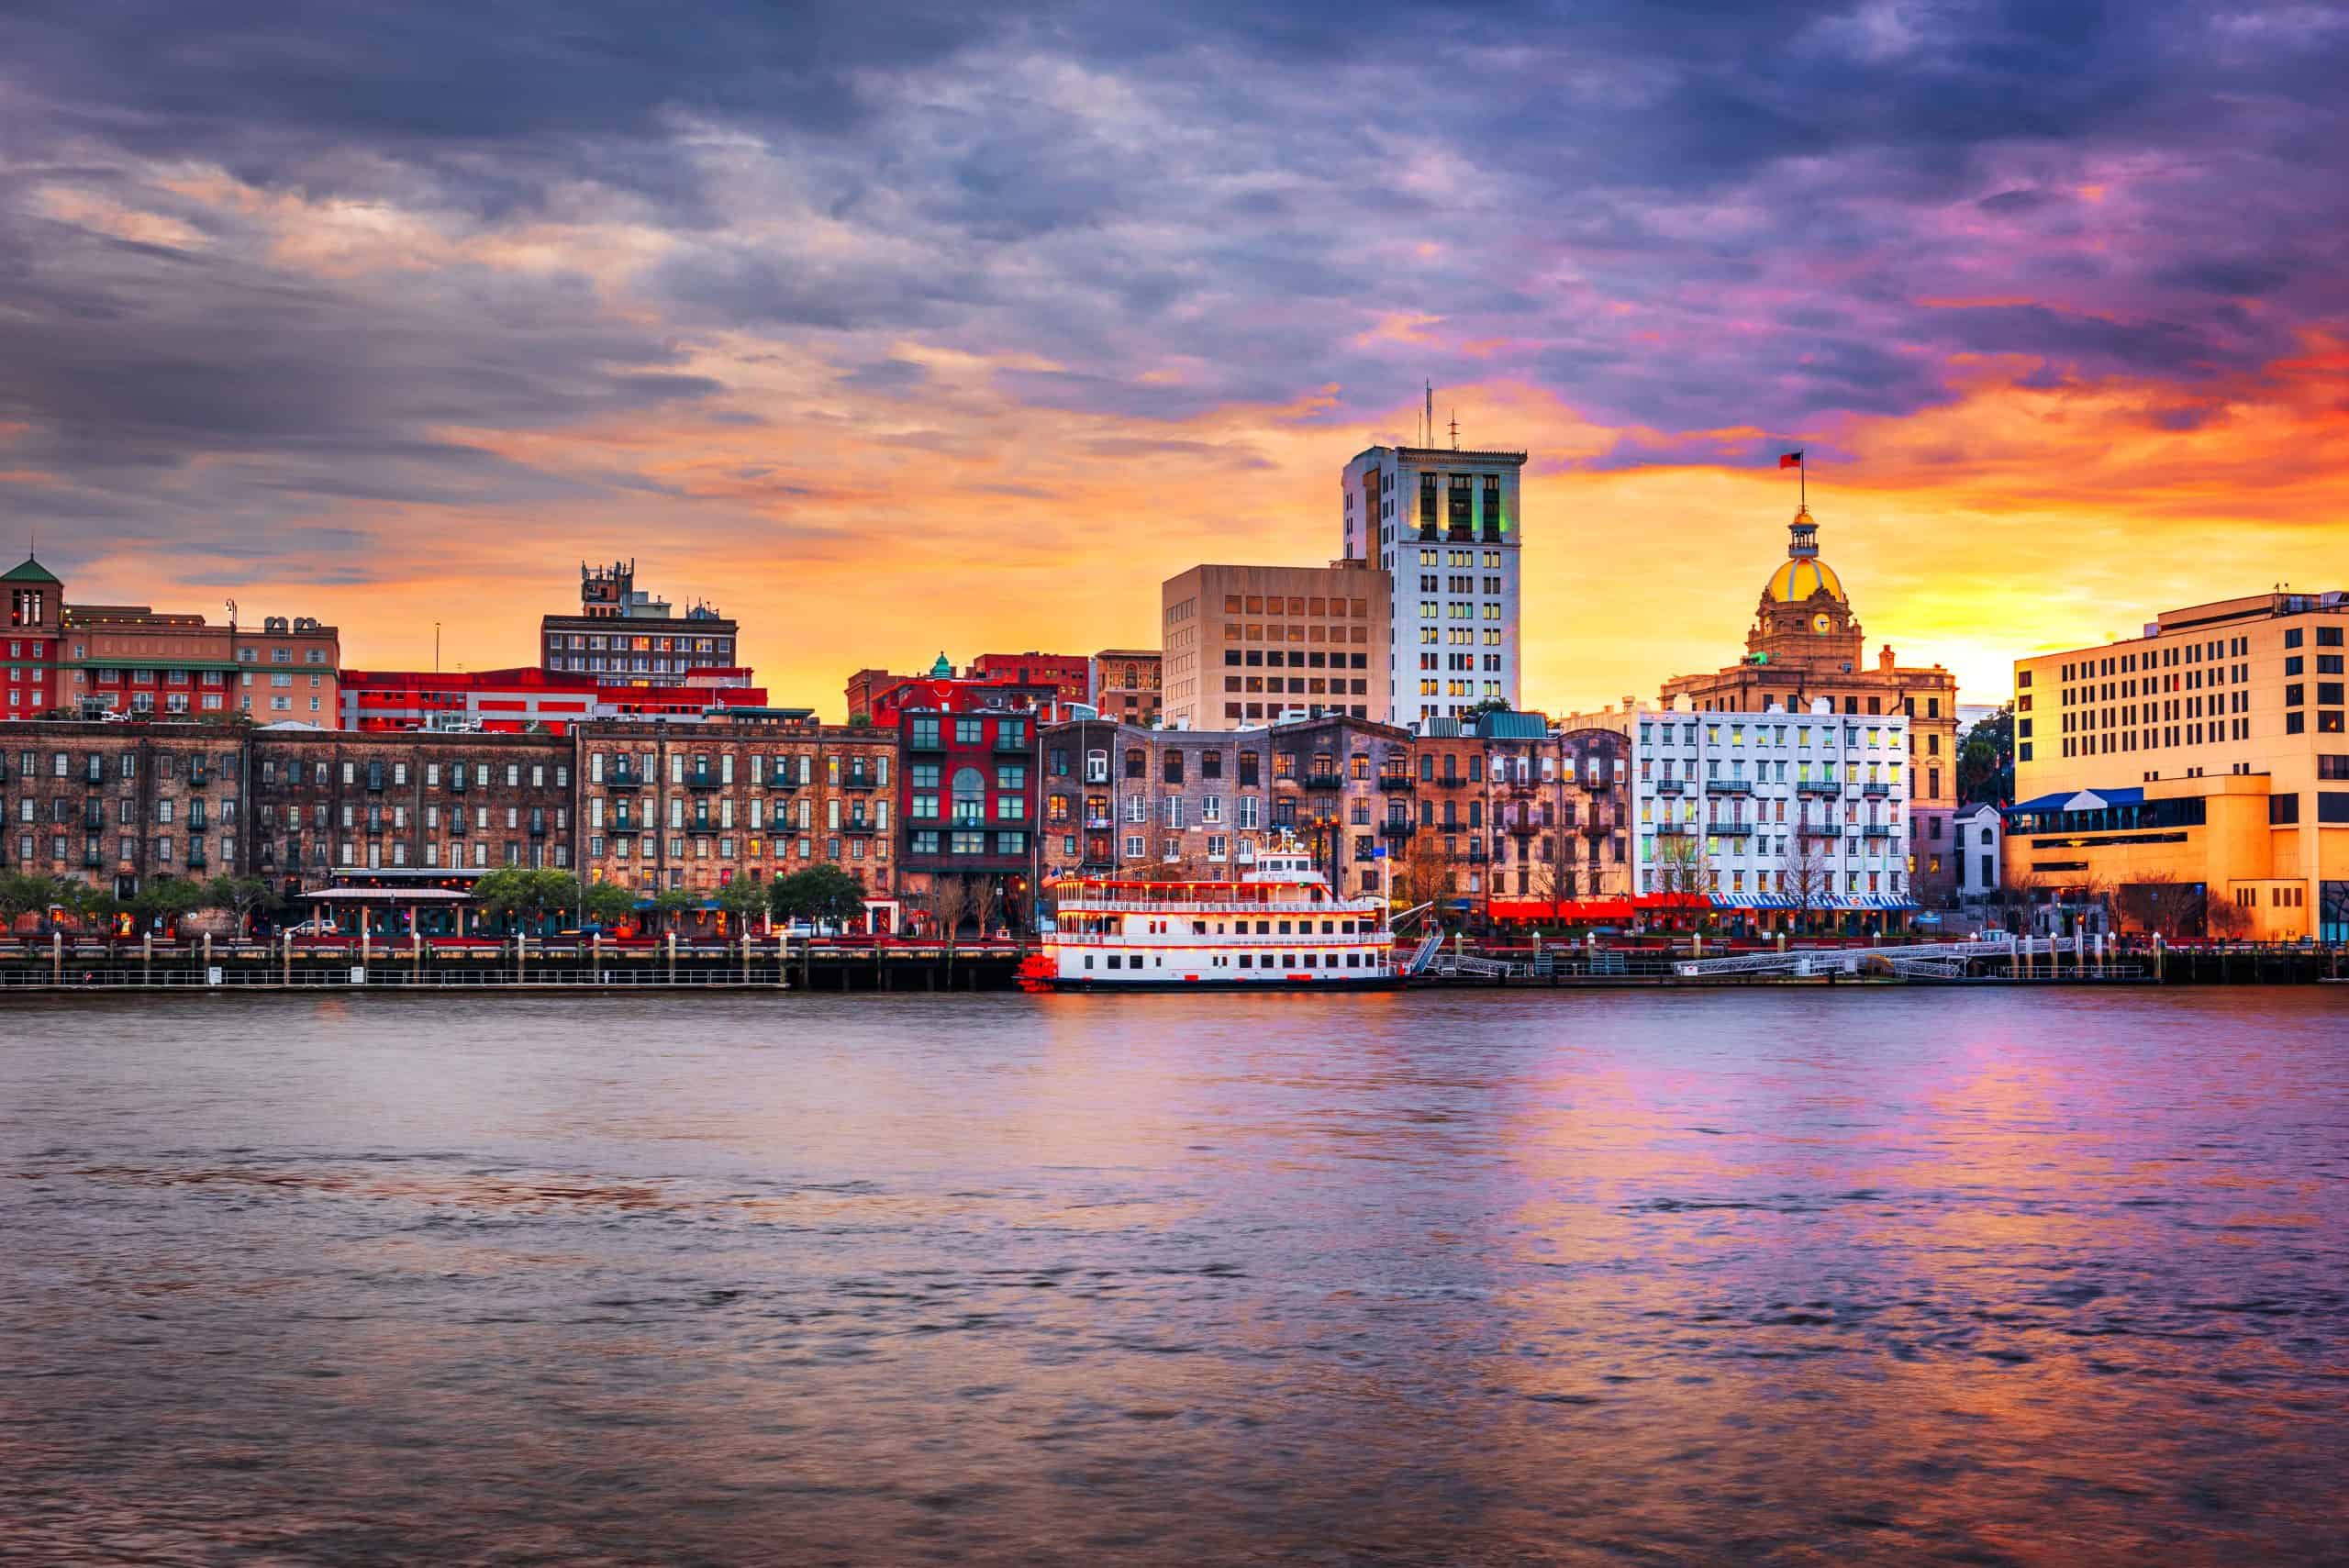
- Documented police killings, Jan. 2020 – Oct. 2024: 7.5 per 100,000 people (11 total)
- Gender of those killed: 100.0% male, 0.0% female
- Race/ethnicity of those killed: 27.3% White, 36.4% Black, 0.0% Hispanic, 0.0% Native American, 0.0% Asian
- Share of those killed with signs of a mental illness: 18.2%
- Share of those killed who were unarmed: 9.1%
- City population: 147,583
6. Amarillo, Texas
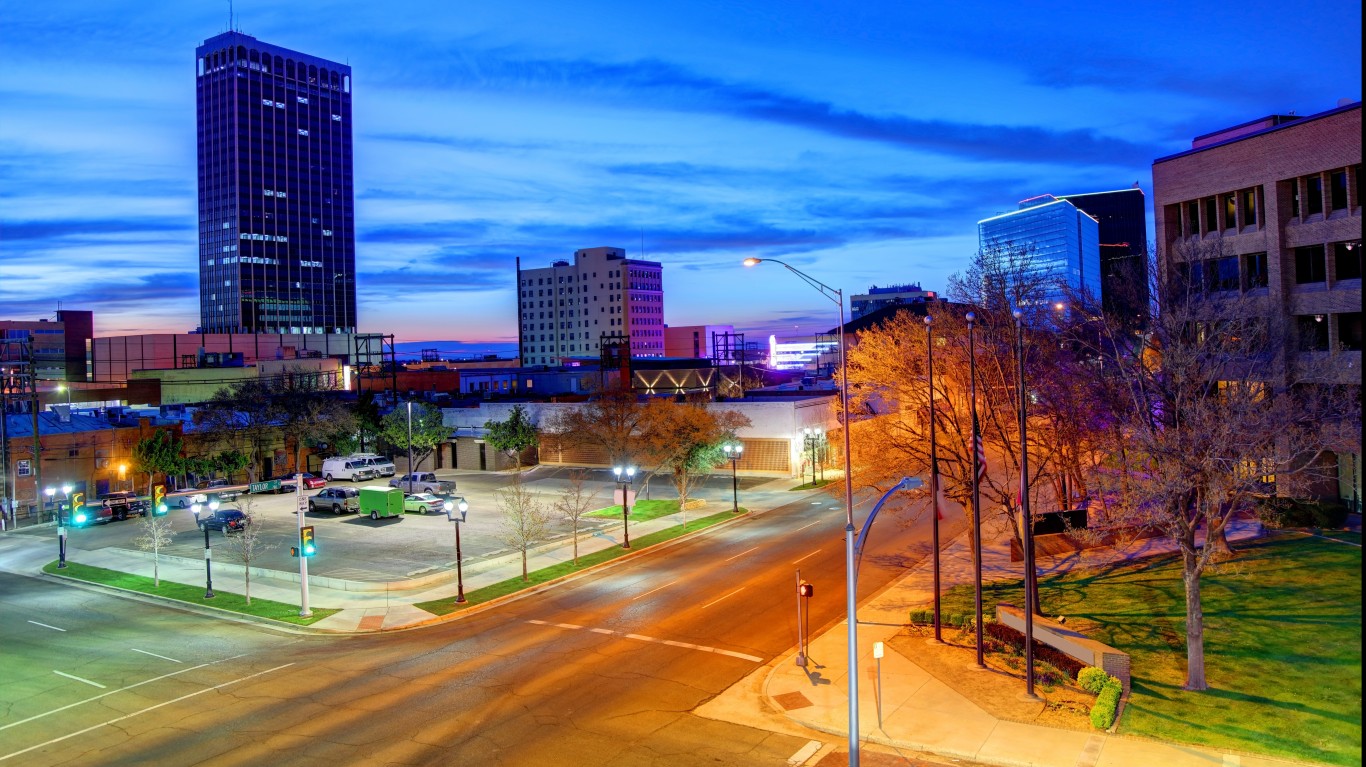
- Documented police killings, Jan. 2020 – Oct. 2024: 7.5 per 100,000 people (15 total)
- Gender of those killed: 93.3% male, 6.7% female
- Race/ethnicity of those killed: 33.3% White, 0.0% Black, 66.7% Hispanic, 0.0% Native American, 0.0% Asian
- Share of those killed with signs of a mental illness: 13.3%
- Share of those killed who were unarmed: 26.7%
- City population: 200,360
5. San Bernardino, California
- Documented police killings, Jan. 2020 – Oct. 2024: 7.7 per 100,000 people (17 total)
- Gender of those killed: 94.1% male, 5.9% female
- Race/ethnicity of those killed: 17.6% White, 35.3% Black, 35.3% Hispanic, 0.0% Native American, 0.0% Asian
- Share of those killed with signs of a mental illness: 0.0%
- Share of those killed who were unarmed: 5.9%
- City population: 221,041
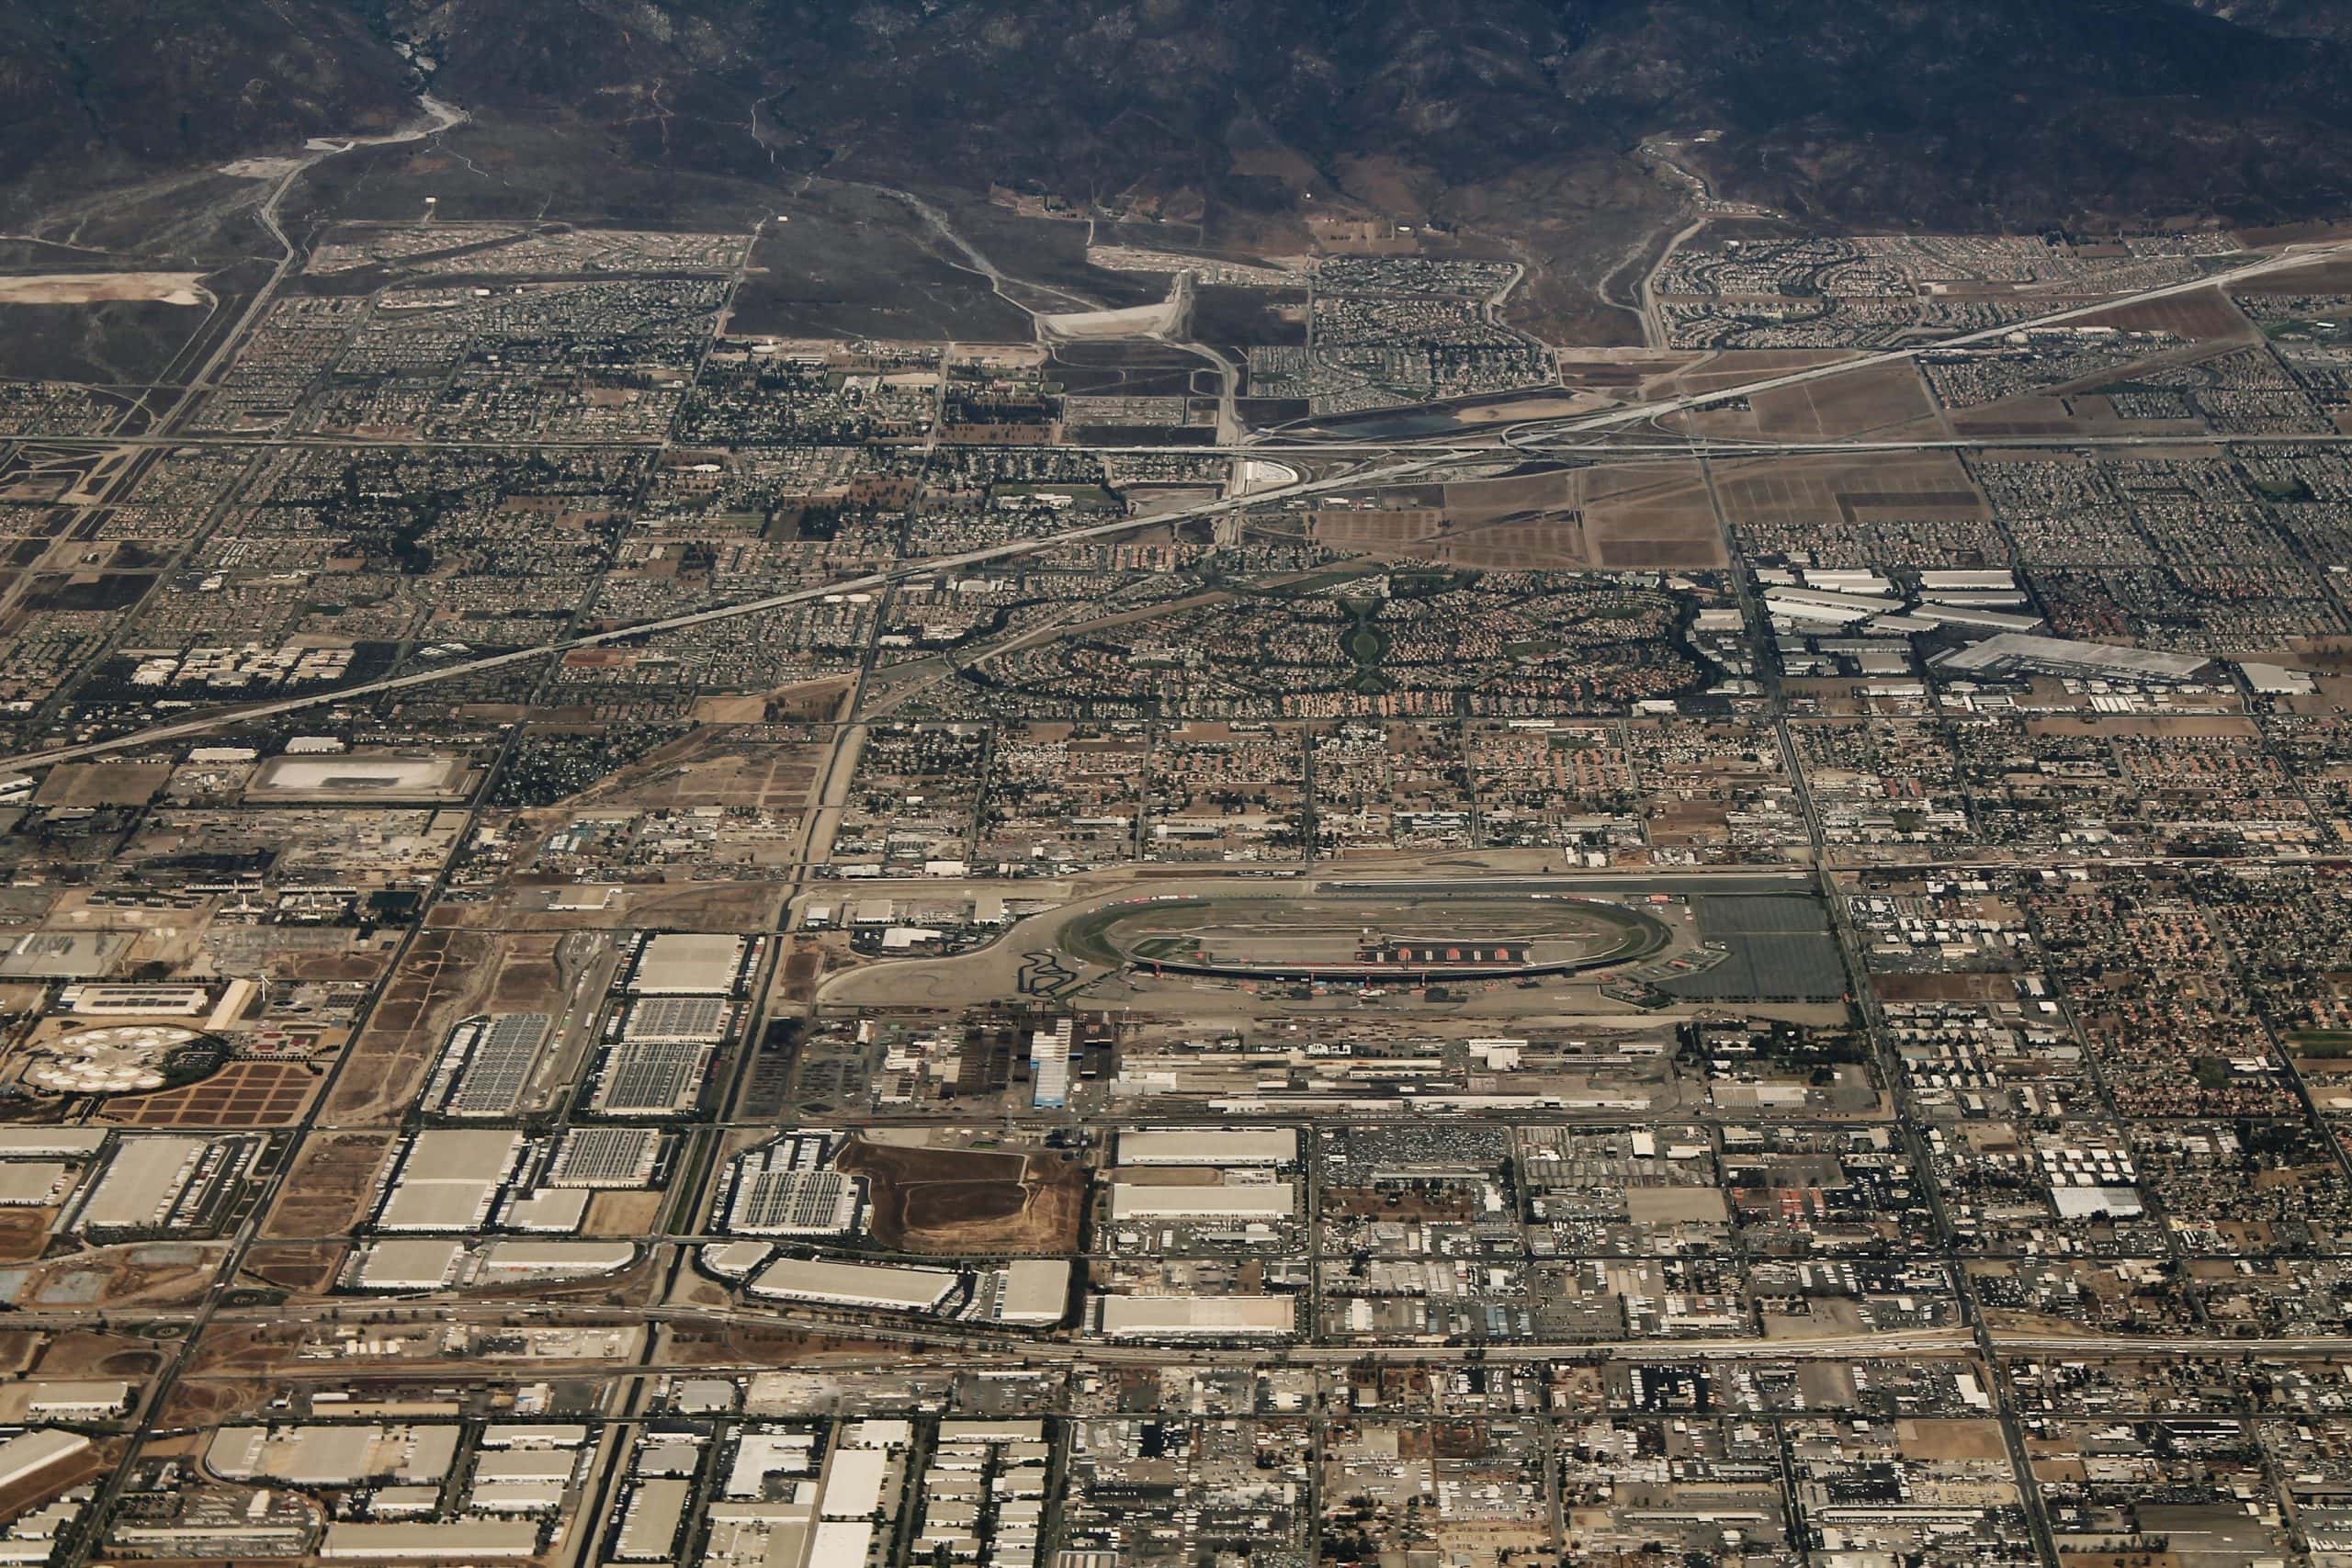
4. Albuquerque, New Mexico
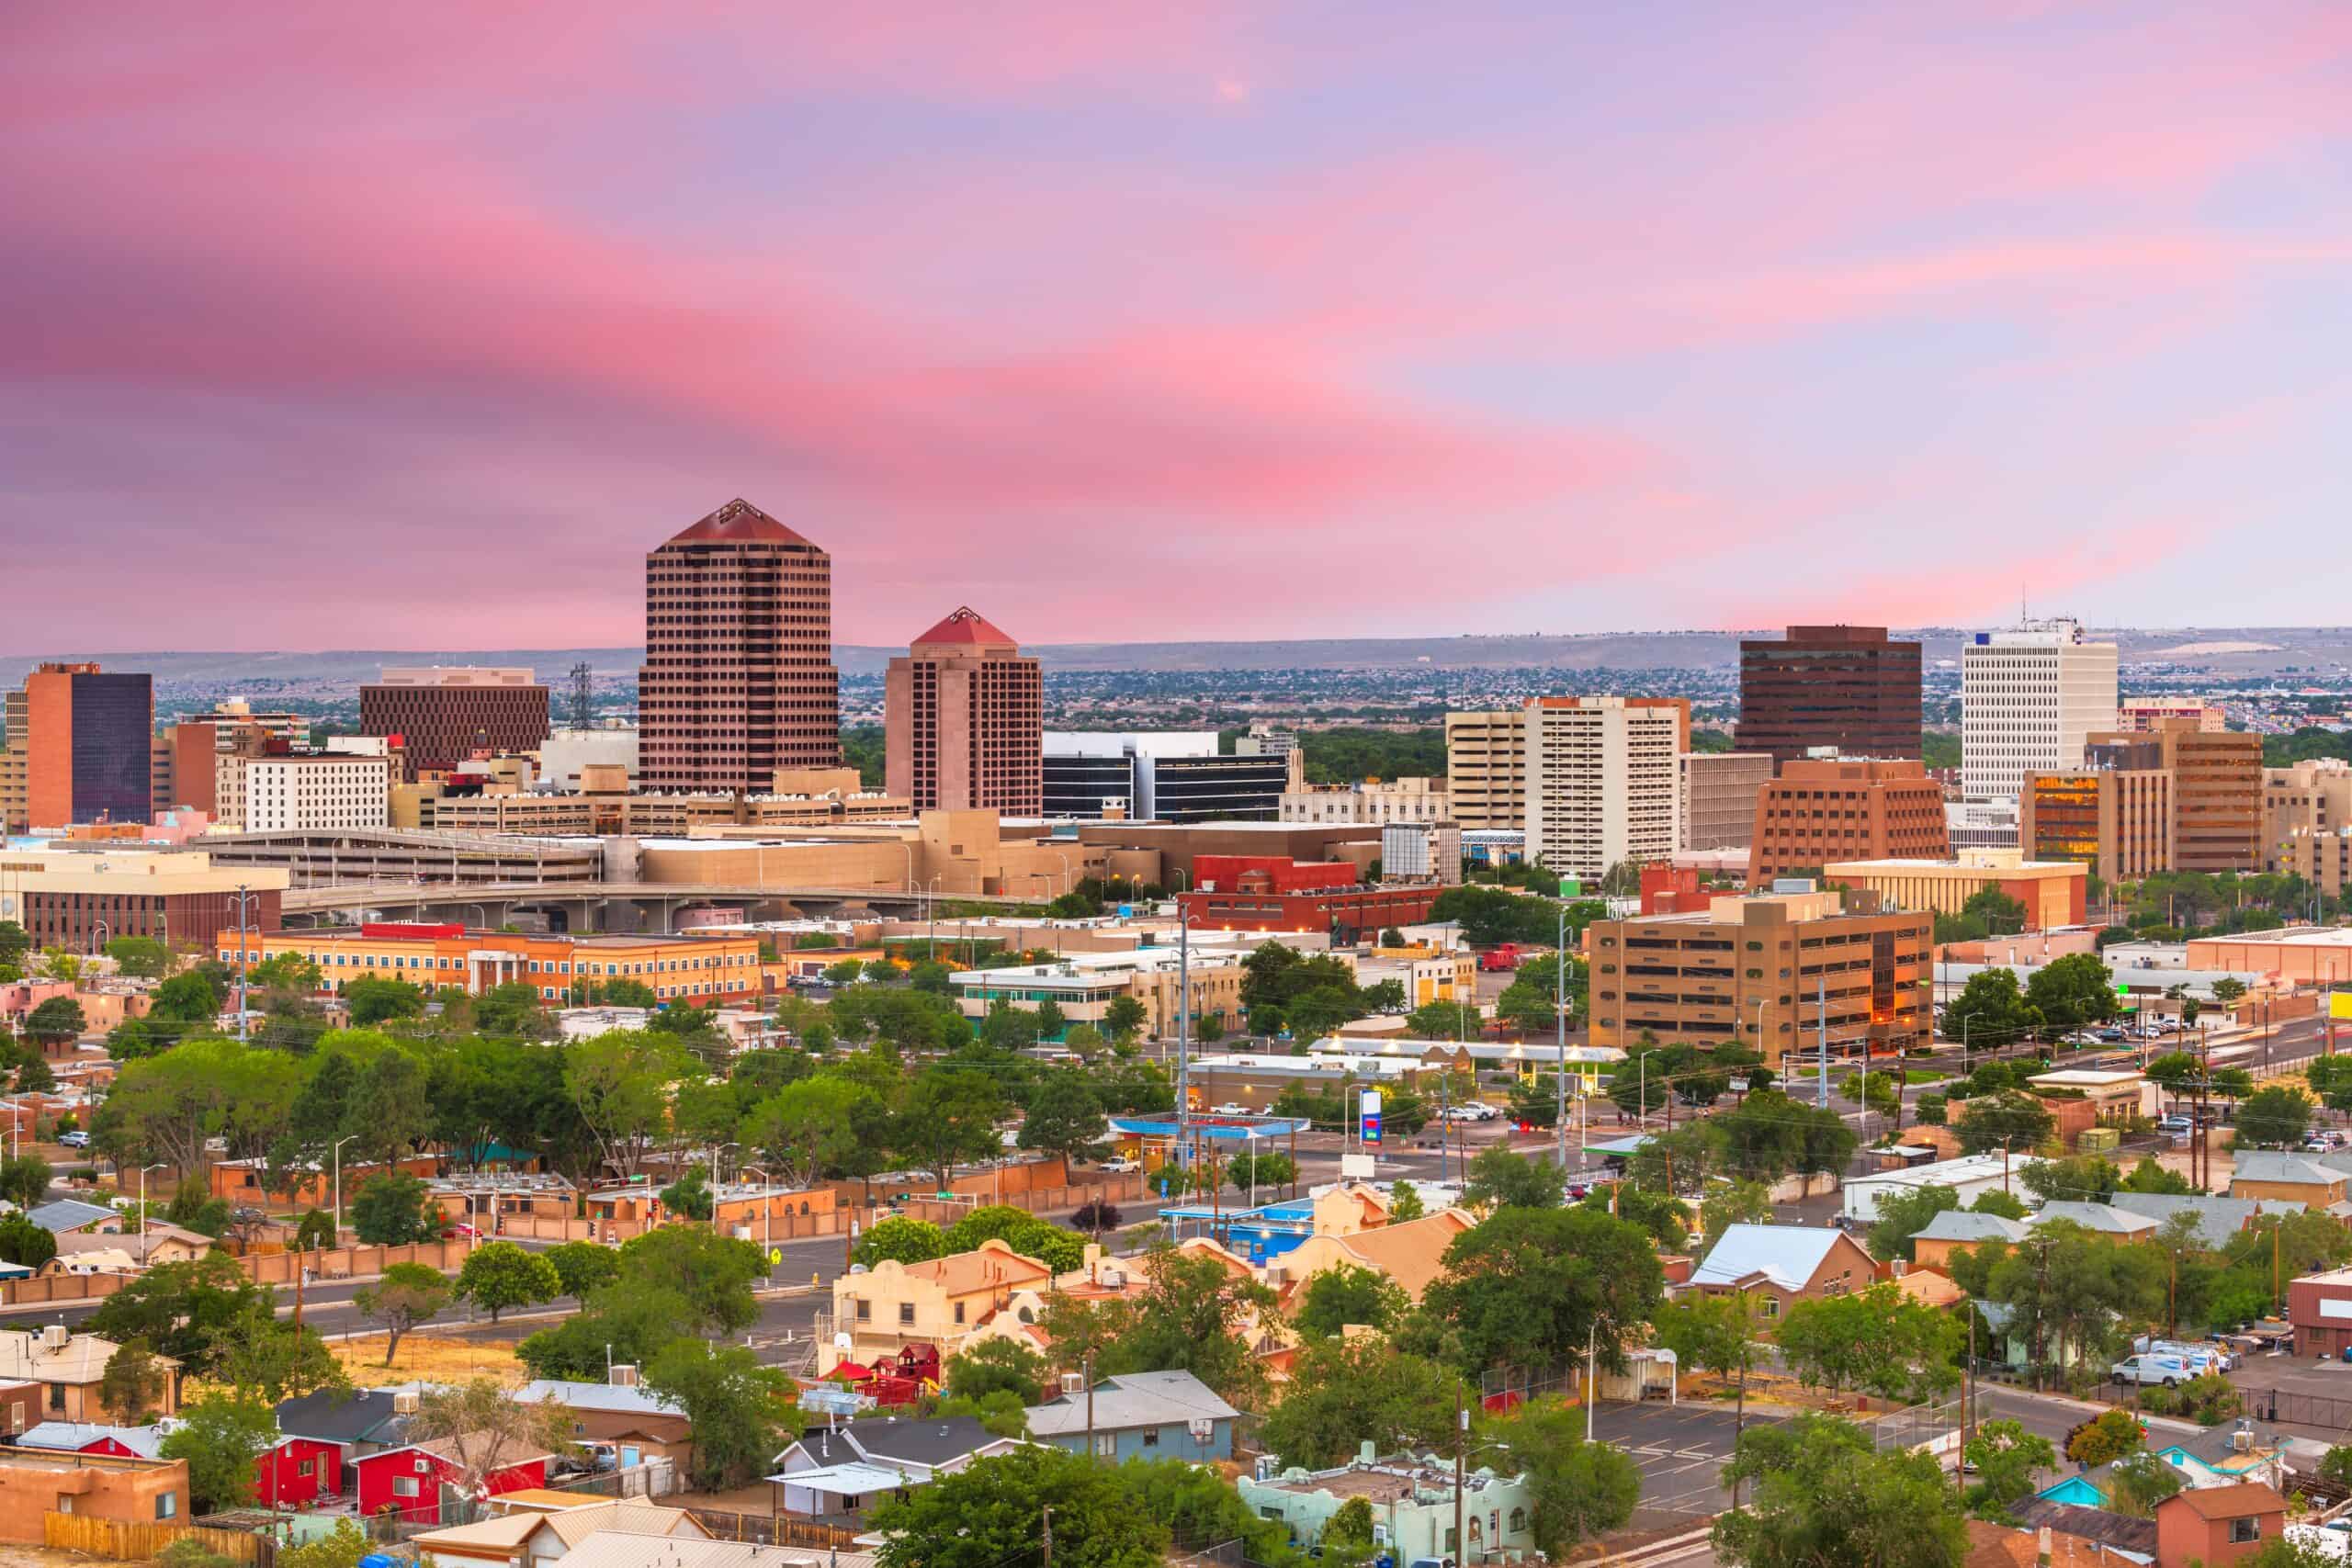
- Documented police killings, Jan. 2020 – Oct. 2024: 8.0 per 100,000 people (45 total)
- Gender of those killed: 97.8% male, 2.2% female
- Race/ethnicity of those killed: 24.4% White, 11.1% Black, 46.7% Hispanic, 8.9% Native American, 0.0% Asian
- Share of those killed with signs of a mental illness: 33.3%
- Share of those killed who were unarmed: 20.0%
- City population: 562,551
3. Evansville, Indiana
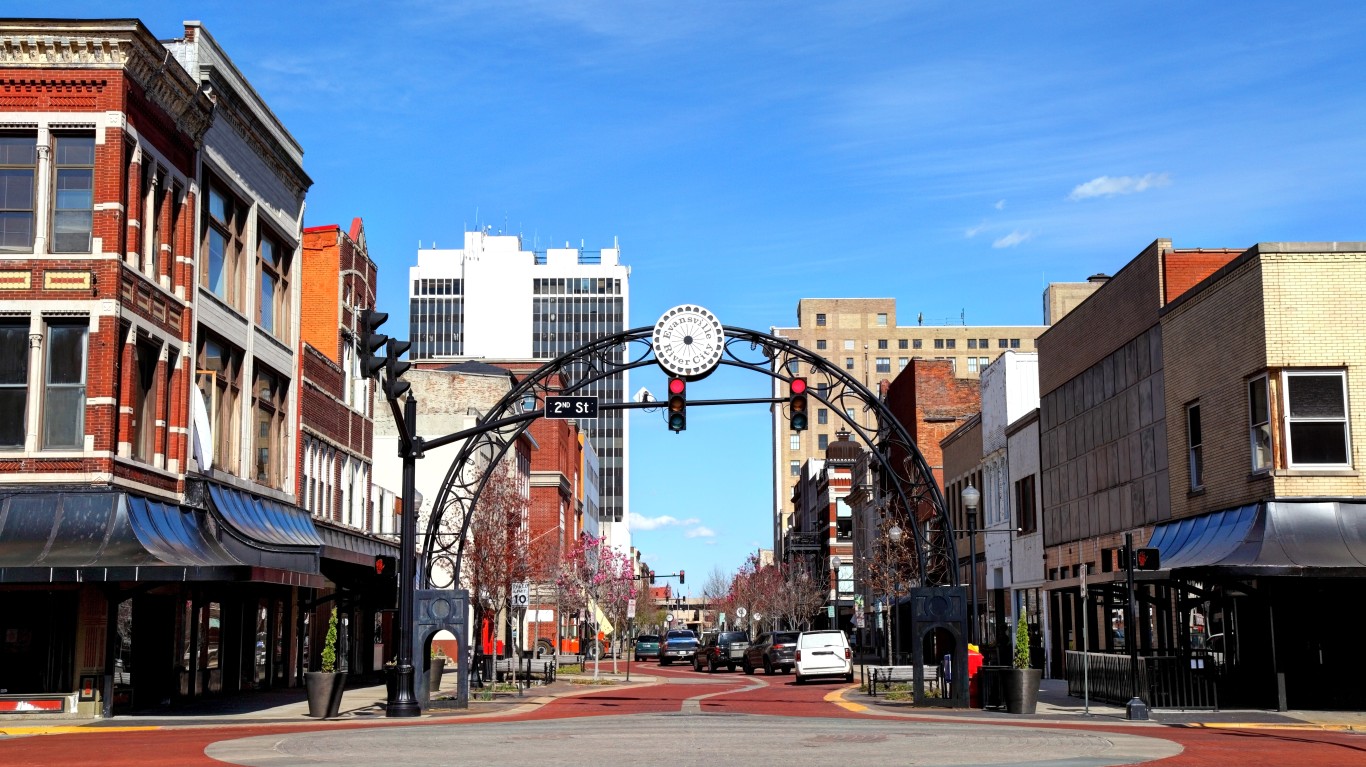
- Documented police killings, Jan. 2020 – Oct. 2024: 10.3 per 100,000 people (12 total)
- Gender of those killed: 91.7% male, 8.3% female
- Race/ethnicity of those killed: 50.0% White, 25.0% Black, 16.7% Hispanic, 0.0% Native American, 0.0% Asian
- Share of those killed with signs of a mental illness: 33.3%
- Share of those killed who were unarmed: 33.3%
- City population: 116,906
2. Las Cruces, New Mexico
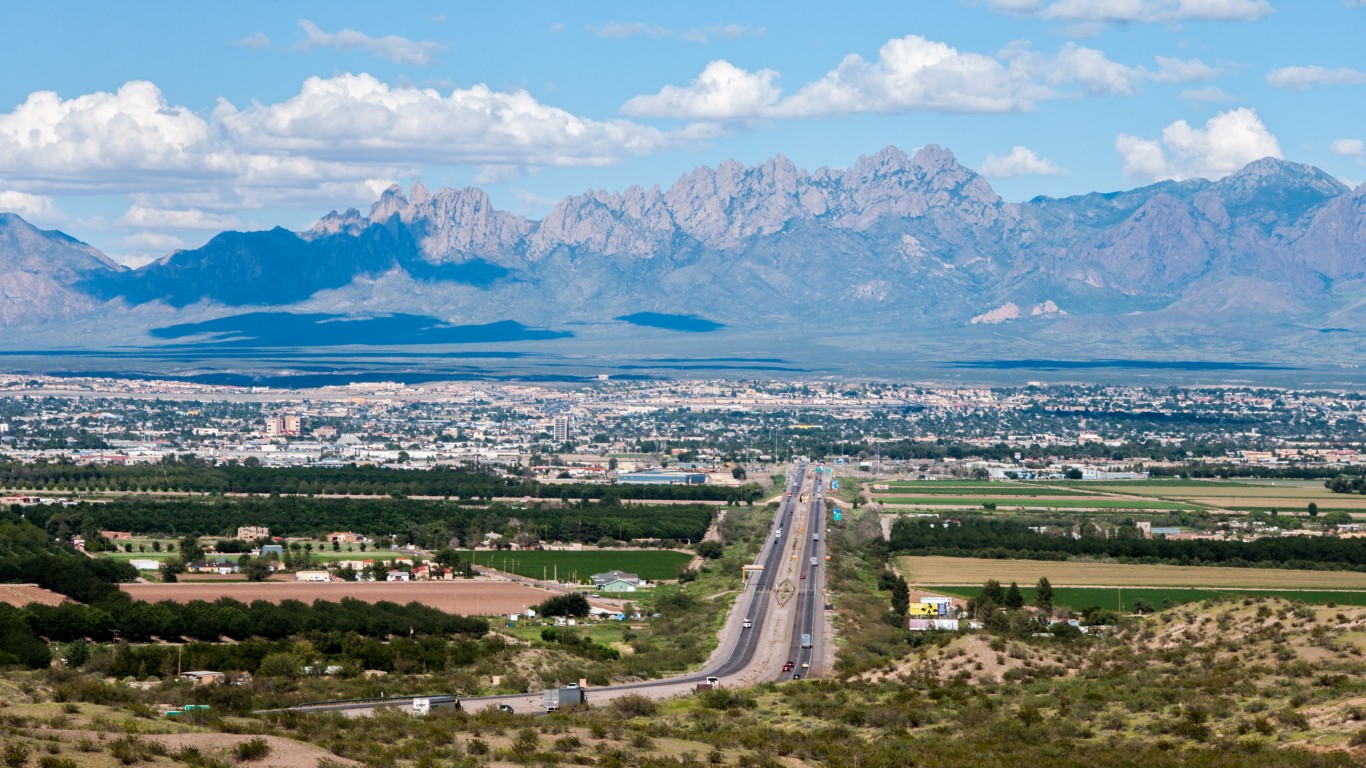
- Documented police killings, Jan. 2020 – Oct. 2024: 11.7 per 100,000 people (13 total)
- Gender of those killed: 84.6% male, 15.4% female
- Race/ethnicity of those killed: 7.7% White, 7.7% Black, 61.5% Hispanic, 0.0% Native American, 0.0% Asian
- Share of those killed with signs of a mental illness: 38.5%
- Share of those killed who were unarmed: 23.1%
- City population: 111,273
1. Pueblo, Colorado
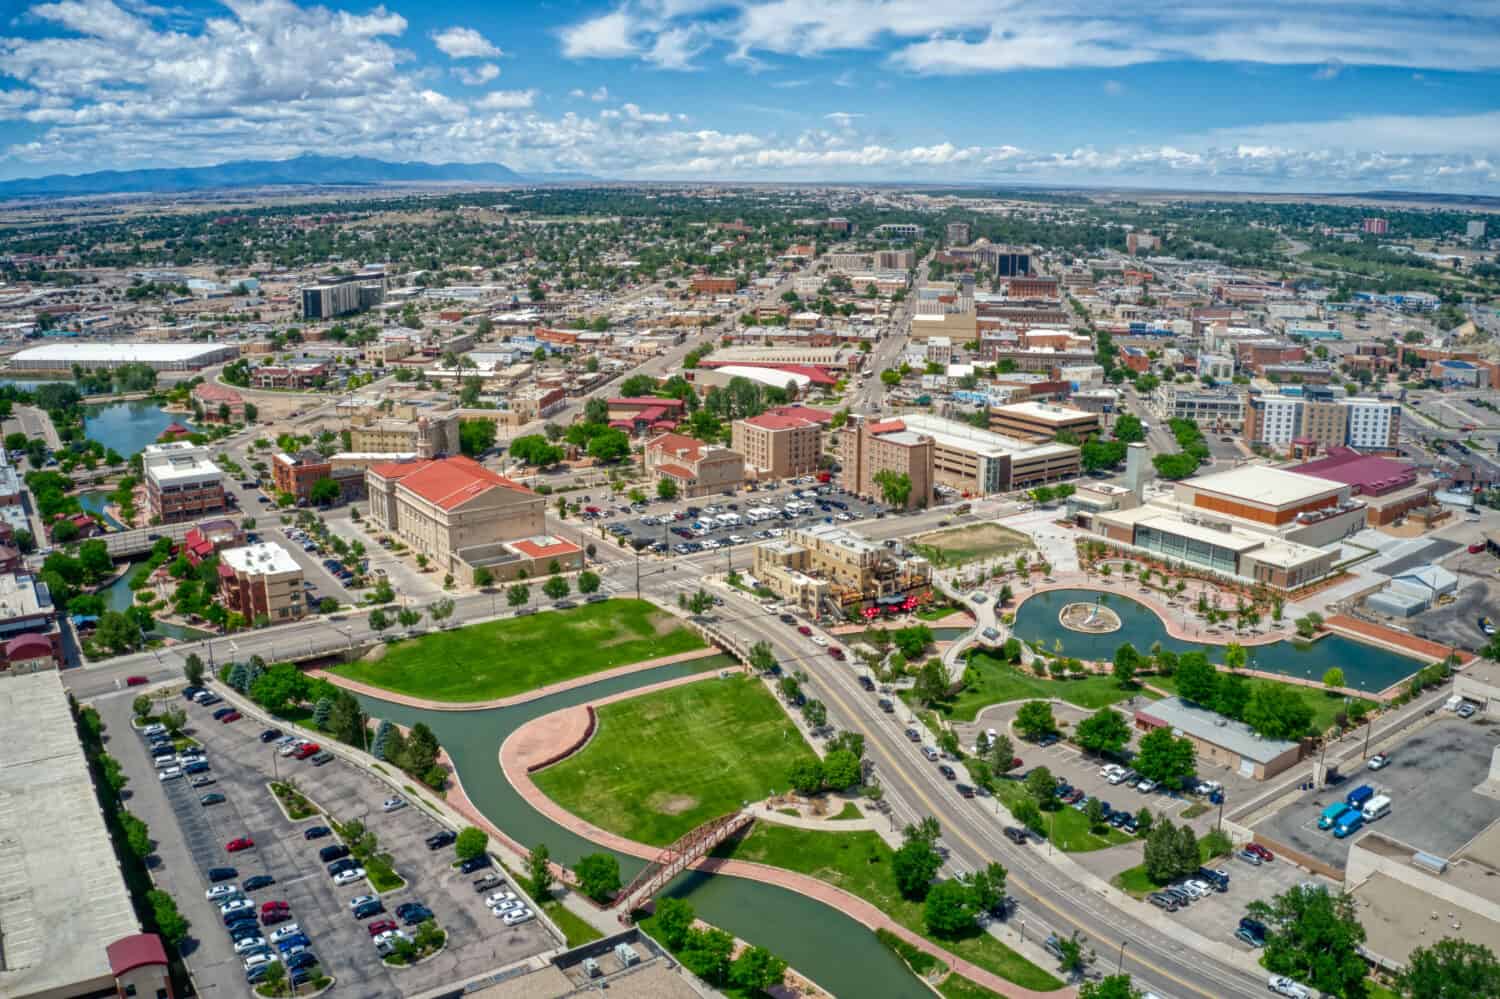
- Documented police killings, Jan. 2020 – Oct. 2024: 14.4 per 100,000 people (16 total)
- Gender of those killed: 93.8% male, 6.3% female
- Race/ethnicity of those killed: 43.8% White, 0.0% Black, 43.8% Hispanic, 0.0% Native American, 0.0% Asian
- Share of those killed with signs of a mental illness: 12.5%
- Share of those killed who were unarmed: 0.0%
- City population: 111,430
The post These Are America’s Hotspots for Deadly Police Incidents appeared first on 24/7 Wall St..