


The U.S. Cities People Are Leaving In Droves
While the U.S. population grew by 6.7% from 2013 to 2023, population growth was far from even across the country. Of the roughly 29,000 cities with available data, 14,000 experienced population declines over the period, as more and more of the population concentrated in major metro areas in the Sun Belt. Several major cities lost […] The post The U.S. Cities People Are Leaving In Droves appeared first on 24/7 Wall St..

Key Points
-
Over the past 10 years, the U.S. population grew by 6.7%.
-
Growth was highly uneven, with 14,000 of 29,000 cities registering declines in population.
-
Of the 40 cities with the largest population declines, 16 are in the South and 13 are in the Midwest.
-
Planning a move in your financial future? Click here to get started.
While the U.S. population grew by 6.7% from 2013 to 2023, population growth was far from even across the country. Of the roughly 29,000 cities with available data, 14,000 experienced population declines over the period, as more and more of the population concentrated in major metro areas in the Sun Belt.
Several major cities lost tens of thousands of residents. While some shrinking cities continued decades-long trends of population decline, in other cities — like Paradise, Nevada, Memphis, Tennessee, and Aurora, Illinois — contraction is a much more recent phenomenon. Of the 40 cities that lost the most residents from 2013 to 2023, 16 are in the South, 13 are in the Midwest, nine are in the West, and two are in the Northeast. Some are losing residents to long-declining manufacturing sectors, while others may be pushing residents away with high cost of living or growing climate risk. A closer look at the data reveals the cities people are leaving in droves.
To determine the cities people are leaving in droves, 24/7 Wall St. reviewed data on historical population from the U.S. Census Bureau. Cities were ranked based on raw population chance from 2013 to 2013. Supplemental data on average home value, median home value, and industry concentration are also from the U.S. Census Bureau.
40. Camden, NJ

- Population decline, 2013-2023: -5,885 residents (-7.6% decline)
- Current population, 2023: 71,471 residents
- Past population, 2013: 77,356 residents
- Average home value: $47,446
- Median household income: $40,450
- Most concentrated economic sectors: Transportation and warehousing, administrative and support and waste management services, retail trade, wholesale trade, accommodation and food services
39. Anchorage, AK

- Population decline, 2013-2023: -6,168 residents (-2.1% decline)
- Current population, 2023: 289,069 residents
- Past population, 2013: 295,237 residents
- Average home value: $263,671
- Median household income: $98,152
- Most concentrated economic sectors: Mining, quarrying, and oil and gas extraction, public administration, transportation and warehousing, management of companies and enterprises, utilities
38. Holualoa, HI

- Population decline, 2013-2023: -6,217 residents (-68.8% decline)
- Current population, 2023: 2,825 residents
- Past population, 2013: 9,042 residents
- Average home value: $869,161
- Median household income: $109,444
- Most concentrated economic sectors: Real estate and rental and leasing, agriculture, forestry, fishing and hunting, information, educational services, other services, except public administration
37. Montgomery, AL

- Population decline, 2013-2023: -6,320 residents (-3.1% decline)
- Current population, 2023: 198,440 residents
- Past population, 2013: 204,760 residents
- Average home value: $120,175
- Median household income: $55,687
- Most concentrated economic sectors: Public administration, administrative and support and waste management services, manufacturing, transportation and warehousing, retail trade
36. Kendale Lakes, FL
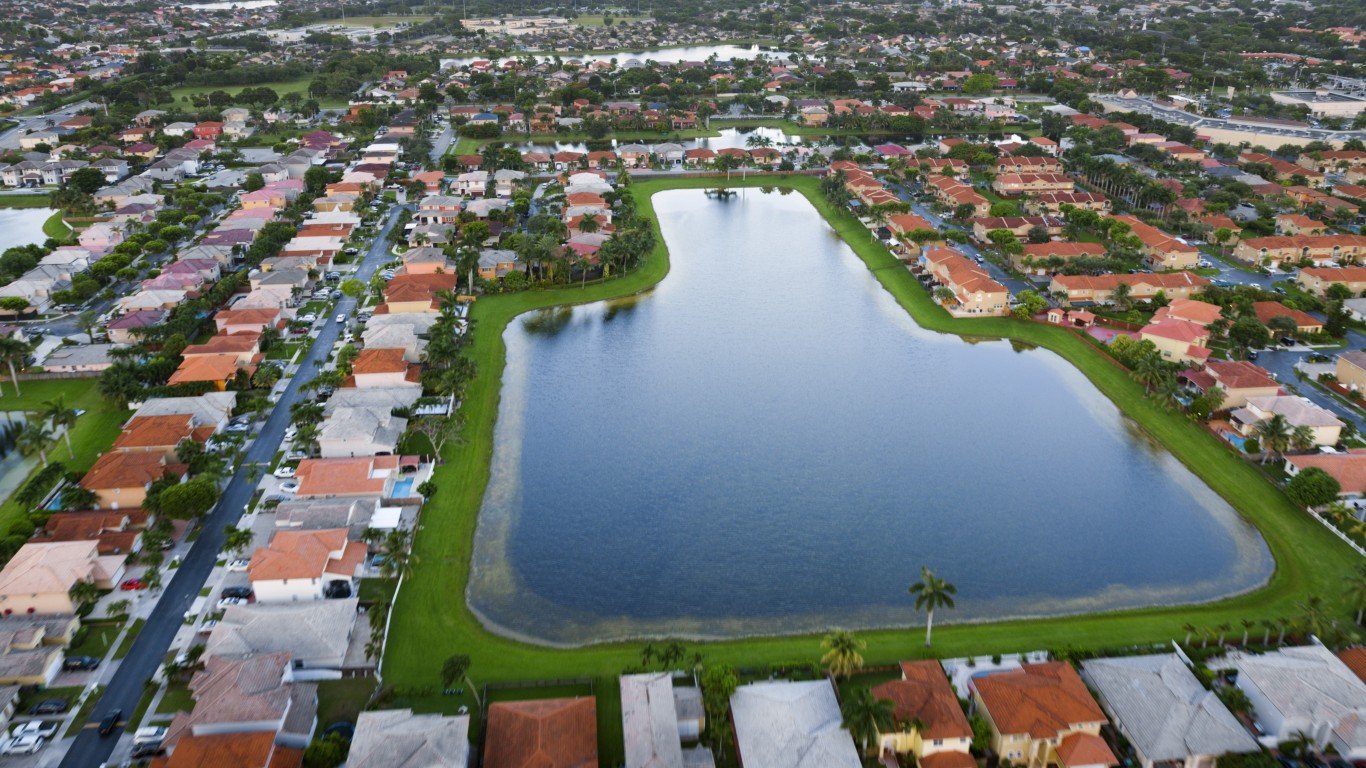
- Population decline, 2013-2023: -6,432 residents (-11.0% decline)
- Current population, 2023: 52,141 residents
- Past population, 2013: 58,573 residents
- Average home value: $307,954
- Median household income: $69,150
- Most concentrated economic sectors: Transportation and warehousing, wholesale trade, real estate and rental and leasing, administrative and support and waste management services, finance and insurance
35. Lawton, OK

- Population decline, 2013-2023: -6,485 residents (-6.7% decline)
- Current population, 2023: 90,662 residents
- Past population, 2013: 97,147 residents
- Average home value: $98,525
- Median household income: $53,588
- Most concentrated economic sectors: Public administration, arts, entertainment, and recreation, health care and social assistance, accommodation and food services, retail trade
34. Meridian, MS

- Population decline, 2013-2023: -6,603 residents (-16.1% decline)
- Current population, 2023: 34,466 residents
- Past population, 2013: 41,069 residents
- Average home value: $81,355
- Median household income: $34,657
- Most concentrated economic sectors: Accommodation and food services, administrative and support and waste management services, transportation and warehousing, health care and social assistance, agriculture, forestry, fishing and hunting
33. Dayton, OH

- Population decline, 2013-2023: -6,705 residents (-4.7% decline)
- Current population, 2023: 136,741 residents
- Past population, 2013: 143,446 residents
- Average home value: $56,526
- Median household income: $43,454
- Most concentrated economic sectors: Manufacturing, accommodation and food services, transportation and warehousing, health care and social assistance, arts, entertainment, and recreation
32. Youngstown, OH
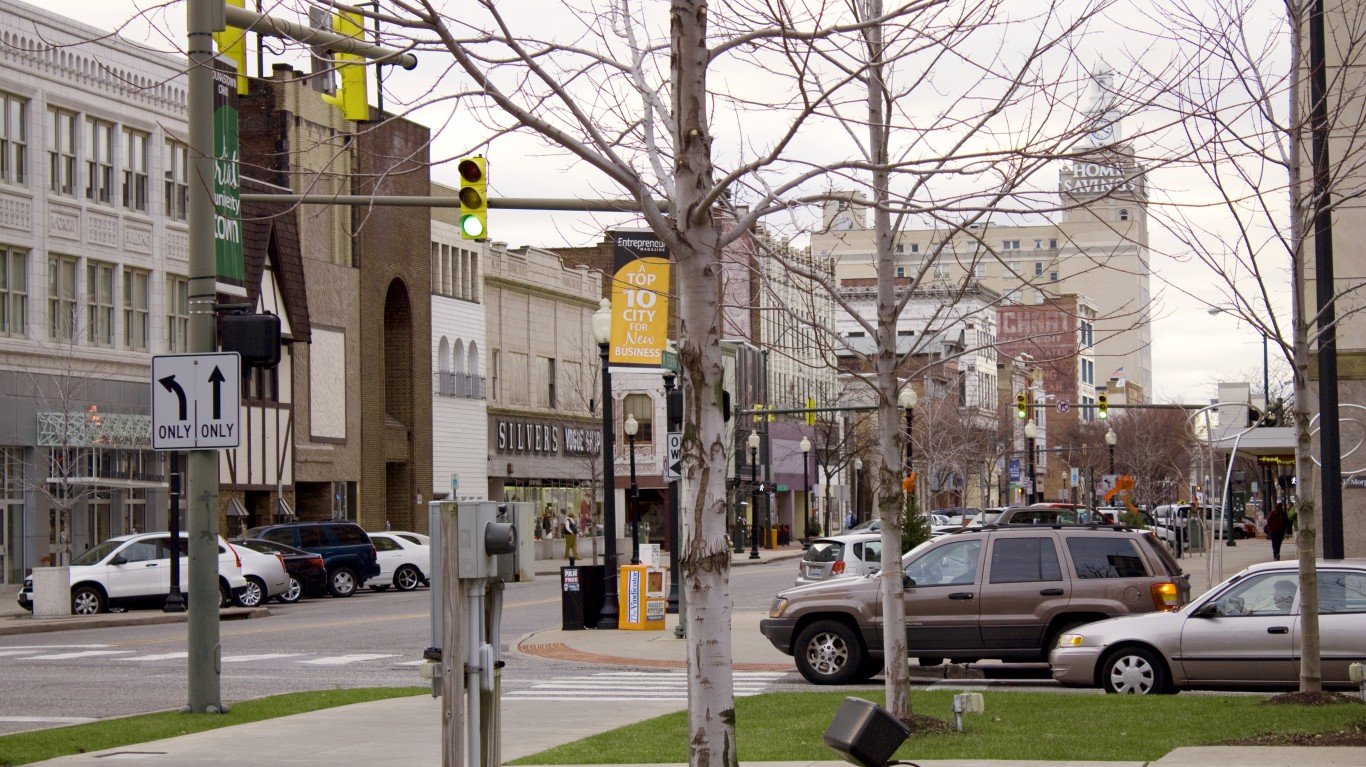
- Population decline, 2013-2023: -6,906 residents (-10.4% decline)
- Current population, 2023: 59,605 residents
- Past population, 2013: 66,511 residents
- Average home value: $43,312
- Median household income: $34,746
- Most concentrated economic sectors: Accommodation and food services, health care and social assistance, manufacturing, management of companies and enterprises, transportation and warehousing
31. Long Beach, CA

- Population decline, 2013-2023: -6,933 residents (-1.5% decline)
- Current population, 2023: 458,491 residents
- Past population, 2013: 465,424 residents
- Average home value: $344,533
- Median household income: $83,969
- Most concentrated economic sectors: Transportation and warehousing, arts, entertainment, and recreation, administrative and support and waste management services, information, accommodation and food services
30. Hialeah, FL

- Population decline, 2013-2023: -7,042 residents (-3.1% decline)
- Current population, 2023: 221,901 residents
- Past population, 2013: 228,943 residents
- Average home value: $177,067
- Median household income: $53,079
- Most concentrated economic sectors: Transportation and warehousing, wholesale trade, construction, other services, except public administration, administrative and support and waste management services
29. Fort Hood, TX
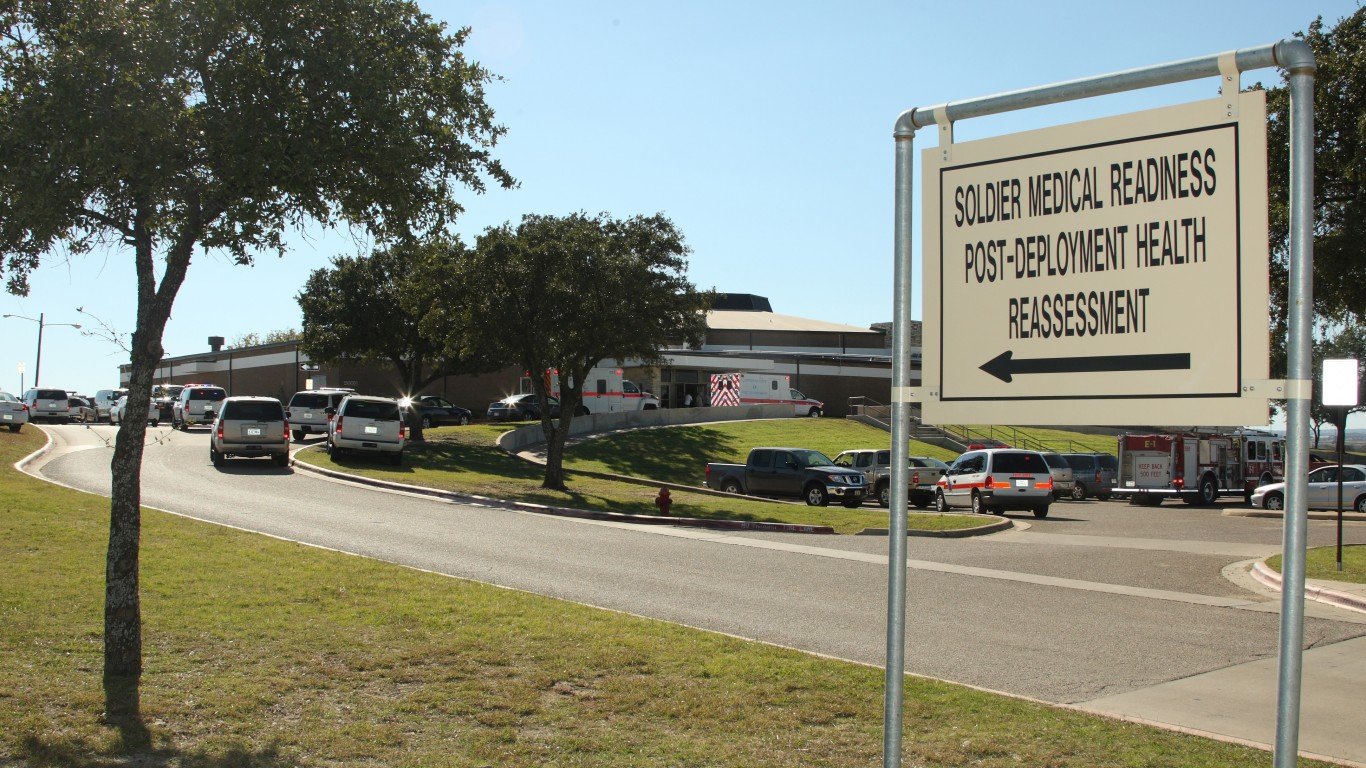
- Population decline, 2013-2023: -7,116 residents (-21.6% decline)
- Current population, 2023: 25,786 residents
- Past population, 2013: 32,902 residents
- Average home value: $1,055
- Median household income: $59,661
- Most concentrated economic sectors: Public administration, accommodation and food services, arts, entertainment, and recreation, health care and social assistance, mining, quarrying, and oil and gas extraction
28. Erie, PA

- Population decline, 2013-2023: -7,168 residents (-7.1% decline)
- Current population, 2023: 94,156 residents
- Past population, 2013: 101,324 residents
- Average home value: $66,461
- Median household income: $43,397
- Most concentrated economic sectors: Health care and social assistance, manufacturing, accommodation and food services, other services, except public administration, finance and insurance
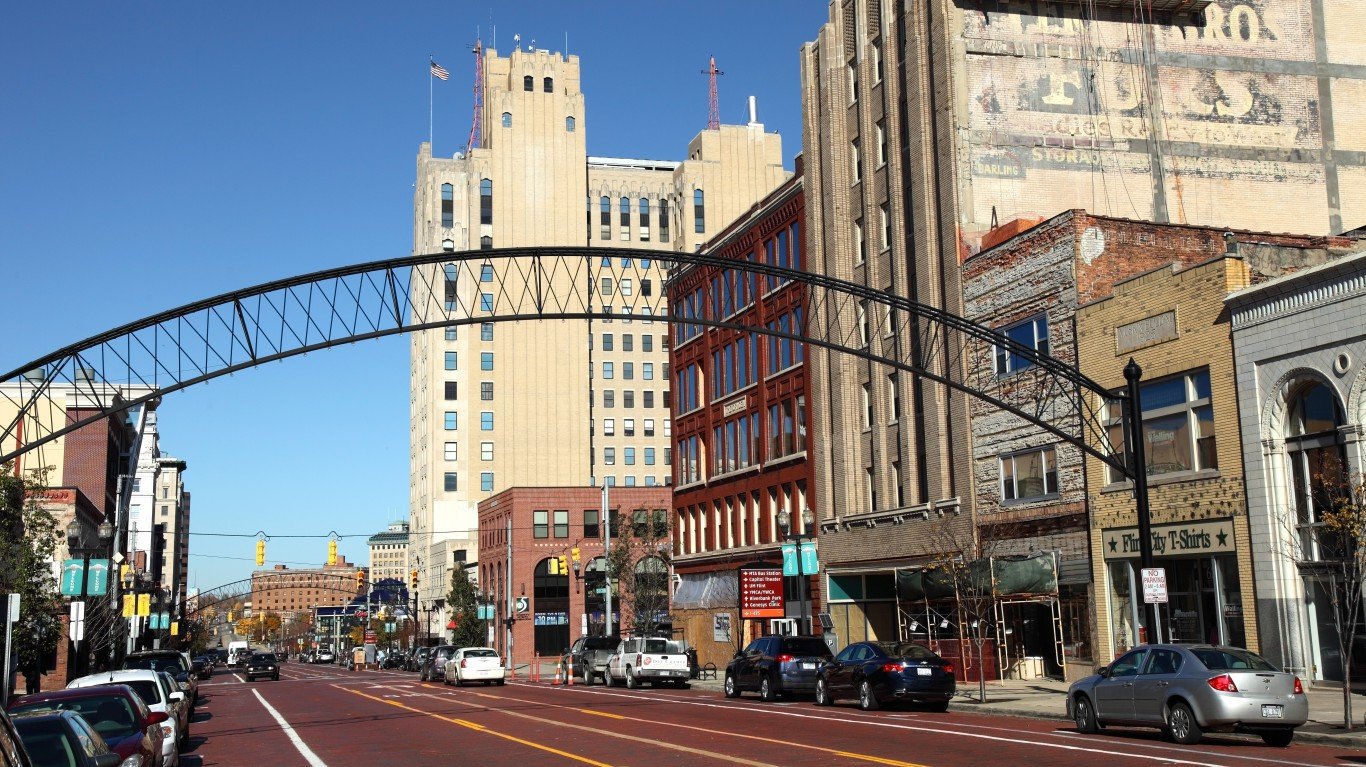
27. Saginaw, MI
- Population decline, 2013-2023: -7,286 residents (-14.2% decline)
- Current population, 2023: 43,879 residents
- Past population, 2013: 51,165 residents
- Average home value: $40,086
- Median household income: $37,298
- Most concentrated economic sectors: Health care and social assistance, accommodation and food services, utilities, management of companies and enterprises, manufacturing
26. El Monte, CA

- Population decline, 2013-2023: -7,346 residents (-6.4% decline)
- Current population, 2023: 107,066 residents
- Past population, 2013: 114,412 residents
- Average home value: $267,097
- Median household income: $64,484
- Most concentrated economic sectors: Wholesale trade, transportation and warehousing, other services, except public administration, accommodation and food services, administrative and support and waste management services
25. Pine Bluff, AR
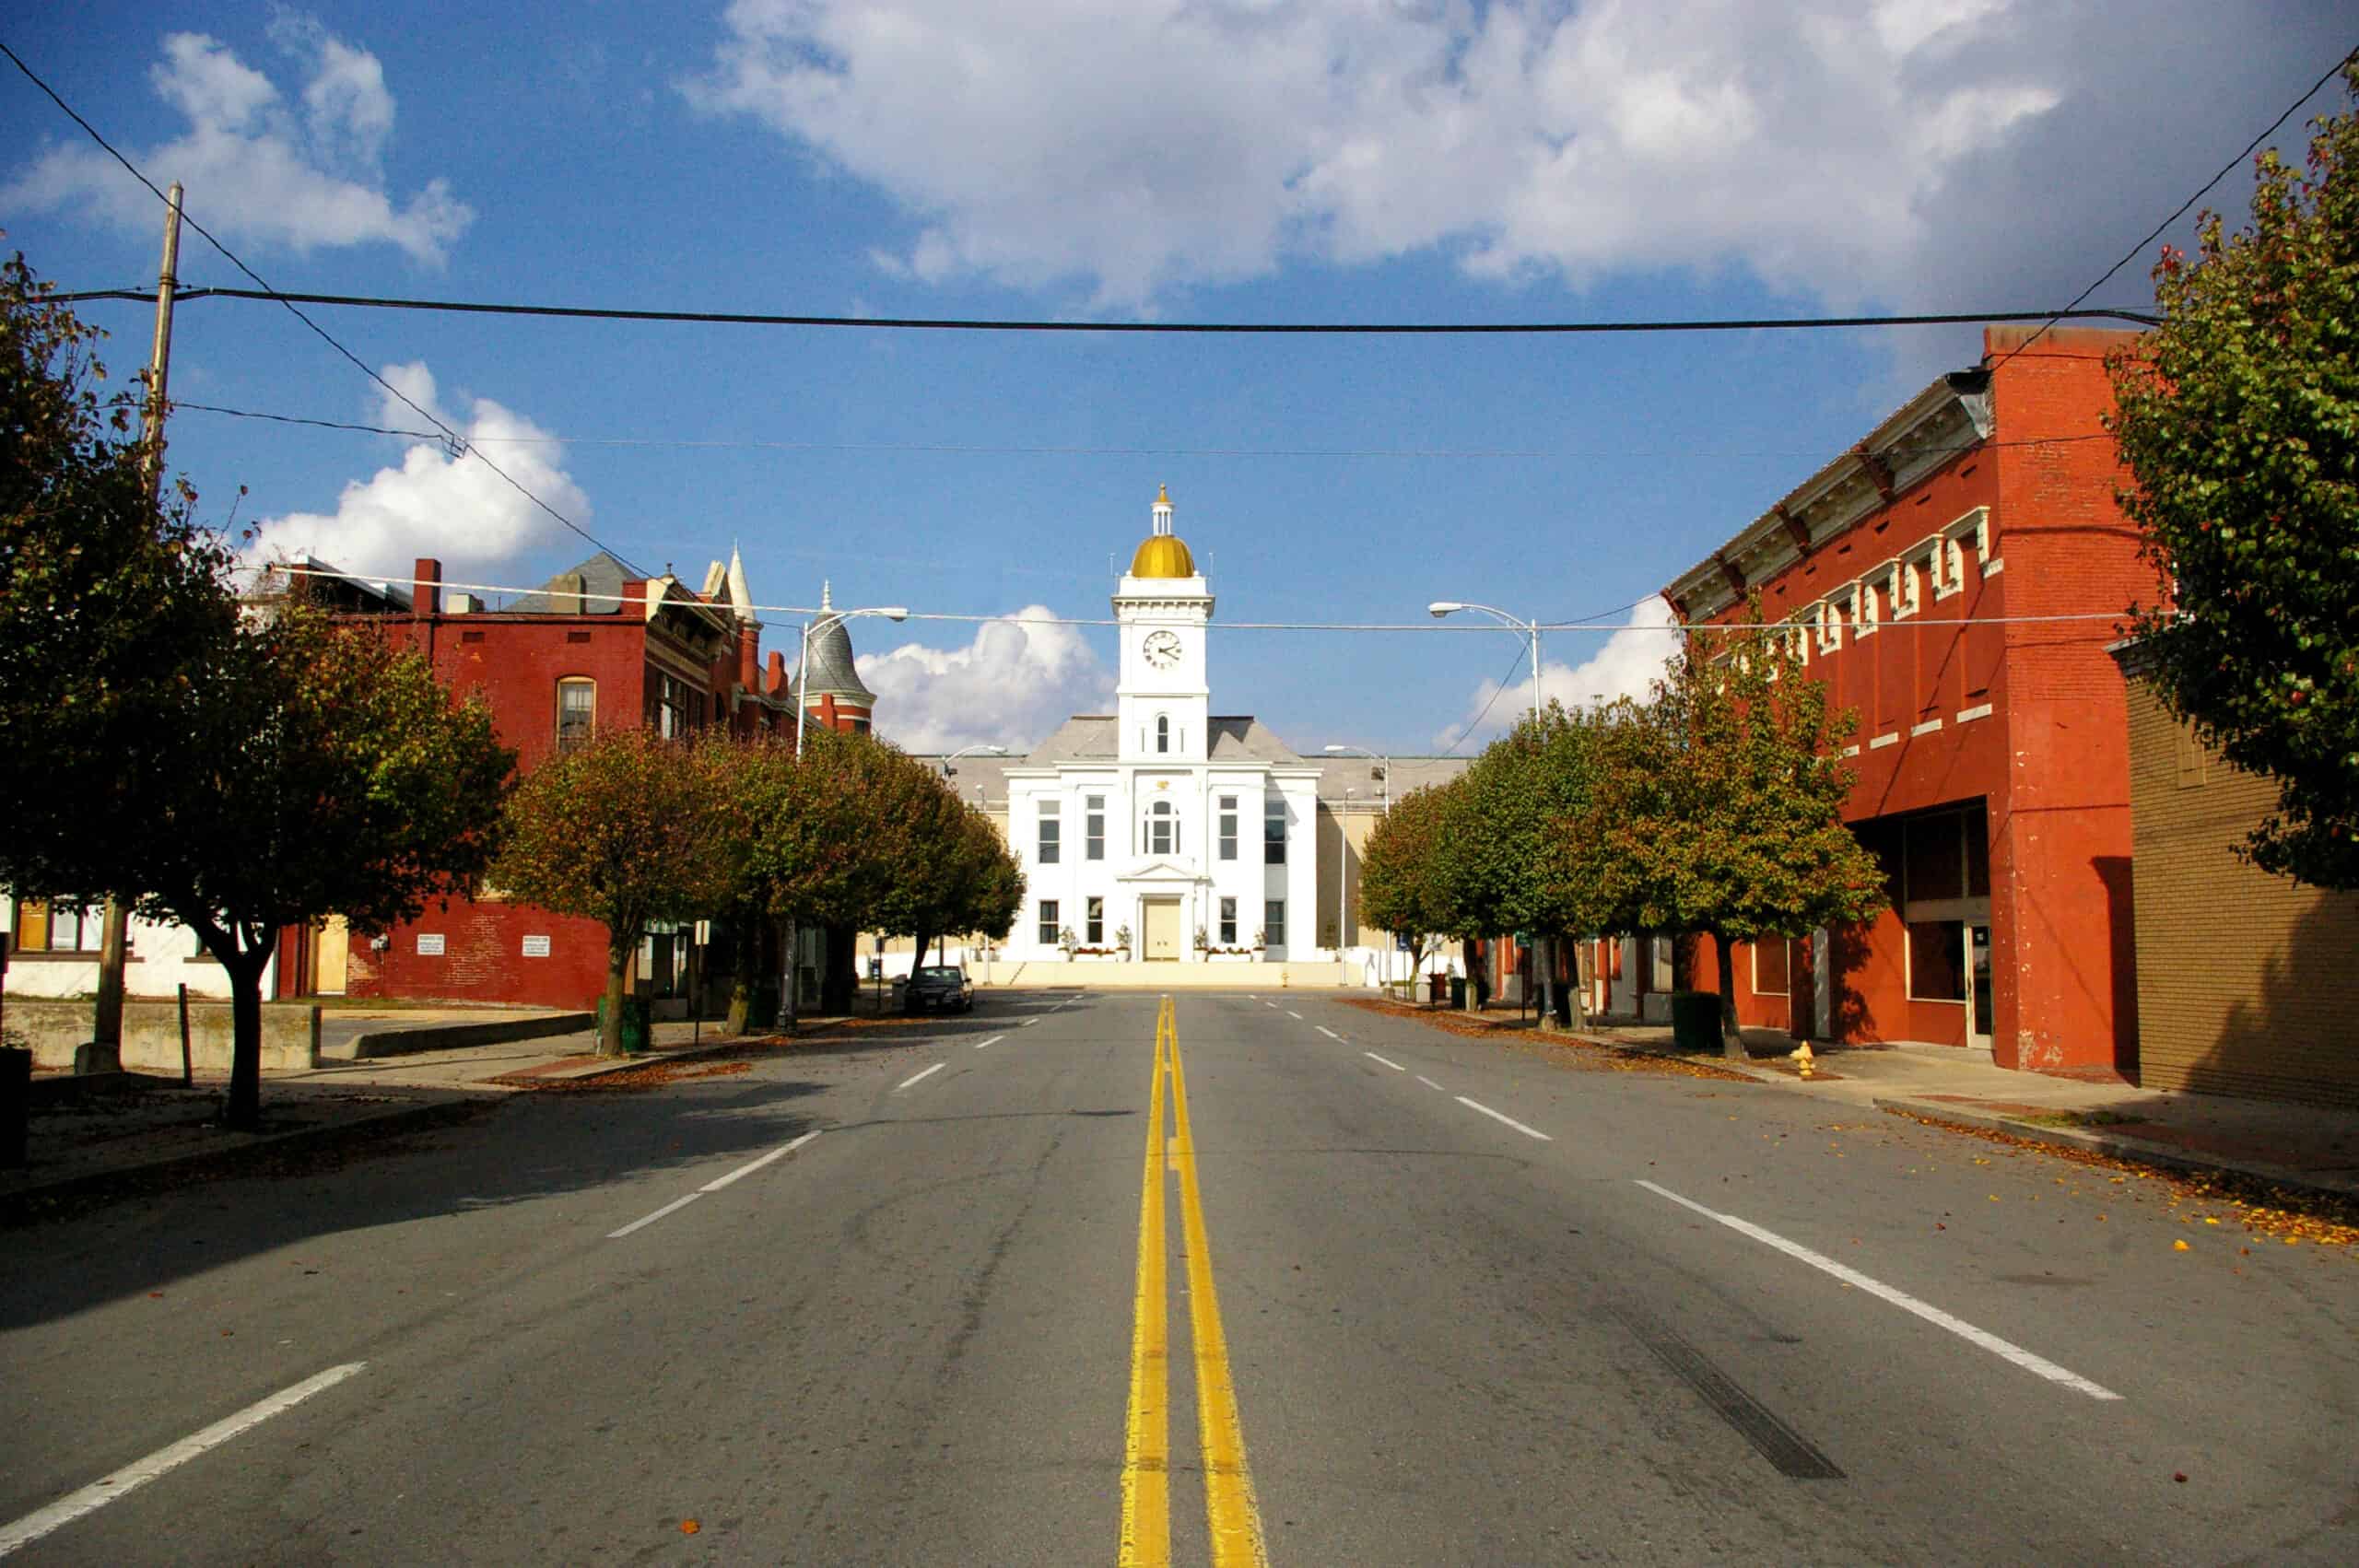
- Population decline, 2013-2023: -7,495 residents (-15.6% decline)
- Current population, 2023: 40,436 residents
- Past population, 2013: 47,931 residents
- Average home value: $60,851
- Median household income: $41,250
- Most concentrated economic sectors: Public administration, manufacturing, arts, entertainment, and recreation, health care and social assistance, retail trade
24. Miami Beach, FL

- Population decline, 2013-2023: -8,093 residents (-9.1% decline)
- Current population, 2023: 81,319 residents
- Past population, 2013: 89,412 residents
- Average home value: $471,666
- Median household income: $67,014
- Most concentrated economic sectors: Real estate and rental and leasing, accommodation and food services, information, administrative and support and waste management services, professional, scientific, and technical services
23. East St. Louis, IL

- Population decline, 2013-2023: -8,552 residents (-31.9% decline)
- Current population, 2023: 18,278 residents
- Past population, 2013: 26,830 residents
- Average home value: $75,007
- Median household income: $30,992
- Most concentrated economic sectors: Transportation and warehousing, administrative and support and waste management services, accommodation and food services, public administration, finance and insurance
22. Norfolk, VA

- Population decline, 2013-2023: -9,053 residents (-3.7% decline)
- Current population, 2023: 235,037 residents
- Past population, 2013: 244,090 residents
- Average home value: $156,679
- Median household income: $64,017
- Most concentrated economic sectors: Public administration, administrative and support and waste management services, accommodation and food services, real estate and rental and leasing, retail trade
21. Albany, GA
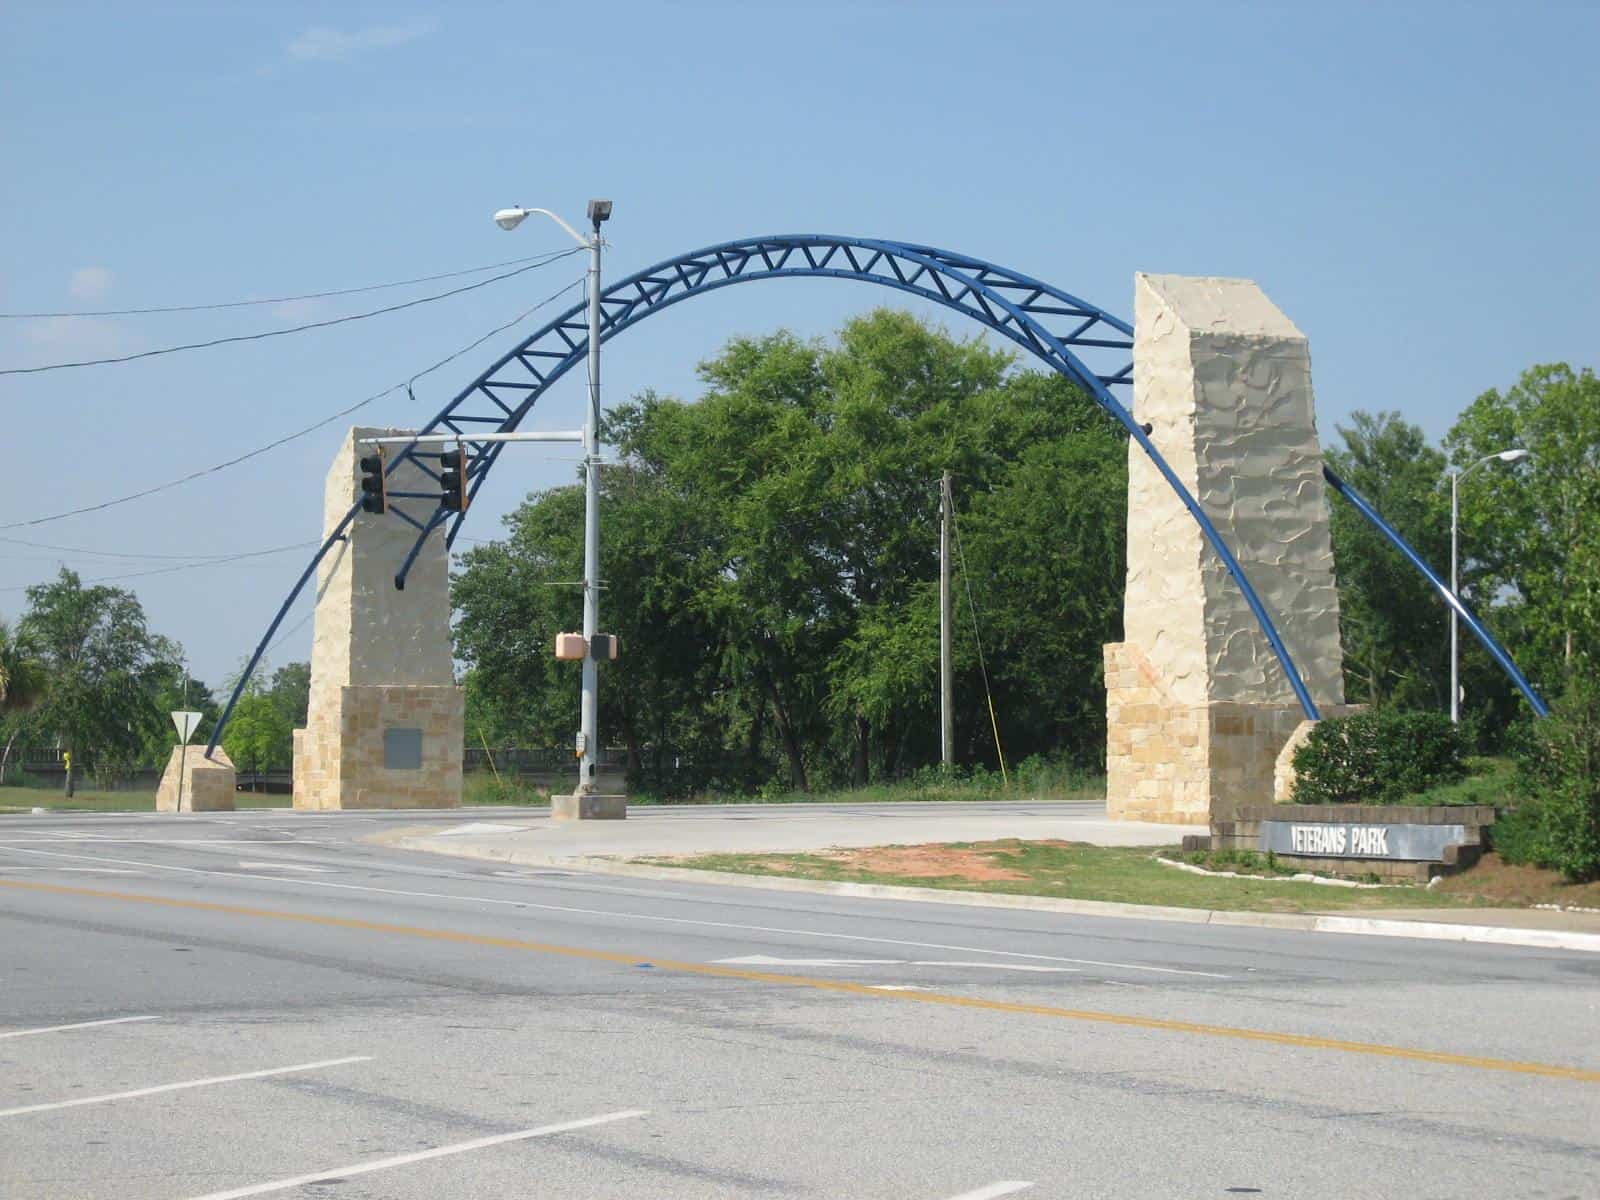
- Population decline, 2013-2023: -9,257 residents (-12.0% decline)
- Current population, 2023: 67,939 residents
- Past population, 2013: 77,196 residents
- Average home value: $56,144
- Median household income: $45,201
- Most concentrated economic sectors: Administrative and support and waste management services, transportation and warehousing, health care and social assistance, accommodation and food services, educational services
20. Akron, OH

- Population decline, 2013-2023: -9,512 residents (-4.8% decline)
- Current population, 2023: 189,526 residents
- Past population, 2013: 199,038 residents
- Average home value: $73,604
- Median household income: $48,544
- Most concentrated economic sectors: Manufacturing, accommodation and food services, health care and social assistance, other services, except public administration, retail trade
19. Mobile, AL

- Population decline, 2013-2023: -10,019 residents (-5.1% decline)
- Current population, 2023: 185,097 residents
- Past population, 2013: 195,116 residents
- Average home value: $116,664
- Median household income: $51,090
- Most concentrated economic sectors: Accommodation and food services, retail trade, health care and social assistance, administrative and support and waste management services, transportation and warehousing
18. Isla Vista, CA

- Population decline, 2013-2023: -10,940 residents (-44.4% decline)
- Current population, 2023: 13,717 residents
- Past population, 2013: 24,657 residents
- Average home value: $00
- Median household income: $24,428
- Most concentrated economic sectors: Accommodation and food services, educational services, information, arts, entertainment, and recreation, retail trade
17. Gary, IN

- Population decline, 2013-2023: -11,318 residents (-14.2% decline)
- Current population, 2023: 68,604 residents
- Past population, 2013: 79,922 residents
- Average home value: $56,763
- Median household income: $37,380
- Most concentrated economic sectors: Transportation and warehousing, arts, entertainment, and recreation, health care and social assistance, administrative and support and waste management services, accommodation and food services
16. Birmingham, AL

- Population decline, 2013-2023: -12,973 residents (-6.1% decline)
- Current population, 2023: 199,322 residents
- Past population, 2013: 212,295 residents
- Average home value: $94,039
- Median household income: $44,376
- Most concentrated economic sectors: Utilities, management of companies and enterprises, health care and social assistance, accommodation and food services, transportation and warehousing
15. East Los Angeles, CA
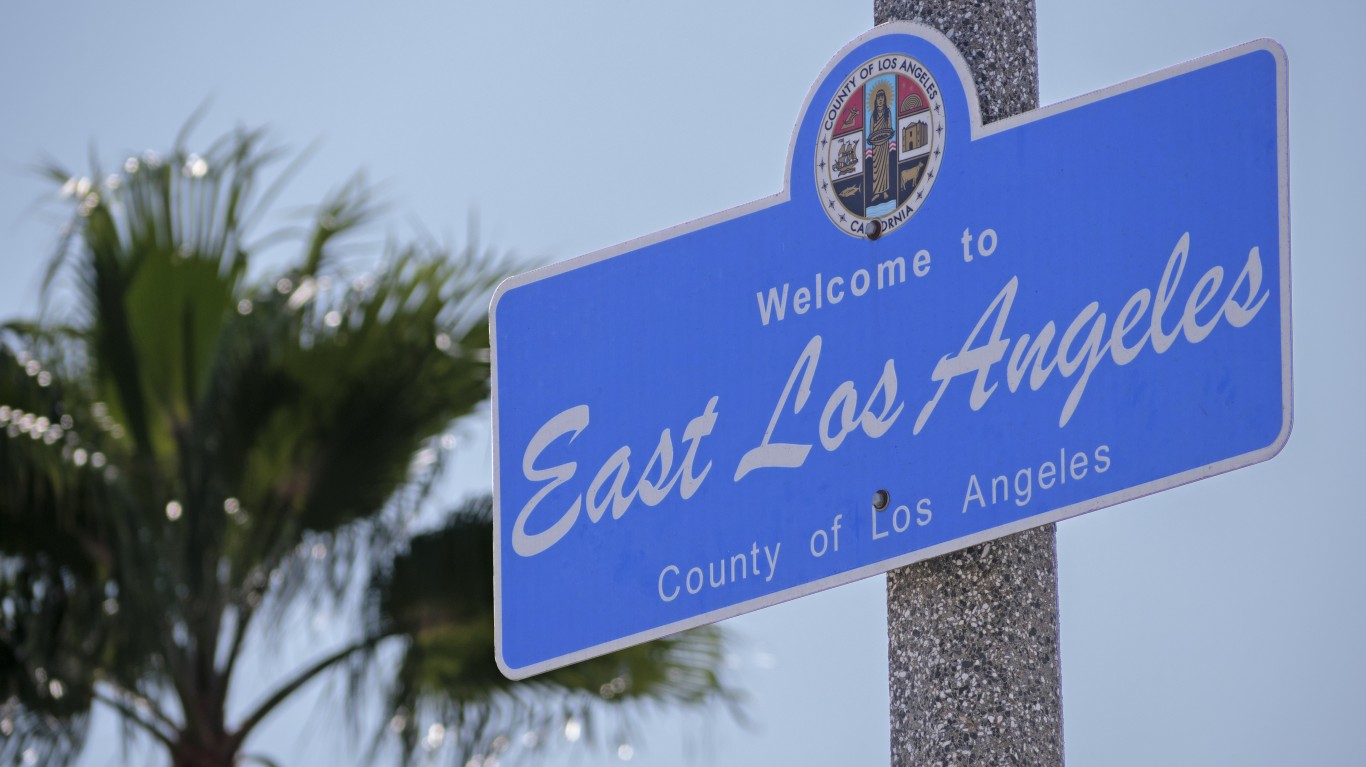
- Population decline, 2013-2023: -13,280 residents (-10.4% decline)
- Current population, 2023: 114,617 residents
- Past population, 2013: 127,897 residents
- Average home value: $207,672
- Median household income: $68,378
- Most concentrated economic sectors: Wholesale trade, transportation and warehousing, construction, administrative and support and waste management services, accommodation and food services
14. Toledo, OH

- Population decline, 2013-2023: -16,998 residents (-6.0% decline)
- Current population, 2023: 268,461 residents
- Past population, 2013: 285,459 residents
- Average home value: $68,030
- Median household income: $47,532
- Most concentrated economic sectors: Manufacturing, accommodation and food services, transportation and warehousing, wholesale trade, retail trade
13. Santa Ana, CA

- Population decline, 2013-2023: -17,080 residents (-5.2% decline)
- Current population, 2023: 311,639 residents
- Past population, 2013: 328,719 residents
- Average home value: $302,829
- Median household income: $88,354
- Most concentrated economic sectors: Administrative and support and waste management services, accommodation and food services, manufacturing, agriculture, forestry, fishing and hunting, construction
12. Shreveport, LA

- Population decline, 2013-2023: -17,232 residents (-8.6% decline)
- Current population, 2023: 183,483 residents
- Past population, 2013: 200,715 residents
- Average home value: $124,738
- Median household income: $48,465
- Most concentrated economic sectors: Mining, quarrying, and oil and gas extraction, health care and social assistance, arts, entertainment, and recreation, accommodation and food services, administrative and support and waste management services
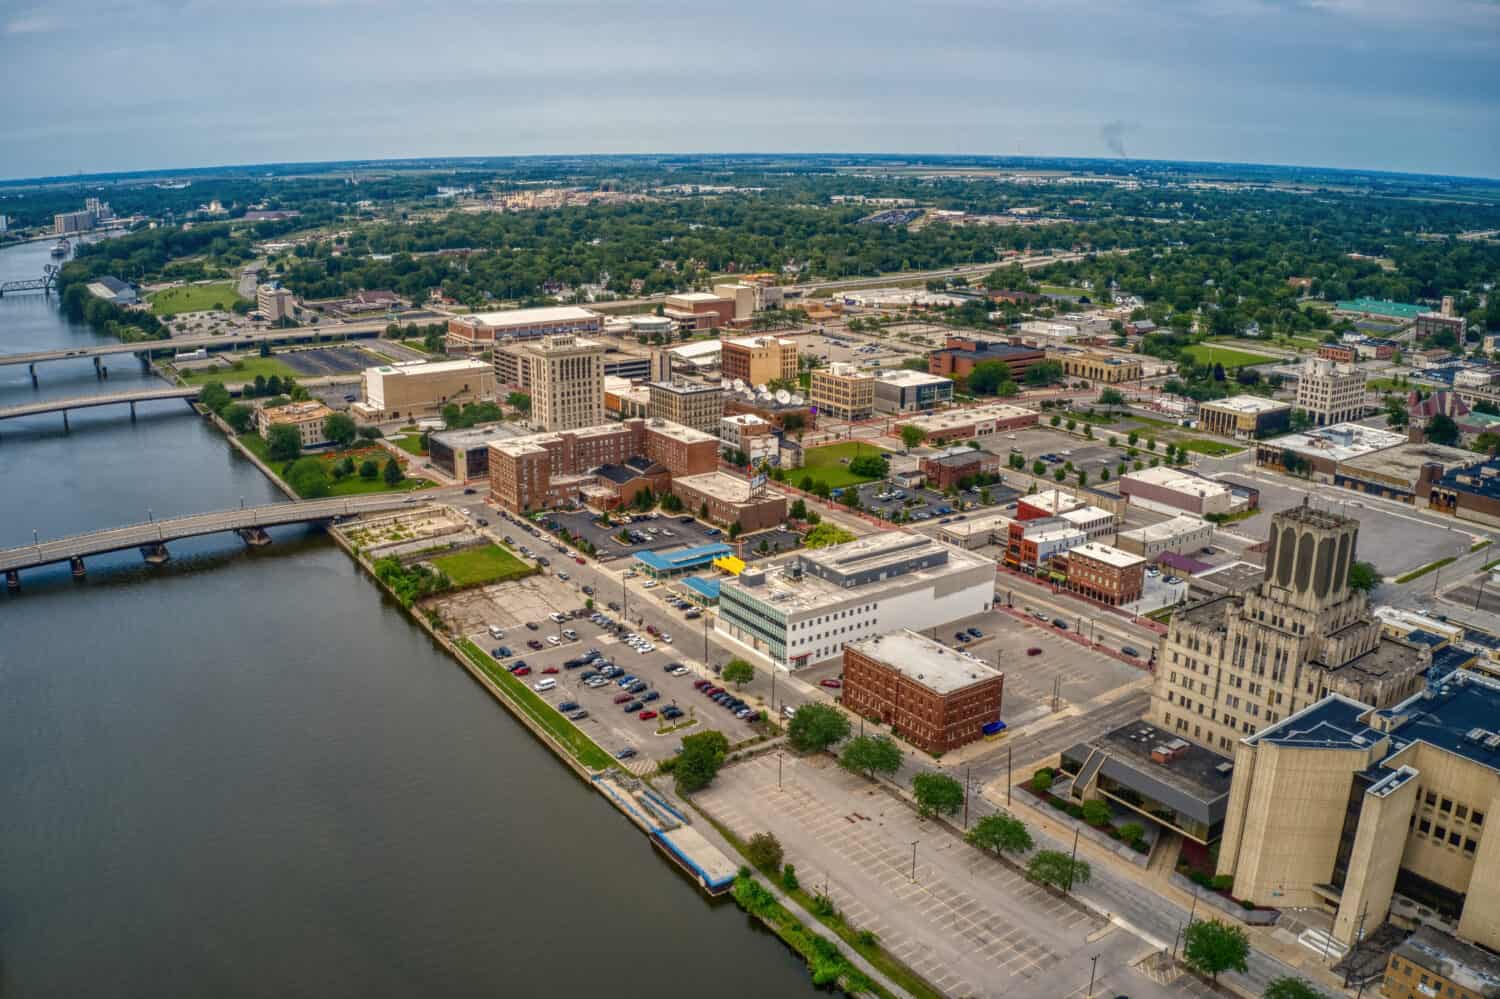
11. Aurora, IL

- Population decline, 2013-2023: -18,859 residents (-9.5% decline)
- Current population, 2023: 179,867 residents
- Past population, 2013: 198,726 residents
- Average home value: $193,726
- Median household income: $90,109
- Most concentrated economic sectors: Management of companies and enterprises, manufacturing, administrative and support and waste management services, wholesale trade, transportation and warehousing
10. Paradise, CA
- Population decline, 2013-2023: -19,426 residents (-74.1% decline)
- Current population, 2023: 6,793 residents
- Past population, 2013: 26,219 residents
- Average home value: $383,592
- Median household income: $67,042
- Most concentrated economic sectors: Utilities, real estate and rental and leasing, administrative and support and waste management services, information, agriculture, forestry, fishing and hunting
9. Flint, MI
- Population decline, 2013-2023: -20,814 residents (-20.5% decline)
- Current population, 2023: 80,835 residents
- Past population, 2013: 101,649 residents
- Average home value: $38,800
- Median household income: $36,194
- Most concentrated economic sectors: Manufacturing, accommodation and food services, retail trade, management of companies and enterprises, administrative and support and waste management services
8. Memphis, TN

- Population decline, 2013-2023: -21,869 residents (-3.4% decline)
- Current population, 2023: 629,063 residents
- Past population, 2013: 650,932 residents
- Average home value: $107,118
- Median household income: $51,211
- Most concentrated economic sectors: Transportation and warehousing, administrative and support and waste management services, management of companies and enterprises, accommodation and food services, wholesale trade
7. Jackson, MS

- Population decline, 2013-2023: -24,170 residents (-13.9% decline)
- Current population, 2023: 149,827 residents
- Past population, 2013: 173,997 residents
- Average home value: $83,646
- Median household income: $43,238
- Most concentrated economic sectors: Accommodation and food services, public administration, administrative and support and waste management services, other services, except public administration, health care and social assistance
6. St. Louis, MO

- Population decline, 2013-2023: -25,846 residents (-8.1% decline)
- Current population, 2023: 293,109 residents
- Past population, 2013: 318,955 residents
- Average home value: $108,378
- Median household income: $55,279
- Most concentrated economic sectors: Management of companies and enterprises, arts, entertainment, and recreation, health care and social assistance, educational services, finance and insurance
5. Milwaukee, WI

- Population decline, 2013-2023: -26,703 residents (-4.5% decline)
- Current population, 2023: 569,756 residents
- Past population, 2013: 596,459 residents
- Average home value: $84,476
- Median household income: $51,888
- Most concentrated economic sectors: Manufacturing, administrative and support and waste management services, management of companies and enterprises, health care and social assistance, accommodation and food services
4. Cleveland, OH
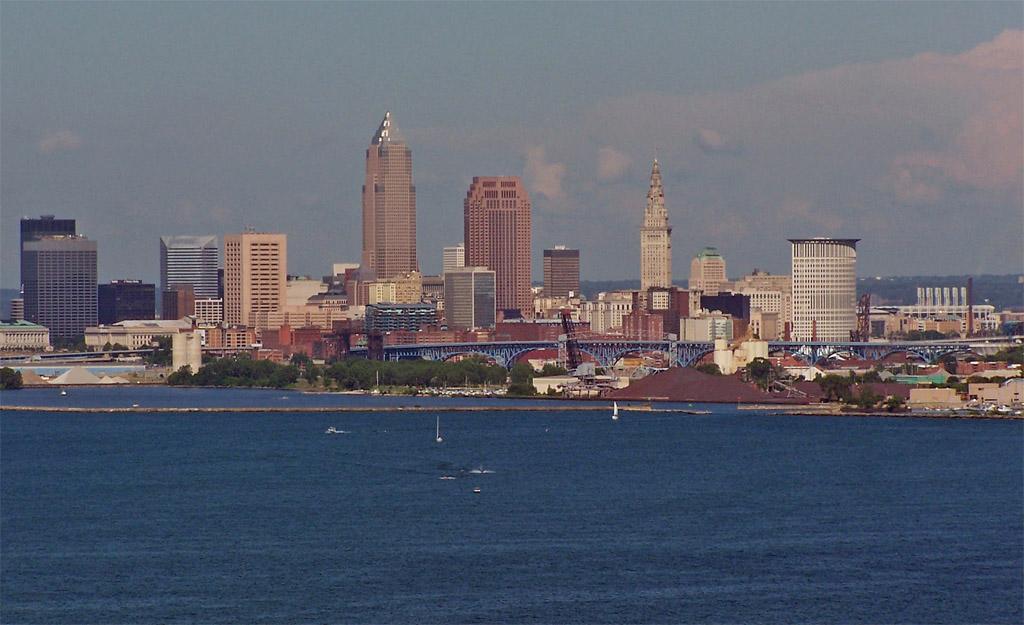
- Population decline, 2013-2023: -26,812 residents (-6.8% decline)
- Current population, 2023: 367,523 residents
- Past population, 2013: 394,335 residents
- Average home value: $55,705
- Median household income: $39,187
- Most concentrated economic sectors: Administrative and support and waste management services, health care and social assistance, accommodation and food services, manufacturing, arts, entertainment, and recreation
3. Paradise, NV

- Population decline, 2013-2023: -35,460 residents (-16.0% decline)
- Current population, 2023: 186,178 residents
- Past population, 2013: 221,638 residents
- Average home value: $160,457
- Median household income: $58,874
- Most concentrated economic sectors: Arts, entertainment, and recreation, accommodation and food services, administrative and support and waste management services, transportation and warehousing, real estate and rental and leasing
2. Baltimore, MD

- Population decline, 2013-2023: -44,252 residents (-7.1% decline)
- Current population, 2023: 577,193 residents
- Past population, 2013: 621,445 residents
- Average home value: $129,871
- Median household income: $59,623
- Most concentrated economic sectors: Public administration, educational services, health care and social assistance, real estate and rental and leasing, transportation and warehousing
1. Detroit, MI

- Population decline, 2013-2023: -70,019 residents (-9.9% decline)
- Current population, 2023: 636,644 residents
- Past population, 2013: 706,663 residents
- Average home value: $59,897
- Median household income: $39,575
- Most concentrated economic sectors: Administrative and support and waste management services, manufacturing, transportation and warehousing, accommodation and food services, health care and social assistance
The post The U.S. Cities People Are Leaving In Droves appeared first on 24/7 Wall St..