


Take a Guess: Have Americans Bought More or Less Than 150 Million Guns Since 1986?
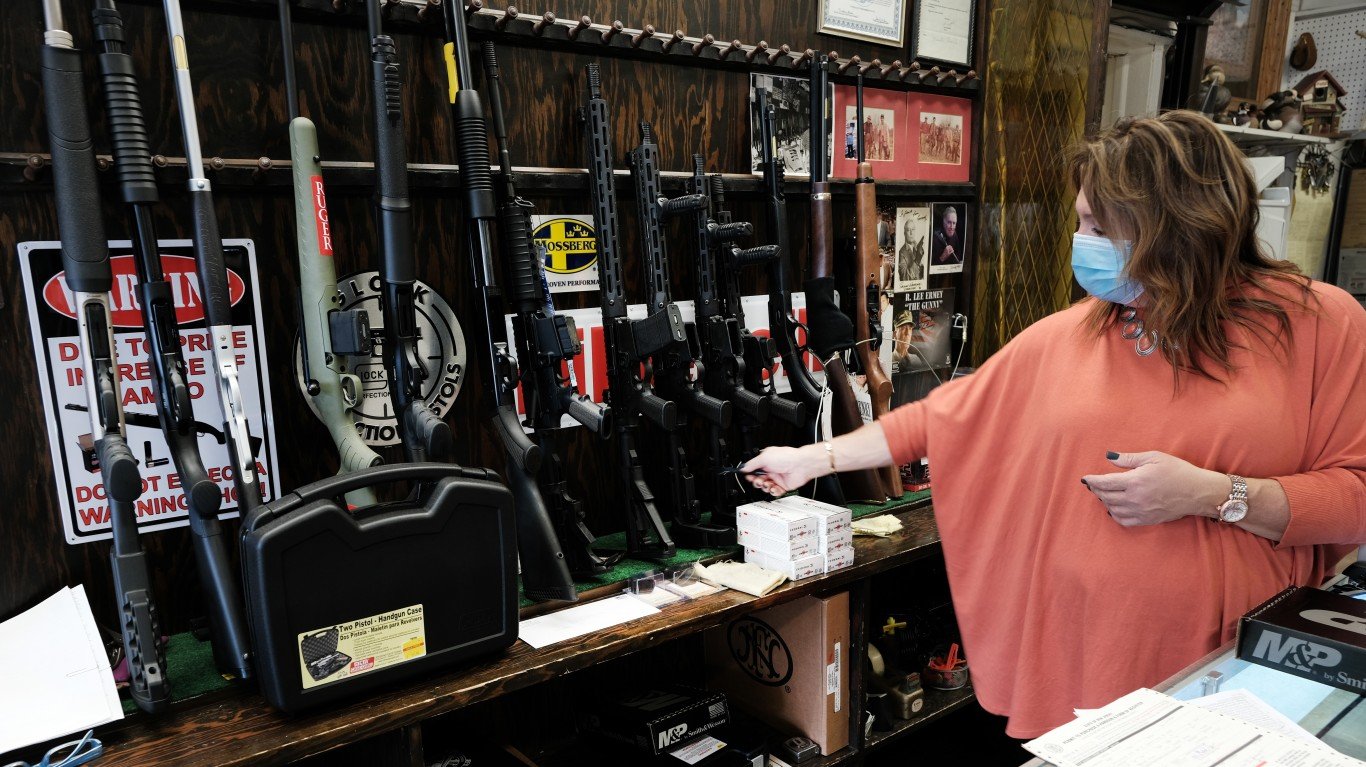
When you think of gun owners in America, you probably have a certain idea come to mind. But the reality is that many Americans, including some you wouldn’t have guessed, are gun owners. 40% of Americans reported that they currently live in a home with a gun — but given the national instability and rising […] The post Take a Guess: Have Americans Bought More or Less Than 150 Million Guns Since 1986? appeared first on 24/7 Wall St..

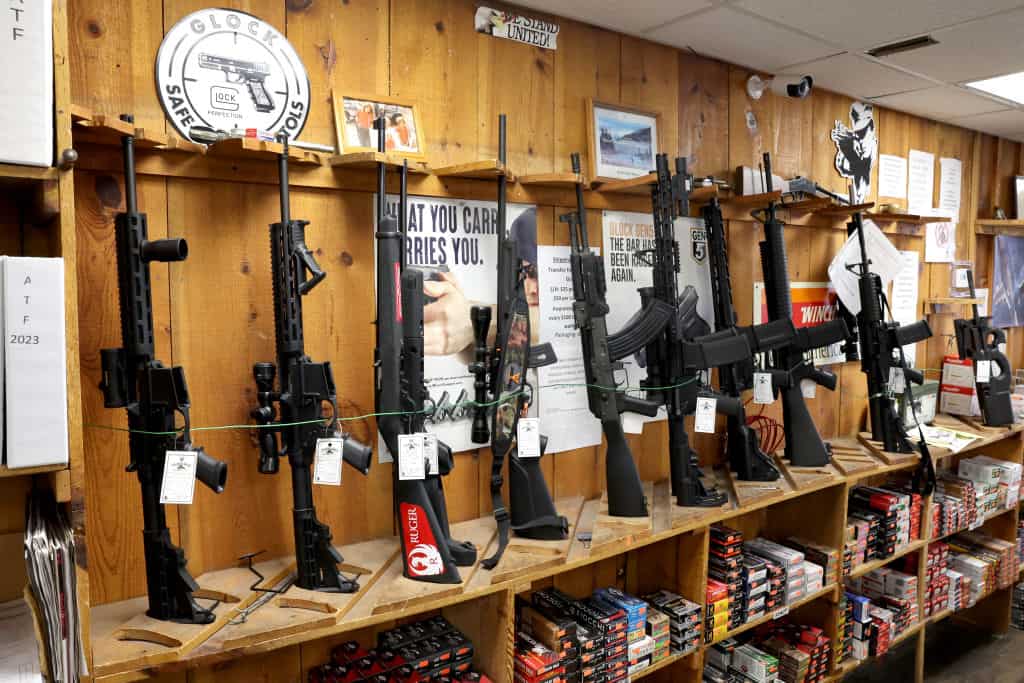
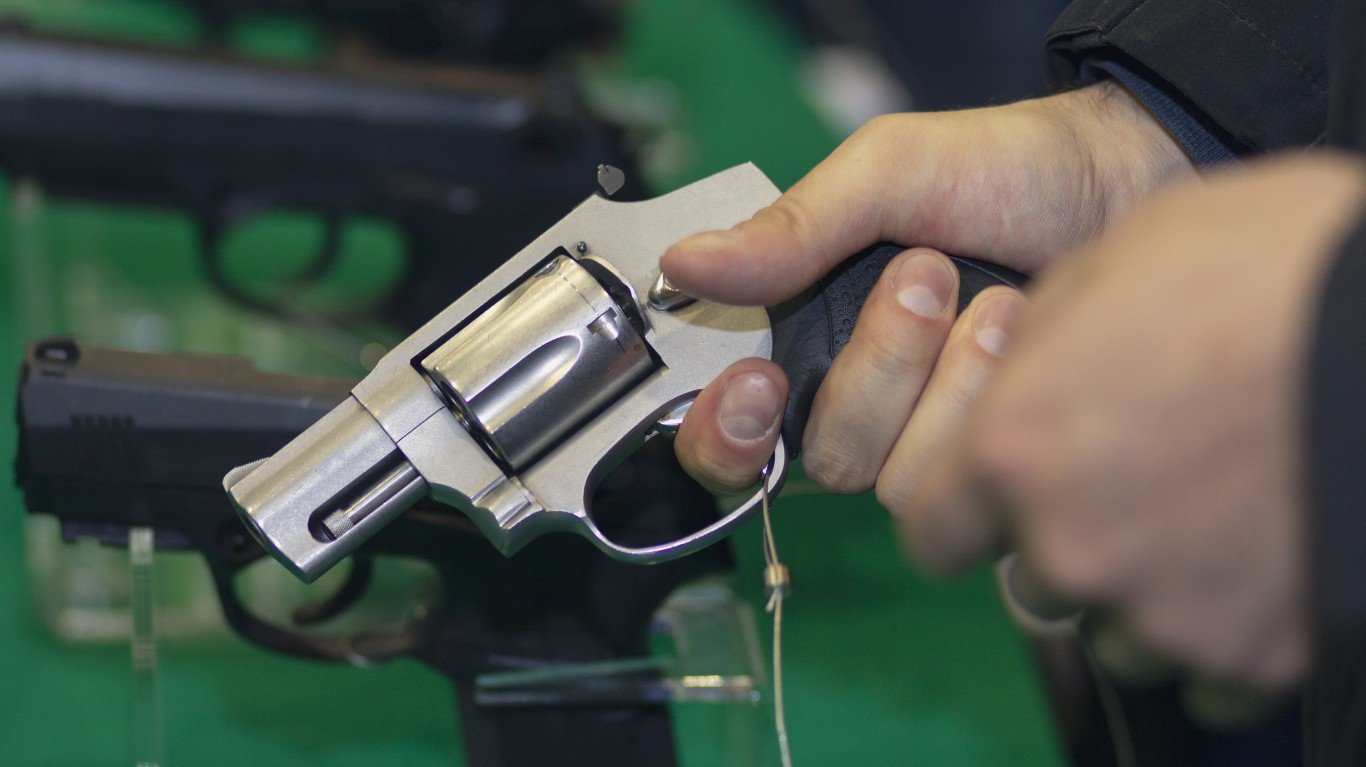
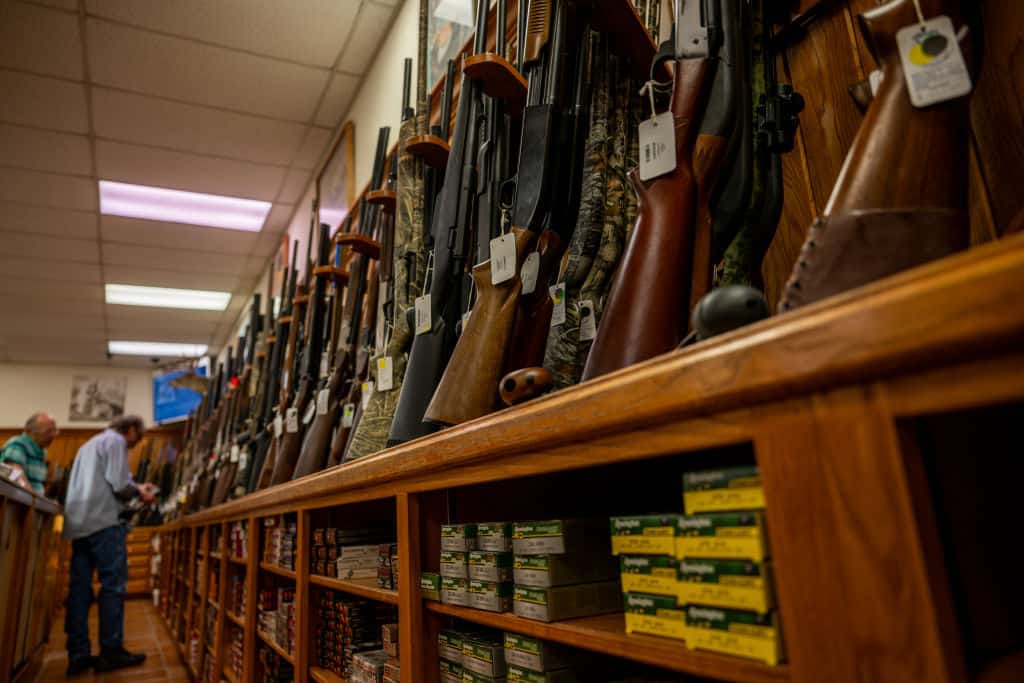
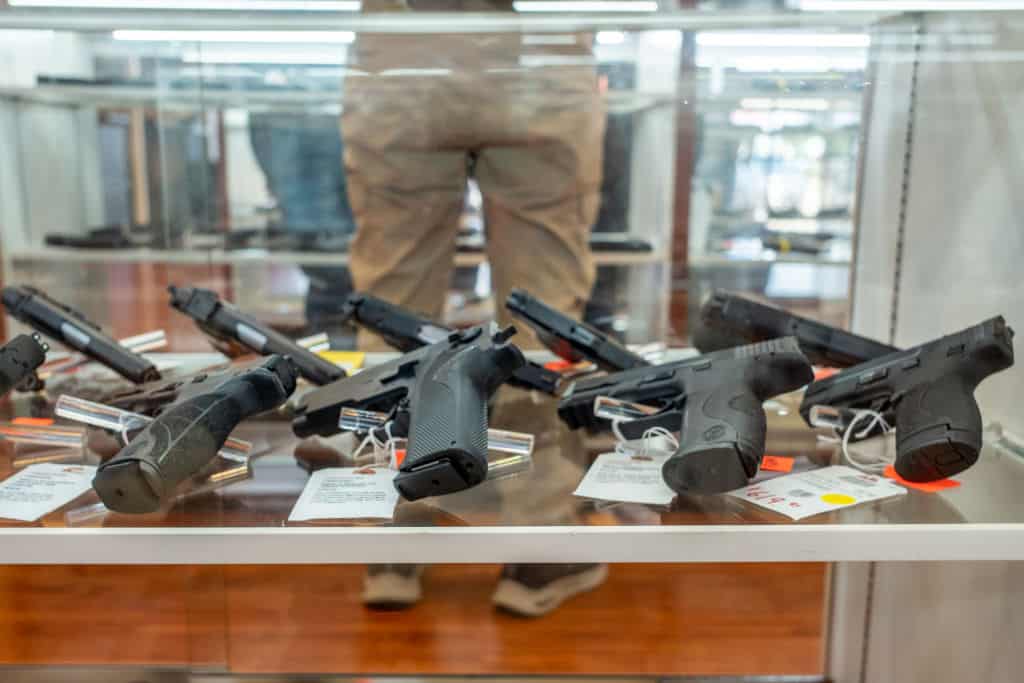
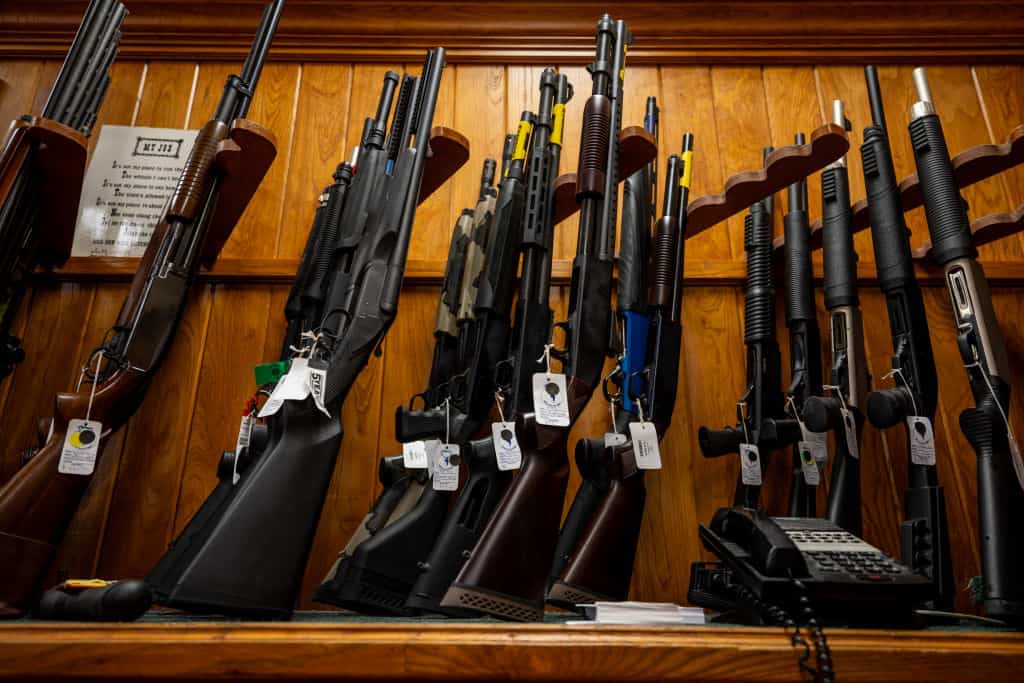
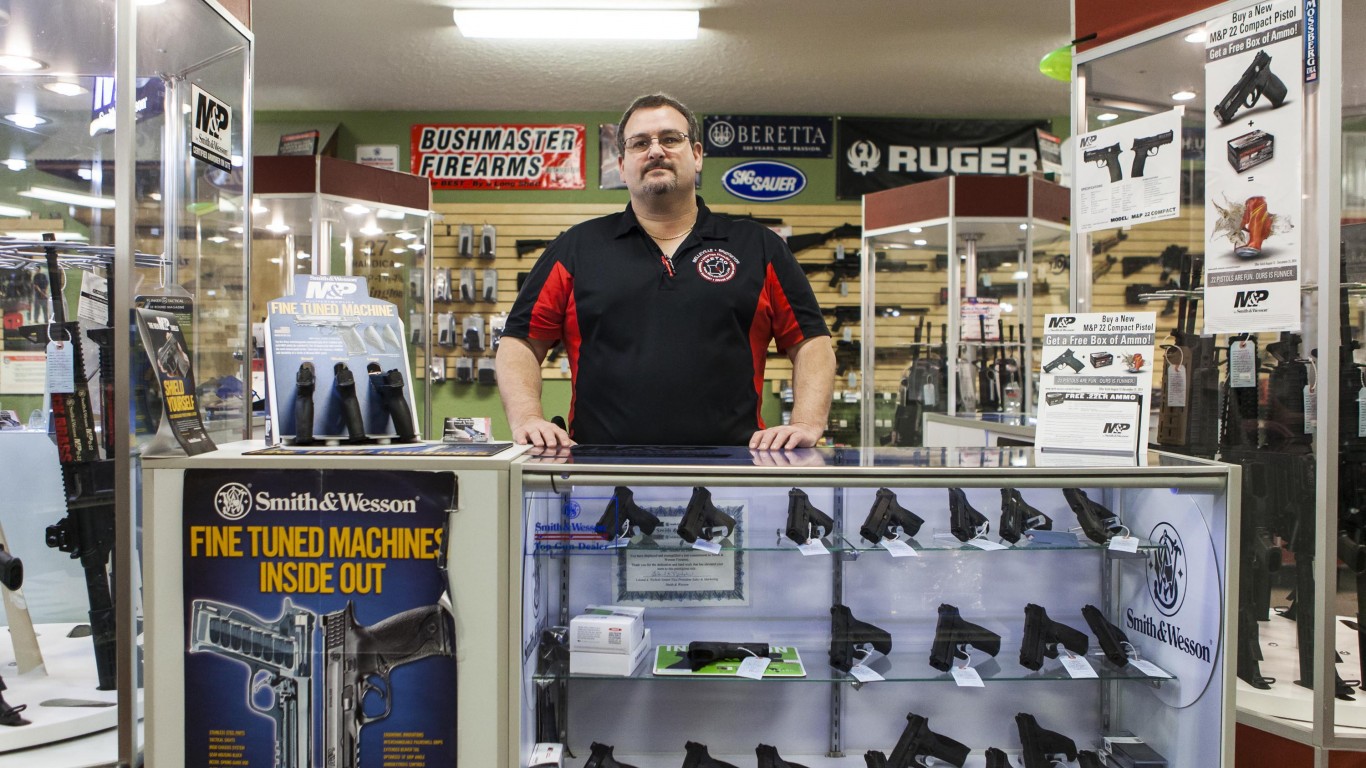
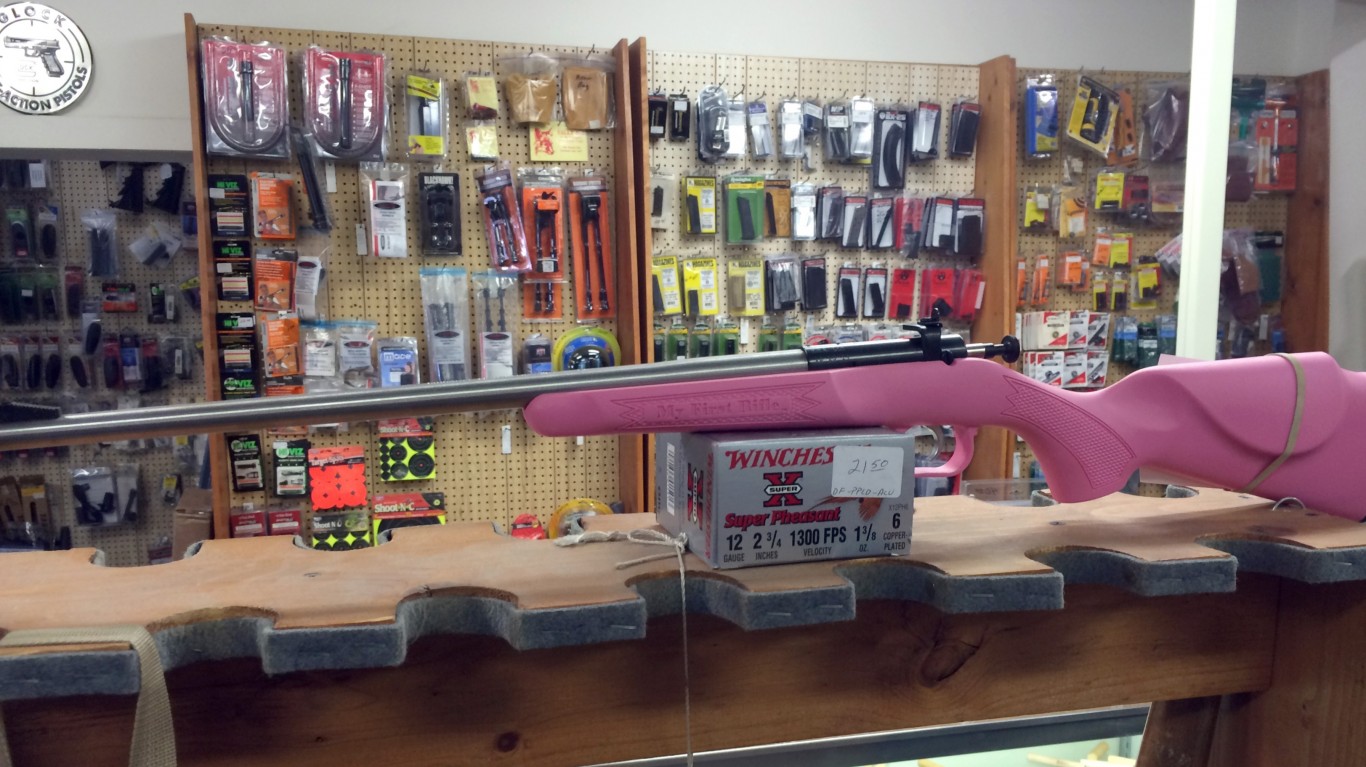
When you think of gun owners in America, you probably have a certain idea come to mind. But the reality is that many Americans, including some you wouldn’t have guessed, are gun owners. 40% of Americans reported that they currently live in a home with a gun — but given the national instability and rising worries about personal protection, that number is expected to potentially rise in 2025. Of these gun-owning households, 45% of Republicans state that they own a gun, as do 20% of Democrats. There’s also a gendered split, with 40% of men saying that they own a gun and 25% of women reporting that they do too. Gun owners more heavily live in rural areas, but that doesn’t skew true all across the country. Gun ownership levels have also been rising in historically marginalized groups, such as people of color. While it’s interesting to question what the reasons for these changes are, the fact of the matter is that guns are deeply ingrained in American culture and our love of guns is probably not going to change any time soon. (Two-thirds of this state’s residents are gun owners.)
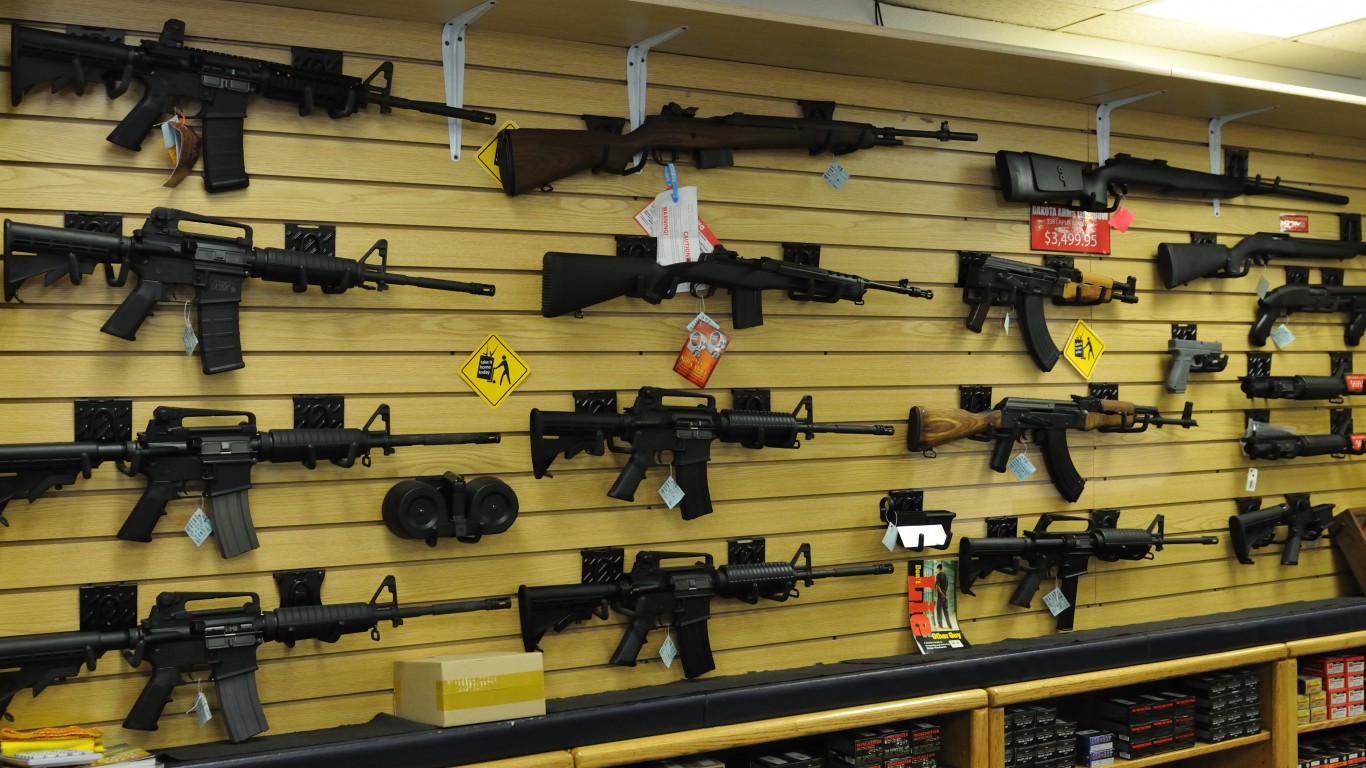
In fact, when you look at gun ownership through our nation’s history, Americans are buying many more guns than they used to. Here, 24/7 Wall St. calculated the number of guns Americans have bought in each of the last 35 years using historical firearm production, import, and export data from the ATF. At this time, this is the most up-to-date information we can find. For every year between 1986 and 2020, we tallied the number of firearms manufactured in, and imported to, the U.S., and subtracted the number of firearms that were exported to foreign markets. Import data was not yet available for 2021 or 2022 at the time of this writing, and as a result, numbers for these years only reflect estimated domestic sales of American-made firearms.
Why It Matters

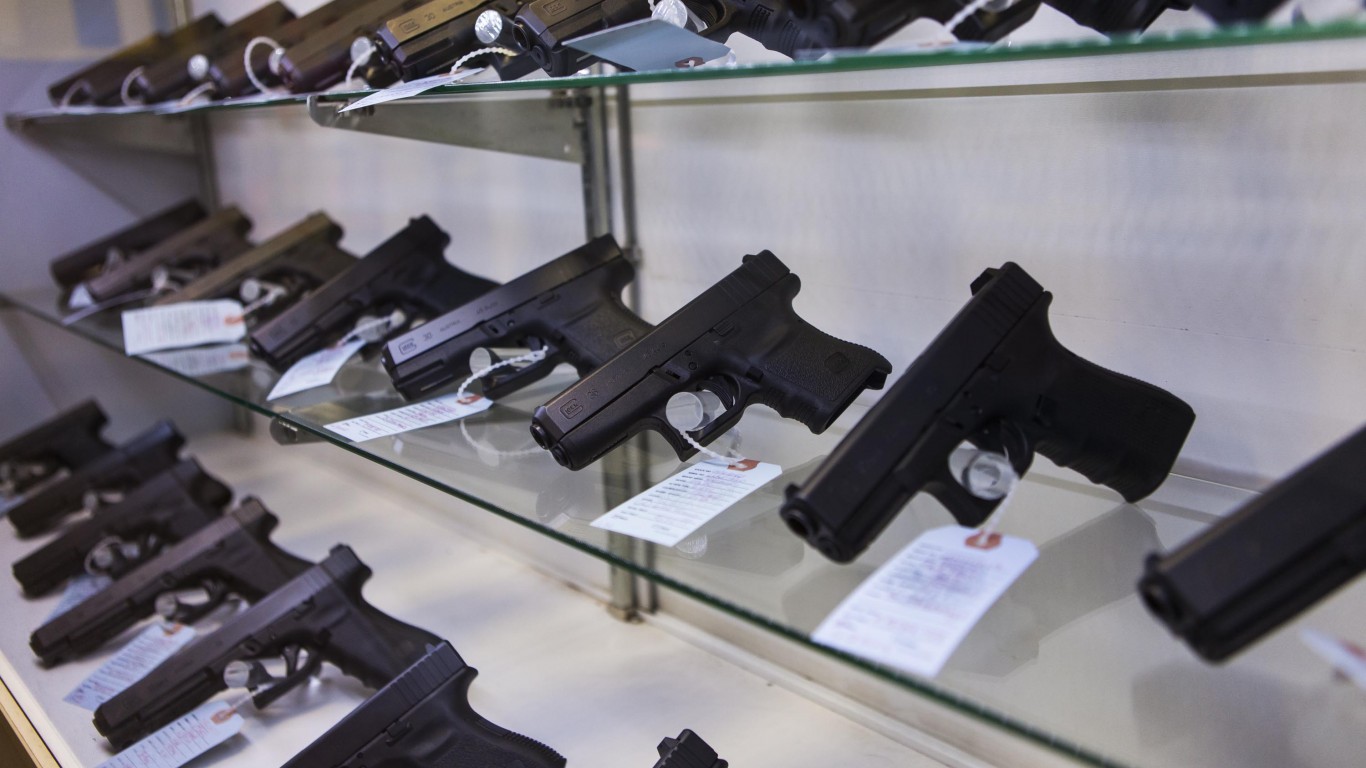
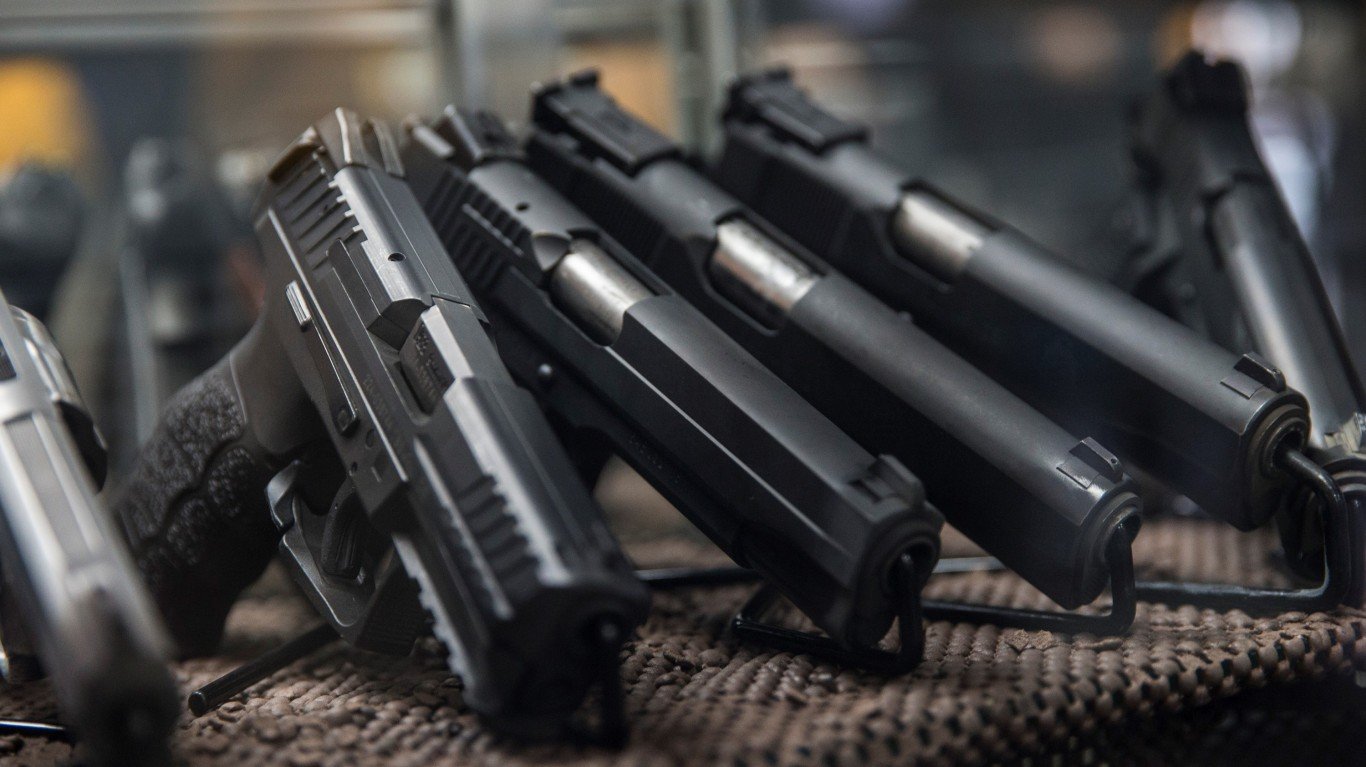
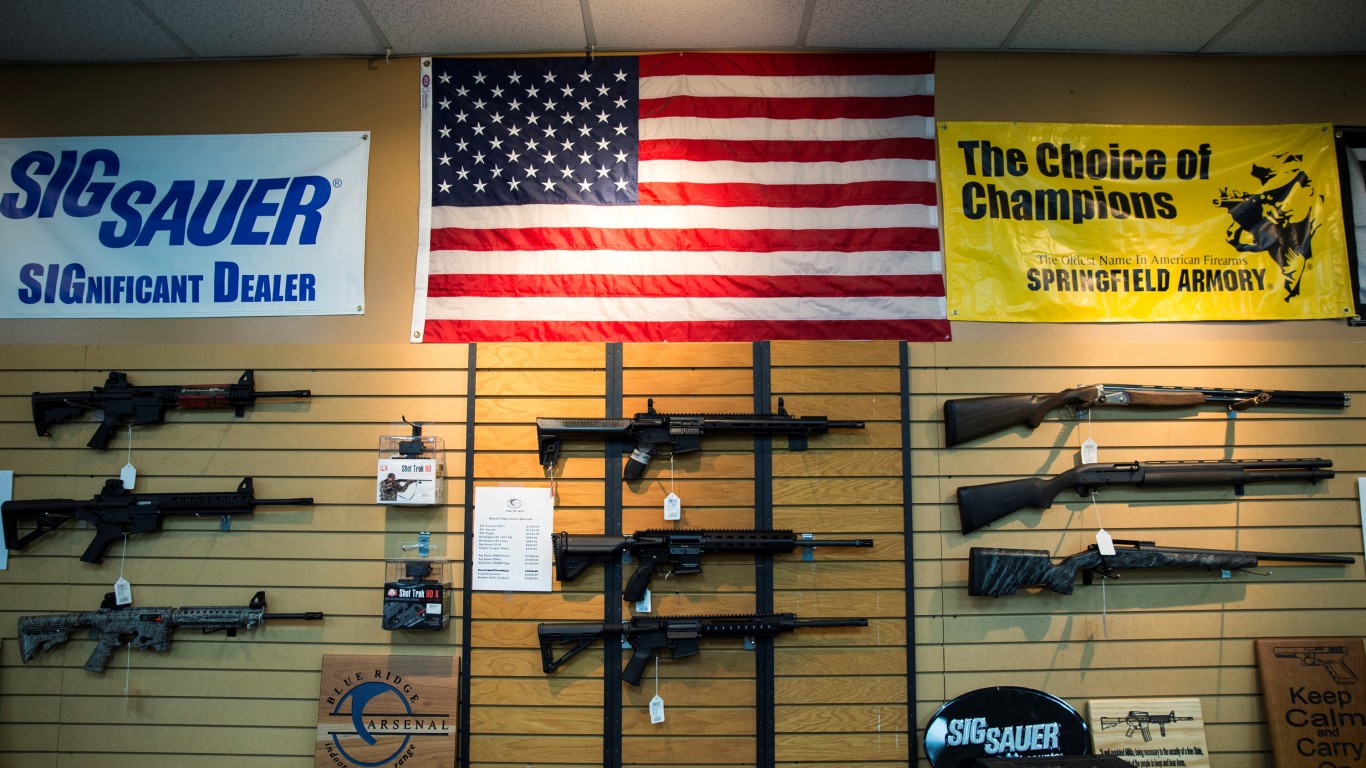
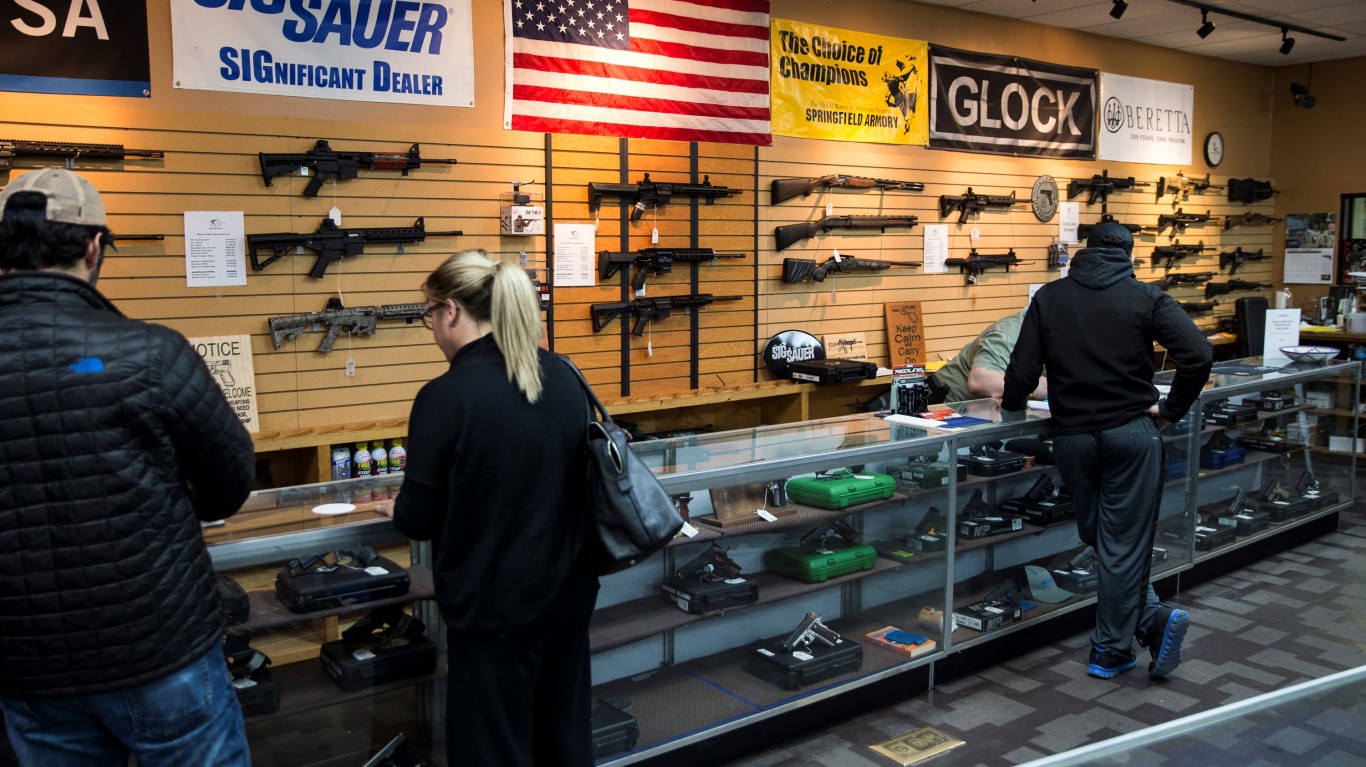
When you look at global gun sales, the United States is the largest consumer firearm market by a wide margin. To meet demand — which has hit unprecedented highs in recent years — many of the world’s largest gunmakers have manufacturing operations in the United States. Of the 287.9 million firearms estimated to have been sold in the U.S. since 1986, more than two-thirds were manufactured domestically — and over half were sold in 2010 or later. Rising demand has likely been driven in part by changes in consumer preferences and an increasingly pro-gun regulatory environment.
Take a look at American gun sales from 1986 to 2022:
1986: 3,524,486 firearms

- Est. U.S. firearm sales in 1986: 3,524,486 — the fewest in last 35 years (80.1% U.S. made; 19.9% imported)
- Est. U.S. handgun sales in 1986: 1,534,305 — the fewest in last 35 years (84.9% U.S. made; 15.1% imported)
- Est. U.S. rifle sales in 1986: 1,202,283 — 34th most in last 35 years (77.6% U.S. made; 22.4% imported)
- Est. U.S. shotgun sales in 1986: 783,539 — the fewest in last 35 years (74.3% U.S. made; 25.7% imported)
1987: 4,335,131 firearms

- Est. U.S. firearm sales in 1987: 4,335,131 — 31st most in last 35 years (75.5% U.S. made; 24.5% imported)
- Est. U.S. handgun sales in 1987: 1,869,634 — 25th most in last 35 years (81.7% U.S. made; 18.3% imported)
- Est. U.S. rifle sales in 1987: 1,379,280 — 31st most in last 35 years (70.0% U.S. made; 30.0% imported)
- Est. U.S. shotgun sales in 1987: 1,089,232 — 27th most in last 35 years (71.8% U.S. made; 28.2% imported)
1988: 4,982,963 firearms
- Est. U.S. firearm sales in 1988: 4,982,963 — 22nd most in last 35 years (74.4% U.S. made; 25.6% imported)
- Est. U.S. handgun sales in 1988: 2,345,516 — 20th most in last 35 years (73.5% U.S. made; 26.5% imported)
- Est. U.S. rifle sales in 1988: 1,373,451 — 32nd most in last 35 years (79.4% U.S. made; 20.6% imported)
- Est. U.S. shotgun sales in 1988: 1,231,379 — 14th most in last 35 years (69.8% U.S. made; 30.2% imported)
1989: 5,164,892 firearms

- Est. U.S. firearm sales in 1989: 5,164,892 — 19th most in last 35 years (80.5% U.S. made; 19.5% imported)
- Est. U.S. handgun sales in 1989: 2,354,994 — 19th most in last 35 years (81.3% U.S. made; 18.7% imported)
- Est. U.S. rifle sales in 1989: 1,627,305 — 26th most in last 35 years (82.0% U.S. made; 18.0% imported)
- Est. U.S. shotgun sales in 1989: 1,142,479 — 24th most in last 35 years (76.0% U.S. made; 24.0% imported)
1990: 4,442,152 firearms
- Est. U.S. firearm sales in 1990: 4,442,152 — 29th most in last 35 years (81.0% U.S. made; 19.0% imported)
- Est. U.S. handgun sales in 1990: 2,110,221 — 22nd most in last 35 years (78.7% U.S. made; 21.3% imported)
- Est. U.S. rifle sales in 1990: 1,343,335 — 33rd most in last 35 years (84.9% U.S. made; 15.1% imported)
- Est. U.S. shotgun sales in 1990: 936,485 — 32nd most in last 35 years (79.5% U.S. made; 20.5% imported)
1991: 3,882,598 firearms
- Est. U.S. firearm sales in 1991: 3,882,598 — 34th most in last 35 years (81.4% U.S. made; 18.6% imported)
- Est. U.S. handgun sales in 1991: 1,939,116 — 23rd most in last 35 years (84.9% U.S. made; 15.1% imported)
- Est. U.S. rifle sales in 1991: 1,103,700 — the fewest in last 35 years (71.8% U.S. made; 28.2% imported)
- Est. U.S. shotgun sales in 1991: 826,766 — 34th most in last 35 years (86.0% U.S. made; 14.0% imported)
1992: 6,618,755 firearms
- Est. U.S. firearm sales in 1992: 6,618,755 — 16th most in last 35 years (57.0% U.S. made; 43.0% imported)
- Est. U.S. handgun sales in 1992: 2,930,536 — 16th most in last 35 years (66.5% U.S. made; 33.5% imported)
- Est. U.S. rifle sales in 1992: 2,335,007 — 13th most in last 35 years (39.0% U.S. made; 61.0% imported)
- Est. U.S. shotgun sales in 1992: 1,341,010 — 9th most in last 35 years (67.0% U.S. made; 33.0% imported)
1993: 7,667,754 firearms

- Est. U.S. firearm sales in 1993: 7,667,754 — 13th most in last 35 years (60.3% U.S. made; 39.7% imported)
- Est. U.S. handgun sales in 1993: 3,709,645 — 13th most in last 35 years (67.5% U.S. made; 32.5% imported)
- Est. U.S. rifle sales in 1993: 2,671,944 — 11th most in last 35 years (40.4% U.S. made; 59.6% imported)
- Est. U.S. shotgun sales in 1993: 1,219,579 — 17th most in last 35 years (79.8% U.S. made; 20.2% imported)
1994: 6,649,646 firearms

- Est. U.S. firearm sales in 1994: 6,649,646 — 15th most in last 35 years (71.7% U.S. made; 28.3% imported)
- Est. U.S. handgun sales in 1994: 3,333,022 — 15th most in last 35 years (72.5% U.S. made; 27.5% imported)
- Est. U.S. rifle sales in 1994: 2,082,640 — 17th most in last 35 years (59.3% U.S. made; 40.7% imported)
- Est. U.S. shotgun sales in 1994: 1,226,268 — 15th most in last 35 years (90.4% U.S. made; 9.6% imported)
1995: 4,995,525 firearms
- Est. U.S. firearm sales in 1995: 4,995,525 — 21st most in last 35 years (77.9% U.S. made; 22.1% imported)
- Est. U.S. handgun sales in 1995: 2,199,438 — 21st most in last 35 years (67.9% U.S. made; 32.1% imported)
- Est. U.S. rifle sales in 1995: 1,581,471 — 28th most in last 35 years (83.5% U.S. made; 16.5% imported)
- Est. U.S. shotgun sales in 1995: 1,208,470 — 20th most in last 35 years (88.7% U.S. made; 11.3% imported)
1996: 4,404,020 firearms
- Est. U.S. firearm sales in 1996: 4,404,020 — 30th most in last 35 years (80.0% U.S. made; 20.0% imported)
- Est. U.S. handgun sales in 1996: 1,822,832 — 26th most in last 35 years (73.1% U.S. made; 26.9% imported)
- Est. U.S. rifle sales in 1996: 1,612,326 — 27th most in last 35 years (83.7% U.S. made; 16.3% imported)
- Est. U.S. shotgun sales in 1996: 956,997 — 31st most in last 35 years (86.6% U.S. made; 13.4% imported)
1997: 4,257,838 firearms
- Est. U.S. firearm sales in 1997: 4,257,838 — 32nd most in last 35 years (77.9% U.S. made; 22.1% imported)
- Est. U.S. handgun sales in 1997: 1,772,849 — 29th most in last 35 years (73.3% U.S. made; 26.7% imported)
- Est. U.S. rifle sales in 1997: 1,533,652 — 29th most in last 35 years (76.6% U.S. made; 23.4% imported)
- Est. U.S. shotgun sales in 1997: 936,011 — 33rd most in last 35 years (88.6% U.S. made; 11.4% imported)
1998: 4,510,056 firearms

- Est. U.S. firearm sales in 1998: 4,510,056 — 28th most in last 35 years (77.8% U.S. made; 22.2% imported)
- Est. U.S. handgun sales in 1998: 1,771,111 — 30th most in last 35 years (70.0% U.S. made; 30.0% imported)
- Est. U.S. rifle sales in 1998: 1,718,625 — 24th most in last 35 years (85.5% U.S. made; 14.5% imported)
- Est. U.S. shotgun sales in 1998: 998,327 — 30th most in last 35 years (78.0% U.S. made; 22.0% imported)
1999: 4,719,228 firearms

- Est. U.S. firearm sales in 1999: 4,719,228 — 25th most in last 35 years (81.1% U.S. made; 18.9% imported)
- Est. U.S. handgun sales in 1999: 1,556,003 — 34th most in last 35 years (80.2% U.S. made; 19.8% imported)
- Est. U.S. rifle sales in 1999: 1,702,207 — 25th most in last 35 years (88.4% U.S. made; 11.6% imported)
- Est. U.S. shotgun sales in 1999: 1,425,209 — 6th most in last 35 years (72.9% U.S. made; 27.1% imported)
2000: 4,717,696 firearms

- Est. U.S. firearm sales in 2000: 4,717,696 — 26th most in last 35 years (76.8% U.S. made; 23.2% imported)
- Est. U.S. handgun sales in 2000: 1,670,998 — 32nd most in last 35 years (72.1% U.S. made; 27.9% imported)
- Est. U.S. rifle sales in 2000: 1,832,294 — 21st most in last 35 years (83.7% U.S. made; 16.3% imported)
- Est. U.S. shotgun sales in 2000: 1,195,340 — 23rd most in last 35 years (72.2% U.S. made; 27.8% imported)
2001: 4,126,940 firearms

- Est. U.S. firearm sales in 2001: 4,126,940 — 33rd most in last 35 years (66.9% U.S. made; 33.1% imported)
- Est. U.S. handgun sales in 2001: 1,593,124 — 33rd most in last 35 years (55.4% U.S. made; 44.6% imported)
- Est. U.S. rifle sales in 2001: 1,461,477 — 30th most in last 35 years (84.4% U.S. made; 15.6% imported)
- Est. U.S. shotgun sales in 2001: 1,061,969 — 29th most in last 35 years (59.7% U.S. made; 40.3% imported)
2002: 4,845,376 firearms
- Est. U.S. firearm sales in 2002: 4,845,376 — 24th most in last 35 years (66.4% U.S. made; 33.6% imported)
- Est. U.S. handgun sales in 2002: 1,773,687 — 28th most in last 35 years (58.2% U.S. made; 41.8% imported)
- Est. U.S. rifle sales in 2002: 1,962,279 — 20th most in last 35 years (74.1% U.S. made; 25.9% imported)
- Est. U.S. shotgun sales in 2002: 1,089,183 — 28th most in last 35 years (65.1% U.S. made; 34.9% imported)
2003: 4,632,994 firearms
- Est. U.S. firearm sales in 2003: 4,632,994 — 27th most in last 35 years (68.3% U.S. made; 31.7% imported)
- Est. U.S. handgun sales in 2003: 1,708,423 — 31st most in last 35 years (63.1% U.S. made; 36.9% imported)
- Est. U.S. rifle sales in 2003: 1,796,639 — 23rd most in last 35 years (76.1% U.S. made; 23.9% imported)
- Est. U.S. shotgun sales in 2003: 1,103,943 — 26th most in last 35 years (63.1% U.S. made; 36.9% imported)
2004: 4,869,964 firearms
- Est. U.S. firearm sales in 2004: 4,869,964 — 23rd most in last 35 years (60.8% U.S. made; 39.2% imported)
- Est. U.S. handgun sales in 2004: 1,822,385 — 27th most in last 35 years (54.0% U.S. made; 46.0% imported)
- Est. U.S. rifle sales in 2004: 1,827,688 — 22nd most in last 35 years (69.1% U.S. made; 30.9% imported)
- Est. U.S. shotgun sales in 2004: 1,207,794 — 21st most in last 35 years (58.0% U.S. made; 42.0% imported)
2005: 5,153,487 firearms
- Est. U.S. firearm sales in 2005: 5,153,487 — 20th most in last 35 years (59.1% U.S. made; 40.9% imported)
- Est. U.S. handgun sales in 2005: 1,907,335 — 24th most in last 35 years (54.0% U.S. made; 46.0% imported)
- Est. U.S. rifle sales in 2005: 2,021,374 — 19th most in last 35 years (66.3% U.S. made; 33.7% imported)
- Est. U.S. shotgun sales in 2005: 1,209,587 — 19th most in last 35 years (54.8% U.S. made; 45.2% imported)
2006: 5,718,325 firearms
- Est. U.S. firearm sales in 2006: 5,718,325 — 18th most in last 35 years (57.5% U.S. made; 42.5% imported)
- Est. U.S. handgun sales in 2006: 2,399,739 — 18th most in last 35 years (51.4% U.S. made; 48.6% imported)
- Est. U.S. rifle sales in 2006: 2,053,069 — 18th most in last 35 years (67.9% U.S. made; 32.1% imported)
- Est. U.S. shotgun sales in 2006: 1,263,667 — 12th most in last 35 years (52.0% U.S. made; 48.0% imported)
2007: 6,461,824 firearms

- Est. U.S. firearm sales in 2007: 6,461,824 — 17th most in last 35 years (57.5% U.S. made; 42.5% imported)
- Est. U.S. handgun sales in 2007: 2,917,743 — 17th most in last 35 years (52.5% U.S. made; 47.5% imported)
- Est. U.S. rifle sales in 2007: 2,162,110 — 16th most in last 35 years (70.8% U.S. made; 29.2% imported)
- Est. U.S. shotgun sales in 2007: 1,344,034 — 8th most in last 35 years (46.0% U.S. made; 54.0% imported)
2008: 6,876,842 firearms
- Est. U.S. firearm sales in 2008: 6,876,842 — 14th most in last 35 years (62.1% U.S. made; 37.9% imported)
- Est. U.S. handgun sales in 2008: 3,426,961 — 14th most in last 35 years (57.2% U.S. made; 42.8% imported)
- Est. U.S. rifle sales in 2008: 2,232,356 — 15th most in last 35 years (73.0% U.S. made; 27.0% imported)
- Est. U.S. shotgun sales in 2008: 1,125,484 — 25th most in last 35 years (52.4% U.S. made; 47.6% imported)
2009: 8,968,180 firearms
- Est. U.S. firearm sales in 2009: 8,968,180 — 11th most in last 35 years (59.8% U.S. made; 40.2% imported)
- Est. U.S. handgun sales in 2009: 4,511,091 — 11th most in last 35 years (51.6% U.S. made; 48.4% imported)
- Est. U.S. rifle sales in 2009: 3,051,789 — 9th most in last 35 years (71.7% U.S. made; 28.3% imported)
- Est. U.S. shotgun sales in 2009: 1,274,923 — 11th most in last 35 years (56.2% U.S. made; 43.8% imported)
2010: 8,057,210 firearms
- Est. U.S. firearm sales in 2010: 8,057,210 — 12th most in last 35 years (64.8% U.S. made; 35.2% imported)
- Est. U.S. handgun sales in 2010: 4,494,635 — 12th most in last 35 years (60.3% U.S. made; 39.7% imported)
- Est. U.S. rifle sales in 2010: 2,301,487 — 14th most in last 35 years (76.2% U.S. made; 23.8% imported)
- Est. U.S. shotgun sales in 2010: 1,209,930 — 18th most in last 35 years (57.9% U.S. made; 42.1% imported)
2011: 9,497,402 firearms
- Est. U.S. firearm sales in 2011: 9,497,402 — 10th most in last 35 years (65.8% U.S. made; 34.2% imported)
- Est. U.S. handgun sales in 2011: 4,752,010 — 10th most in last 35 years (63.7% U.S. made; 36.3% imported)
- Est. U.S. rifle sales in 2011: 3,236,904 — 8th most in last 35 years (69.2% U.S. made; 30.8% imported)
- Est. U.S. shotgun sales in 2011: 1,336,579 — 10th most in last 35 years (60.4% U.S. made; 39.6% imported)
2012: 13,135,646 firearms

- Est. U.S. firearm sales in 2012: 13,135,646 — 4th most in last 35 years (63.1% U.S. made; 36.9% imported)
- Est. U.S. handgun sales in 2012: 6,634,485 — 7th most in last 35 years (60.4% U.S. made; 39.6% imported)
- Est. U.S. rifle sales in 2012: 4,330,775 — 4th most in last 35 years (71.3% U.S. made; 28.7% imported)
- Est. U.S. shotgun sales in 2012: 1,879,617 — 3rd most in last 35 years (48.2% U.S. made; 51.8% imported)
2013: 15,991,210 firearms
- Est. U.S. firearm sales in 2013: 15,991,210 — 3rd most in last 35 years (65.4% U.S. made; 34.6% imported)
- Est. U.S. handgun sales in 2013: 8,073,647 — 3rd most in last 35 years (61.7% U.S. made; 38.3% imported)
- Est. U.S. rifle sales in 2013: 5,355,628 — the most in last 35 years (71.8% U.S. made; 28.2% imported)
- Est. U.S. shotgun sales in 2013: 2,089,541 — 2nd most in last 35 years (55.2% U.S. made; 44.8% imported)
2014: 12,254,962 firearms
- Est. U.S. firearm sales in 2014: 12,254,962 — 8th most in last 35 years (70.4% U.S. made; 29.6% imported)
- Est. U.S. handgun sales in 2014: 6,410,701 — 8th most in last 35 years (65.9% U.S. made; 34.1% imported)
- Est. U.S. rifle sales in 2014: 3,963,507 — 5th most in last 35 years (80.0% U.S. made; 20.0% imported)
- Est. U.S. shotgun sales in 2014: 1,523,373 — 5th most in last 35 years (57.4% U.S. made; 42.6% imported)
2015: 12,945,416 firearms
- Est. U.S. firearm sales in 2015: 12,945,416 — 5th most in last 35 years (69.6% U.S. made; 30.4% imported)
- Est. U.S. handgun sales in 2015: 6,749,106 — 6th most in last 35 years (63.4% U.S. made; 36.6% imported)
- Est. U.S. rifle sales in 2015: 4,347,909 — 3rd most in last 35 years (81.2% U.S. made; 18.8% imported)
- Est. U.S. shotgun sales in 2015: 1,402,769 — 7th most in last 35 years (54.1% U.S. made; 45.9% imported)
2016: 16,258,394 firearms
- Est. U.S. firearm sales in 2016: 16,258,394 — 2nd most in last 35 years (68.4% U.S. made; 31.6% imported)
- Est. U.S. handgun sales in 2016: 9,051,208 — 2nd most in last 35 years (59.4% U.S. made; 40.6% imported)
- Est. U.S. rifle sales in 2016: 4,821,743 — 2nd most in last 35 years (84.9% U.S. made; 15.1% imported)
- Est. U.S. shotgun sales in 2016: 1,560,431 — 4th most in last 35 years (52.8% U.S. made; 47.2% imported)
2017: 12,331,748 firearms
- Est. U.S. firearm sales in 2017: 12,331,748 — 7th most in last 35 years (63.6% U.S. made; 36.4% imported)
- Est. U.S. handgun sales in 2017: 7,402,669 — 4th most in last 35 years (55.6% U.S. made; 44.4% imported)
- Est. U.S. rifle sales in 2017: 2,917,530 — 10th most in last 35 years (80.4% U.S. made; 19.6% imported)
- Est. U.S. shotgun sales in 2017: 1,255,247 — 13th most in last 35 years (49.6% U.S. made; 50.4% imported)
2018: 12,804,242 firearms
- Est. U.S. firearm sales in 2018: 12,804,242 — 6th most in last 35 years (66.4% U.S. made; 33.6% imported)
- Est. U.S. handgun sales in 2018: 7,131,118 — 5th most in last 35 years (58.8% U.S. made; 41.2% imported)
- Est. U.S. rifle sales in 2018: 3,366,994 — 7th most in last 35 years (80.6% U.S. made; 19.4% imported)
- Est. U.S. shotgun sales in 2018: 1,222,283 — 16th most in last 35 years (41.6% U.S. made; 58.4% imported)
2019: 10,681,126 firearms

- Est. U.S. firearm sales in 2019: 10,681,126 — 9th most in last 35 years (62.7% U.S. made; 37.3% imported)
- Est. U.S. handgun sales in 2019: 6,067,861 — 9th most in last 35 years (57.2% U.S. made; 42.8% imported)
- Est. U.S. rifle sales in 2019: 2,470,129 — 12th most in last 35 years (73.7% U.S. made; 26.3% imported)
- Est. U.S. shotgun sales in 2019: 1,201,668 — 22nd most in last 35 years (38.1% U.S. made; 61.9% imported)
2020: 17,366,316 firearms
- Est. U.S. firearm sales in 2020: 17,366,316 — the most in last 35 years (60.7% U.S. made; 39.3% imported)
- Est. U.S. handgun sales in 2020: 10,131,519 — the most in last 35 years (60.2% U.S. made; 39.8% imported)
- Est. U.S. rifle sales in 2020: 3,536,097 — 6th most in last 35 years (75.3% U.S. made; 24.7% imported)
- Est. U.S. shotgun sales in 2020: 2,383,745 — the most in last 35 years (19.2% U.S. made; 80.8% imported)
2021: 13,346,235 firearms
- Est. U.S. firearm sales in 2021: 13,346,235 (U.S.-made firearms only)
- Est. U.S. handgun sales in 2021: 7,649,276 (U.S.-made handguns only)
- Est. U.S. rifle sales in 2021: 3,774,080 (U.S.-made rifles only)
- Est. U.S. shotgun sales in 2021: 647,939 (U.S.-made shotguns only)
2022: 12,763,846 firearms

- Est. U.S. firearm sales in 2022: 12,763,846 (U.S.-made firearms only)
- Est. U.S. handgun sales in 2022: 6,619,082 (U.S.-made handguns only)
- Est. U.S. rifle sales in 2022: 3,359,975 (U.S.-made rifles only)
- Est. U.S. shotgun sales in 2022: 619,038 (U.S.-made shotguns only)
The post Take a Guess: Have Americans Bought More or Less Than 150 Million Guns Since 1986? appeared first on 24/7 Wall St..
