


OPEC Update, January 2025
The OPEC Monthly Oil Market Report (MOMR) for January 2025 was published recently. The last month reported in most of the OPEC charts that follow is December 2024 and output reported for OPEC nations is crude oil output in thousands of barrels per day (kb/d). In the OPEC charts below the blue line with markers […]
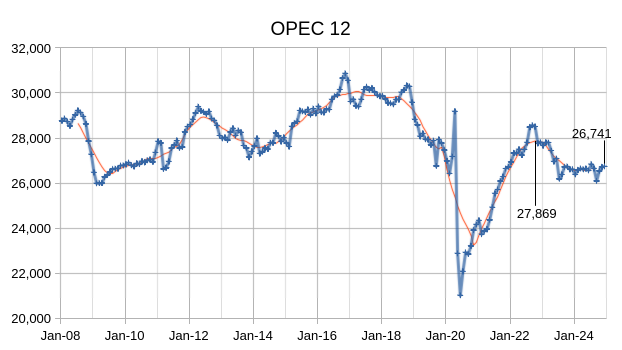
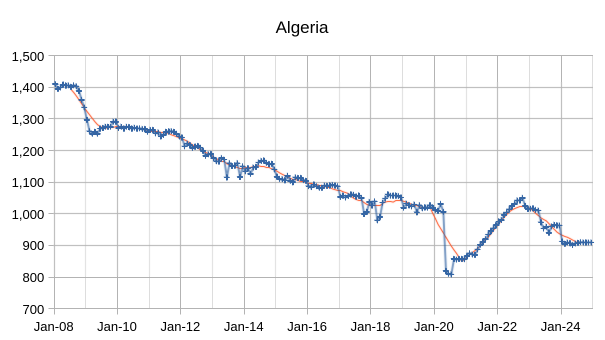
The OPEC Monthly Oil Market Report (MOMR) for January 2025 was published recently. The last month reported in most of the OPEC charts that follow is December 2024 and output reported for OPEC nations is crude oil output in thousands of barrels per day (kb/d). In the OPEC charts below the blue line with markers is monthly output and the thin red line is the centered twelve month average (CTMA) output.
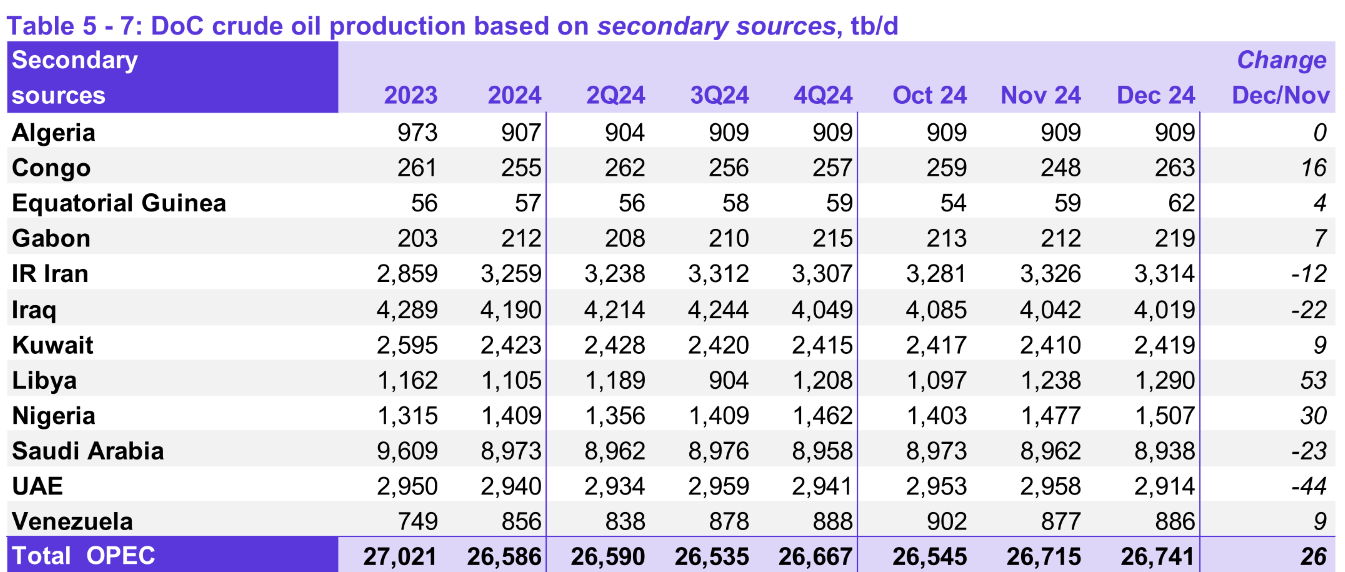
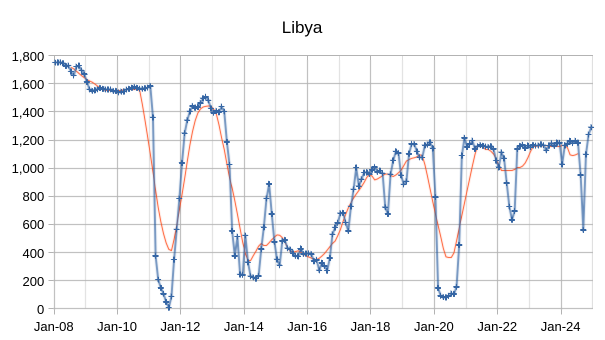
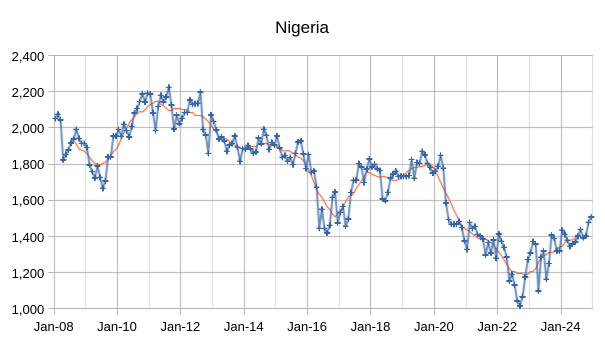
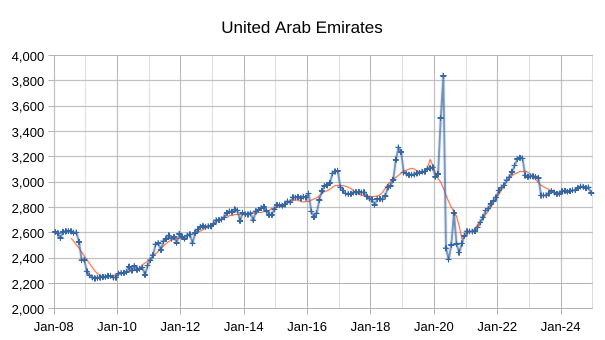
Output for October 2024 was revised lower by 9kb/d and November 2024 output was revised higher by 58 kb/d compared to last month’s report. OPEC 12 output increased by 26 kb/d with most of the increase from Libya (53 kb/d.) Nigeria also increased by 30 kb/d while UAE saw a decrease of 44 kb/d. Other OPEC members had small increases or decreases of 23 kb/d or less.
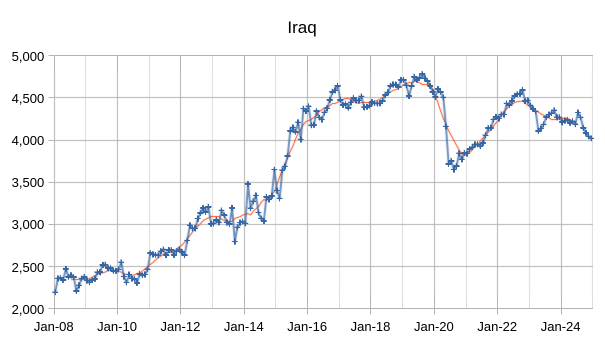
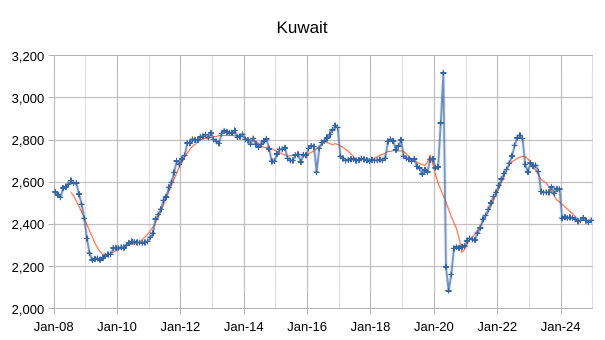
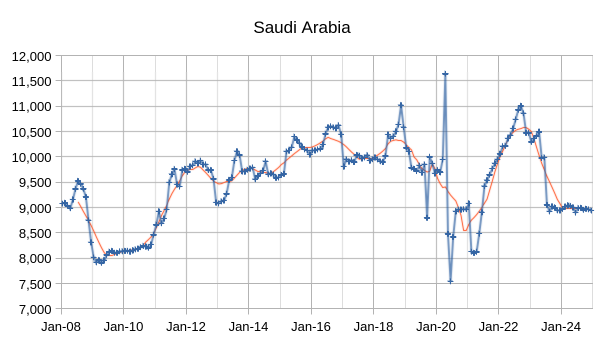
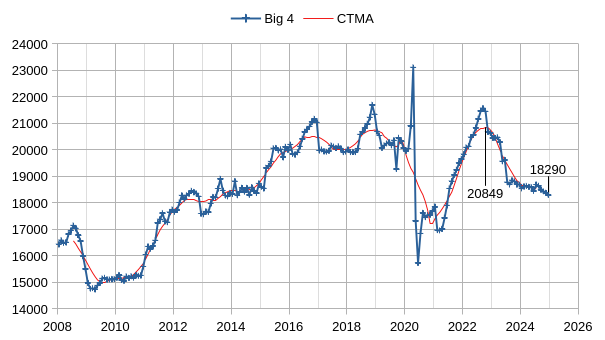
The chart above shows output from the Big 4 OPEC producers that are subject to output quotas (Saudi Arabia, UAE, Iraq, and Kuwait.) After the pandemic, Big 4 average output peaked in 2022 at a centered 12 month average (CTMA) of 20849 kb/d, crude output has been cut by 2599 kb/d relative to the 2022 CTMA peak to 18290 kb/d in December 2024. The Big 4 may have roughly 2599 kb/d of spare capacity when World demand calls for an increase in output.
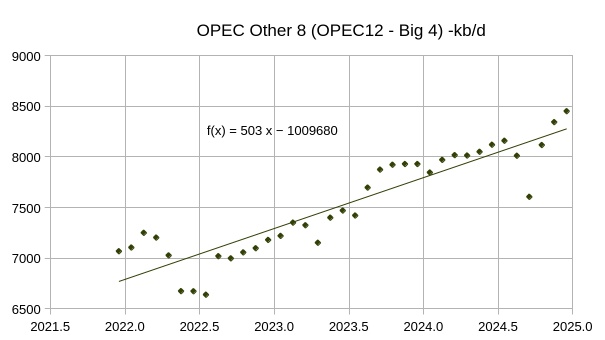
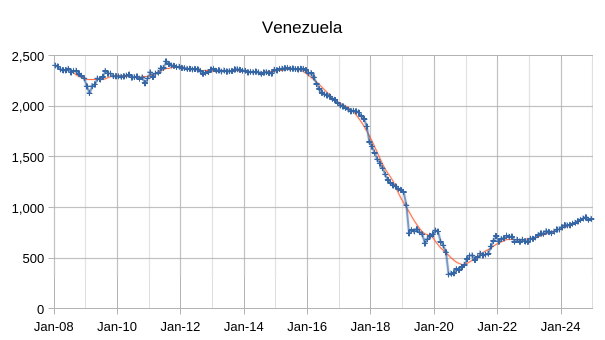
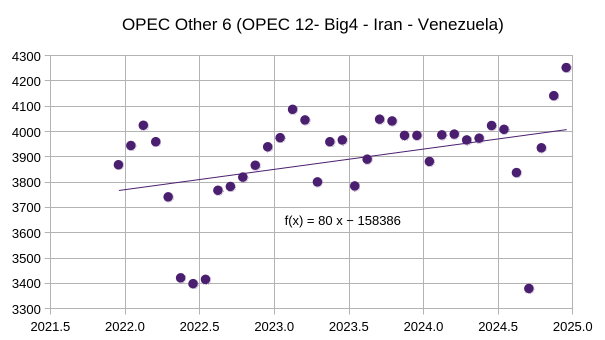
Most of the increase in the Other 8 OPEC nations (those OPEC 12 nations that are not part of the Big 4) came from Iran and Venezuela (about 423 of the 503 kb/d average annual increase), with the remaining 6 nations that were subject to quotas having relatively flat output over the 37 month period covered in the chart above (December 2021 to December 2024) . See chart below for OPEC Other 6 (OPEC 12 minus Big 4 minus Iran minus Venezuela) with an average annual increase of only 80 kb/d over past 3 years.
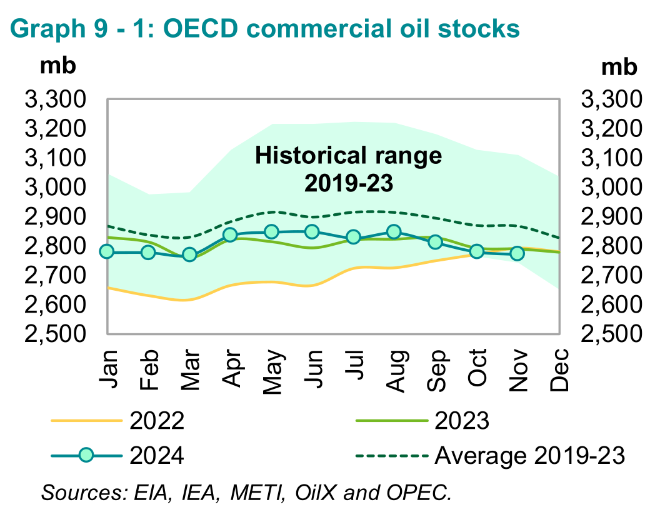
OECD Commercial petroleum stocks remain near the bottom of the 5 year range from 2019 to 2023, so far the market seems to need less oil than earlier periods as oil prices remain relatively low.
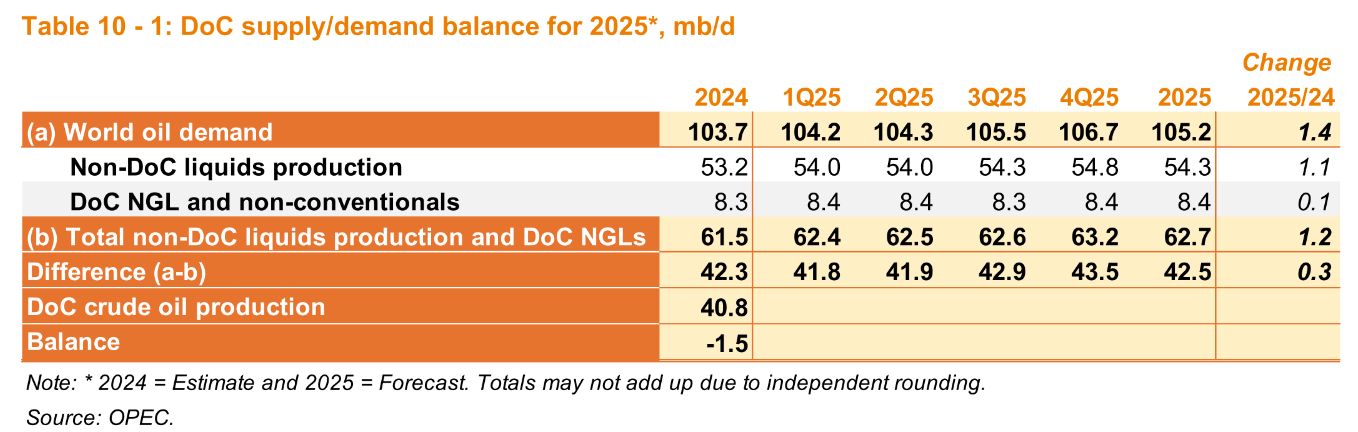
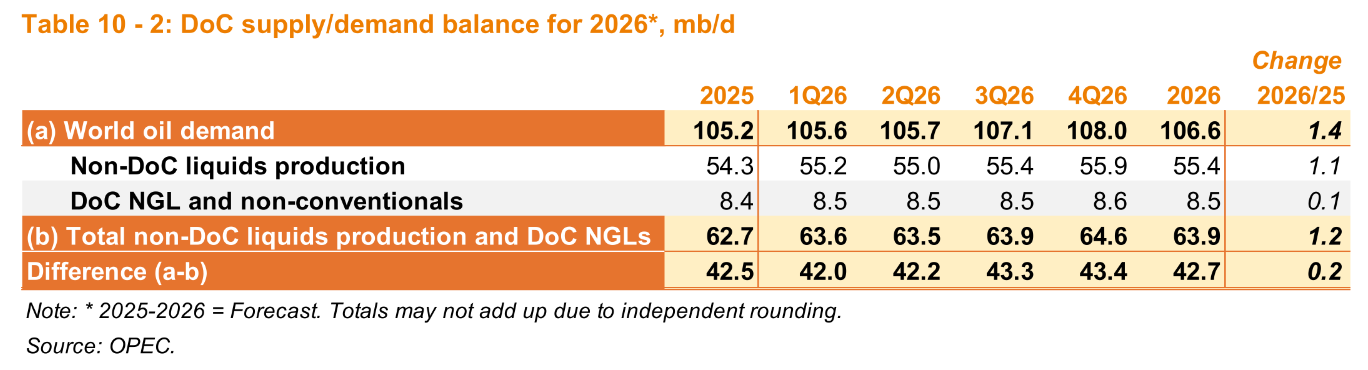
OPEC expected growth in 2025 is unchanged from last month’s report and the 2026 estimate for World liquids growth is the same as the 2025 estimate at 1.4 Mb/d, this month is the first estimate for 2026 demand growth and non-DOC supply growth.
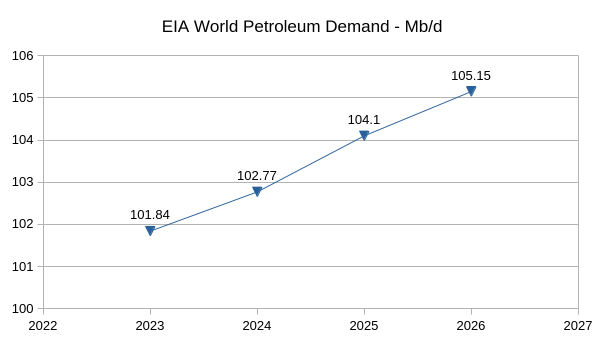
Chart above shows the significant difference between EIA STEO forecast for World Oil demand from 2024 to 2026 compared with the OPEC forecast which is 1.5 Mb/d higher in 2026 and 1.1 Mb/d higher in 2025. Much of the difference in 2025 and 2026 is accounted for by the higher demand estimate by OPEC for 2024 (about 930 kb/d higher than the EIA estimate).
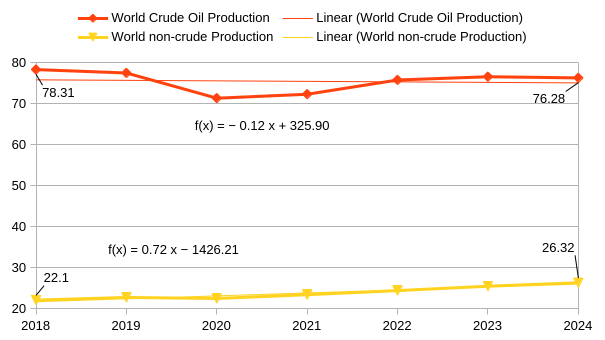
The chart above is based on the EIA’s Jan 2025 STEO estimates for World liquids and World crude, with non-crude Production equal to World liquids minus World crude. From 2018 to 2024 World crude output decreased by about 2 Mb/d while non-crude liquids output increased by 4.2 Mb/d. A significant portion of the non-crude output is ethanol (lower energy density than crude) and bottled gas such as ethane, propane and butane which are useful, but less so as transportation fuels compared to crude oil and the products refined from crude oil.
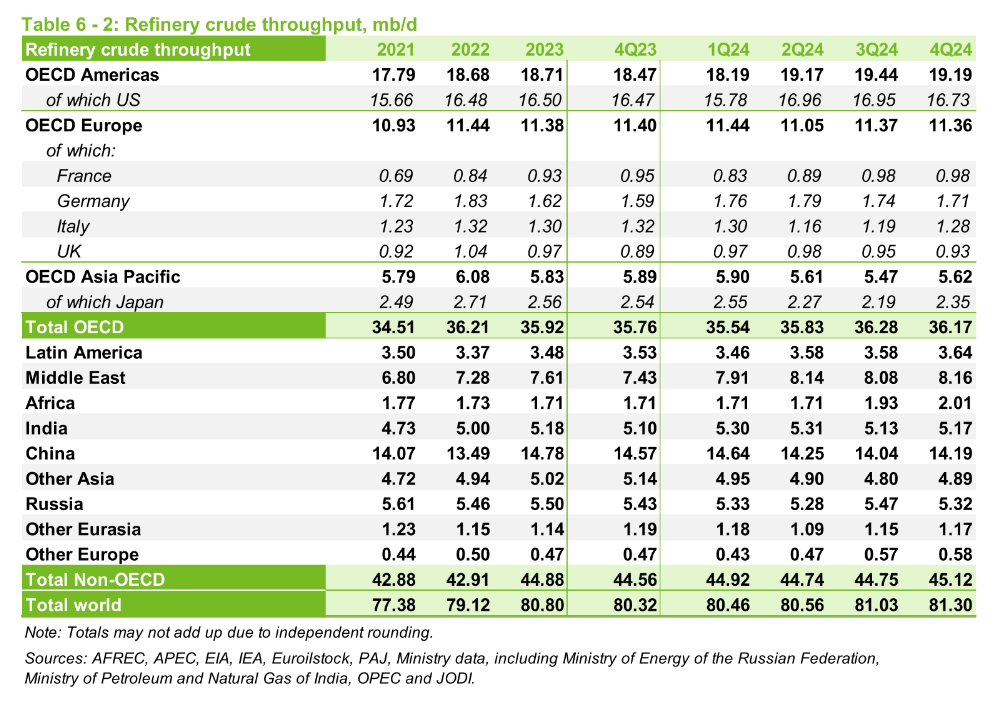
The chart above is included to show that demand for crude oil (input of crude to refineries constitutes most of crude oil demand) has increased from 80.8 Mb/d in 2023 to 80.84 Mb/d in 2024, an increase of only 40 kb/d.
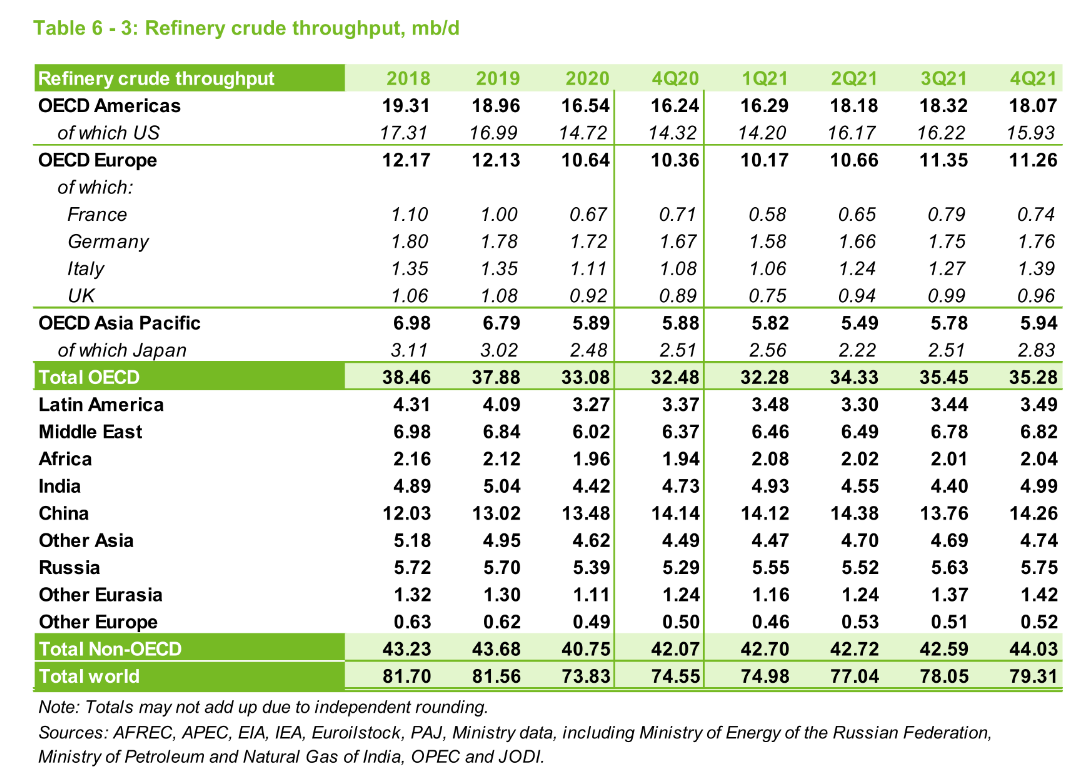
The chart above is from the January 2022 MOMR and shows that World crude refinery throughput averaged 81.7 Mb/d in 2018. World demand for crude has decreased by roughly 860 kb/d from 2018 to 2024, though the estimate may change a bit over time.
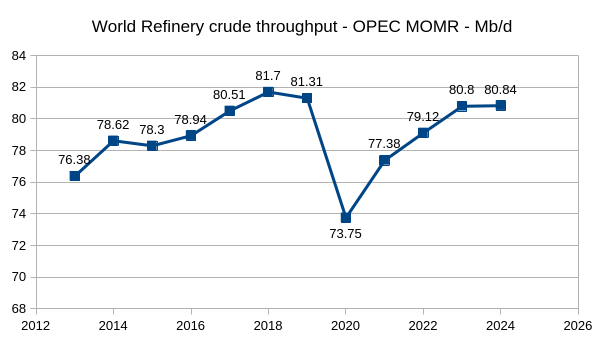
Chart above uses data from OPEC MOMR Jan 2016 to Jan 2025, World refinery crude throughput has not yet returned to the 2018 peak.
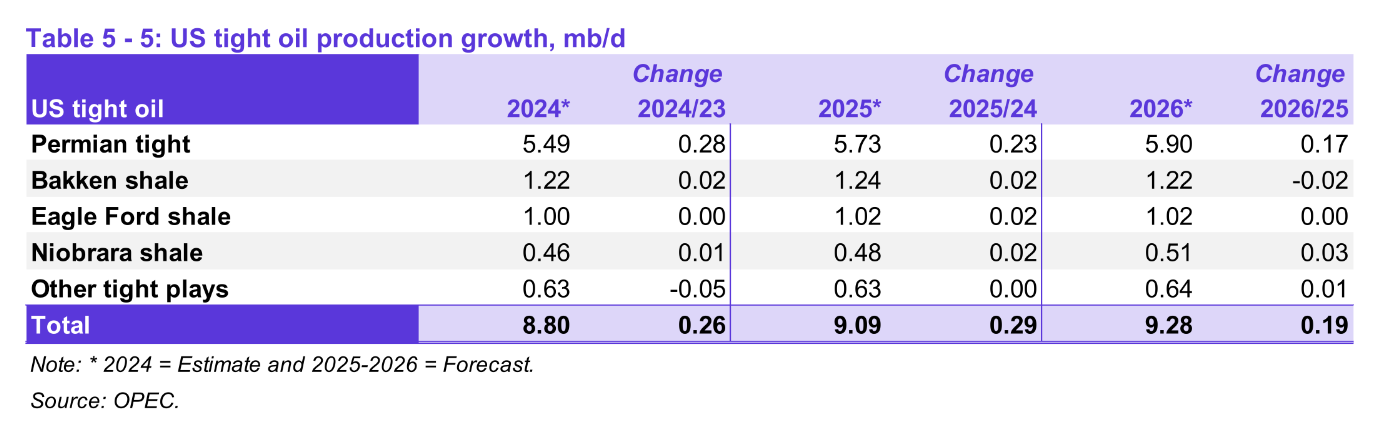
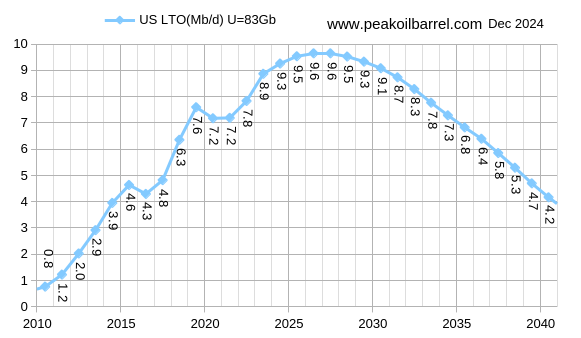
The tight oil estimate for 2024 was revised higher by 60 kb/d compared to last month’s report, the 2025 tight oil output estimate was also increased by 60 kb/d, this is the initial estimate for 2026 tight oil output at 190 kb/d higher than 2025 output. In the chart that follows is my estimate and forecast for US tight oil output, for 2024 I have tight oil output at 9.3 Mb/d, about 500 kb/d higher than the OPEC estimate, for 2025 I have 9.5 Mb/d and for 2026, 9.6 Mb/d. The increases in tight oil in my forecast are about 100 kb/d smaller in both 2025 and 2026 than the OPEC forecast.
The next 3 charts all use the same vertical and horizontal scale so they can be more easily compared (16000 kb/d on vertical scale from minimum to maximum and 9 years on the horizontal scale.)
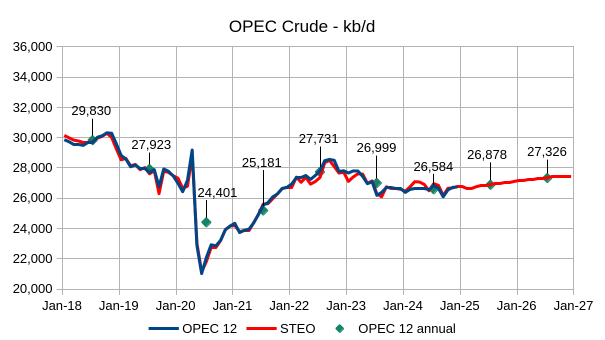
The chart above compares the OPEC 12 monthly crude output estimates from the MOMR secondary sources charts with the EIA’s Jan 2025 STEO estimates from Jan 2018 to Dec 2024. The annual average estimates are based on the MOMR data up to 2024 and for 2025 and 2026 use the EIA STEO forecast. Note the small increase of only 294 kb/d in 2025 and somewhat larger increase of 448 kb/d in 2026, OPEC has spare capacity for further increases after 2026 if the STEO forecast is accurate.
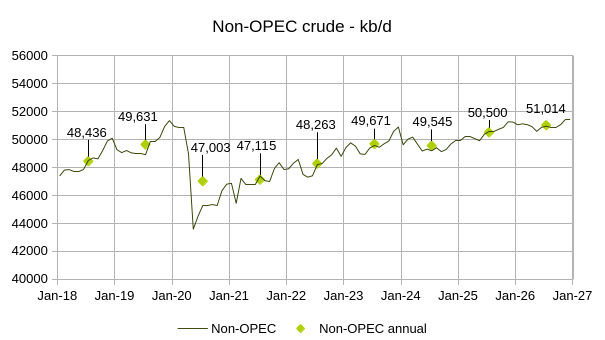
The chart above is based on the EIA STEO from Jan 2025, non-OPEC crude output increases by 955 kb/d in 2025 and by 514 kb/d in 2026 according the the EIA.
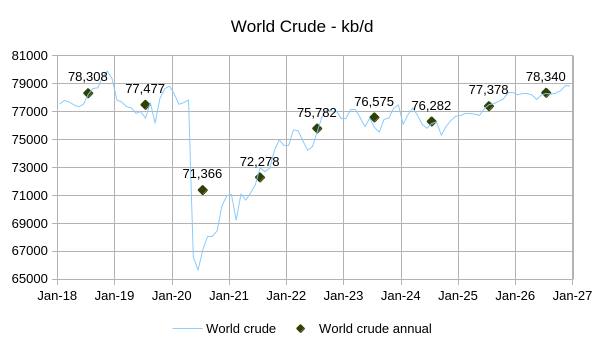
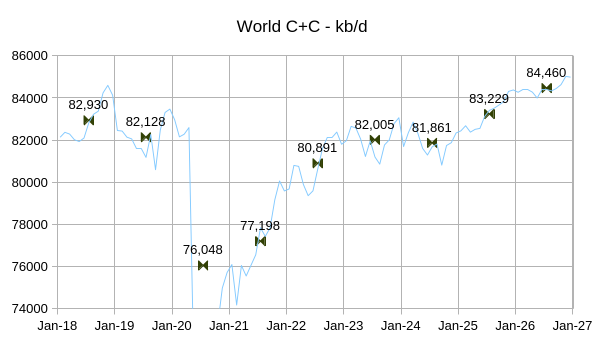
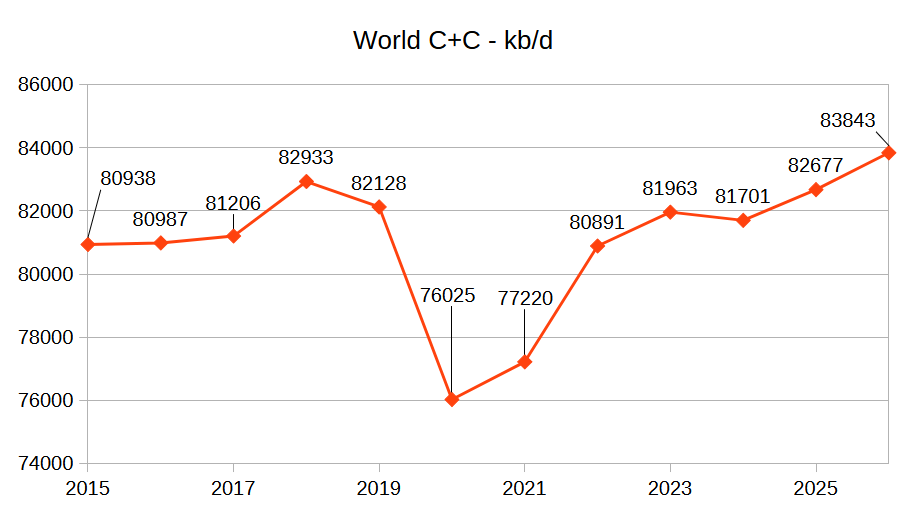
This World crude estimate and forecast also comes from the Jan 2025 STEO. World crude output increases by 2058 kb/d from 2024 to 2026 according to the EIA. Given how slowly crude demand has grown since 2018 (demand has actually decreased by about 860 kb/d based on refinery throughput) this forecast seems quite optimistic.