


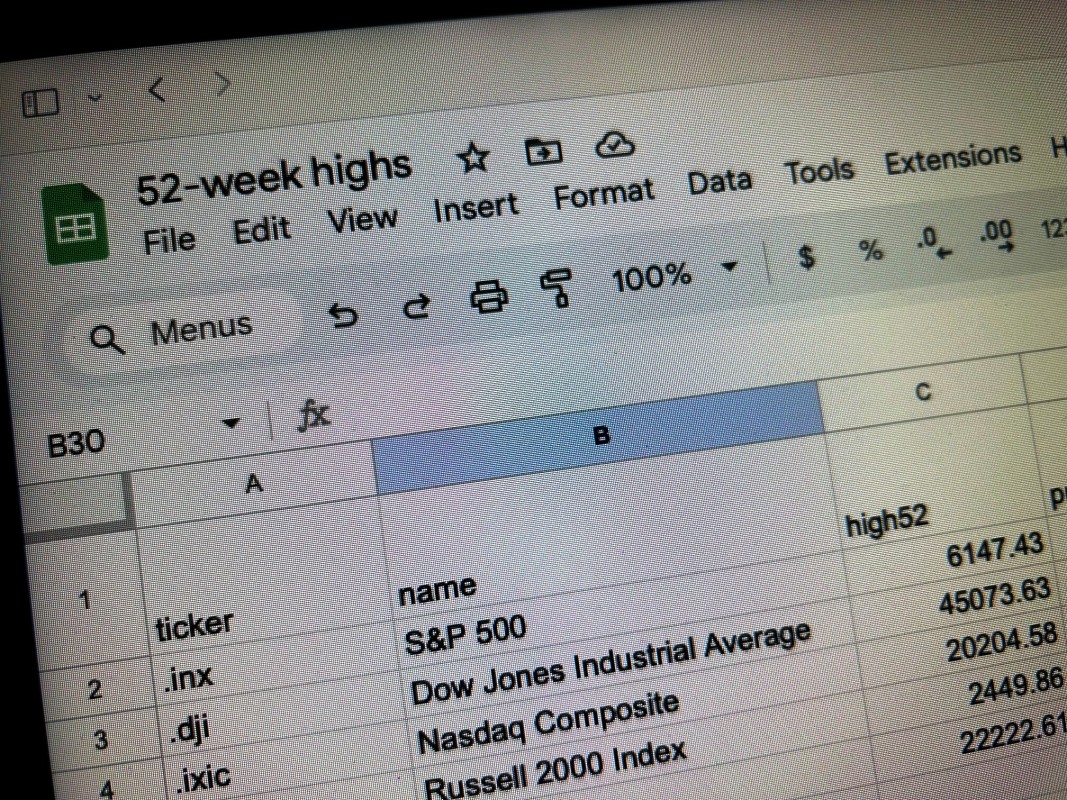
How to track stock price changes from 52-week highs on Google Finance
Tracking stock price movements, particularly declines, from their 52-week highs can be useful in a trading strategy. Here’s a spreadsheet that can monitor those changes.
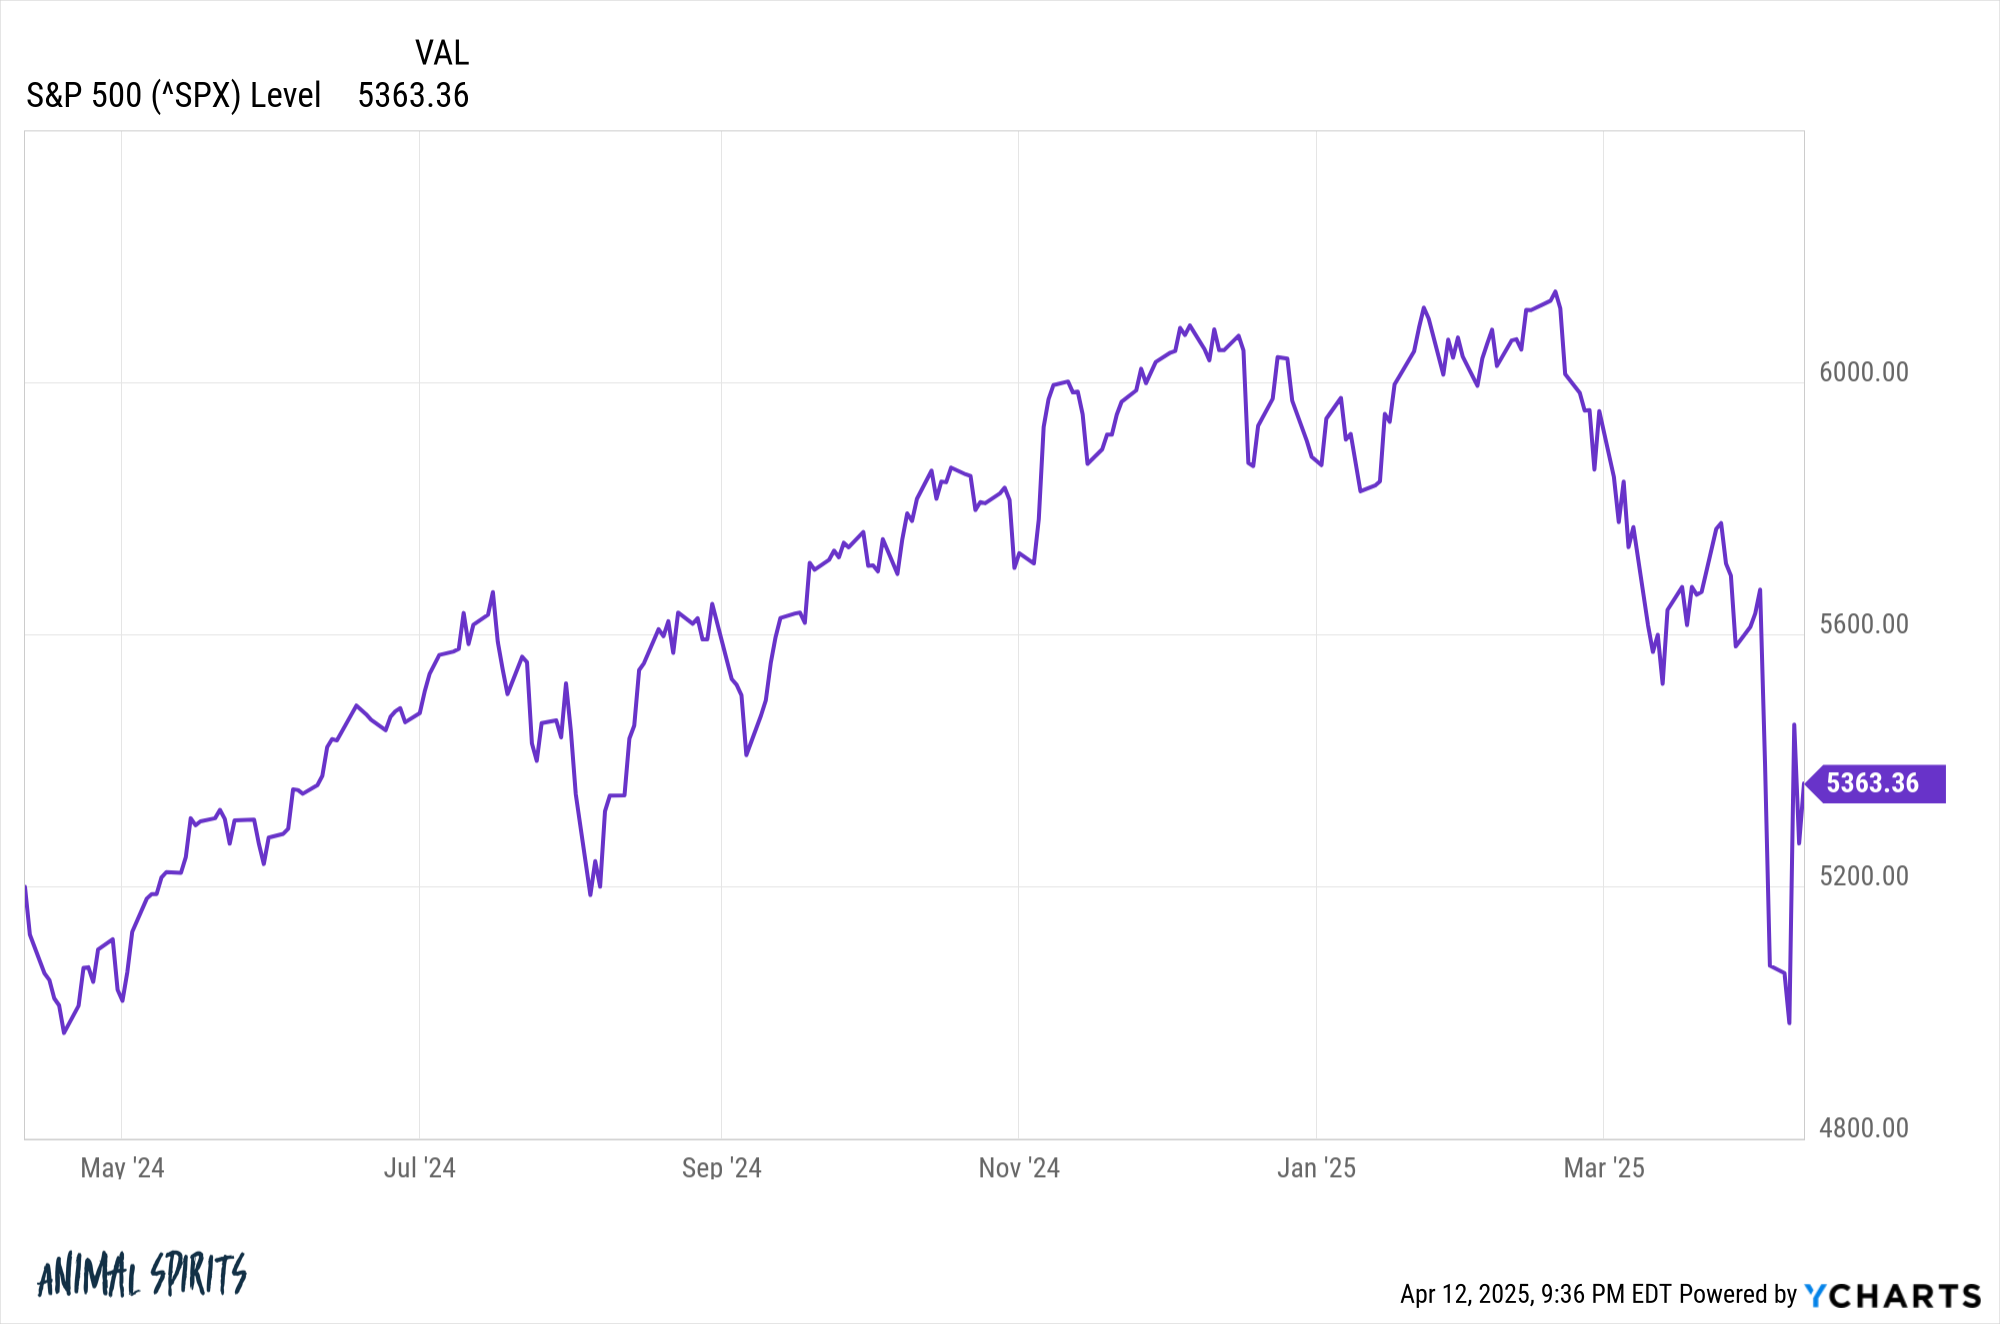
Stock markets can go into sharp declines over a short period of time. For example, President Trump’s directive to implement tariffs in early April 2025 sent the U.S. stock market into a sharp decline after major stock indexes and some individual stocks had reached record highs just a few weeks before.
Tracking how much stocks have fallen from their 52-week highs can be useful in your trading strategy in concert with technical indicators that can help determine whether stocks are oversold. An index losing 10% or more from its highs is said to be in a correction, while a loss of 20% or more puts it in a bear market.