


Homebuyers Are Seriously Stretching Their Budget to Buy Housing in These Cities
The cost of homeownership has risen sharply in recent years. While financial experts generally recommend that housing costs not exceed 30% of household income, many homeowners are spending far beyond that. Nationwide, 13.9% of housing units are spending at least 50% of their income on housing costs, with the proportion far greater in more expensive […] The post Homebuyers Are Seriously Stretching Their Budget to Buy Housing in These Cities appeared first on 24/7 Wall St..

The cost of homeownership has risen sharply in recent years. While financial experts generally recommend that housing costs not exceed 30% of household income, many homeowners are spending far beyond that. Nationwide, 13.9% of housing units are spending at least 50% of their income on housing costs, with the proportion far greater in more expensive cities.
The cities where the most home dwellers are spending more than half their incomes on housing are relatively well-distributed throughout the country. Of the 25 top cities, nine are in the Northeast, eight are in the South, and eight are in the West. Several cities are in the Los Angeles and Miami metro areas. But while housing costs as a share of income are correlated with renter rates and the overall cost of real estate, the list of the top 25 cities is not just a list of the 25 most expensive cities. A closer look at the data reveals where homeowners are stretching their budgets the farthest to buy housing.
To determine where homeowners are stretching their budget to buy housing, 24/7 Wall St. reviewed five-year data on housing costs and income from the U.S. Census Bureau’s 2023 American Community Survey. Cities were ranked based on the percentage of housing units spending more than 50% of their income on housing costs. Supplemental data on the percentage of homeowners – both with and without a mortgage – spending more than 50% of their income on housing, the percentage of renters spending more than 50% of their income on housing, median household income, and median home value are also from the U.S. Census Bureau. Only cities with at least 100,000 residents were considered.
25. Anaheim, CA

- All housing units spending more than 50% of income on housing: 23.1%
- Homeowners spending more than 50% of income on housing: 13.7%
- Renters spending more than 50% of income on housing: 31.0%
- Median household income: $90,583
- Median home value: $771,700
24. Elizabeth, NJ

- All housing units spending more than 50% of income on housing: 23.1%
- Homeowners spending more than 50% of income on housing: 16.0%
- Renters spending more than 50% of income on housing: 25.5%
- Median household income: $63,874
- Median home value: $393,500
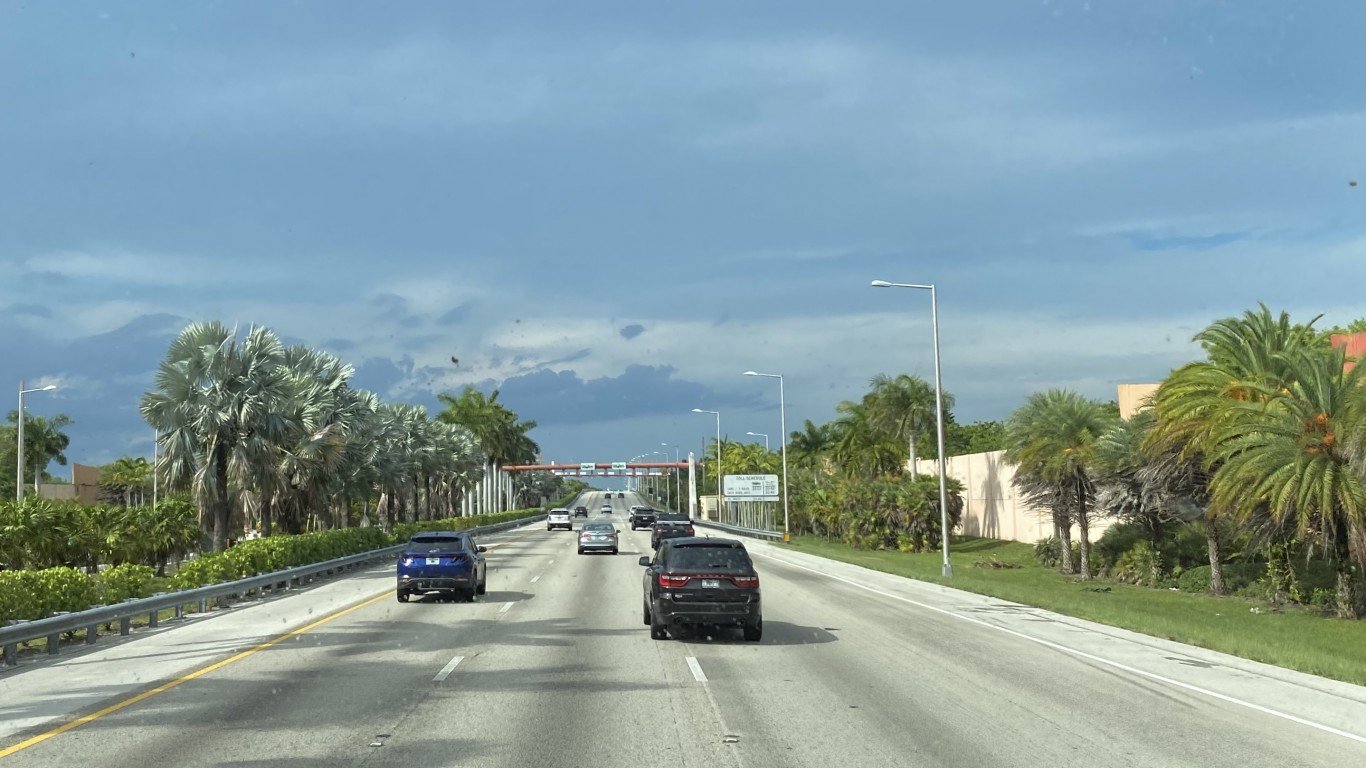
23. Pompano Beach, FL
- All housing units spending more than 50% of income on housing: 23.2%
- Homeowners spending more than 50% of income on housing: 14.0%
- Renters spending more than 50% of income on housing: 33.8%
- Median household income: $63,832
- Median home value: $321,900
22. Lynn, MA
- All housing units spending more than 50% of income on housing: 23.2%
- Homeowners spending more than 50% of income on housing: 16.5%
- Renters spending more than 50% of income on housing: 30.0%
- Median household income: $74,715
- Median home value: $472,600
21. Waterbury, CT
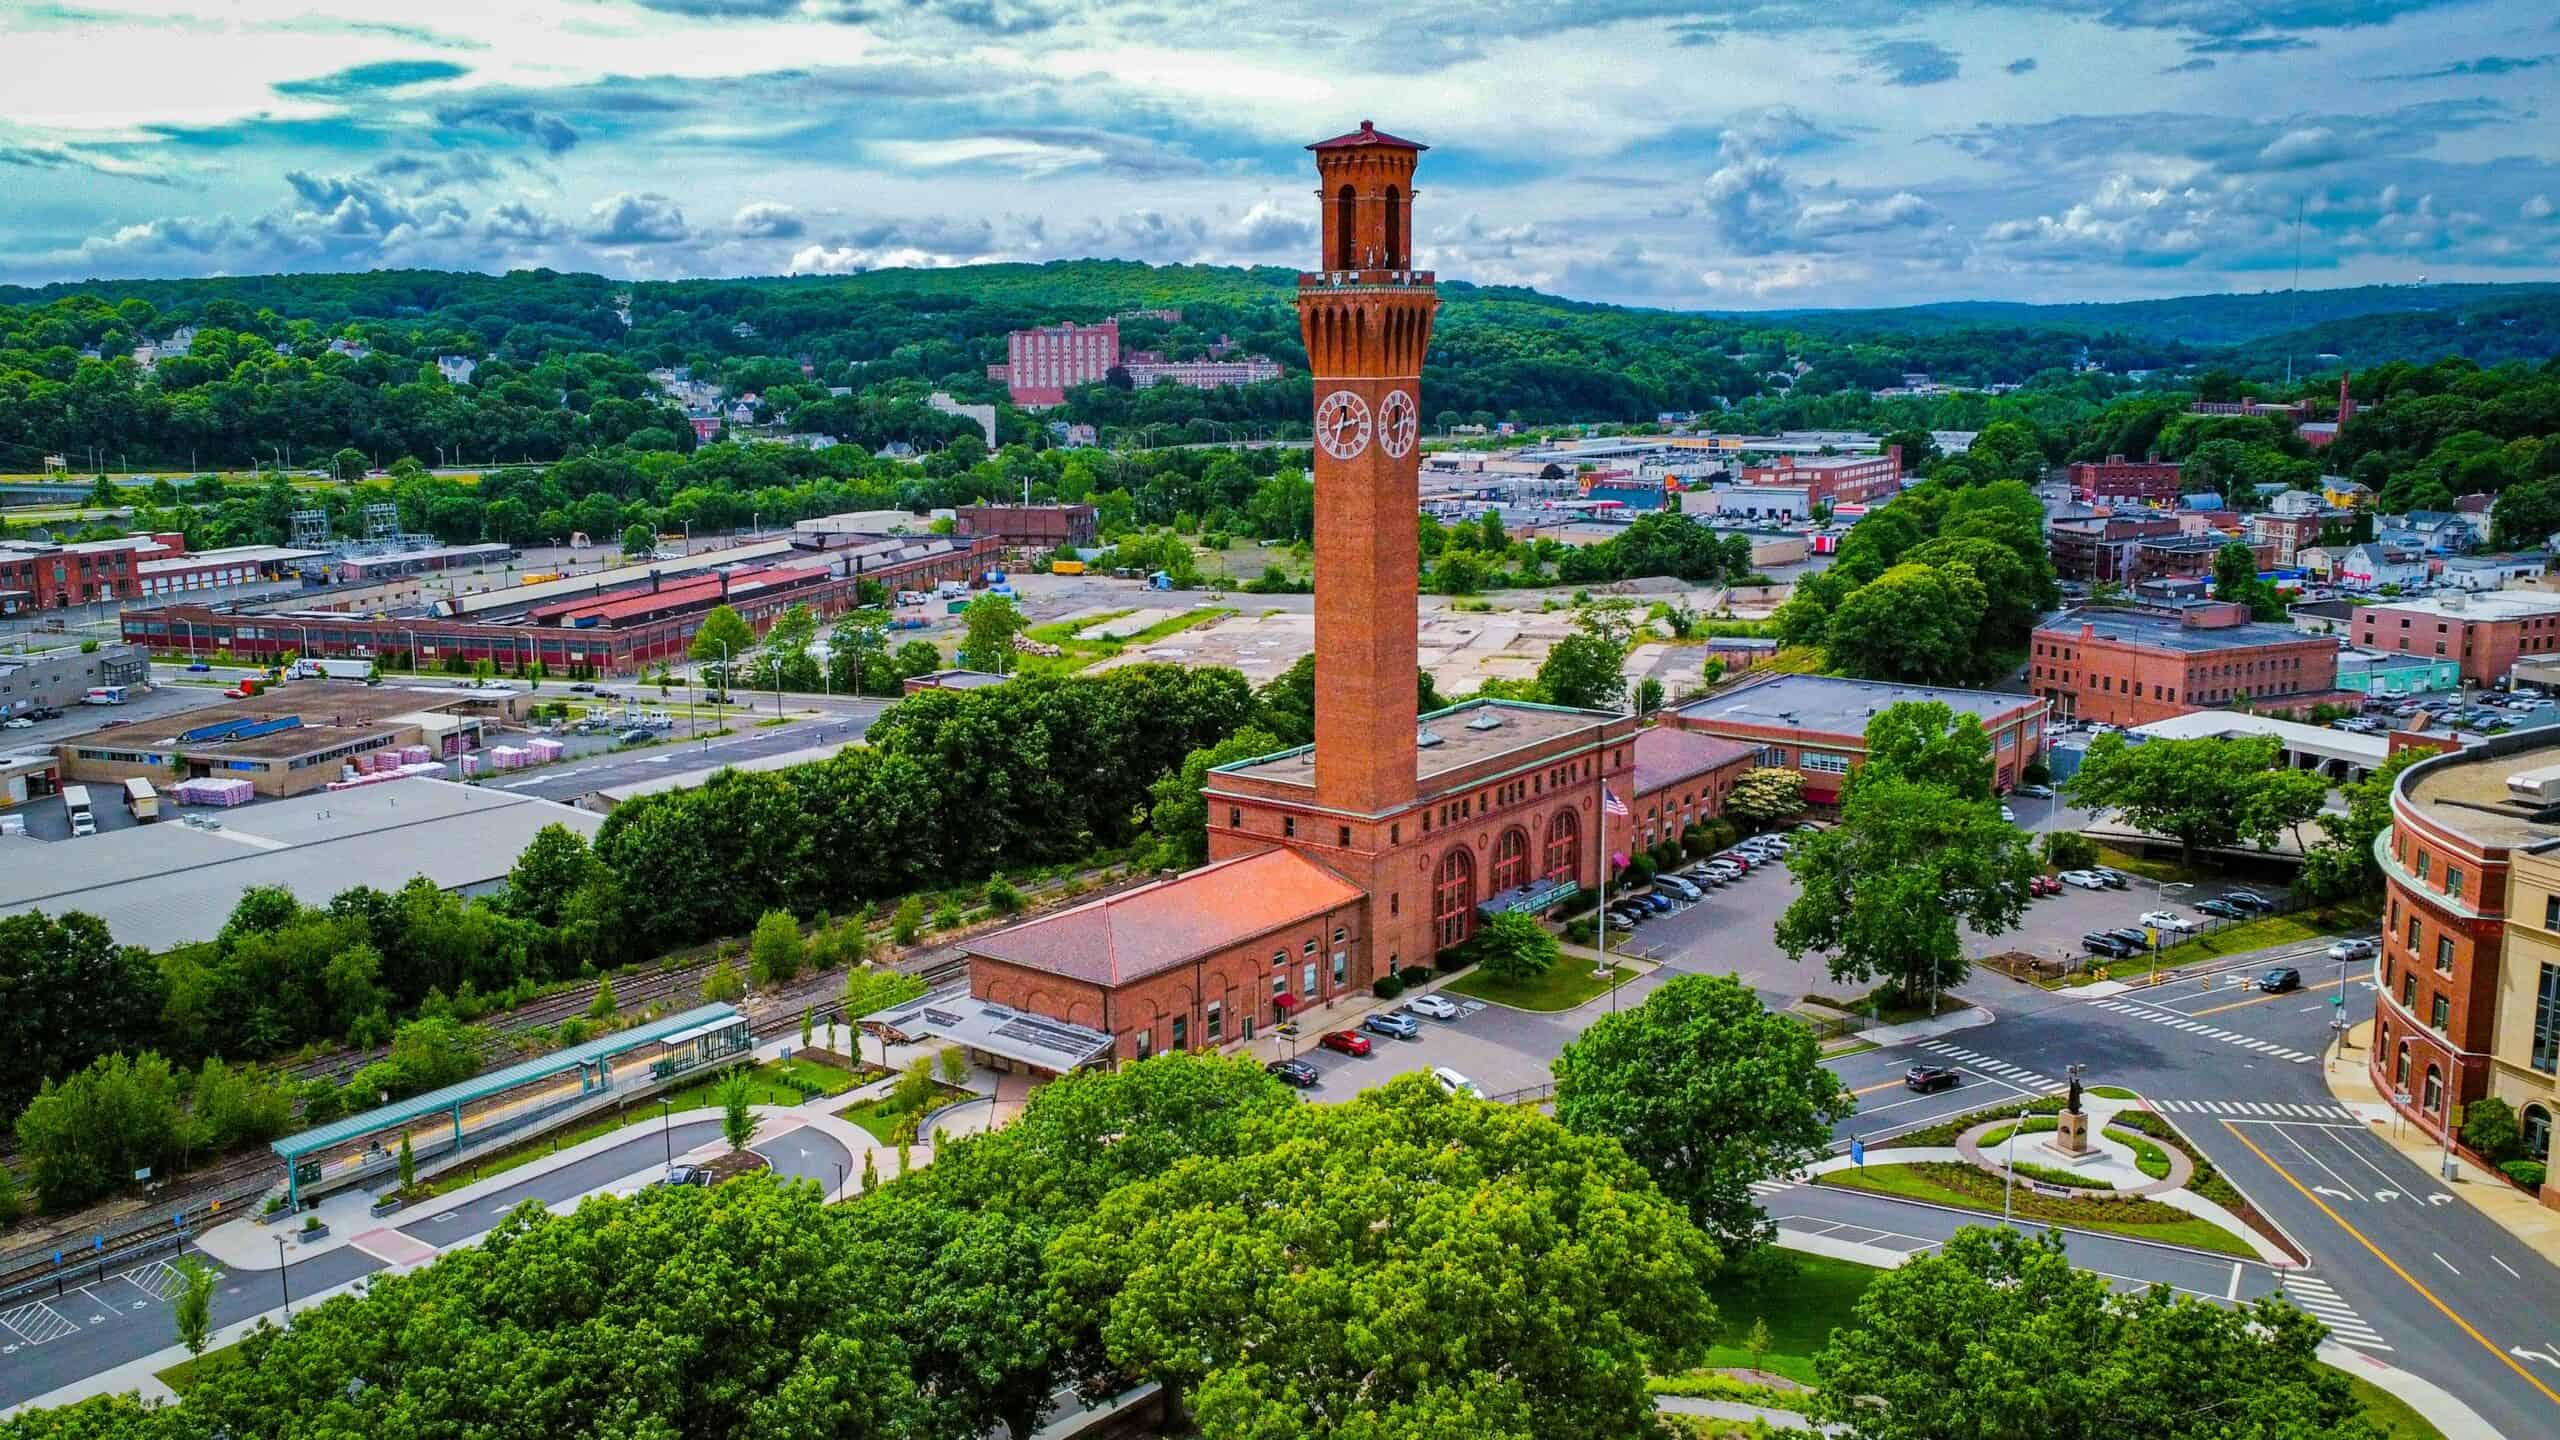
- All housing units spending more than 50% of income on housing: 23.2%
- Homeowners spending more than 50% of income on housing: 16.5%
- Renters spending more than 50% of income on housing: 28.7%
- Median household income: $51,642
- Median home value: $185,400
20. Burbank, CA

- All housing units spending more than 50% of income on housing: 23.3%
- Homeowners spending more than 50% of income on housing: 13.6%
- Renters spending more than 50% of income on housing: 30.6%
- Median household income: $95,816
- Median home value: $1,041,100
19. New York, NY

- All housing units spending more than 50% of income on housing: 23.4%
- Homeowners spending more than 50% of income on housing: 17.8%
- Renters spending more than 50% of income on housing: 26.1%
- Median household income: $79,713
- Median home value: $751,700
18. New Haven, CT

- All housing units spending more than 50% of income on housing: 23.6%
- Homeowners spending more than 50% of income on housing: 15.8%
- Renters spending more than 50% of income on housing: 26.6%
- Median household income: $53,771
- Median home value: $249,000
17. Miami Gardens, FL
- All housing units spending more than 50% of income on housing: 23.8%
- Homeowners spending more than 50% of income on housing: 19.0%
- Renters spending more than 50% of income on housing: 33.0%
- Median household income: $60,979
- Median home value: $337,200
16. Athens, GA

- All housing units spending more than 50% of income on housing: 24.0%
- Homeowners spending more than 50% of income on housing: 9.3%
- Renters spending more than 50% of income on housing: 33.9%
- Median household income: $51,655
- Median home value: $271,800
15. Inglewood, CA
- All housing units spending more than 50% of income on housing: 24.0%
- Homeowners spending more than 50% of income on housing: 17.0%
- Renters spending more than 50% of income on housing: 27.8%
- Median household income: $71,029
- Median home value: $744,300
14. Hollywood, FL
- All housing units spending more than 50% of income on housing: 24.6%
- Homeowners spending more than 50% of income on housing: 16.9%
- Renters spending more than 50% of income on housing: 35.5%
- Median household income: $65,359
- Median home value: $374,200
13. El Monte, CA

- All housing units spending more than 50% of income on housing: 25.0%
- Homeowners spending more than 50% of income on housing: 17.6%
- Renters spending more than 50% of income on housing: 29.9%
- Median household income: $64,484
- Median home value: $626,000
12. Hialeah, FL
- All housing units spending more than 50% of income on housing: 25.0%
- Homeowners spending more than 50% of income on housing: 17.9%
- Renters spending more than 50% of income on housing: 31.3%
- Median household income: $53,079
- Median home value: $359,200
11. Bridgeport, CT

- All housing units spending more than 50% of income on housing: 25.4%
- Homeowners spending more than 50% of income on housing: 18.2%
- Renters spending more than 50% of income on housing: 30.9%
- Median household income: $56,584
- Median home value: $252,400
10. Los Angeles, CA

- All housing units spending more than 50% of income on housing: 25.9%
- Homeowners spending more than 50% of income on housing: 19.0%
- Renters spending more than 50% of income on housing: 29.9%
- Median household income: $80,366
- Median home value: $879,500
9. Hartford, CT

- All housing units spending more than 50% of income on housing: 26.0%
- Homeowners spending more than 50% of income on housing: 15.4%
- Renters spending more than 50% of income on housing: 29.6%
- Median household income: $45,300
- Median home value: $217,200
8. Gainesville, FL
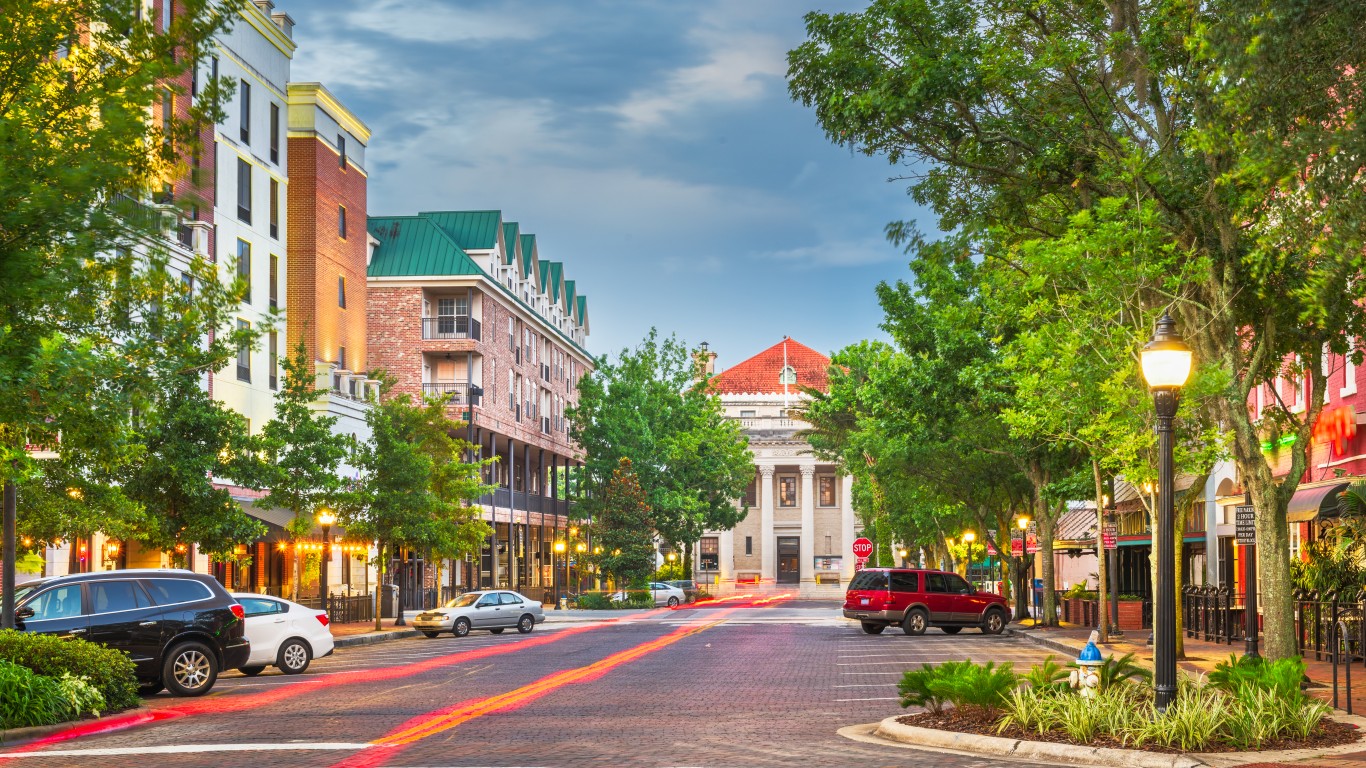
- All housing units spending more than 50% of income on housing: 26.2%
- Homeowners spending more than 50% of income on housing: 10.1%
- Renters spending more than 50% of income on housing: 36.3%
- Median household income: $45,611
- Median home value: $235,000
7. College Station, TX

- All housing units spending more than 50% of income on housing: 26.4%
- Homeowners spending more than 50% of income on housing: 9.9%
- Renters spending more than 50% of income on housing: 35.6%
- Median household income: $51,776
- Median home value: $326,500
6. Miami, FL

- All housing units spending more than 50% of income on housing: 26.8%
- Homeowners spending more than 50% of income on housing: 18.2%
- Renters spending more than 50% of income on housing: 30.6%
- Median household income: $59,390
- Median home value: $475,200
5. Boulder, CO
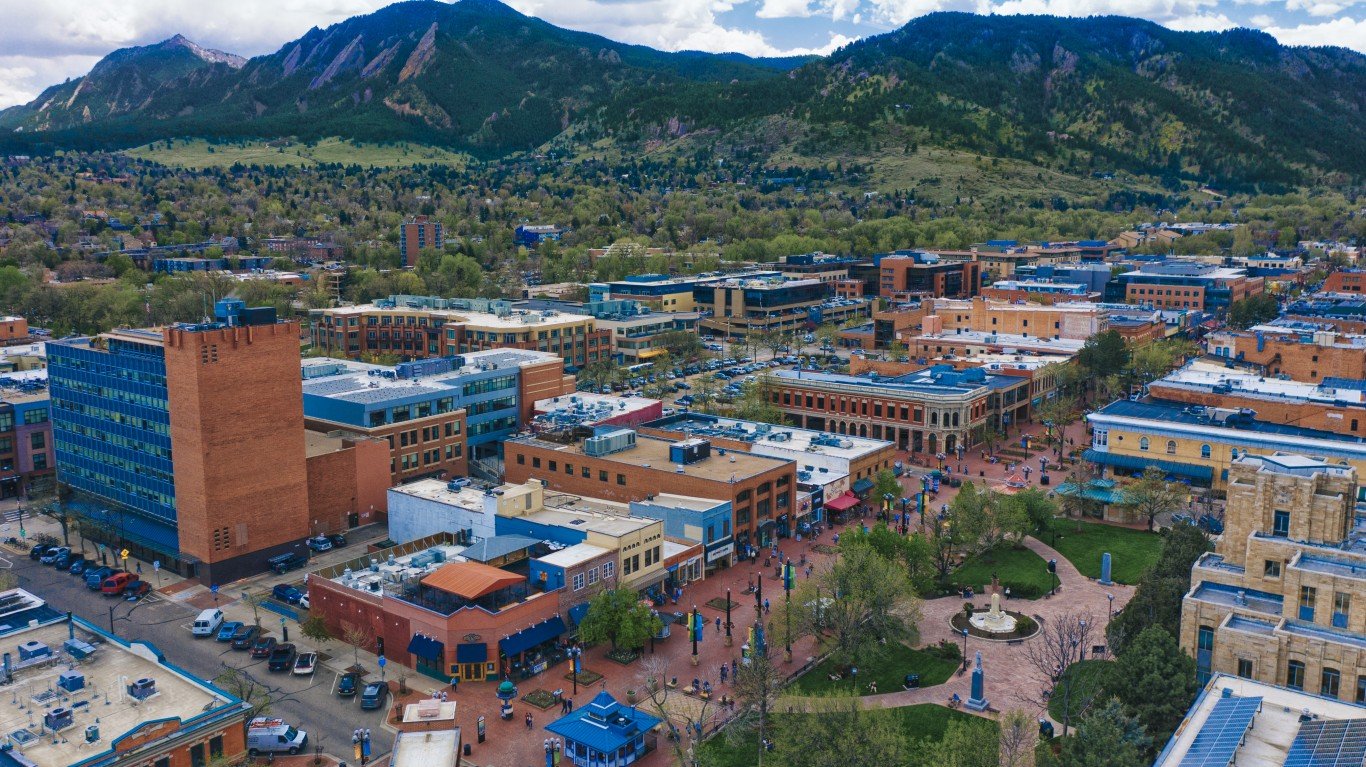
- All housing units spending more than 50% of income on housing: 27.0%
- Homeowners spending more than 50% of income on housing: 10.5%
- Renters spending more than 50% of income on housing: 42.1%
- Median household income: $85,364
- Median home value: $982,600
4. Newark, NJ

- All housing units spending more than 50% of income on housing: 27.8%
- Homeowners spending more than 50% of income on housing: 23.9%
- Renters spending more than 50% of income on housing: 29.0%
- Median household income: $48,416
- Median home value: $337,800
3. El Cajon, CA

- All housing units spending more than 50% of income on housing: 28.5%
- Homeowners spending more than 50% of income on housing: 16.9%
- Renters spending more than 50% of income on housing: 36.6%
- Median household income: $66,478
- Median home value: $632,800
2. Paterson, NJ
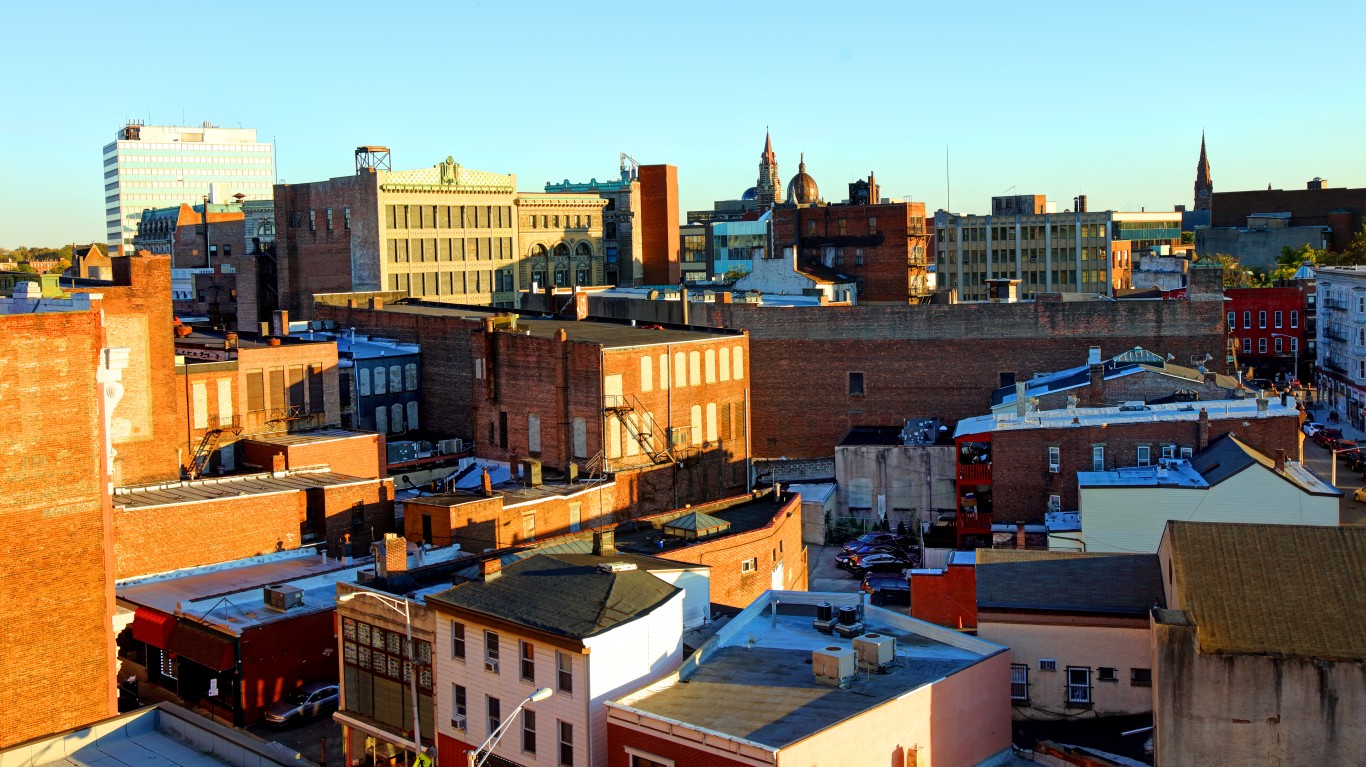
- All housing units spending more than 50% of income on housing: 28.9%
- Homeowners spending more than 50% of income on housing: 20.6%
- Renters spending more than 50% of income on housing: 31.9%
- Median household income: $53,766
- Median home value: $335,400
1. Glendale, CA
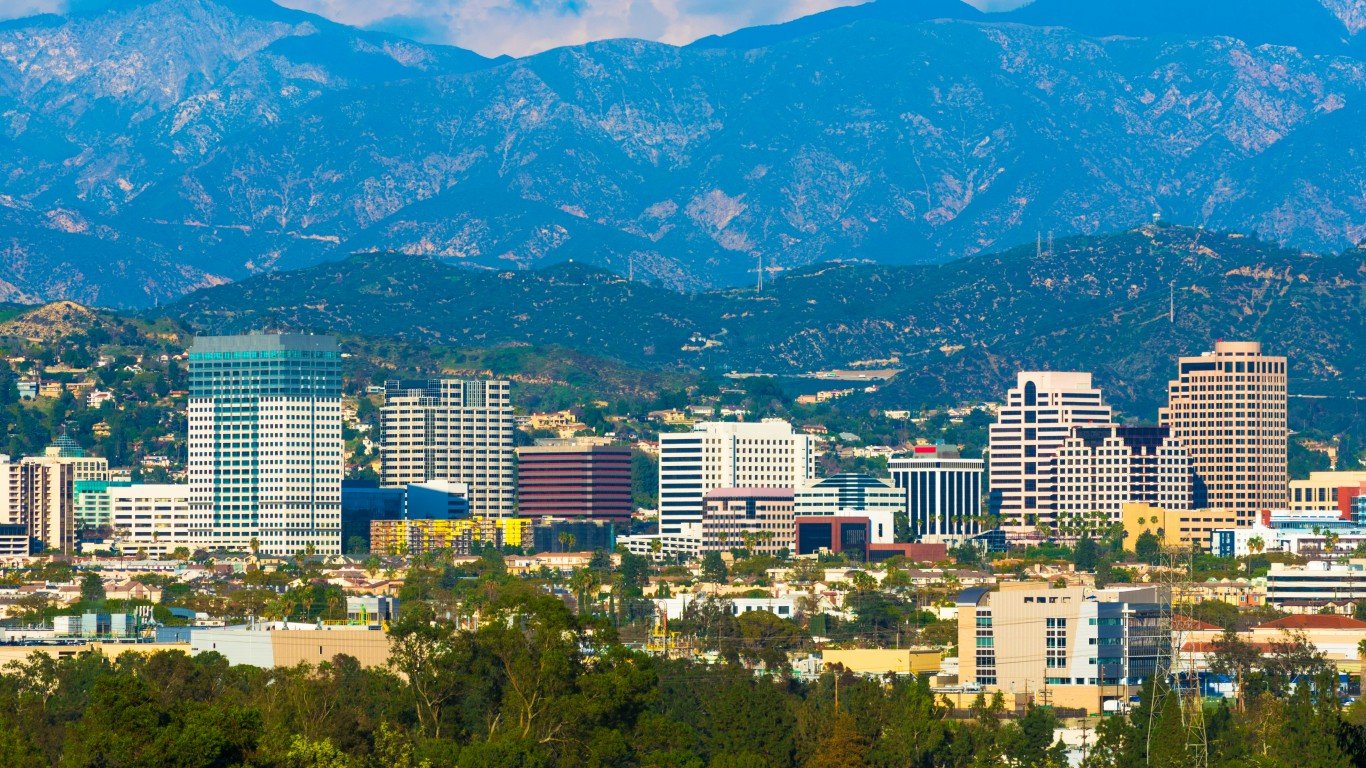
- All housing units spending more than 50% of income on housing: 31.2%
- Homeowners spending more than 50% of income on housing: 18.8%
- Renters spending more than 50% of income on housing: 38.0%
- Median household income: $84,262
- Median home value: $1,043,900
The post Homebuyers Are Seriously Stretching Their Budget to Buy Housing in These Cities appeared first on 24/7 Wall St..