


Fast Food Costs a Fortune in These States
Fast-food has long been known for its addicting taste, convenience, and affordability. However, some U.S. residents can cross “affordability” off the list. Prices for many fast-food favorites have risen almost 47% in the past 10 years, according to the Bureau of Labor Statistics. WalletHub was curious to see which states are home to the least […] The post Fast Food Costs a Fortune in These States appeared first on 24/7 Wall St..
Fast-food has long been known for its addicting taste, convenience, and affordability. However, some U.S. residents can cross “affordability” off the list. Prices for many fast-food favorites have risen almost 47% in the past 10 years, according to the Bureau of Labor Statistics. WalletHub was curious to see which states are home to the least affordable fast-food. They took a look at the cost of fast-food in each state, comparing it to median monthly income. The analysis revealed major differences between states.
The study evaluated the cost of three specific items (a burger, a small pizza, and a fried chicken sandwich) to see how they matched up to median income within each specific state. You might be surprised to see which states make the list, with New Mexico ranking toward the top. Residents of this western state dole out around 0.47% of their monthly wage just to obtain a few menu items.
In this slideshow, we’ll reveal the results of WalletHub’s intriguing study, focusing on the top 15 states where fast-food eats up a sizable portion of monthly income. If you’ve realized your addiction to convenience foods has made a dent in your budget, you may be curious to see if your state ranks towards the top.
15. Missouri
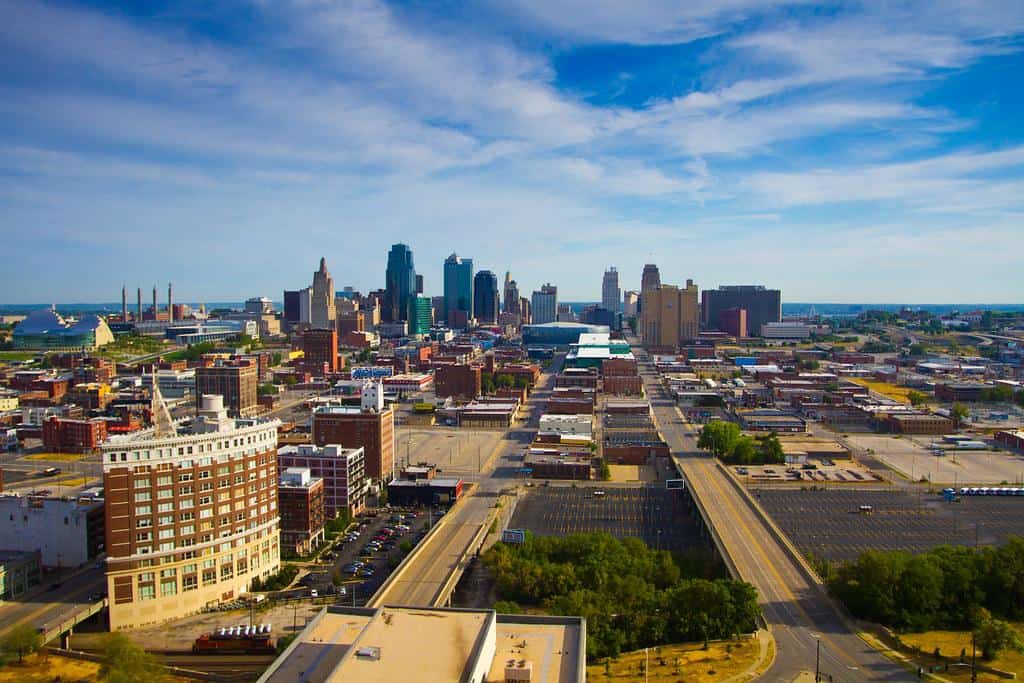
- Monthly Median Income: $5,712
- Cost of 3 specific fast-food menu items: $21.70
- Cost of Fast Food as Percentage of Income: 0.38
14. Arizona

- Monthly Median Income: $6,443
- Cost of 3 specific fast-food menu items: $25.12
- Cost of Fast Food as Percentage of Income: 0.39
13. Maine

- Monthly Median Income: $6,145
- Cost of 3 specific fast-food menu items: $24.58
- Cost of Fast Food as Percentage of Income: 0.40
12. South Carolina
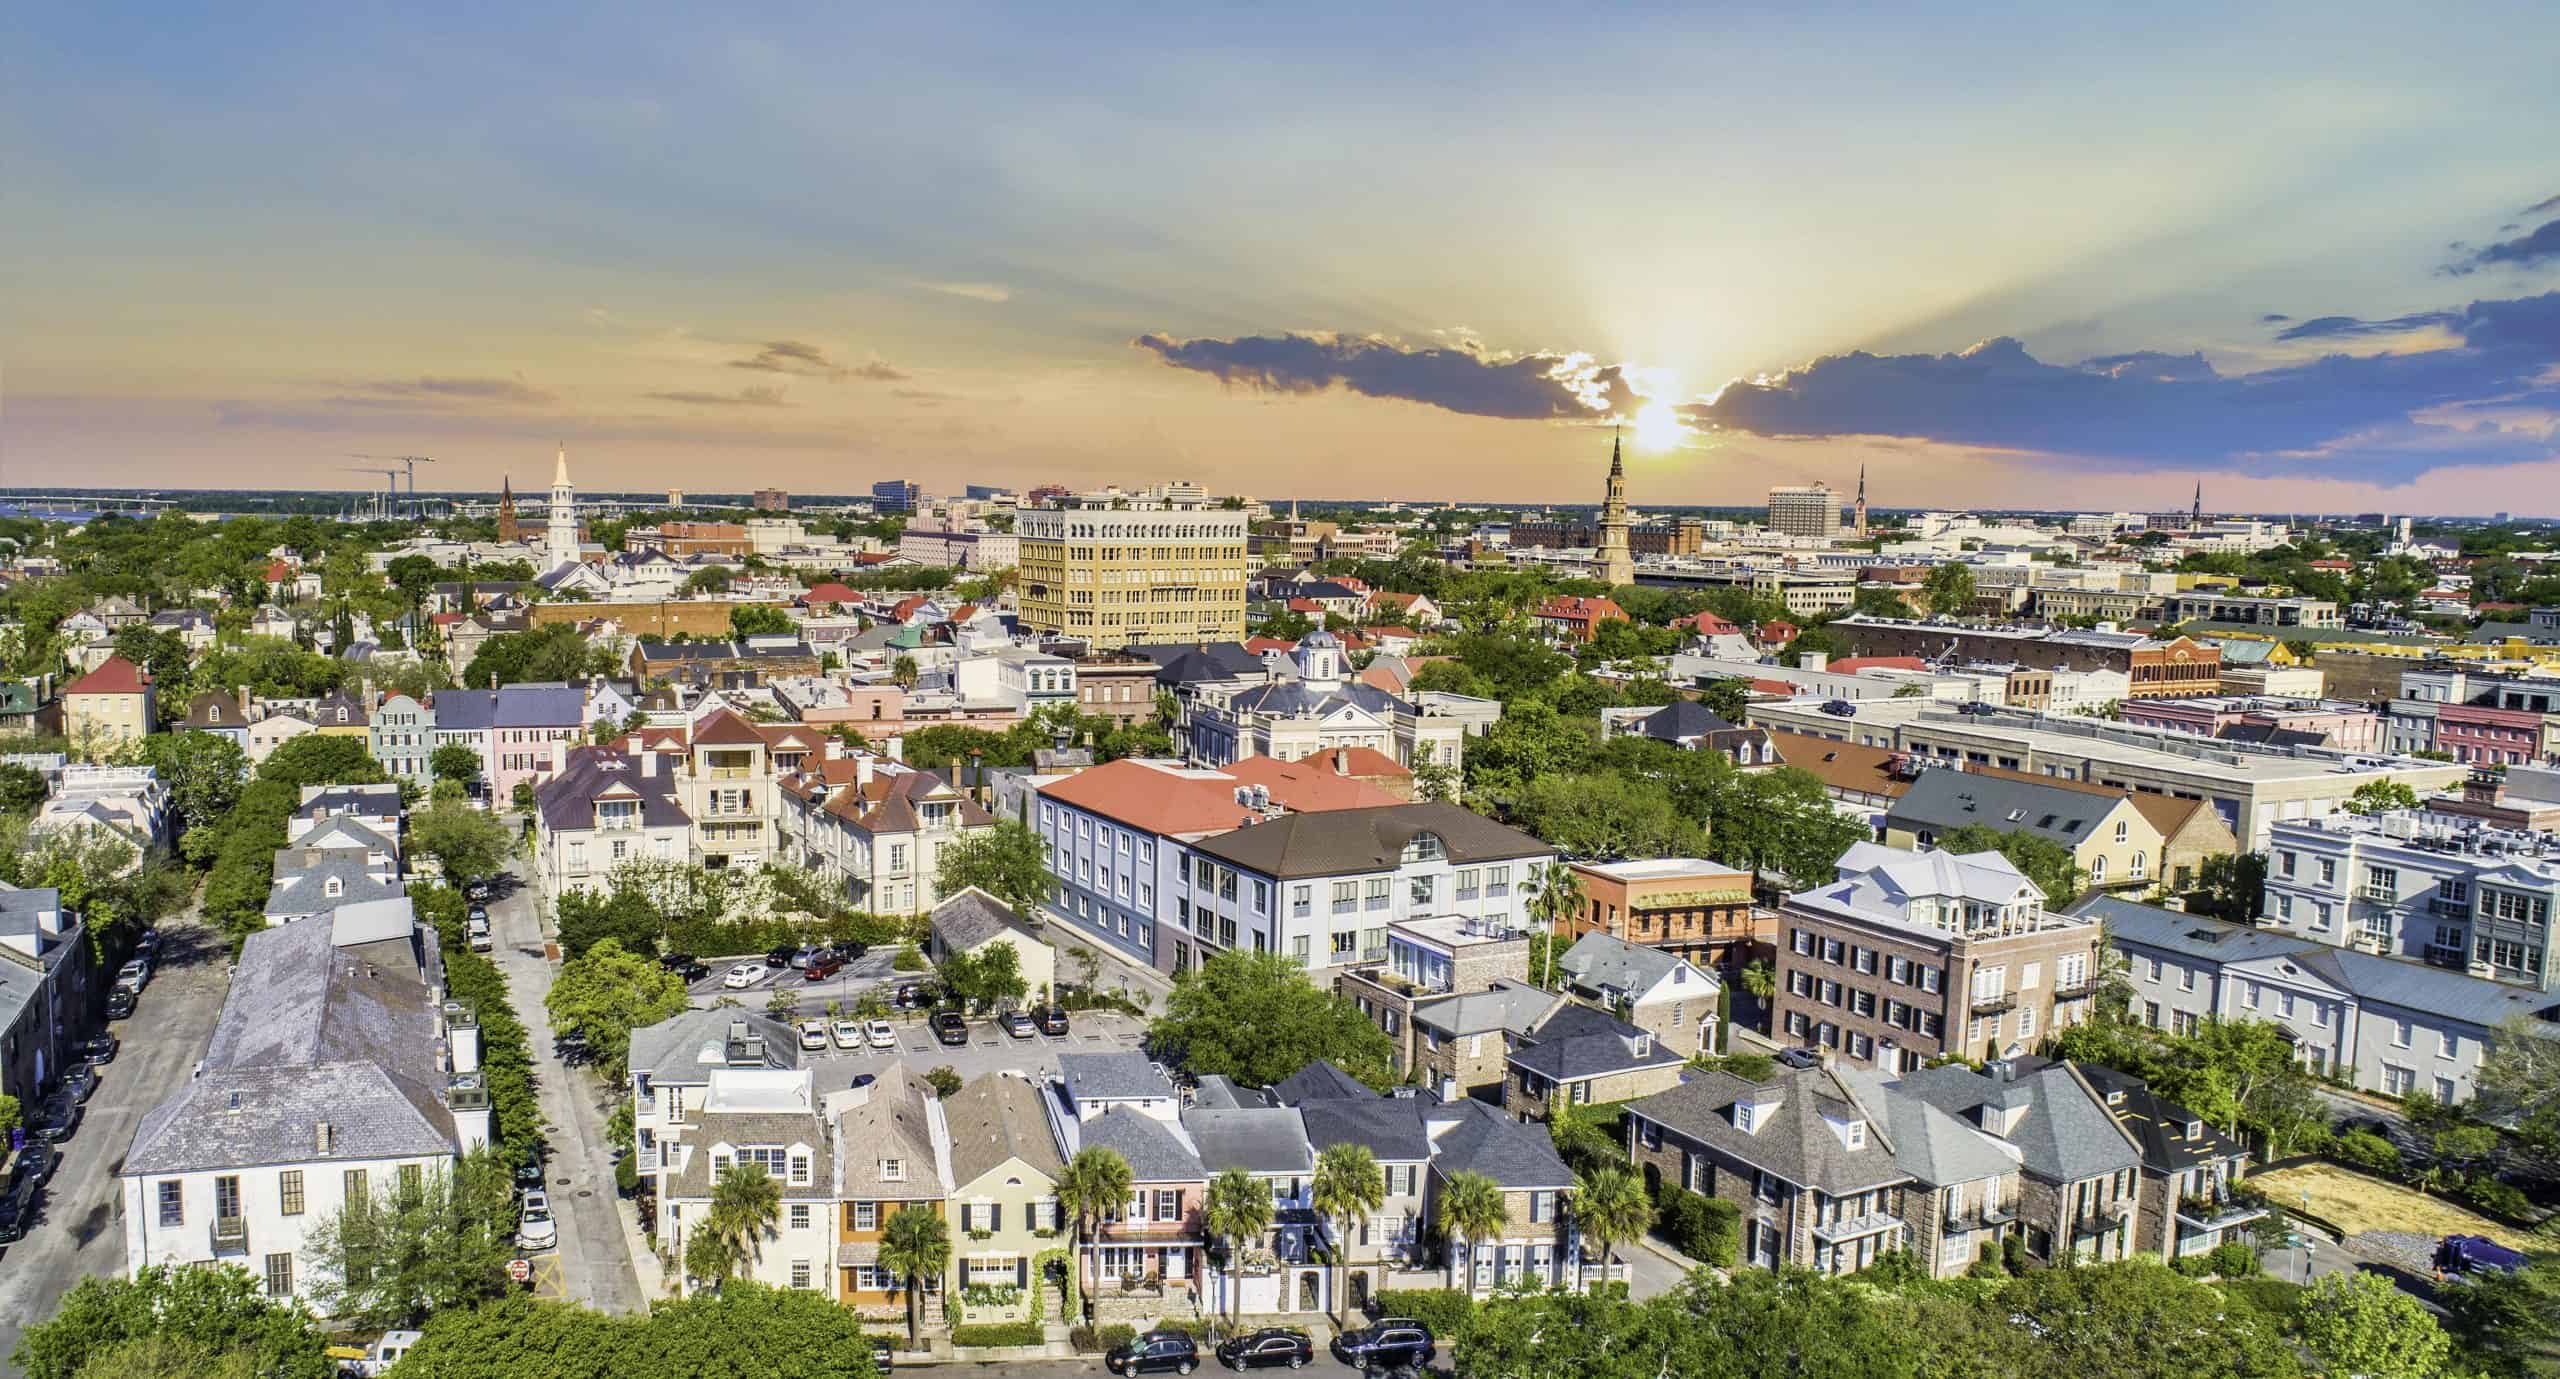
- Monthly Median Income: $5,650
- Cost of 3 specific fast-food menu items: $23.16
- Cost of Fast Food as Percentage of Income: 0.41
11. Florida
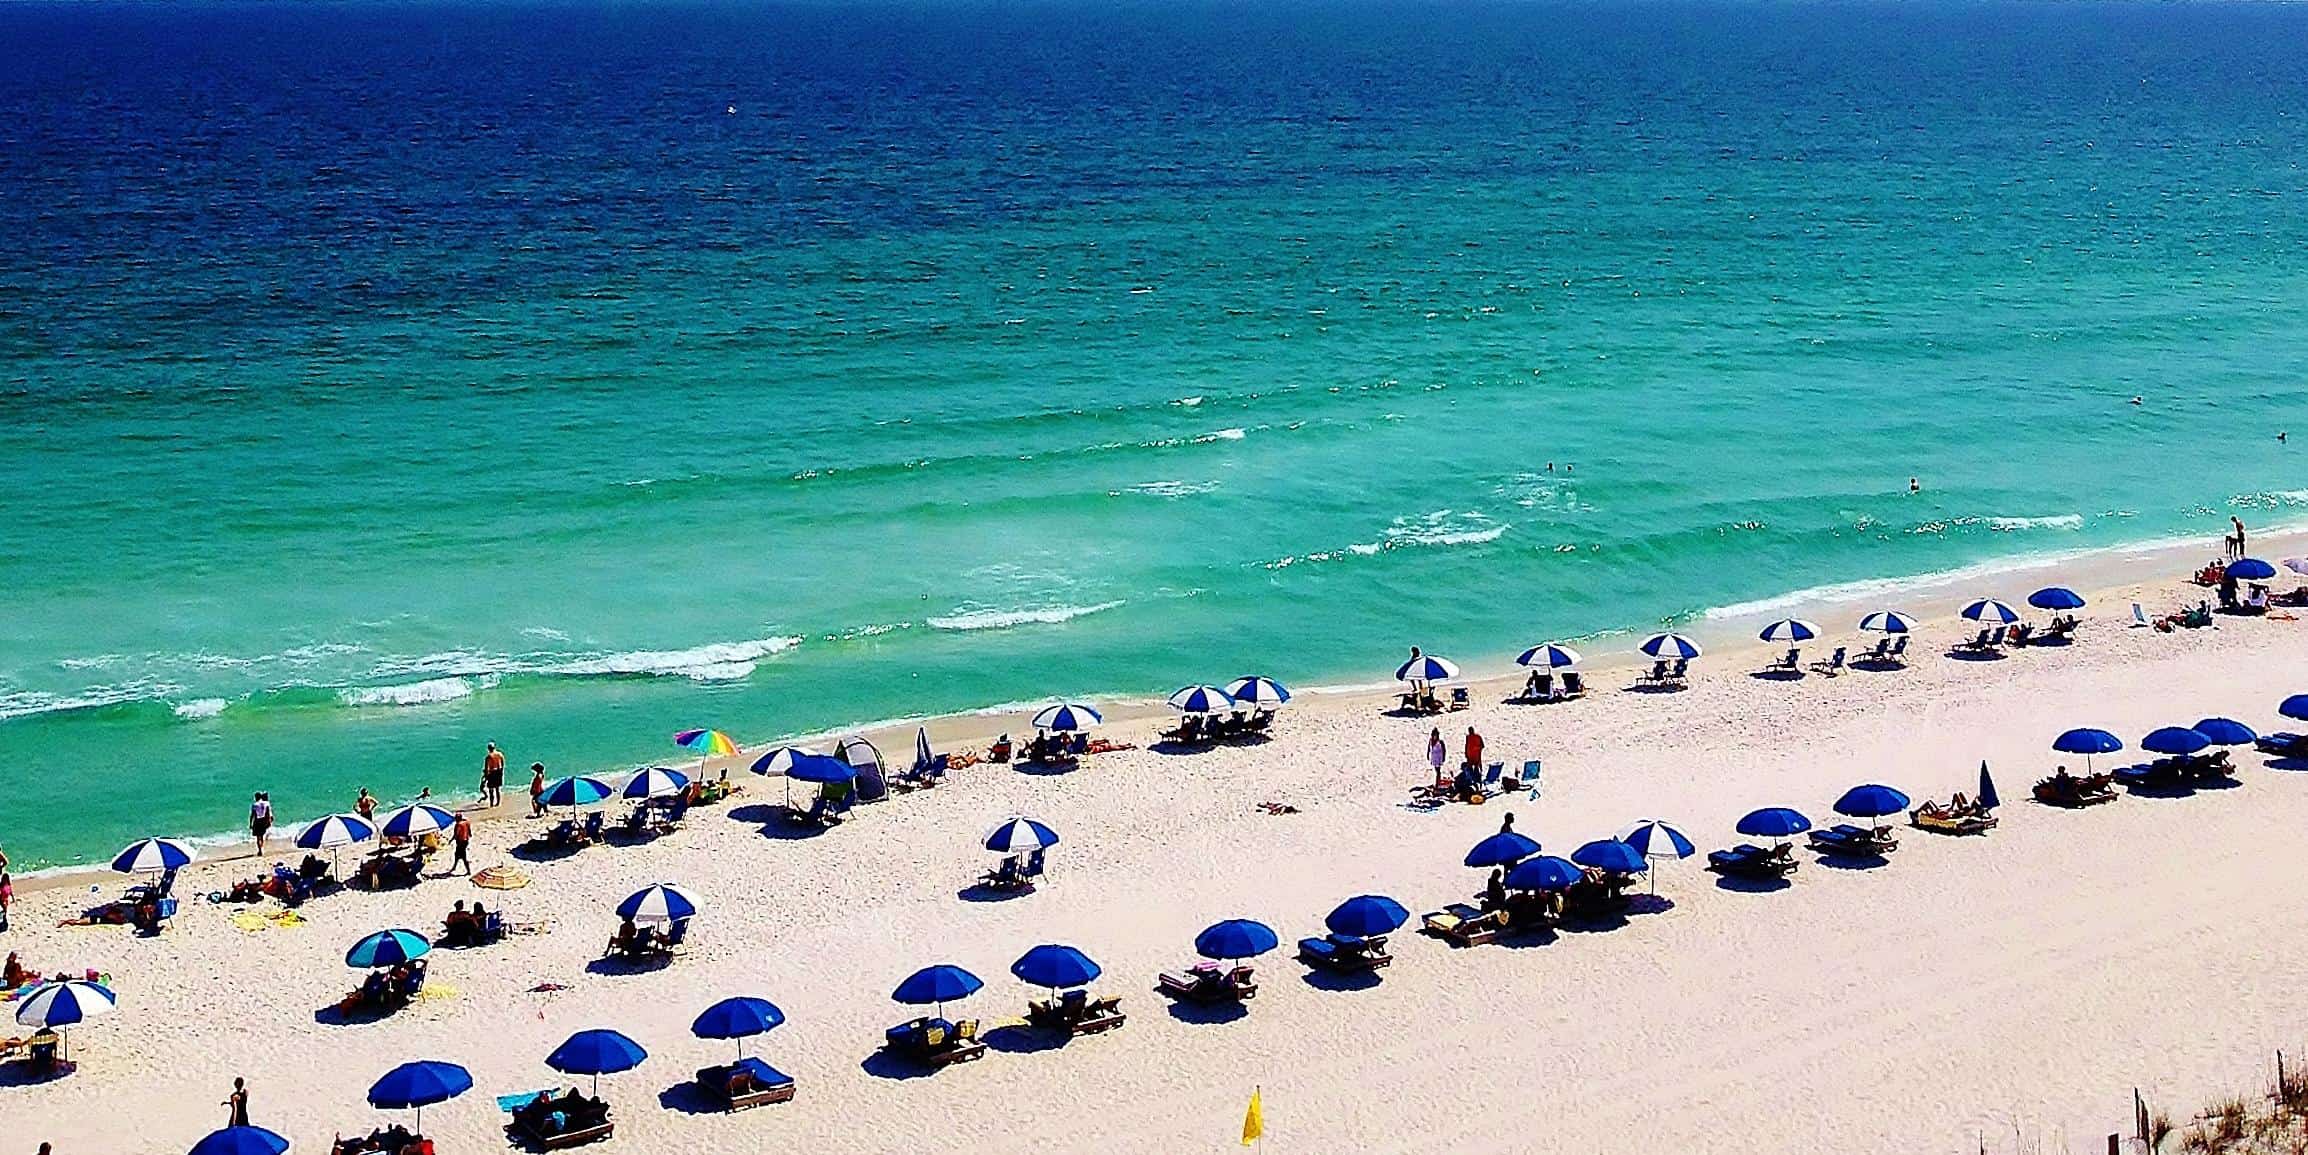
- Monthly Median Income: $6,109
- Cost of 3 specific fast-food menu items: $25.04
- Cost of Fast Food as Percentage of Income: 0.41
10. Vermont

- Monthly Median Income: $6,767
- Cost of 3 specific fast-food menu items: $28.42
- Cost of Fast Food as Percentage of Income: 0.42
9. Oklahoma

- Monthly Median Income: $5,178
- Cost of 3 specific fast-food menu items: $21.74
- Cost of Fast Food as Percentage of Income: 0.42
8. Montana

- Monthly Median Income: $5,900
- Cost of 3 specific fast-food menu items: $25.37
- Cost of Fast Food as Percentage of Income: 0.43
7. Alabama
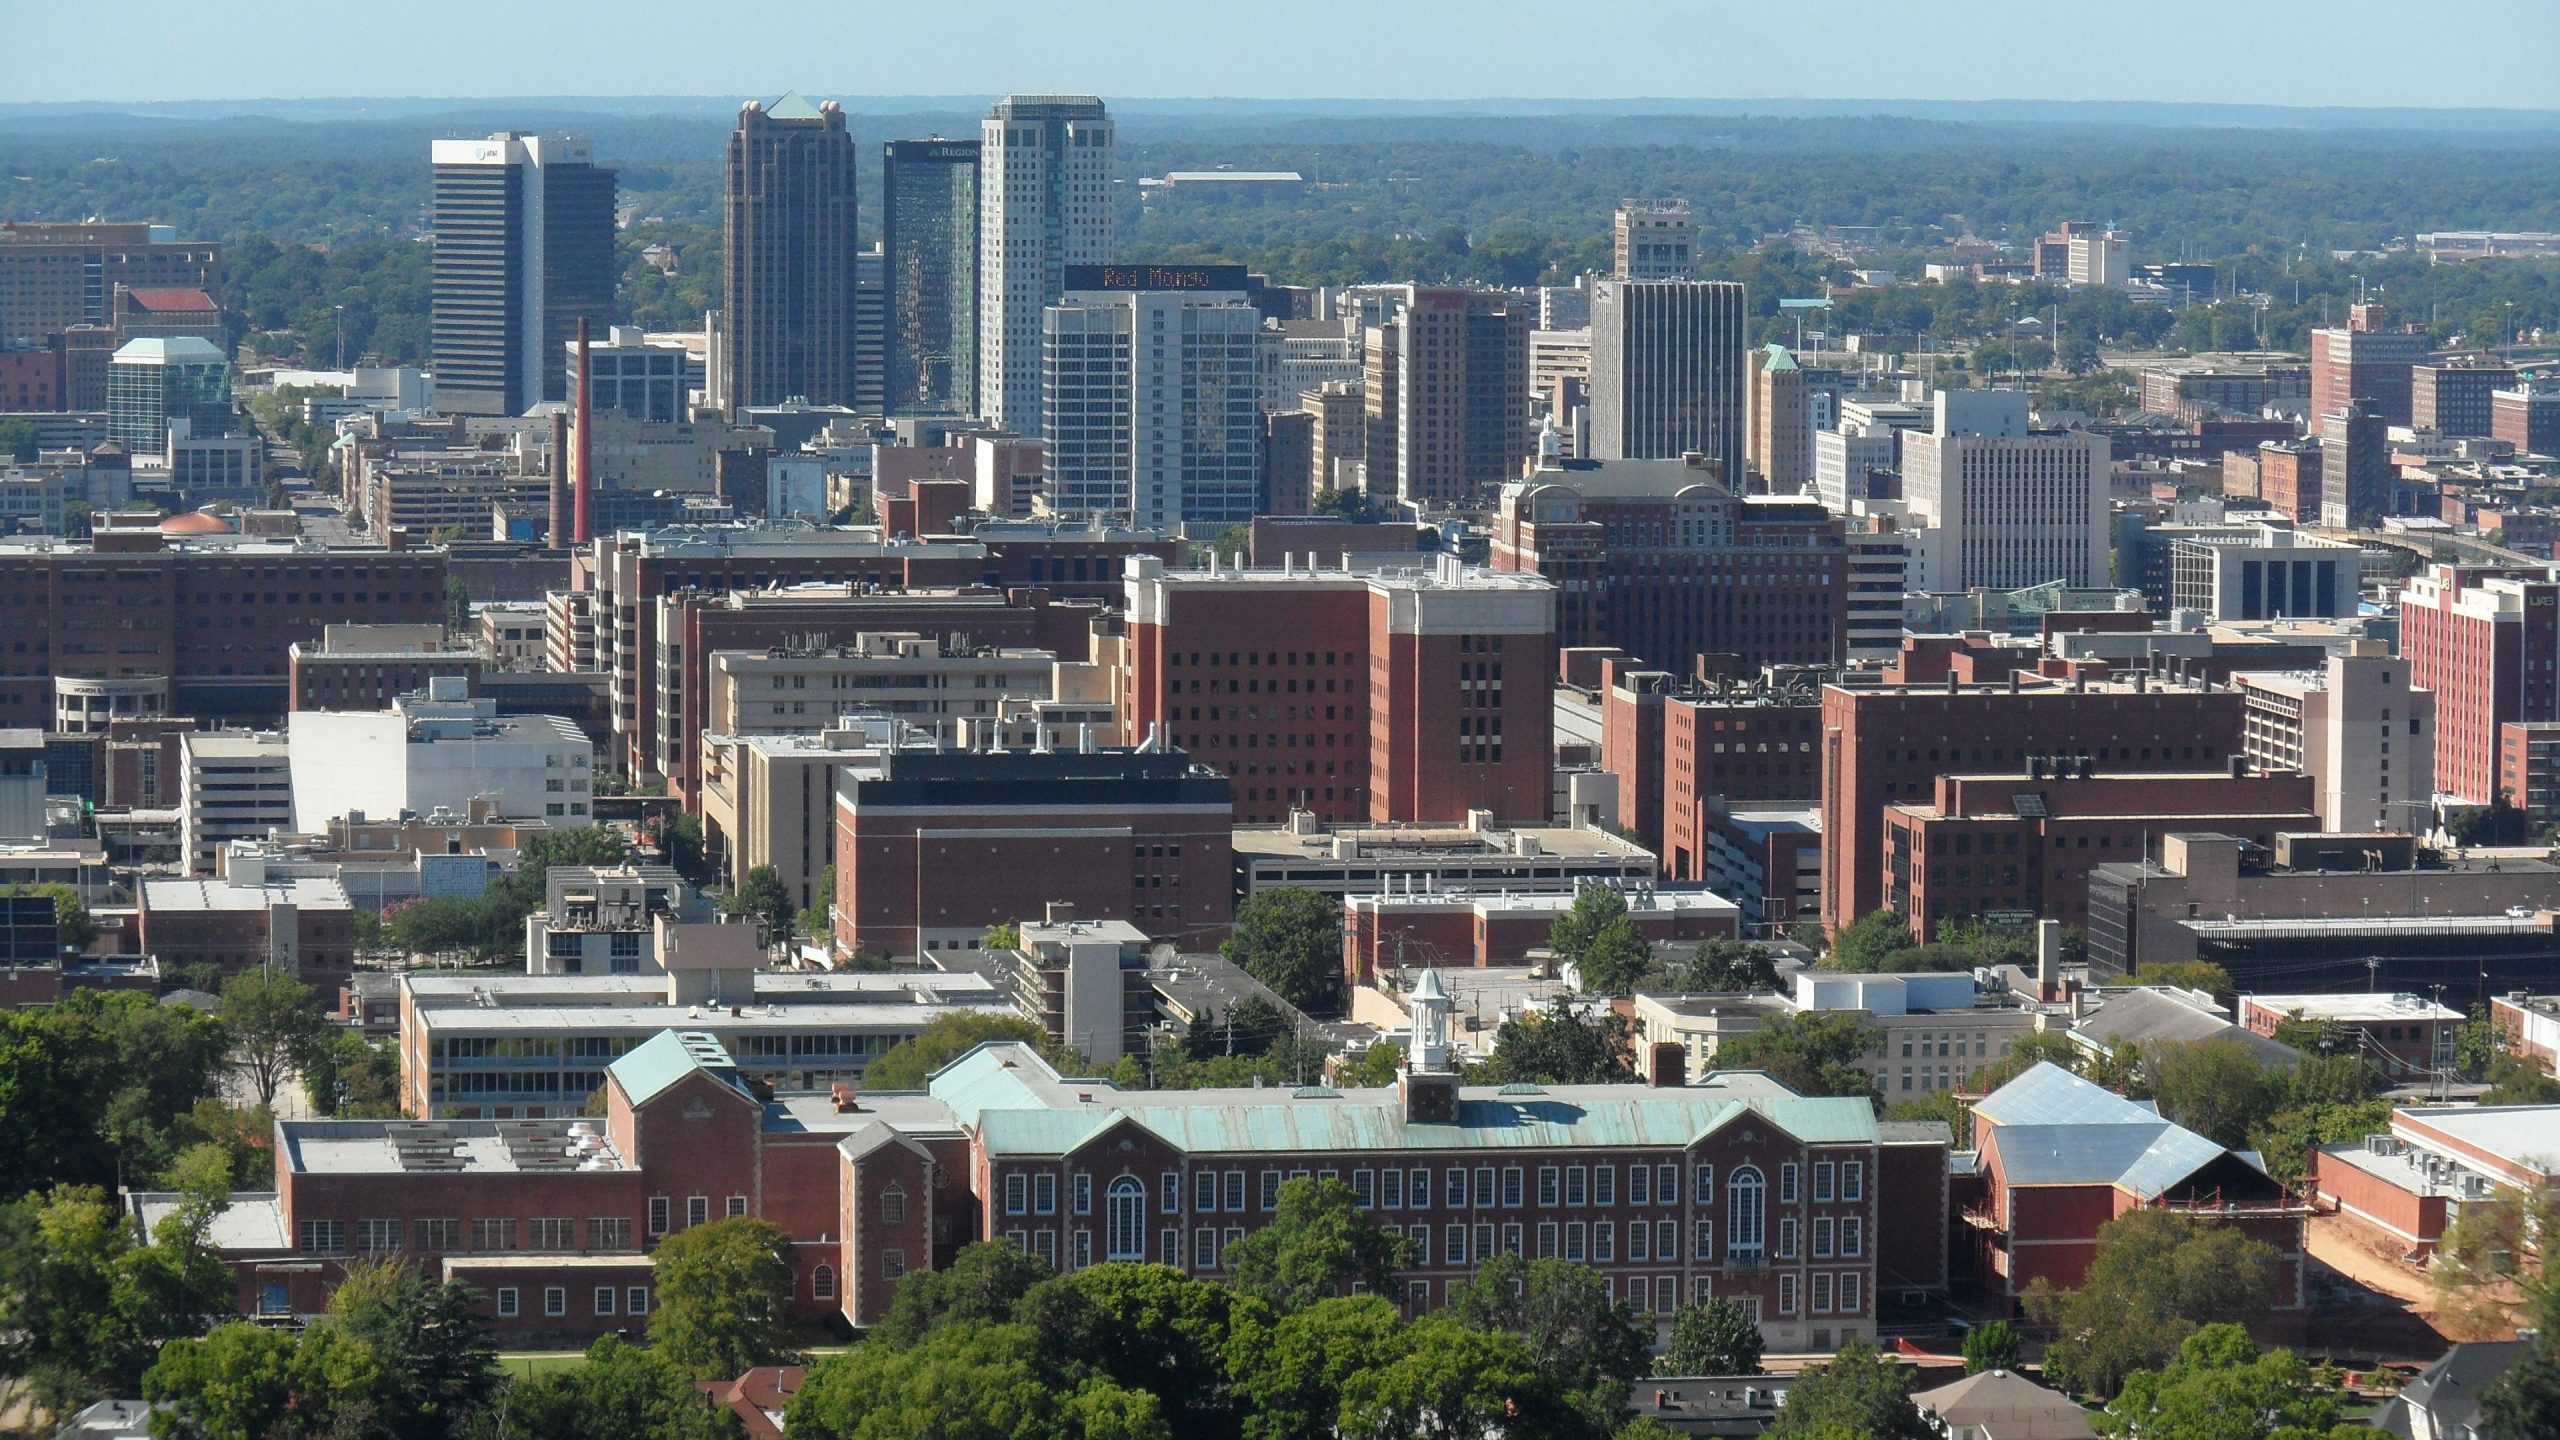
- Monthly Median Income: $5,184
- Cost of 3 specific fast-food menu items: $22.29
- Cost of Fast Food as Percentage of Income: 0.43
6. Louisiana
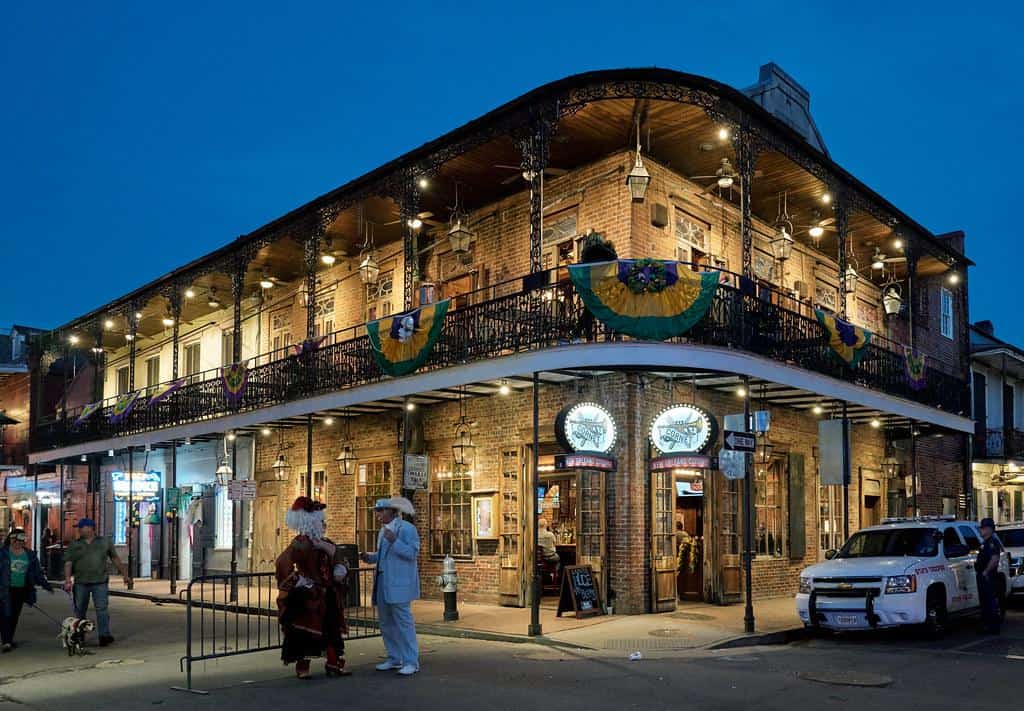
- Monthly Median Income: $4,804
- Cost of 3 specific fast-food menu items: $21.13
- Cost of Fast Food as Percentage of Income: 0.44
5. West Virginia

- Monthly Median Income: $4,662
- Cost of 3 specific fast-food menu items: $20.51
- Cost of Fast Food as Percentage of Income: 0.44
4. Arkansas

- Monthly Median Income: $4,898
- Cost of 3 specific fast-food menu items: $22.04
- Cost of Fast Food as Percentage of Income: 0.45
3. Kentucky
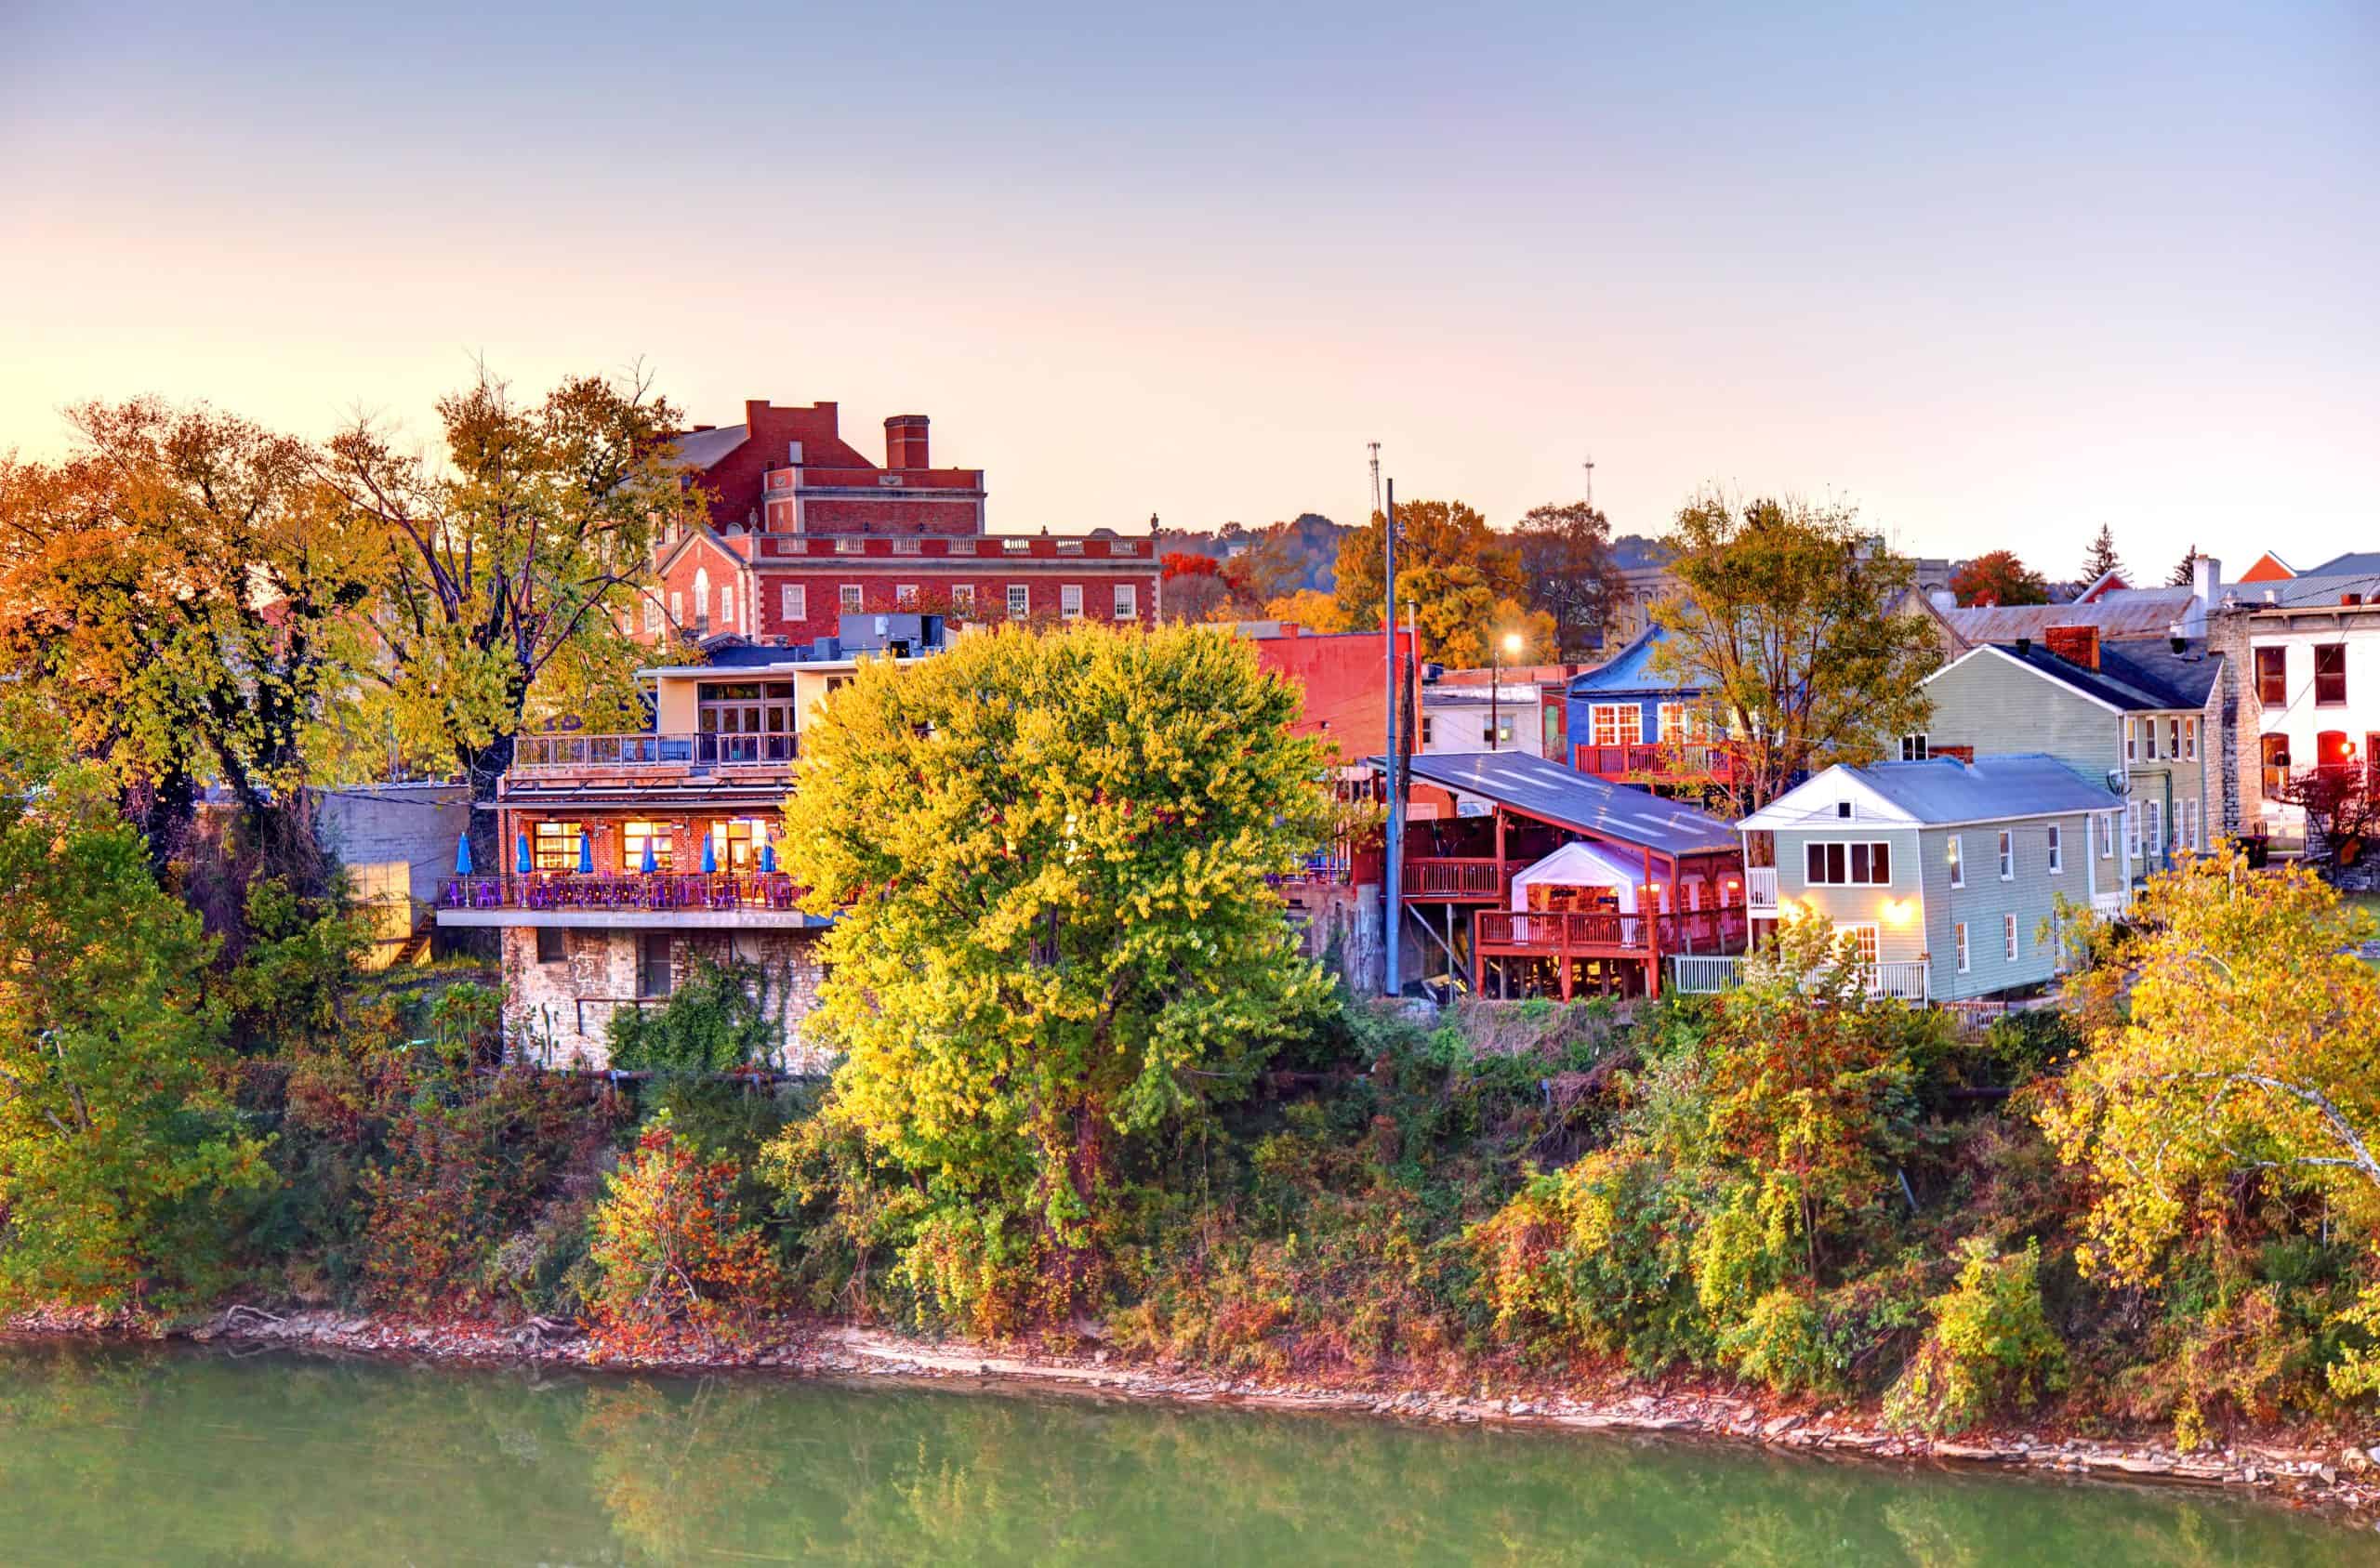
- Monthly Median Income: $5,165
- Cost of 3 specific fast-food menu items: $23.75
- Cost of Fast Food as Percentage of Income: 0.46
2. New Mexico
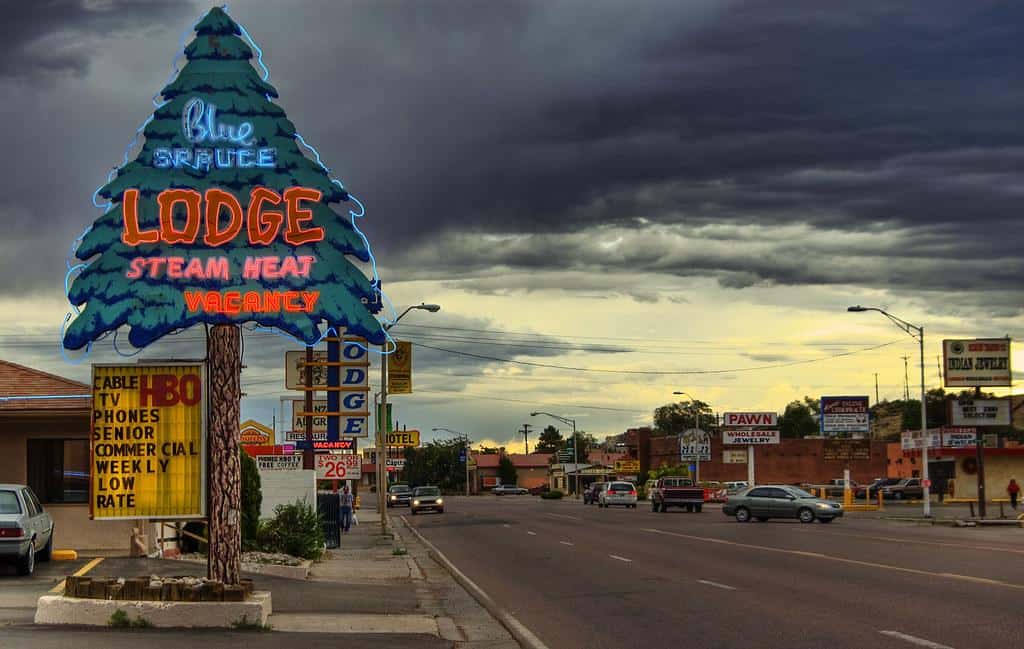
- Monthly Median Income: $5,177
- Cost of 3 specific fast-food menu items: $24.33
- Cost of Fast Food as Percentage of Income: 0.47
1. Mississippi
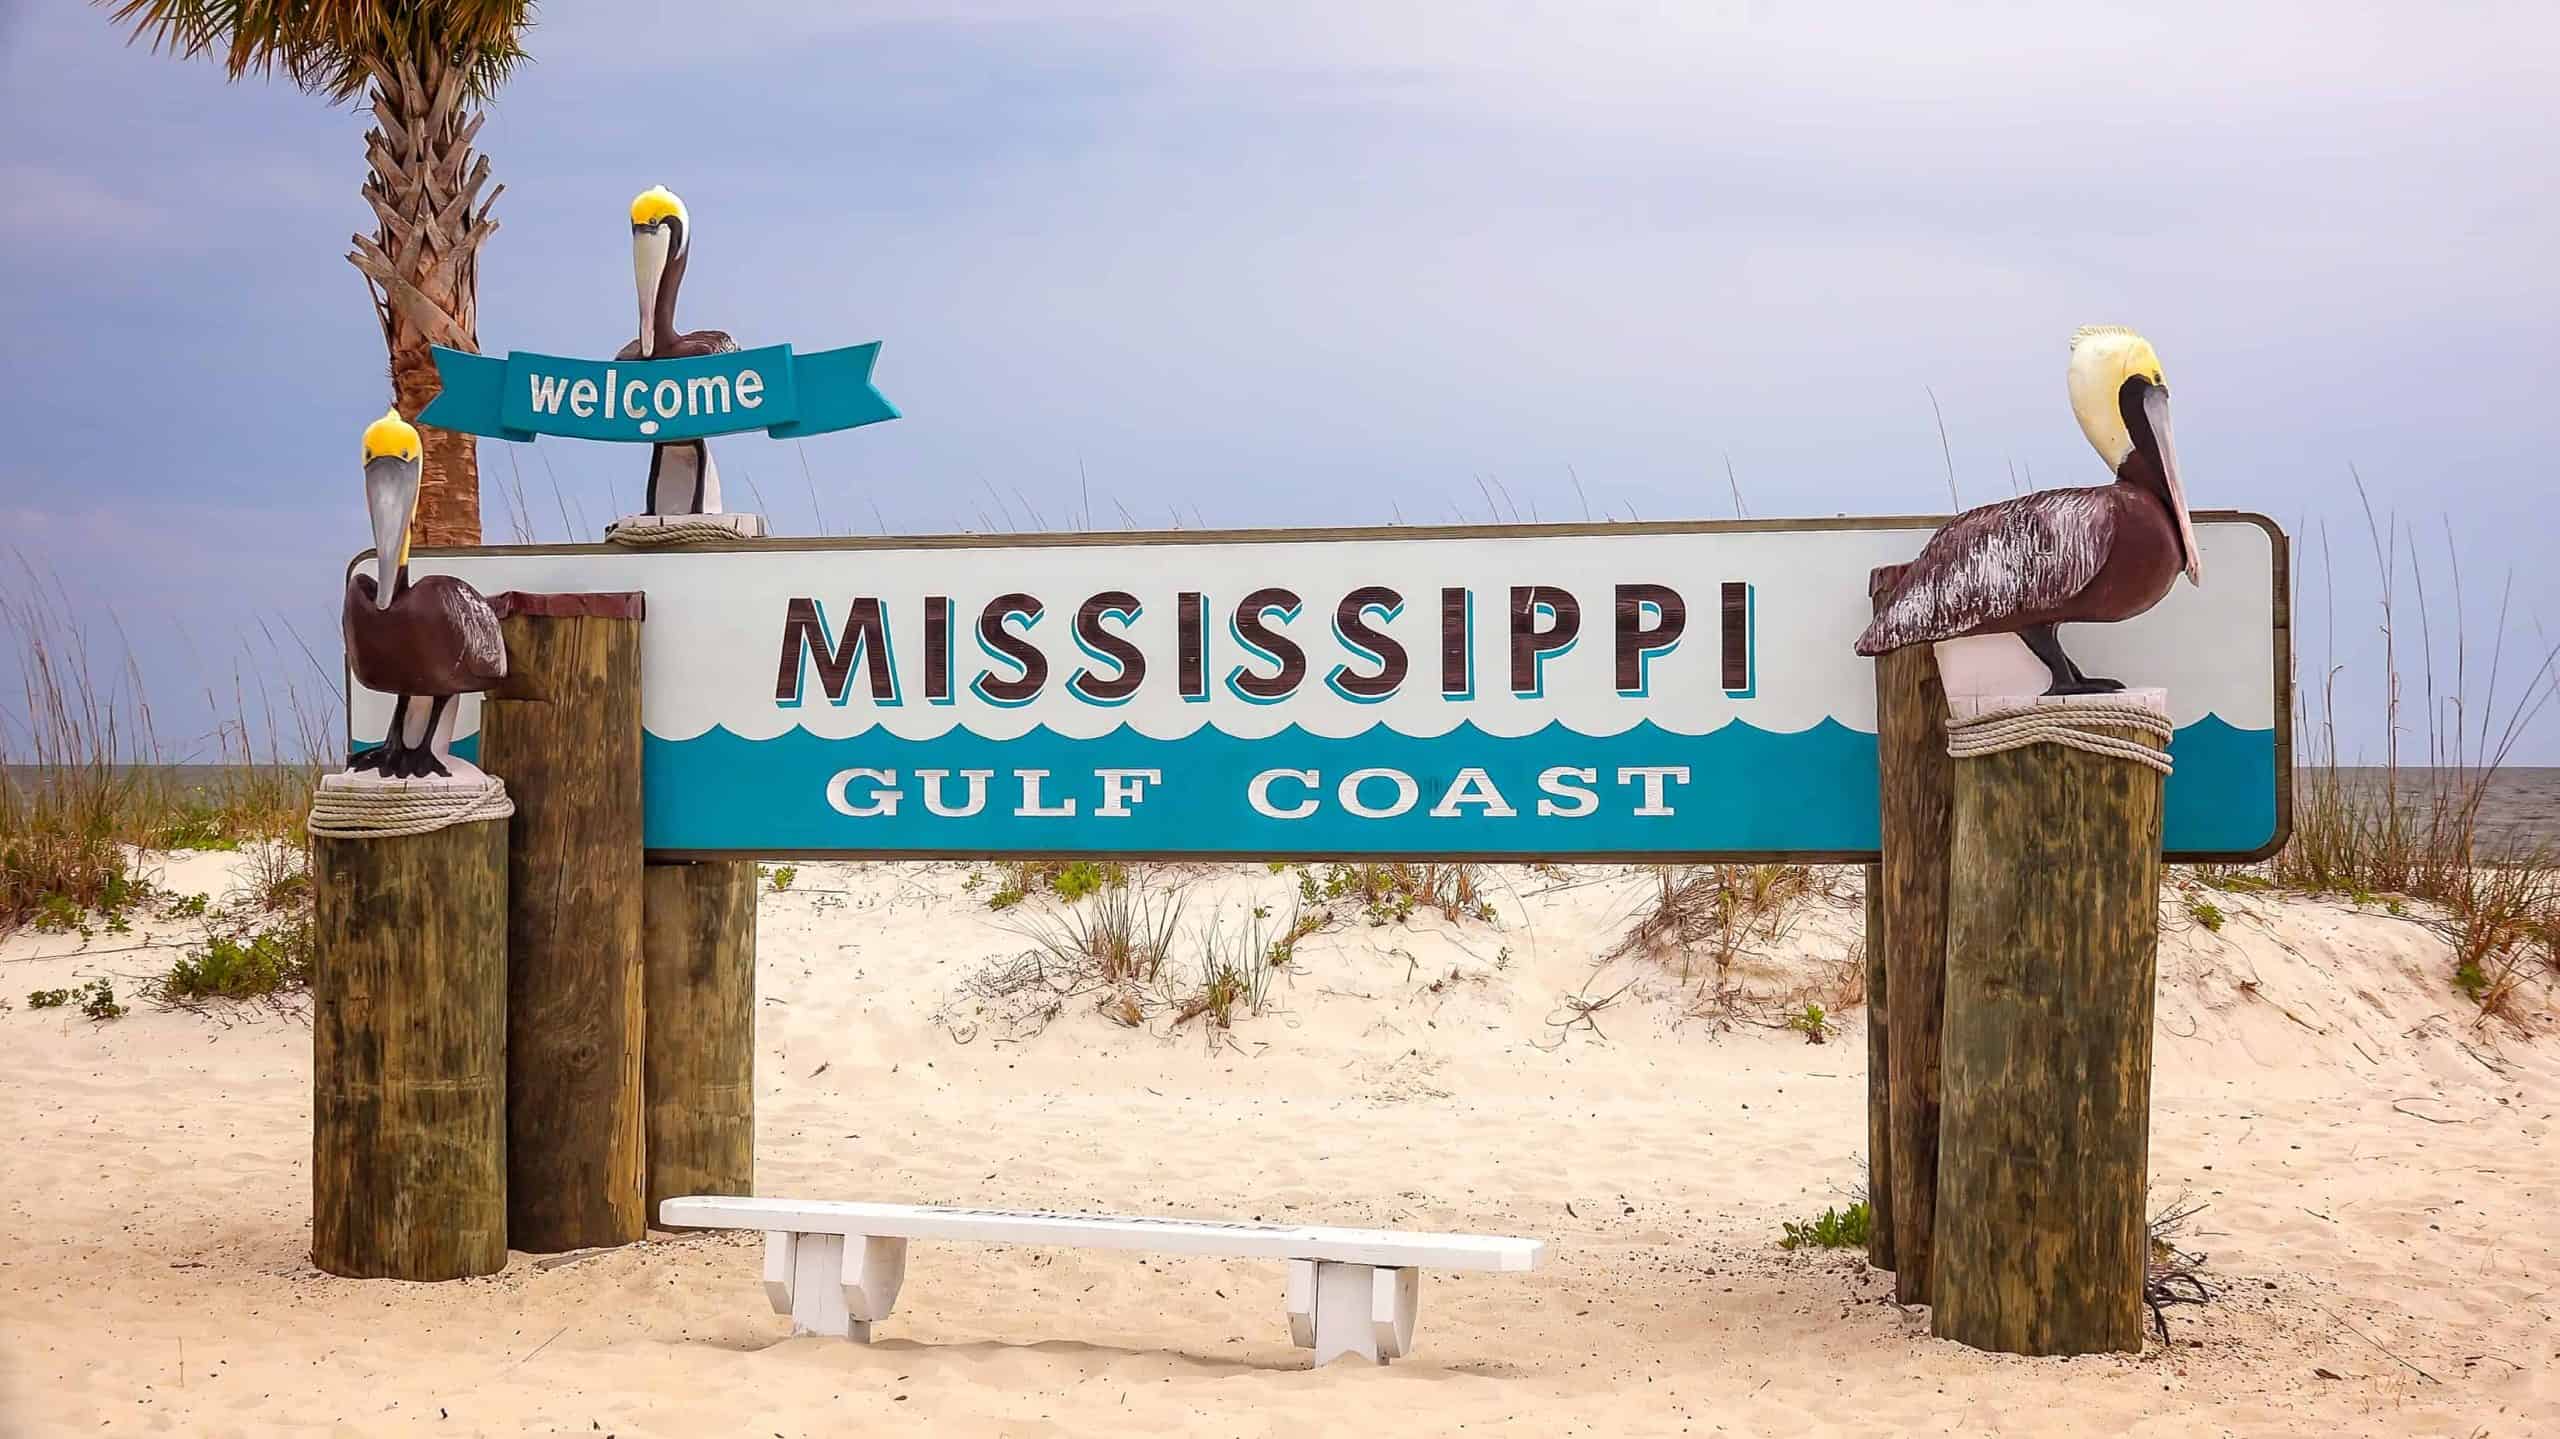
- Monthly Median Income: $4,576
- Cost of 3 specific fast-food menu items: $21.50
- Cost of Fast Food as Percentage of Income: 0.47
The post Fast Food Costs a Fortune in These States appeared first on 24/7 Wall St..