


The States Spending The Most On Having Fun
24/7 Wall St. Insights Americans spent $2,207 per capita on recreation in 2023. Spending on fun varies widely from state to state, ranging from $1,171 to $3,274. Many of the states with the greatest fun expenditure have large tourism sectors and high cost of living overall. Also: Discover the next Nvidia From movie nights to […] The post The States Spending The Most On Having Fun appeared first on 24/7 Wall St..

24/7 Wall St. Insights
- Americans spent $2,207 per capita on recreation in 2023.
- Spending on fun varies widely from state to state, ranging from $1,171 to $3,274.
- Many of the states with the greatest fun expenditure have large tourism sectors and high cost of living overall.
- Also: Discover the next Nvidia
From movie nights to gym memberships, the cost of having fun isn’t what it used to be. Americans are spending record amounts on recreation services — and where you live can make a big difference.
In 2023, Americans spent $739.3 billion on recreation services — like gyms, sports, entertainment venues, live events, and other pay-to-play activities — up 28.4% from 2018. Adjusted for population, Americans spent an average of $2,207 per capita on recreation services in 2023. Per capita recreation spending varies widely across the country, ranging from $1,171 in the lowest spending state to $3,274 in the highest. Many of the highest spending states have large tourism sectors and high cost of living overall. A closer look at the data reveals the states where people spend the most on fun.
To determine the states spending the most on fun, 24/7 Wall St. reviewed data on personal consumption expenditures from the Bureau of Economic Analysis. States were ranked based on annual personal expenditure on recreation services per capita in 2023. Expenditure totals were adjusted for population using data from the U.S. Census Bureau.
50. Arkansas
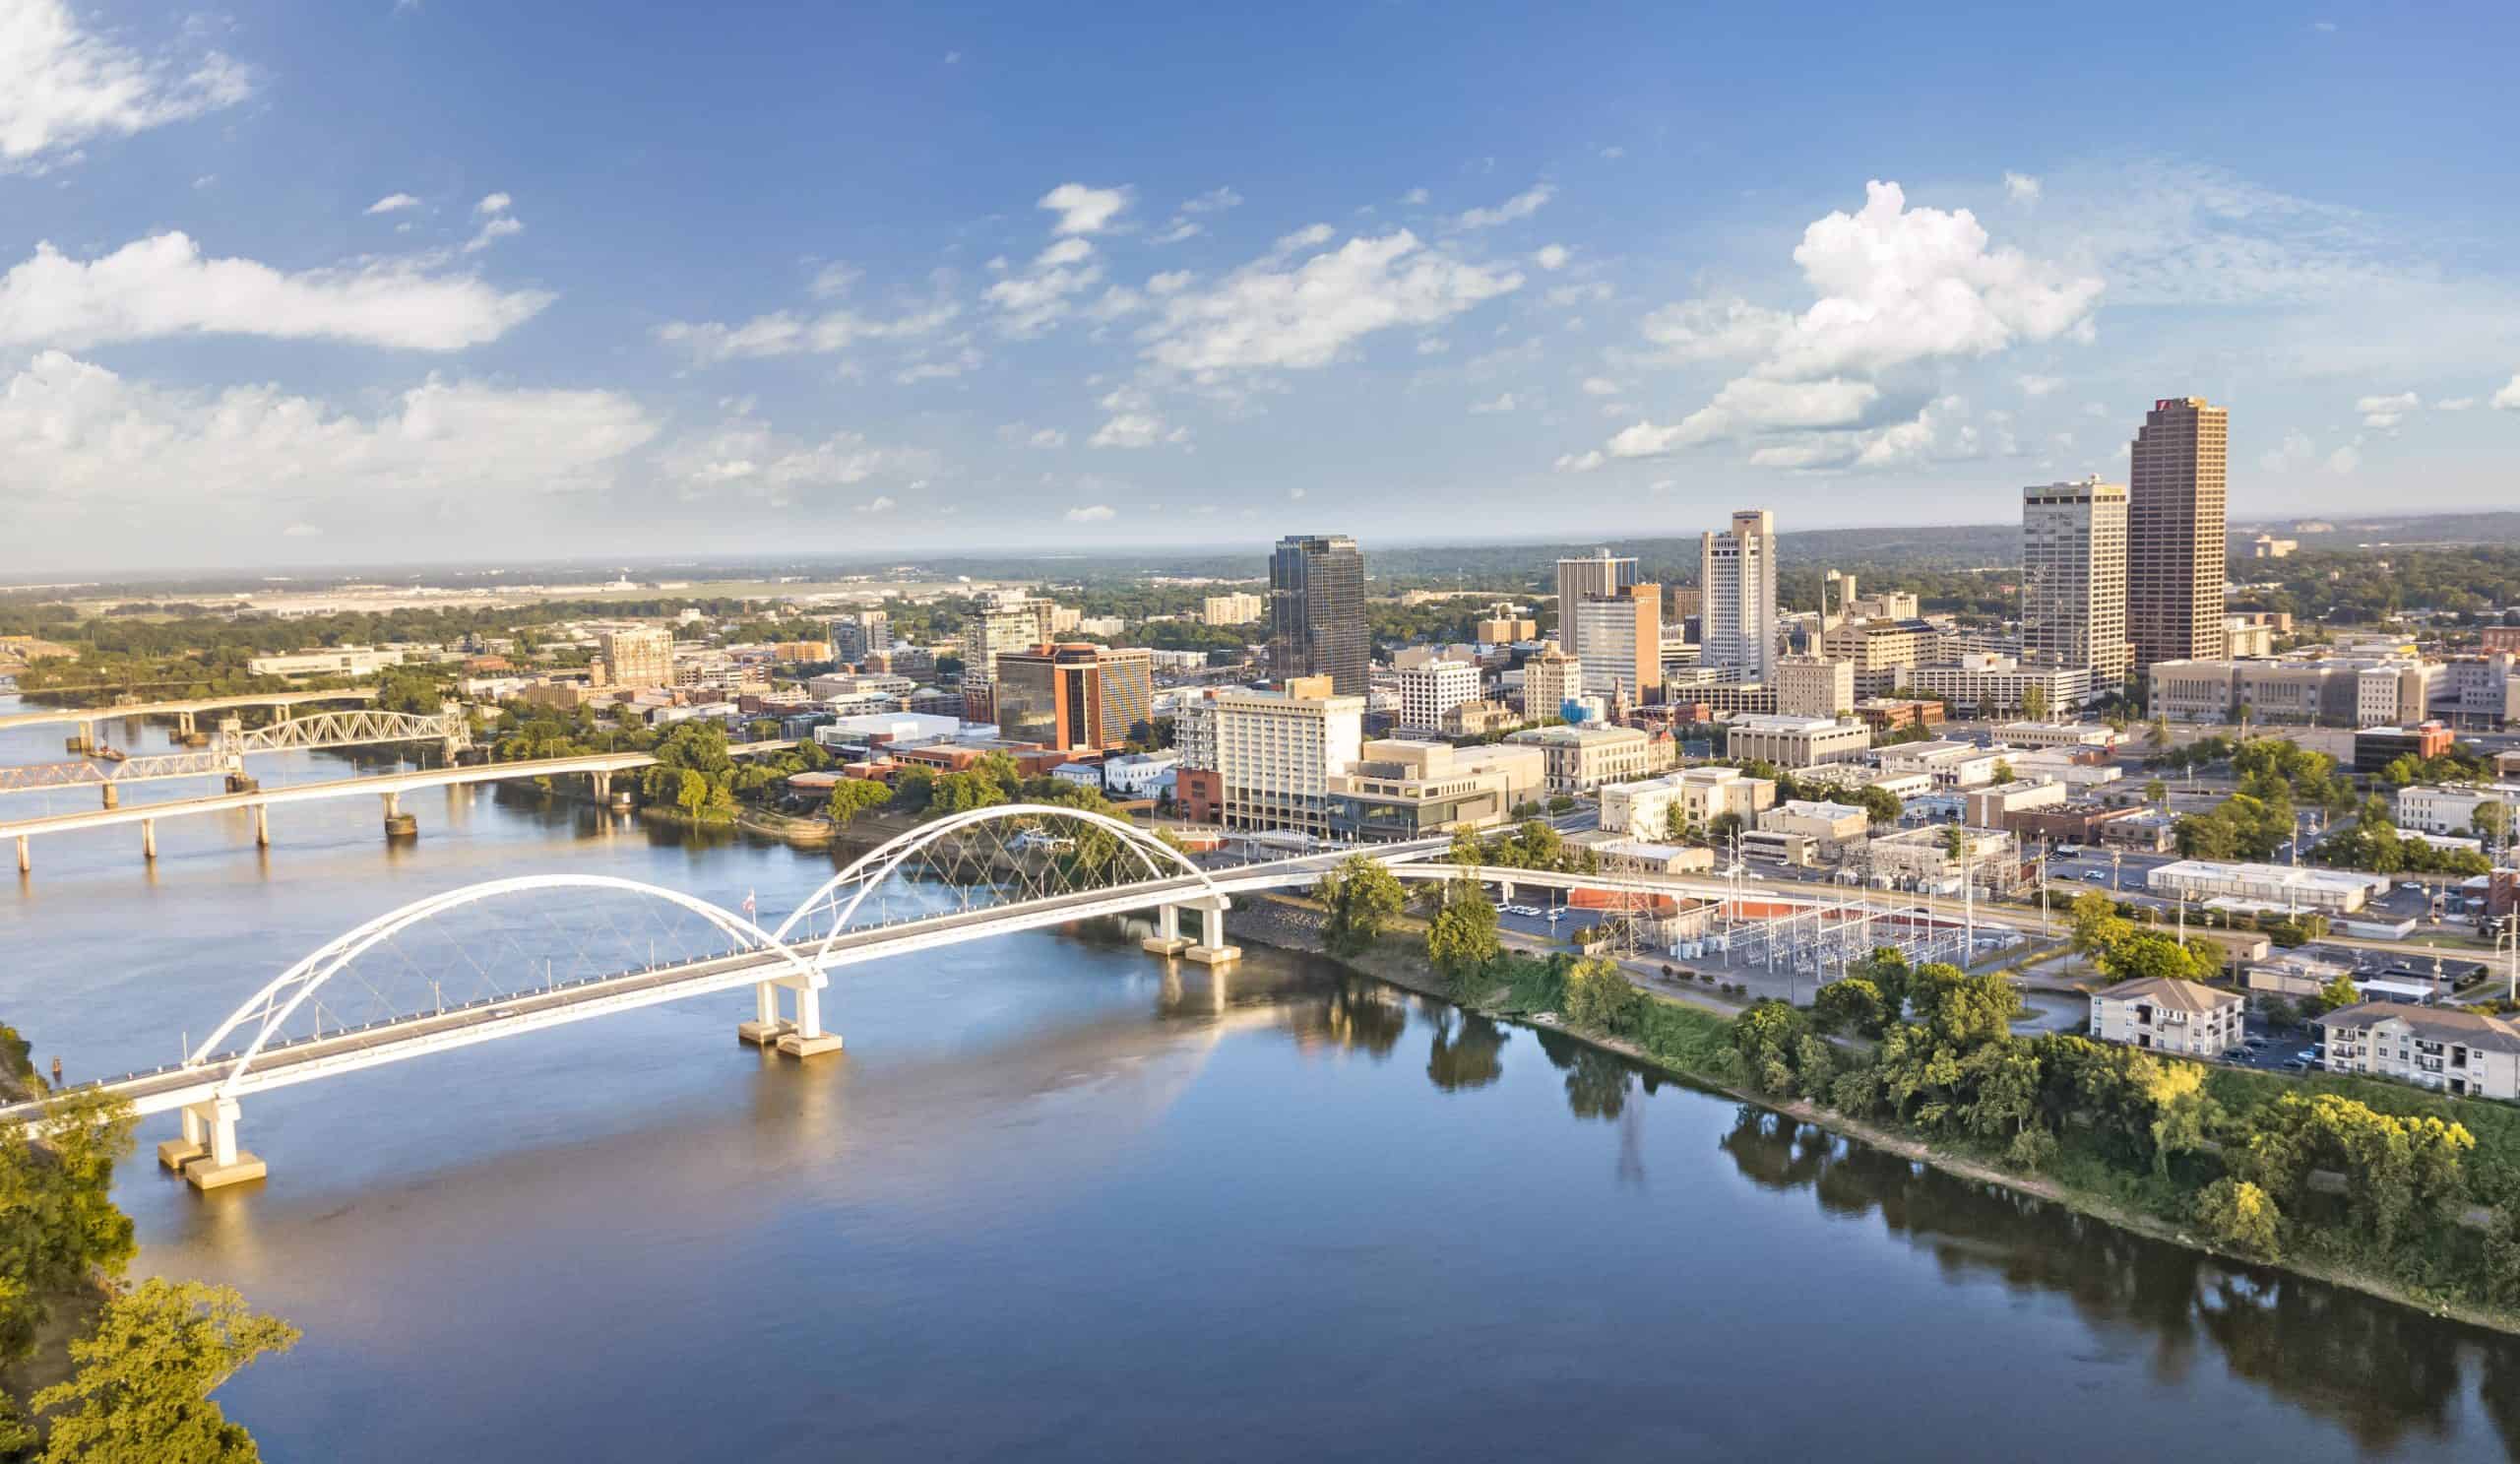
- Personal recreation expenditure, adjusted for population: $1,171 per capita
- Cost of living: -13.5% less than national average
- Total recreation expenditure: $3.6 billion
- Total population: 3.1 million
- Other major spending categories: Gasoline and other energy goods, financial services and insurance, clothing and footwear, furnishings and durable household equipment, recreational goods and vehicles, health care
49. Mississippi
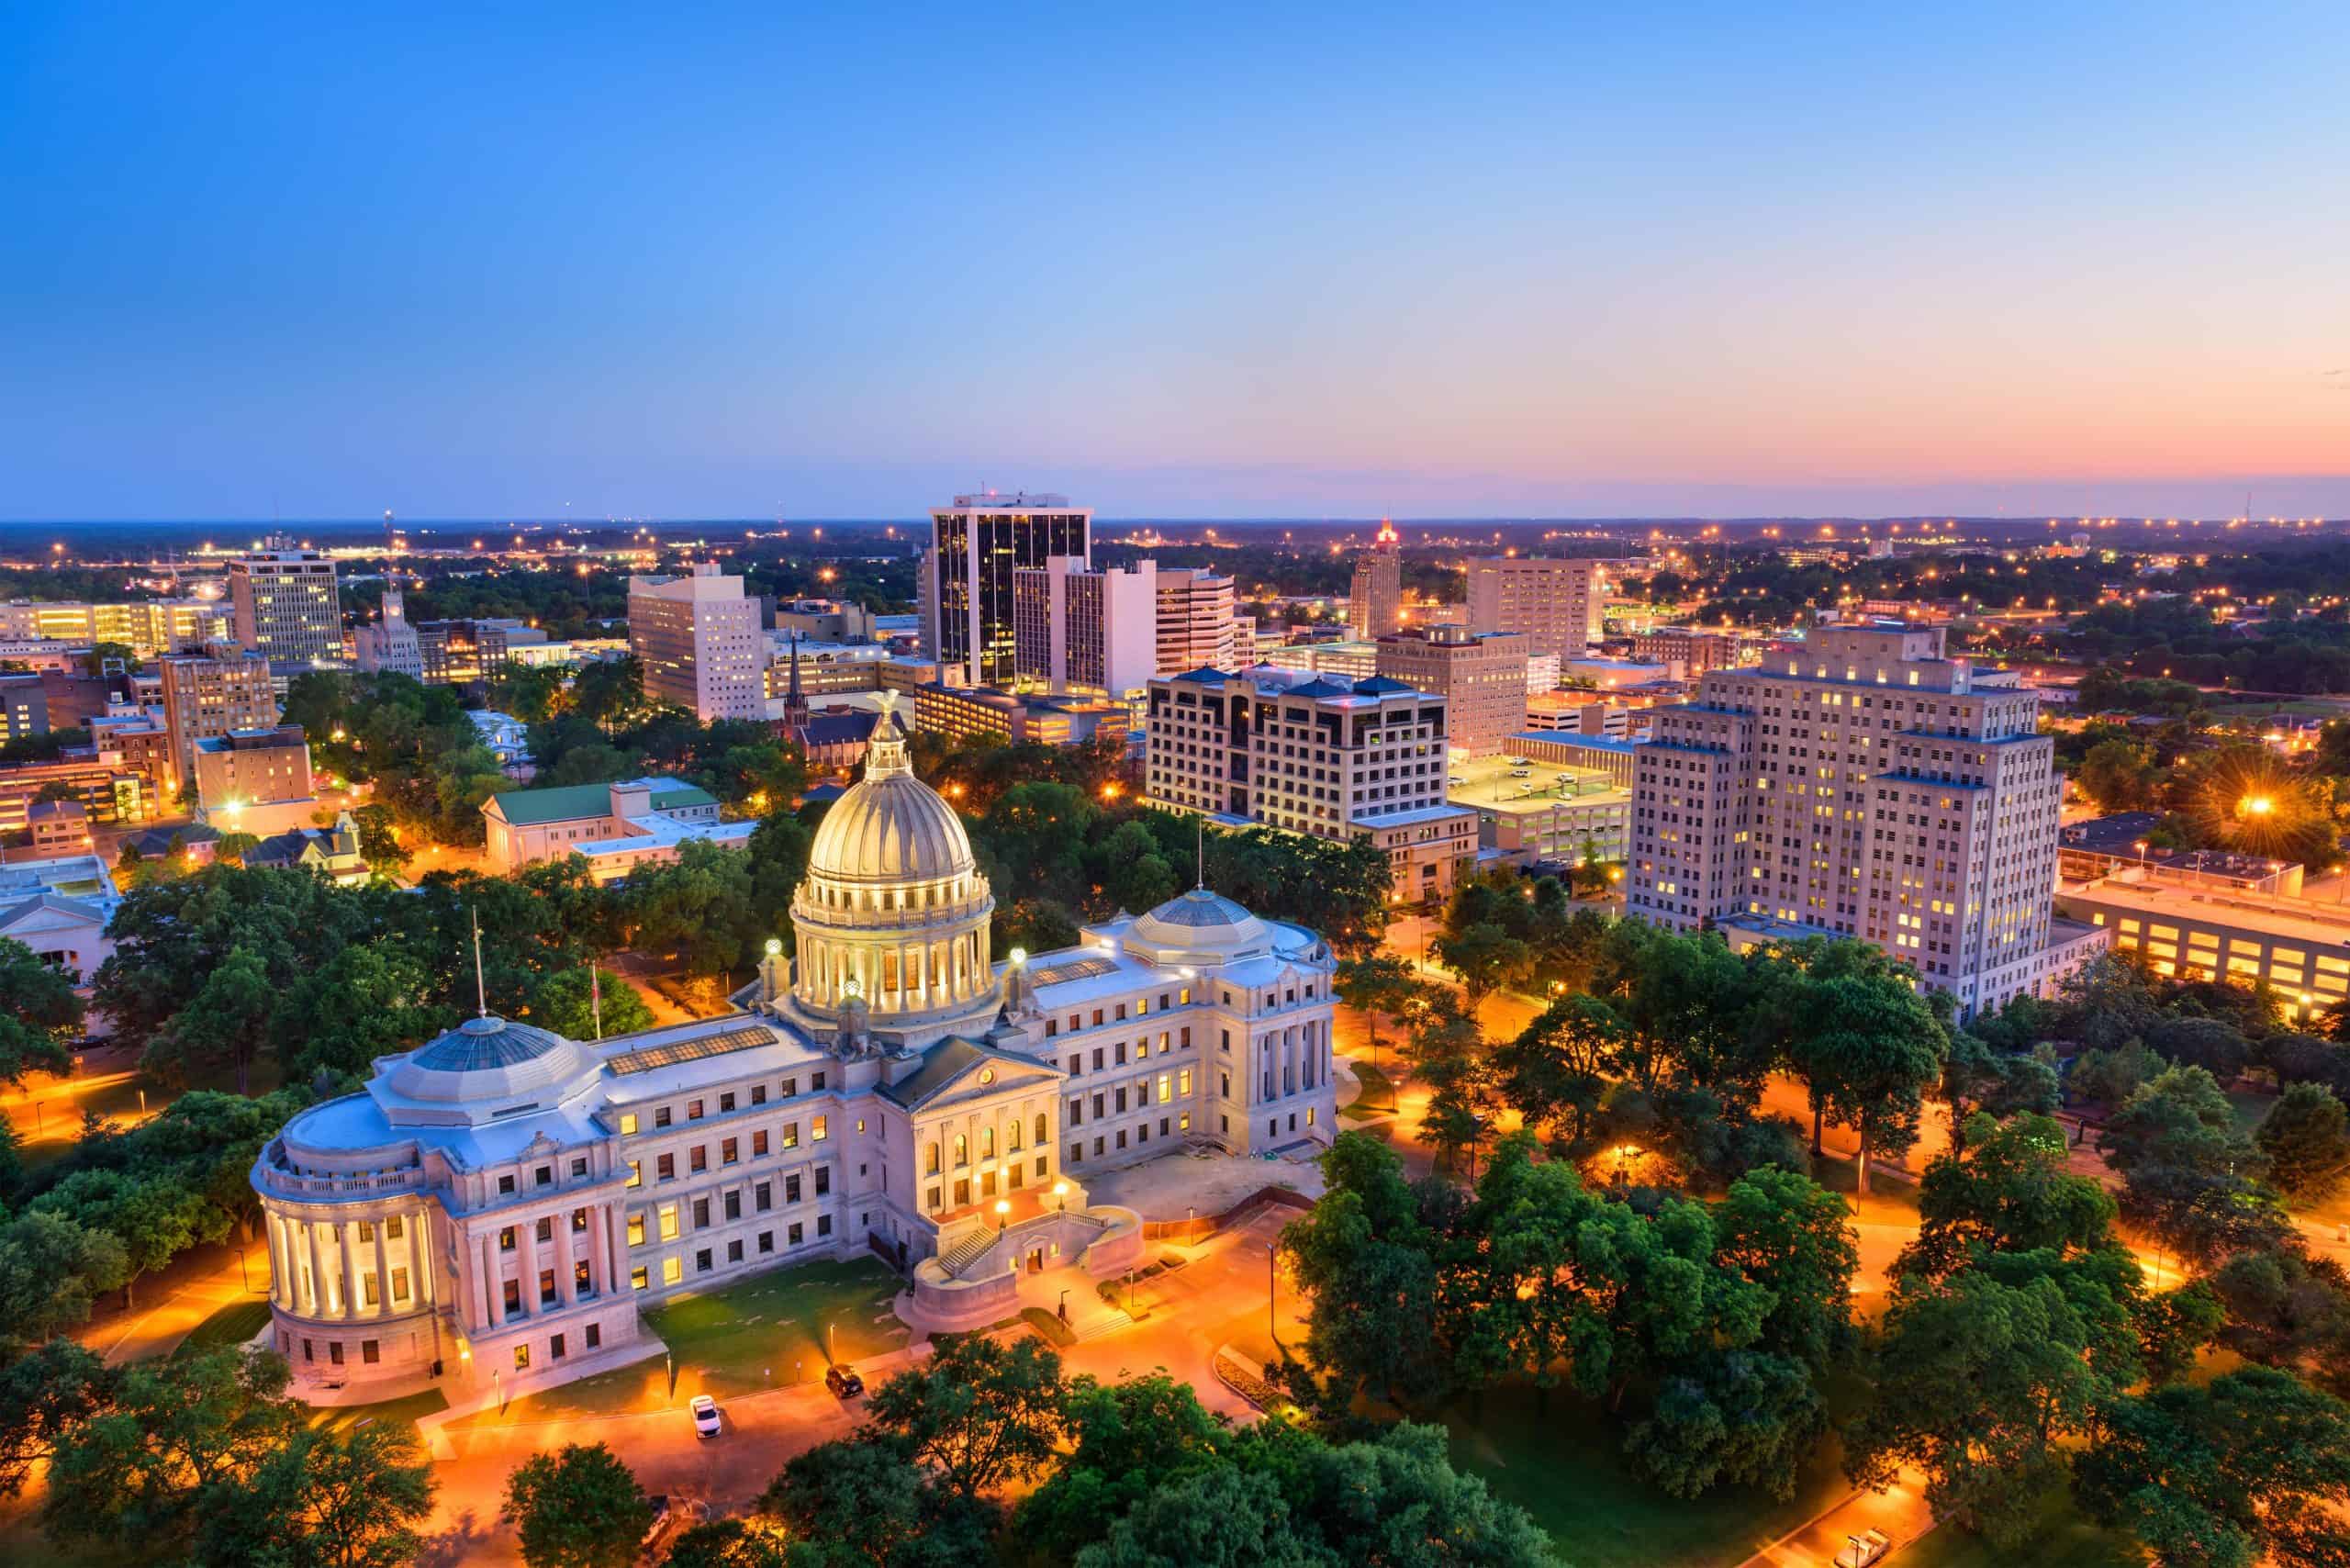
- Personal recreation expenditure, adjusted for population: $1,172 per capita
- Cost of living: -12.7% less than national average
- Total recreation expenditure: $3.4 billion
- Total population: 2.9 million
- Other major spending categories: Gasoline and other energy goods, clothing and footwear, motor vehicles and parts, groceries, health care, food services and accommodations
48. West Virginia
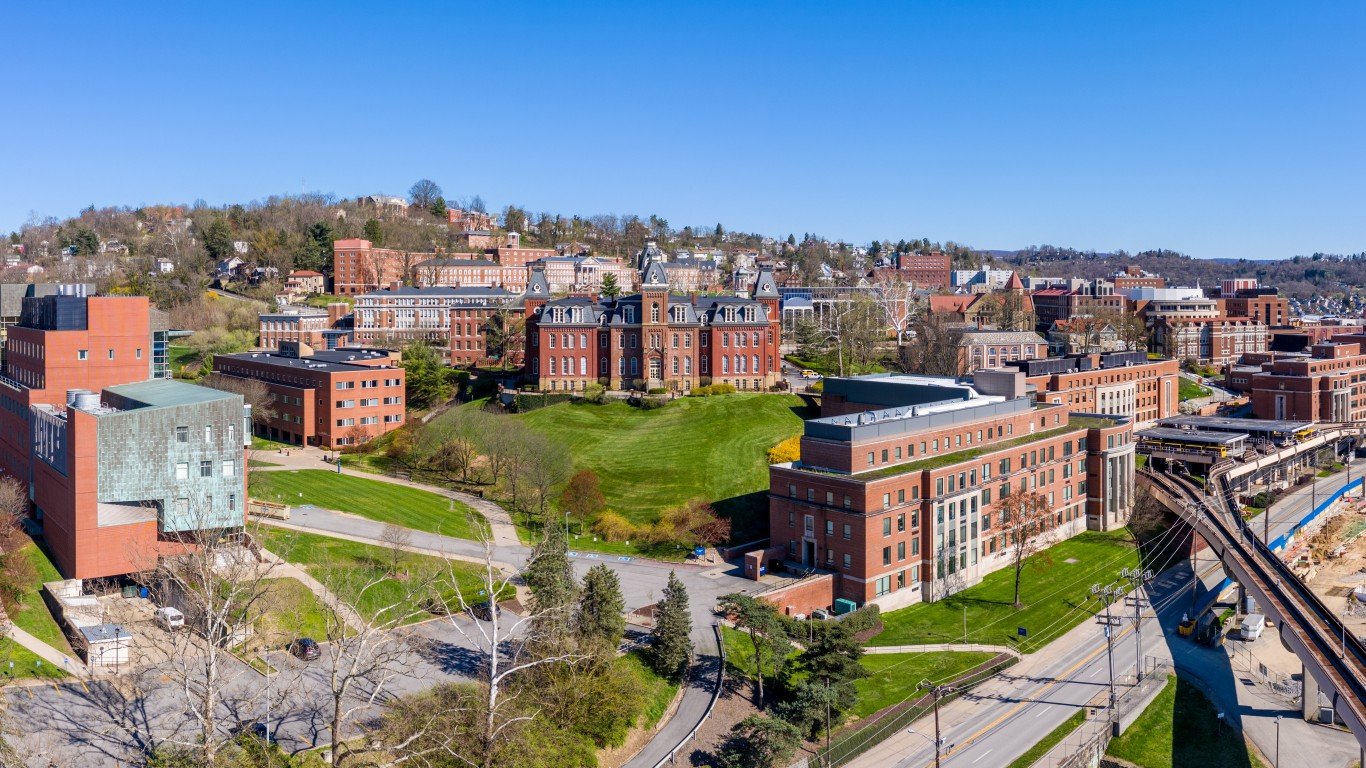
- Personal recreation expenditure, adjusted for population: $1,207 per capita
- Cost of living: -10.2% less than national average
- Total recreation expenditure: $2.1 billion
- Total population: 1.8 million
- Other major spending categories: Health care, gasoline and other energy goods, groceries, motor vehicles and parts, financial services and insurance, housing and utilities
47. Oklahoma
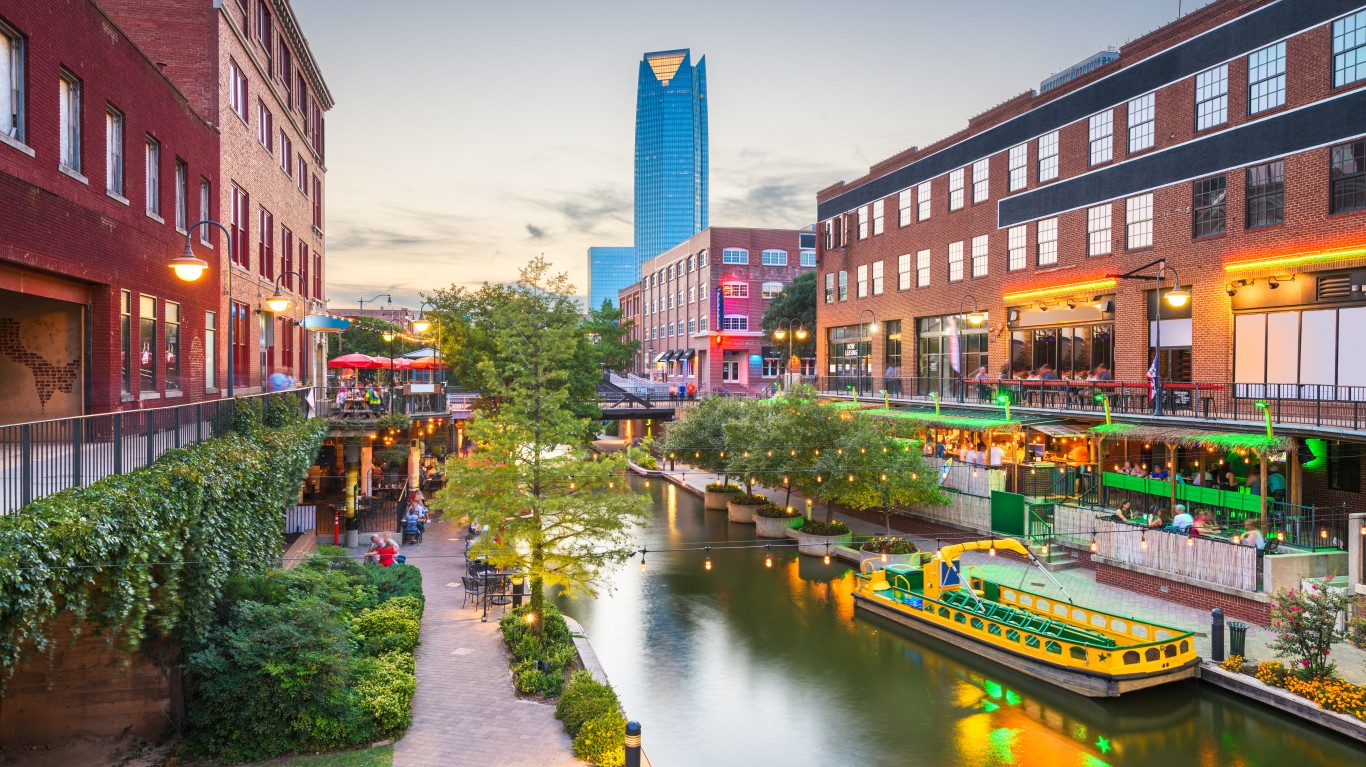
- Personal recreation expenditure, adjusted for population: $1,328 per capita
- Cost of living: -11.7% less than national average
- Total recreation expenditure: $5.4 billion
- Total population: 4.1 million
- Other major spending categories: Motor vehicles and parts, gasoline and other energy goods, clothing and footwear, food services and accommodations, health care, recreational goods and vehicles
46. Alabama
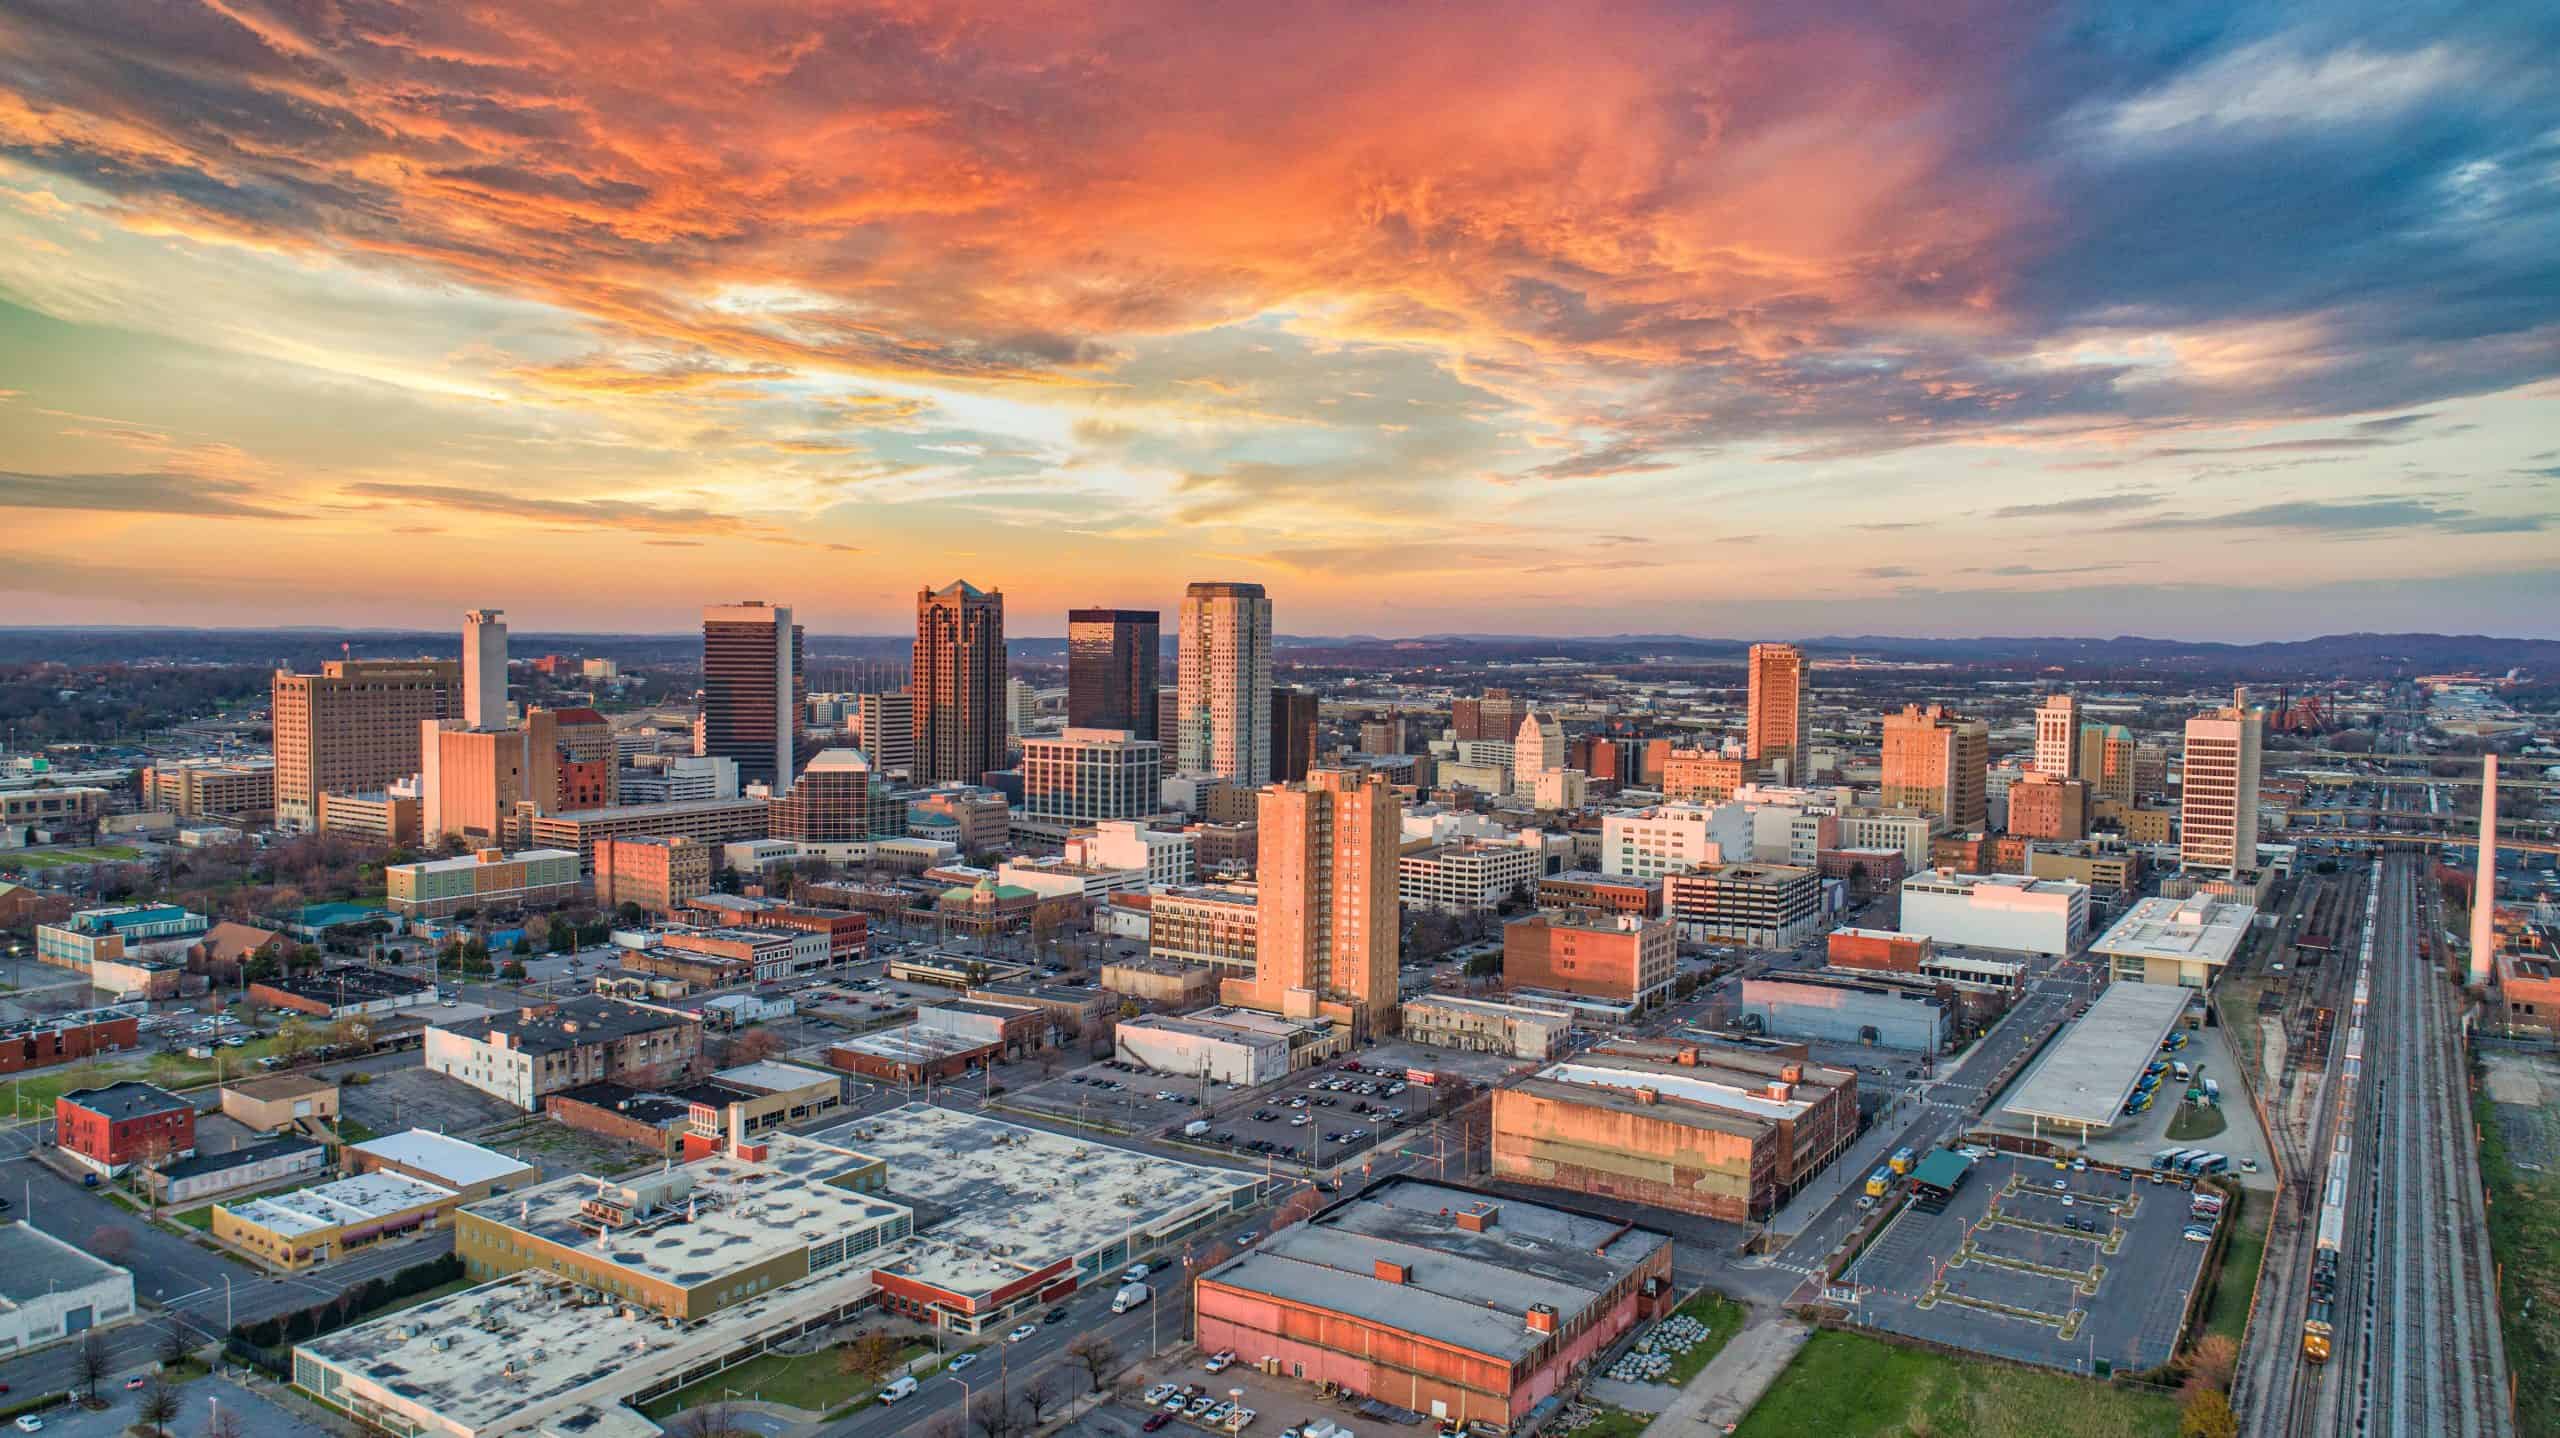
- Personal recreation expenditure, adjusted for population: $1,342 per capita
- Cost of living: -10.0% less than national average
- Total recreation expenditure: $6.9 billion
- Total population: 5.1 million
- Other major spending categories: Motor vehicles and parts, gasoline and other energy goods, clothing and footwear, recreational goods and vehicles, groceries, furnishings and durable household equipment
45. Indiana
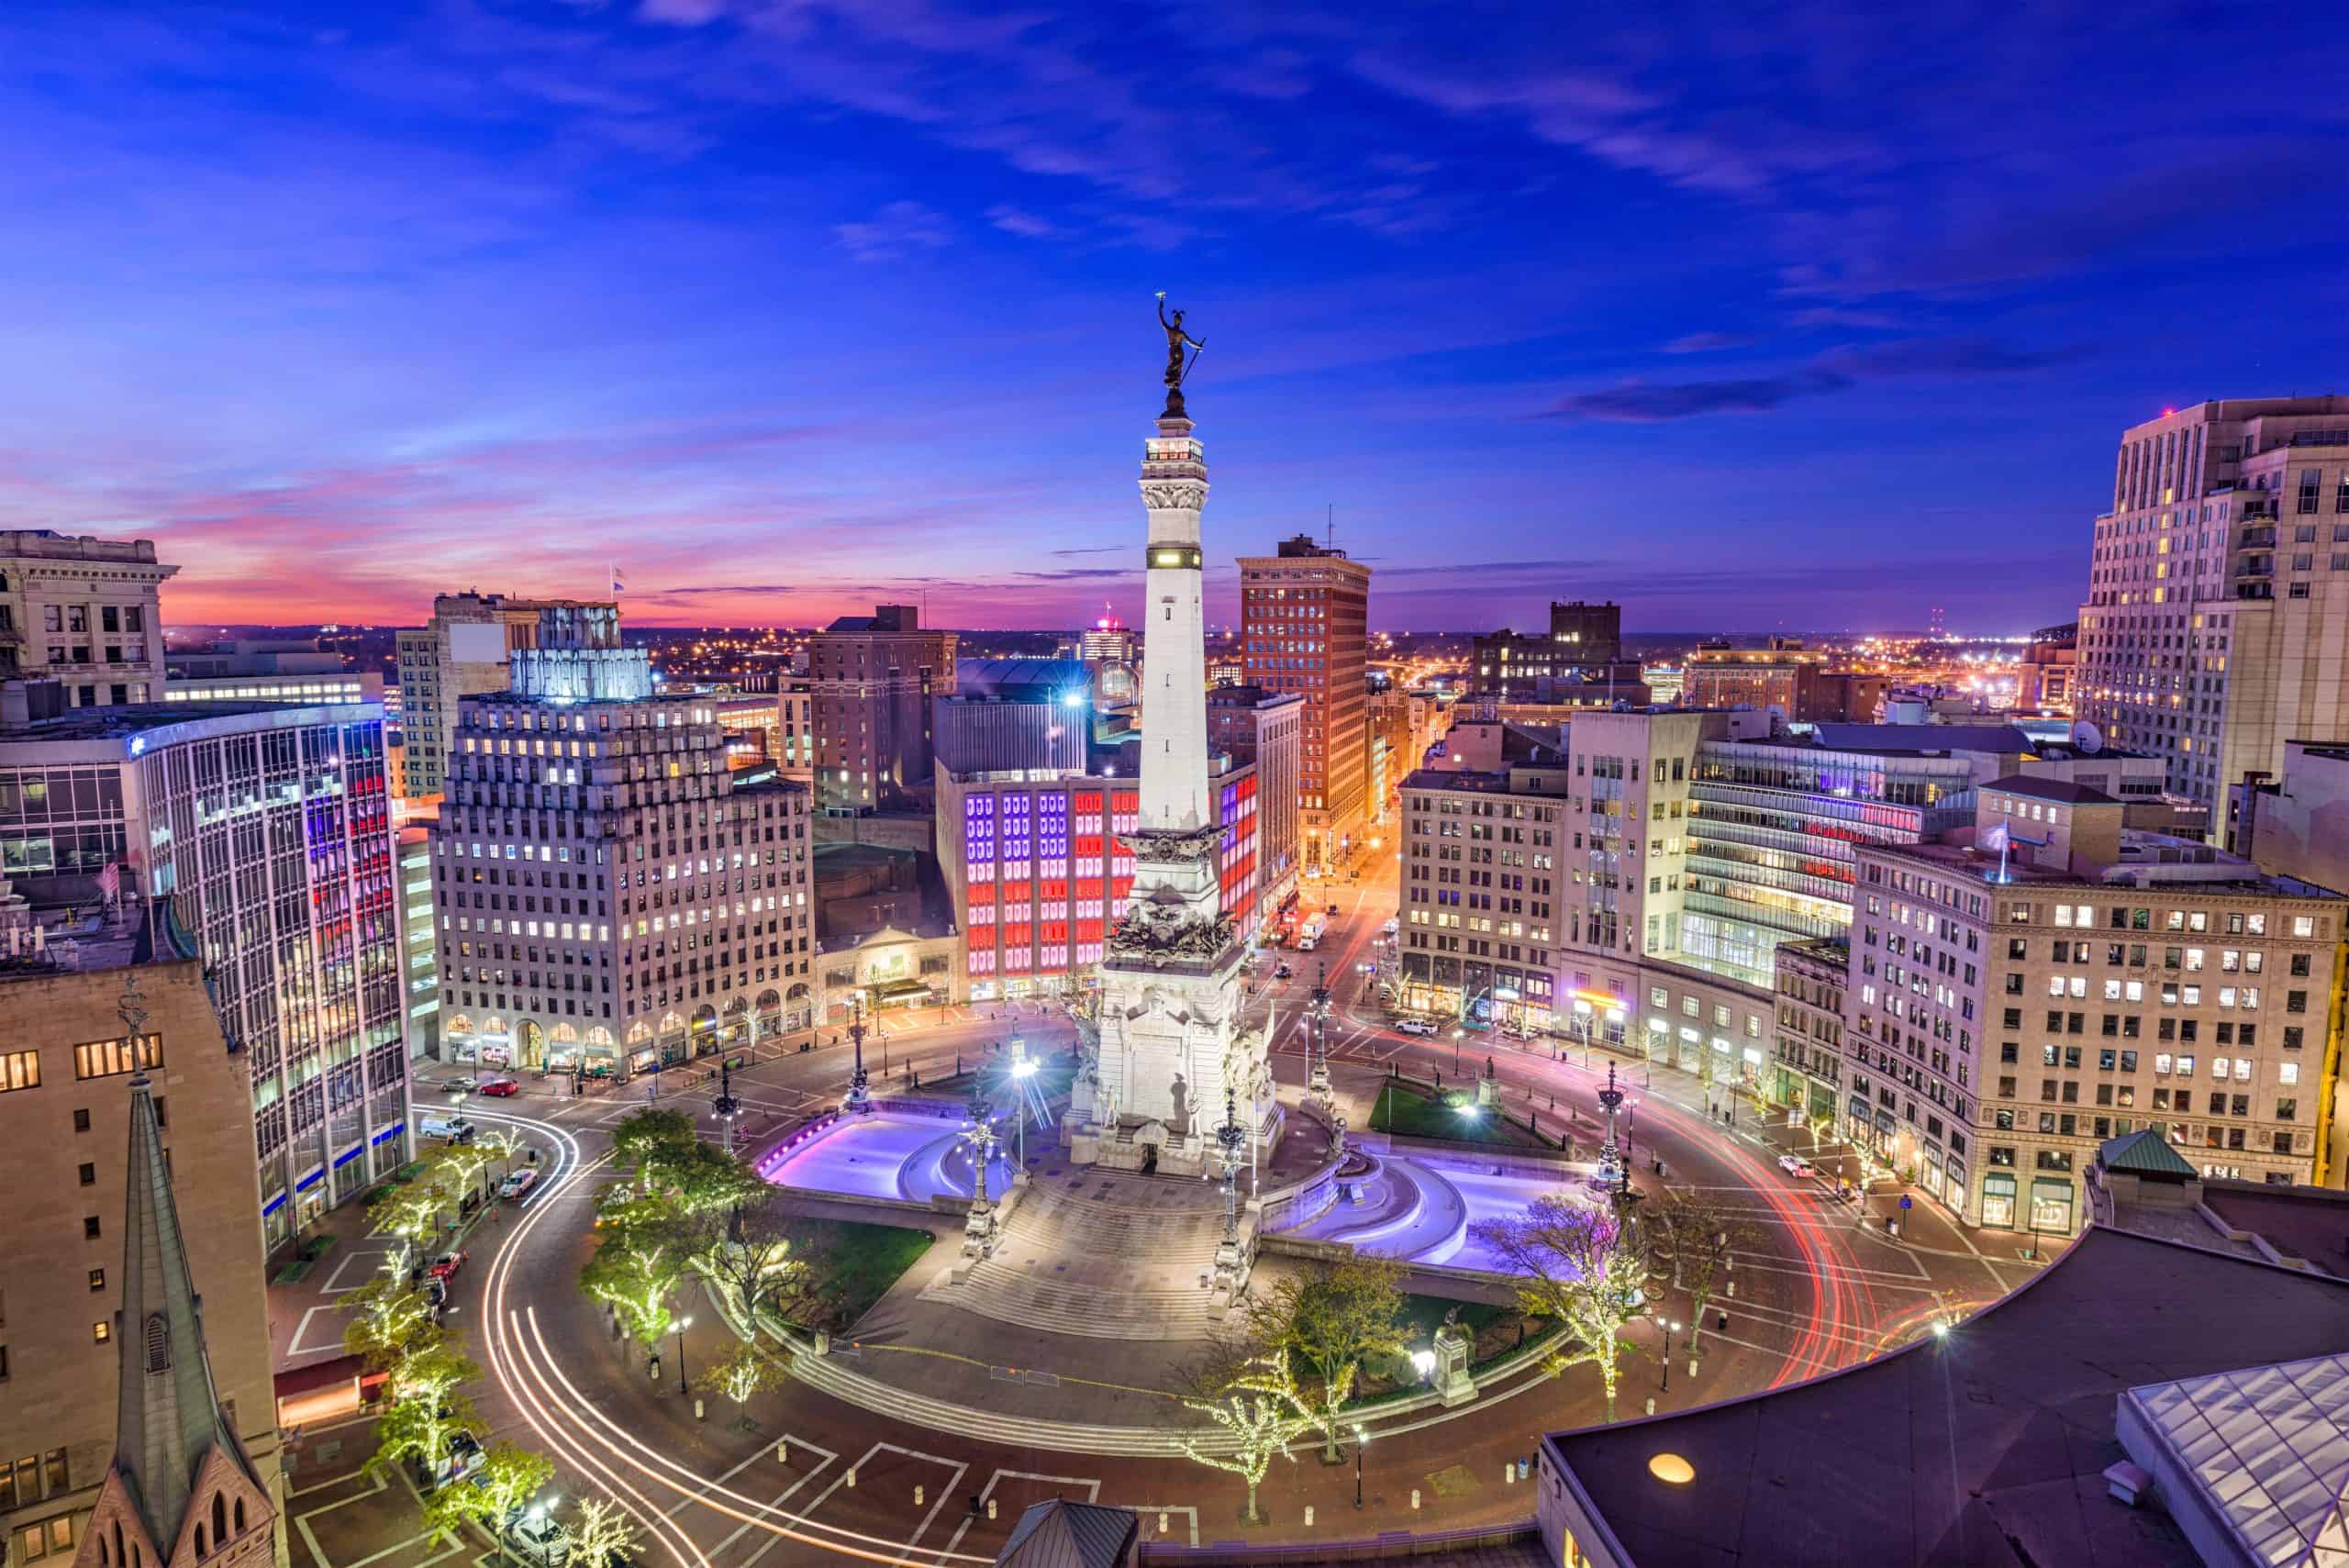
- Personal recreation expenditure, adjusted for population: $1,363 per capita
- Cost of living: -7.8% less than national average
- Total recreation expenditure: $9.4 billion
- Total population: 6.9 million
- Other major spending categories: Health care, gasoline and other energy goods, motor vehicles and parts, recreational goods and vehicles, groceries, furnishings and durable household equipment
44. New Mexico
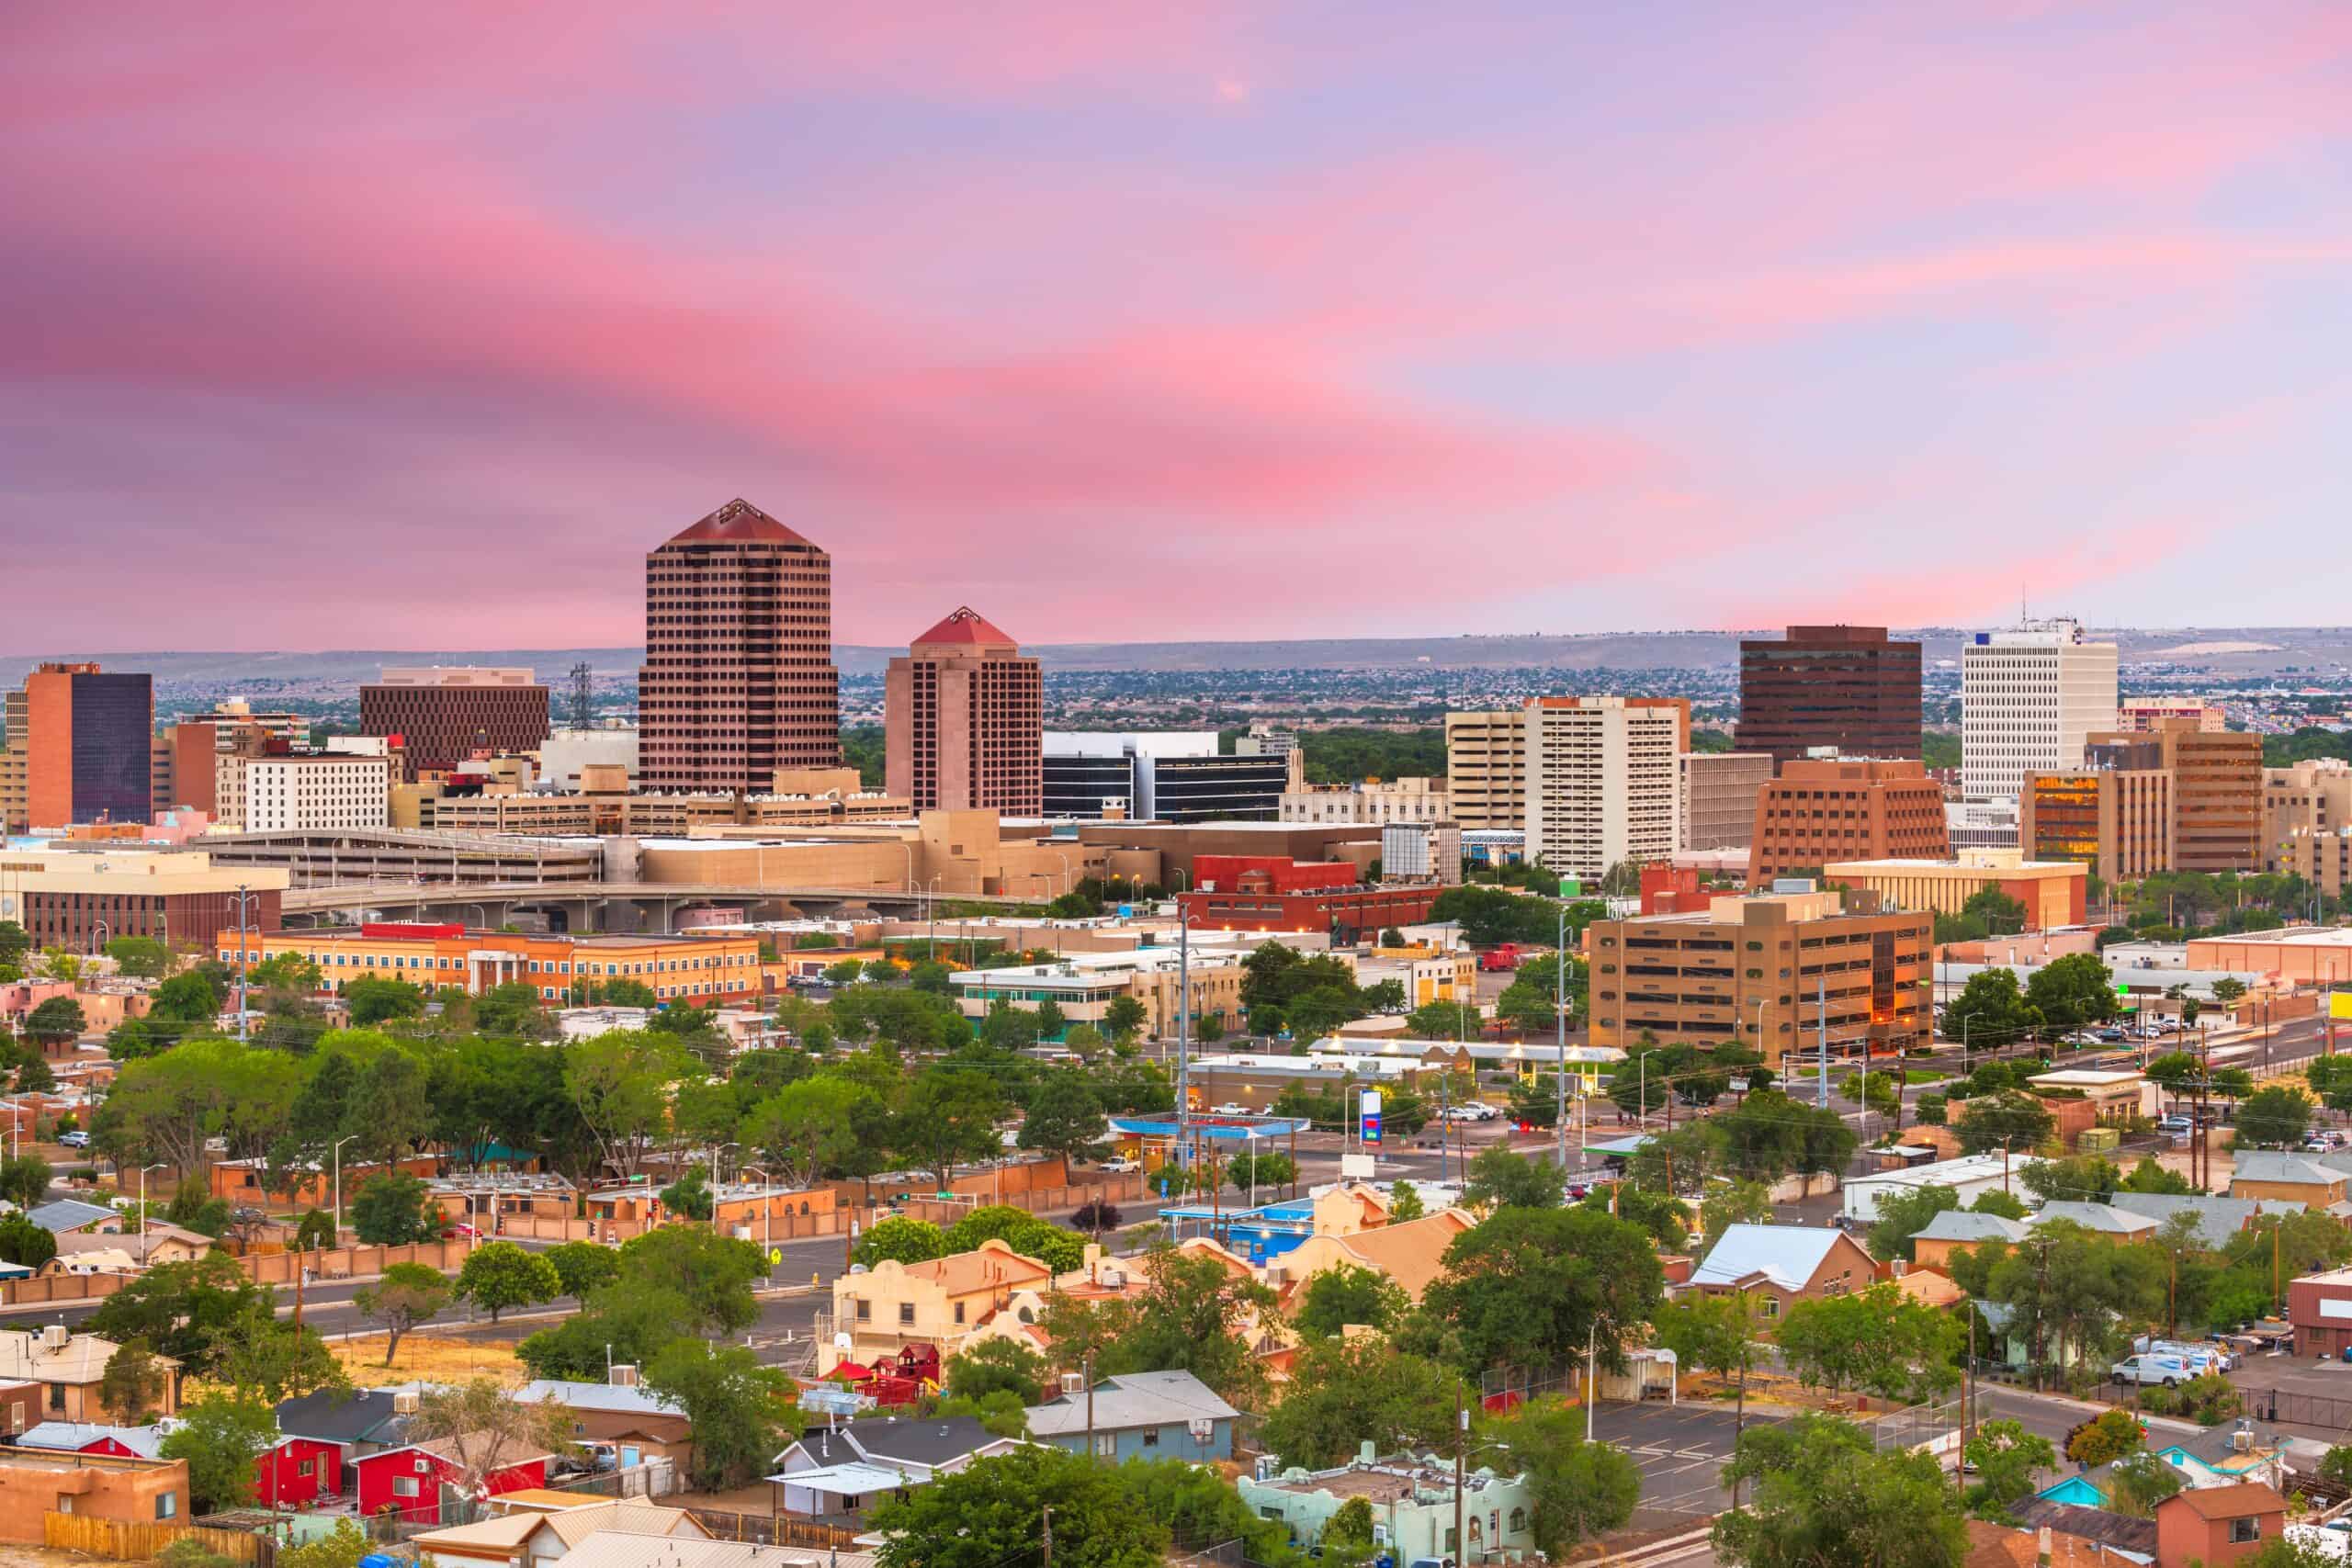
- Personal recreation expenditure, adjusted for population: $1,427 per capita
- Cost of living: -9.6% less than national average
- Total recreation expenditure: $3.0 billion
- Total population: 2.1 million
- Other major spending categories: Gasoline and other energy goods, food services and accommodations, motor vehicles and parts, groceries, housing and utilities, health care
43. Iowa
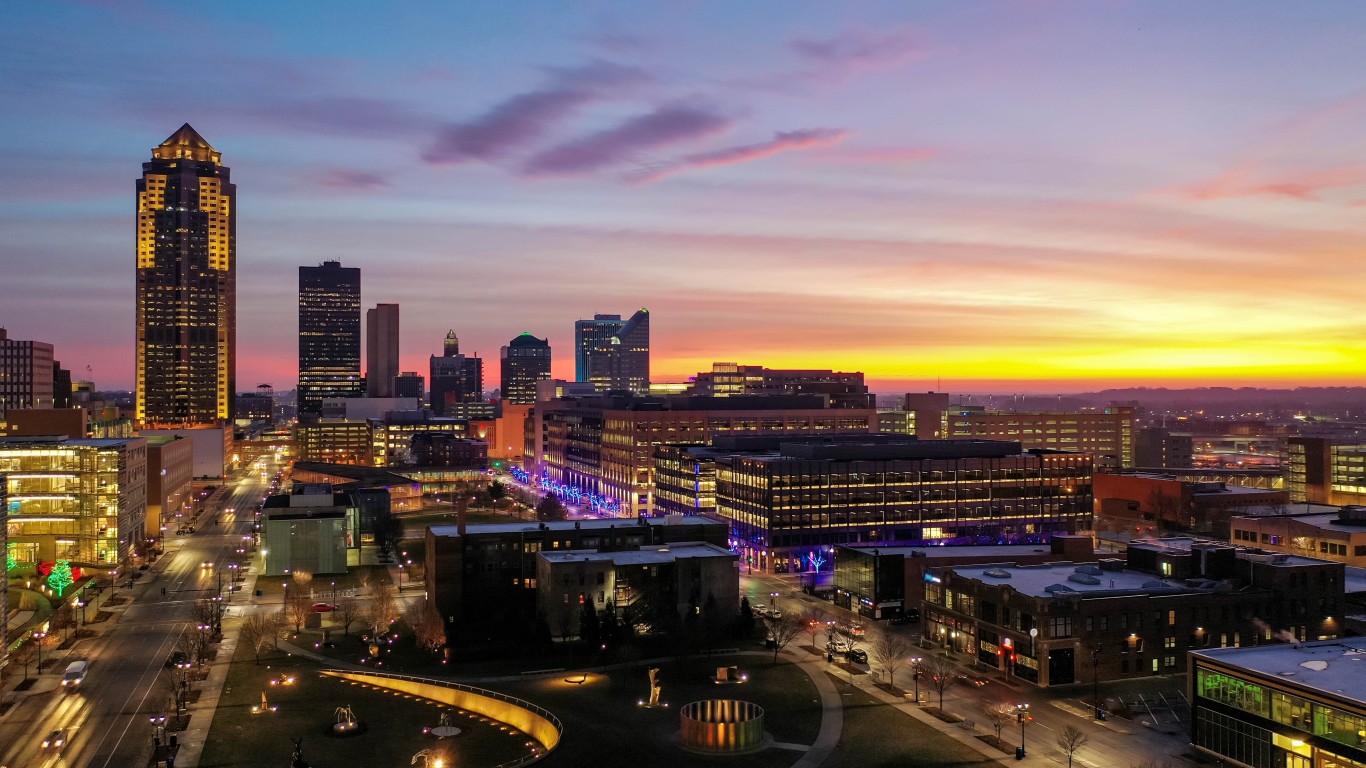
- Personal recreation expenditure, adjusted for population: $1,446 per capita
- Cost of living: -11.2% less than national average
- Total recreation expenditure: $4.6 billion
- Total population: 3.2 million
- Other major spending categories: Gasoline and other energy goods, motor vehicles and parts, groceries, recreational goods and vehicles, transportation services, health care
42. Idaho
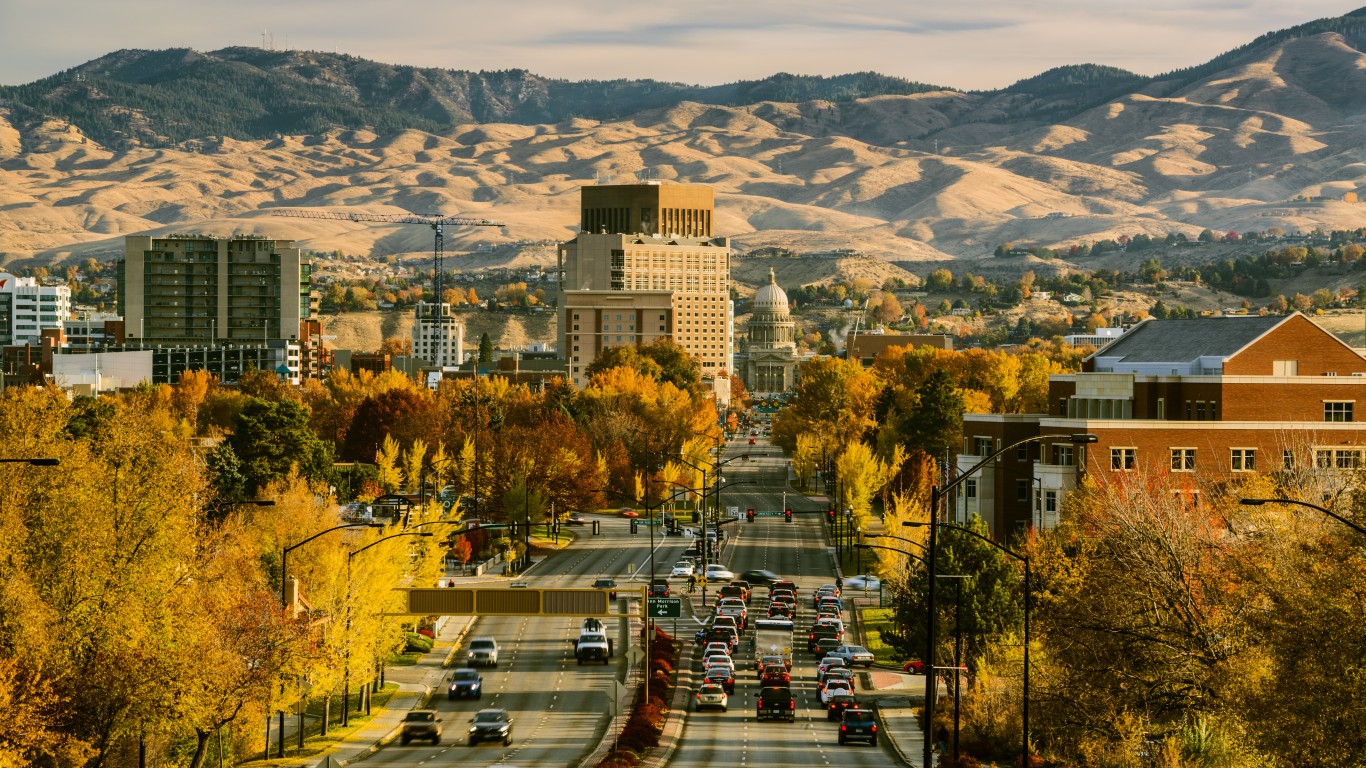
- Personal recreation expenditure, adjusted for population: $1,476 per capita
- Cost of living: -8.6% less than national average
- Total recreation expenditure: $2.9 billion
- Total population: 2.0 million
- Other major spending categories: Recreational goods and vehicles, gasoline and other energy goods, motor vehicles and parts, housing and utilities, furnishings and durable household equipment, transportation services
41. Nebraska
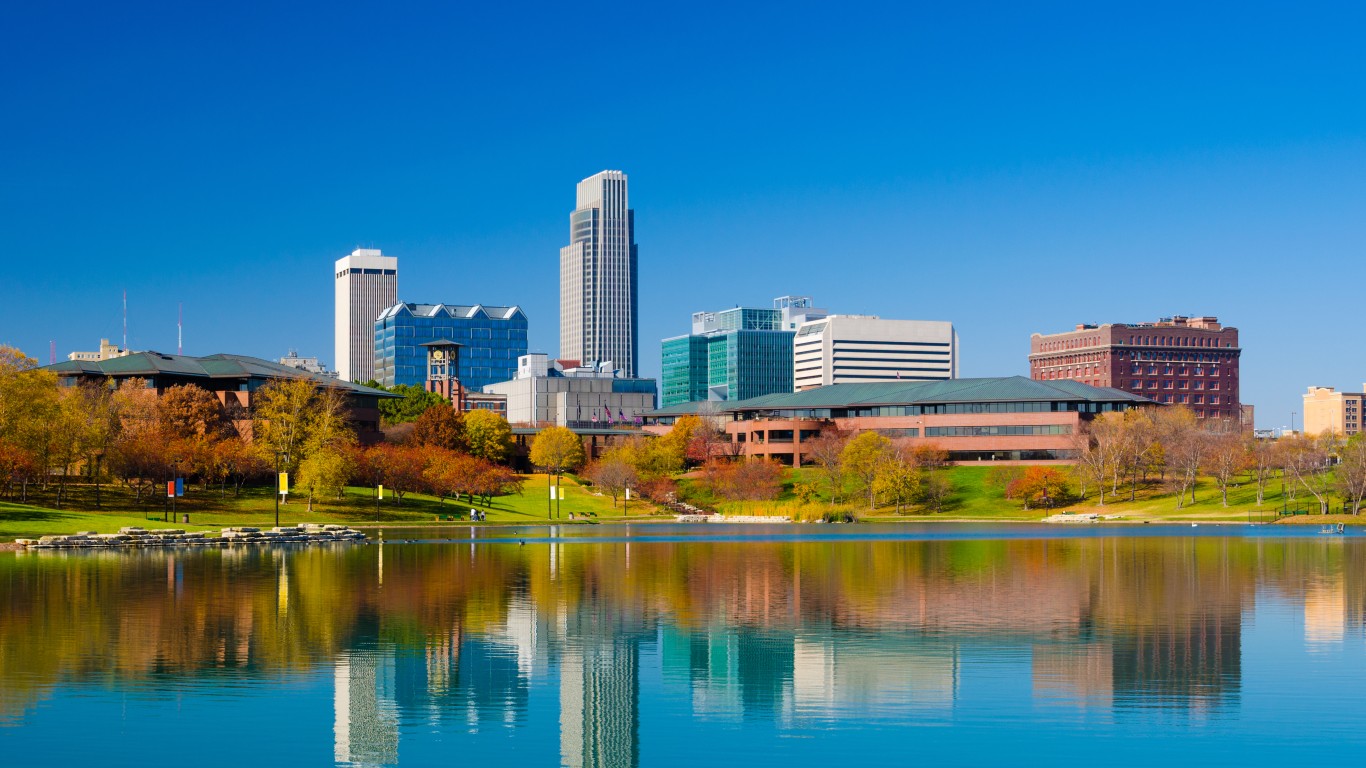
- Personal recreation expenditure, adjusted for population: $1,484 per capita
- Cost of living: -9.6% less than national average
- Total recreation expenditure: $2.9 billion
- Total population: 2.0 million
- Other major spending categories: Motor vehicles and parts, gasoline and other energy goods, financial services and insurance, health care, transportation services, recreational goods and vehicles
40. Louisiana
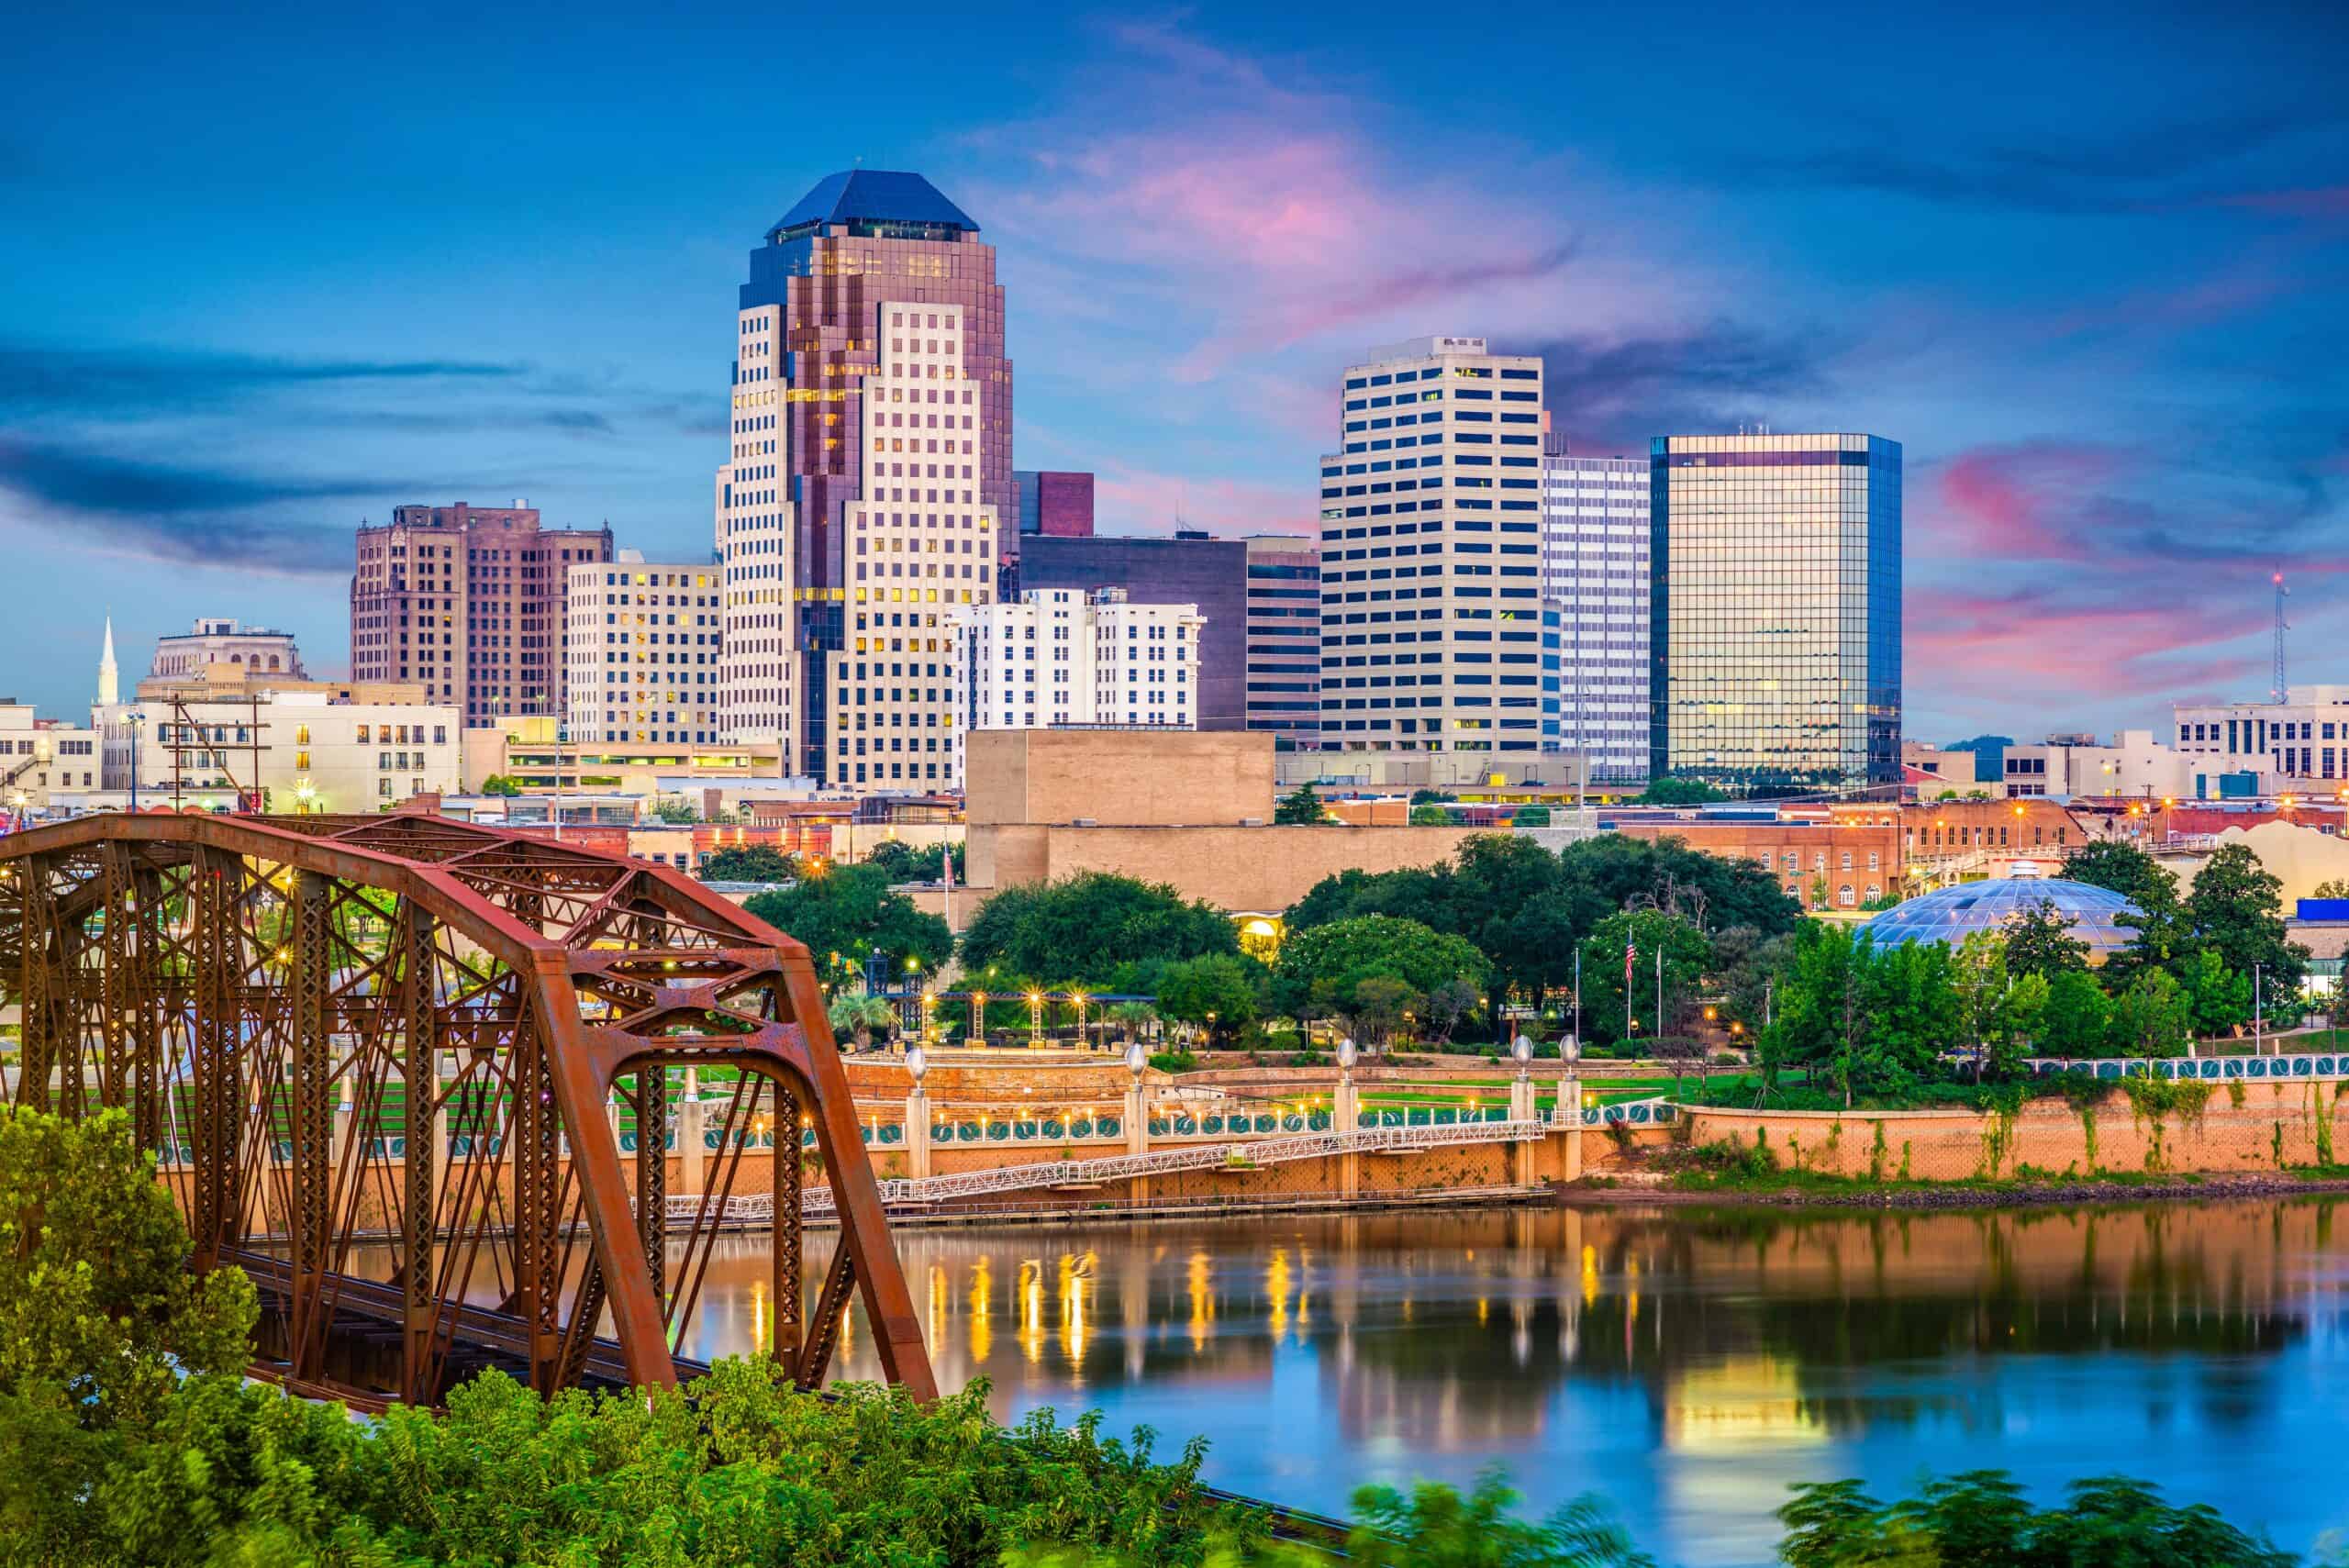
- Personal recreation expenditure, adjusted for population: $1,495 per capita
- Cost of living: -11.7% less than national average
- Total recreation expenditure: $6.8 billion
- Total population: 4.6 million
- Other major spending categories: Motor vehicles and parts, health care, gasoline and other energy goods, clothing and footwear, food services and accommodations, financial services and insurance
39. Kentucky
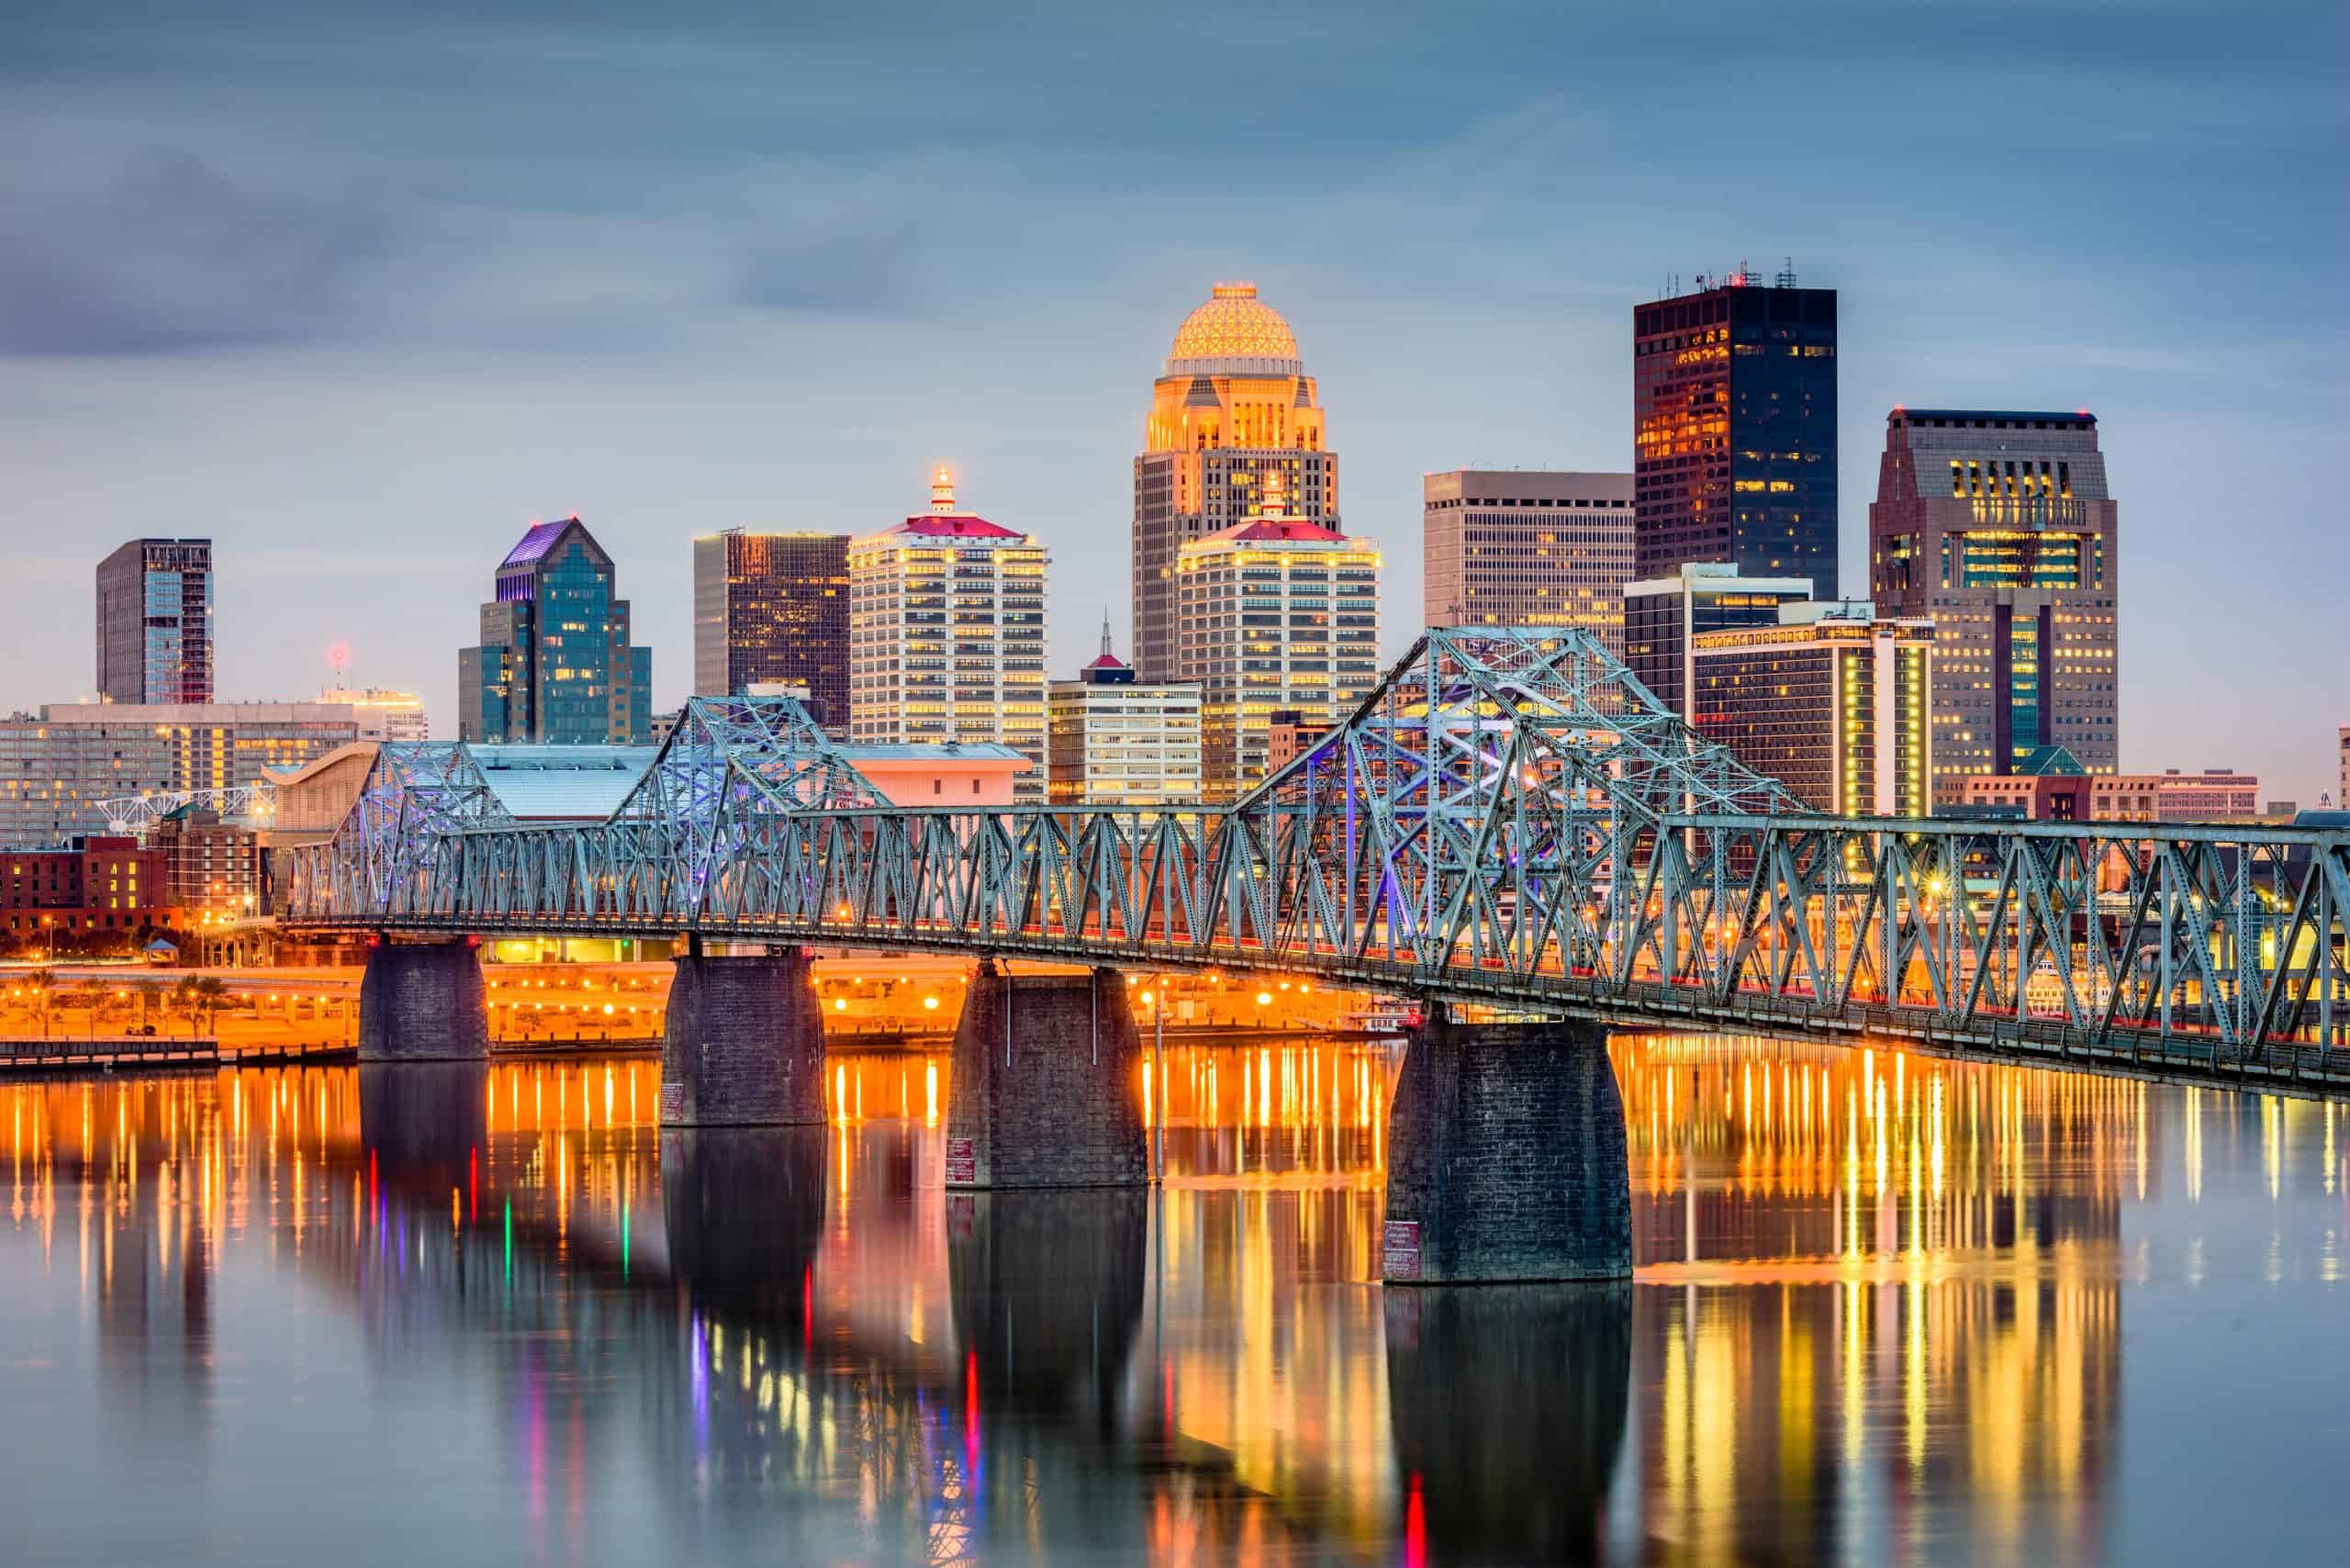
- Personal recreation expenditure, adjusted for population: $1,585 per capita
- Cost of living: -9.5% less than national average
- Total recreation expenditure: $7.2 billion
- Total population: 4.5 million
- Other major spending categories: Gasoline and other energy goods, health care, groceries, motor vehicles and parts, food services and accommodations
38. Michigan
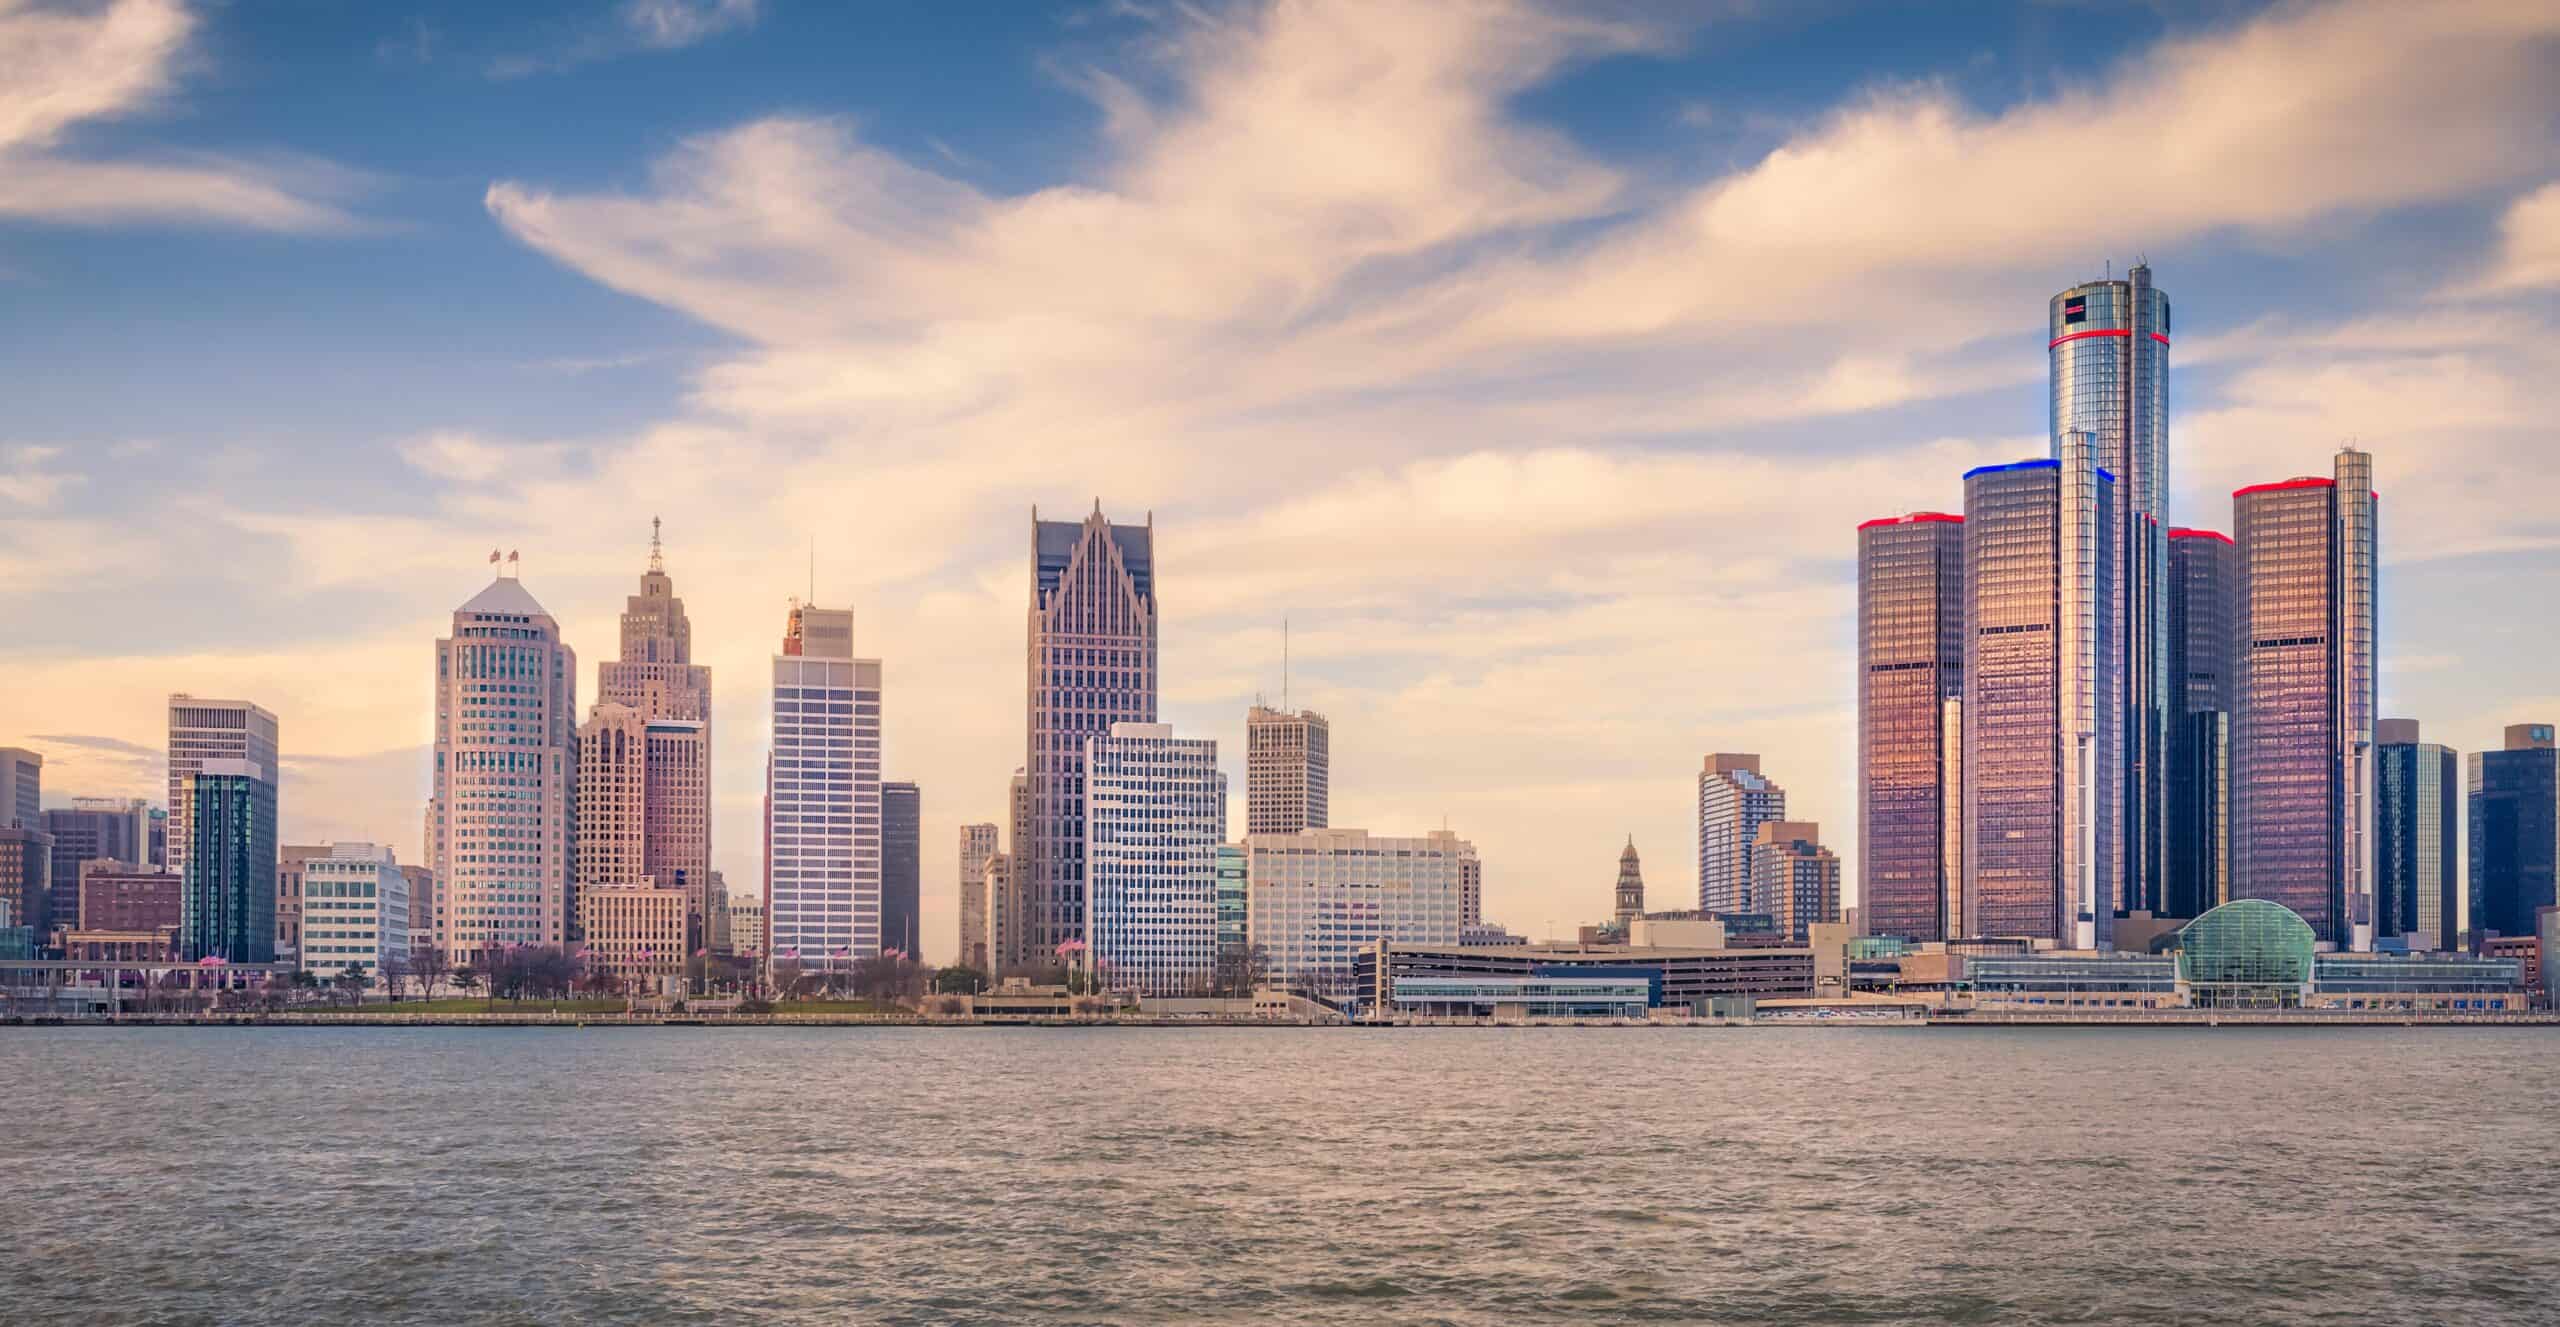
- Personal recreation expenditure, adjusted for population: $1,609 per capita
- Cost of living: -5.8% less than national average
- Total recreation expenditure: $16.1 billion
- Total population: 10.0 million
- Other major spending categories: Financial services and insurance, gasoline and other energy goods, recreational goods and vehicles, groceries, clothing and footwear, housing and utilities
37. Kansas
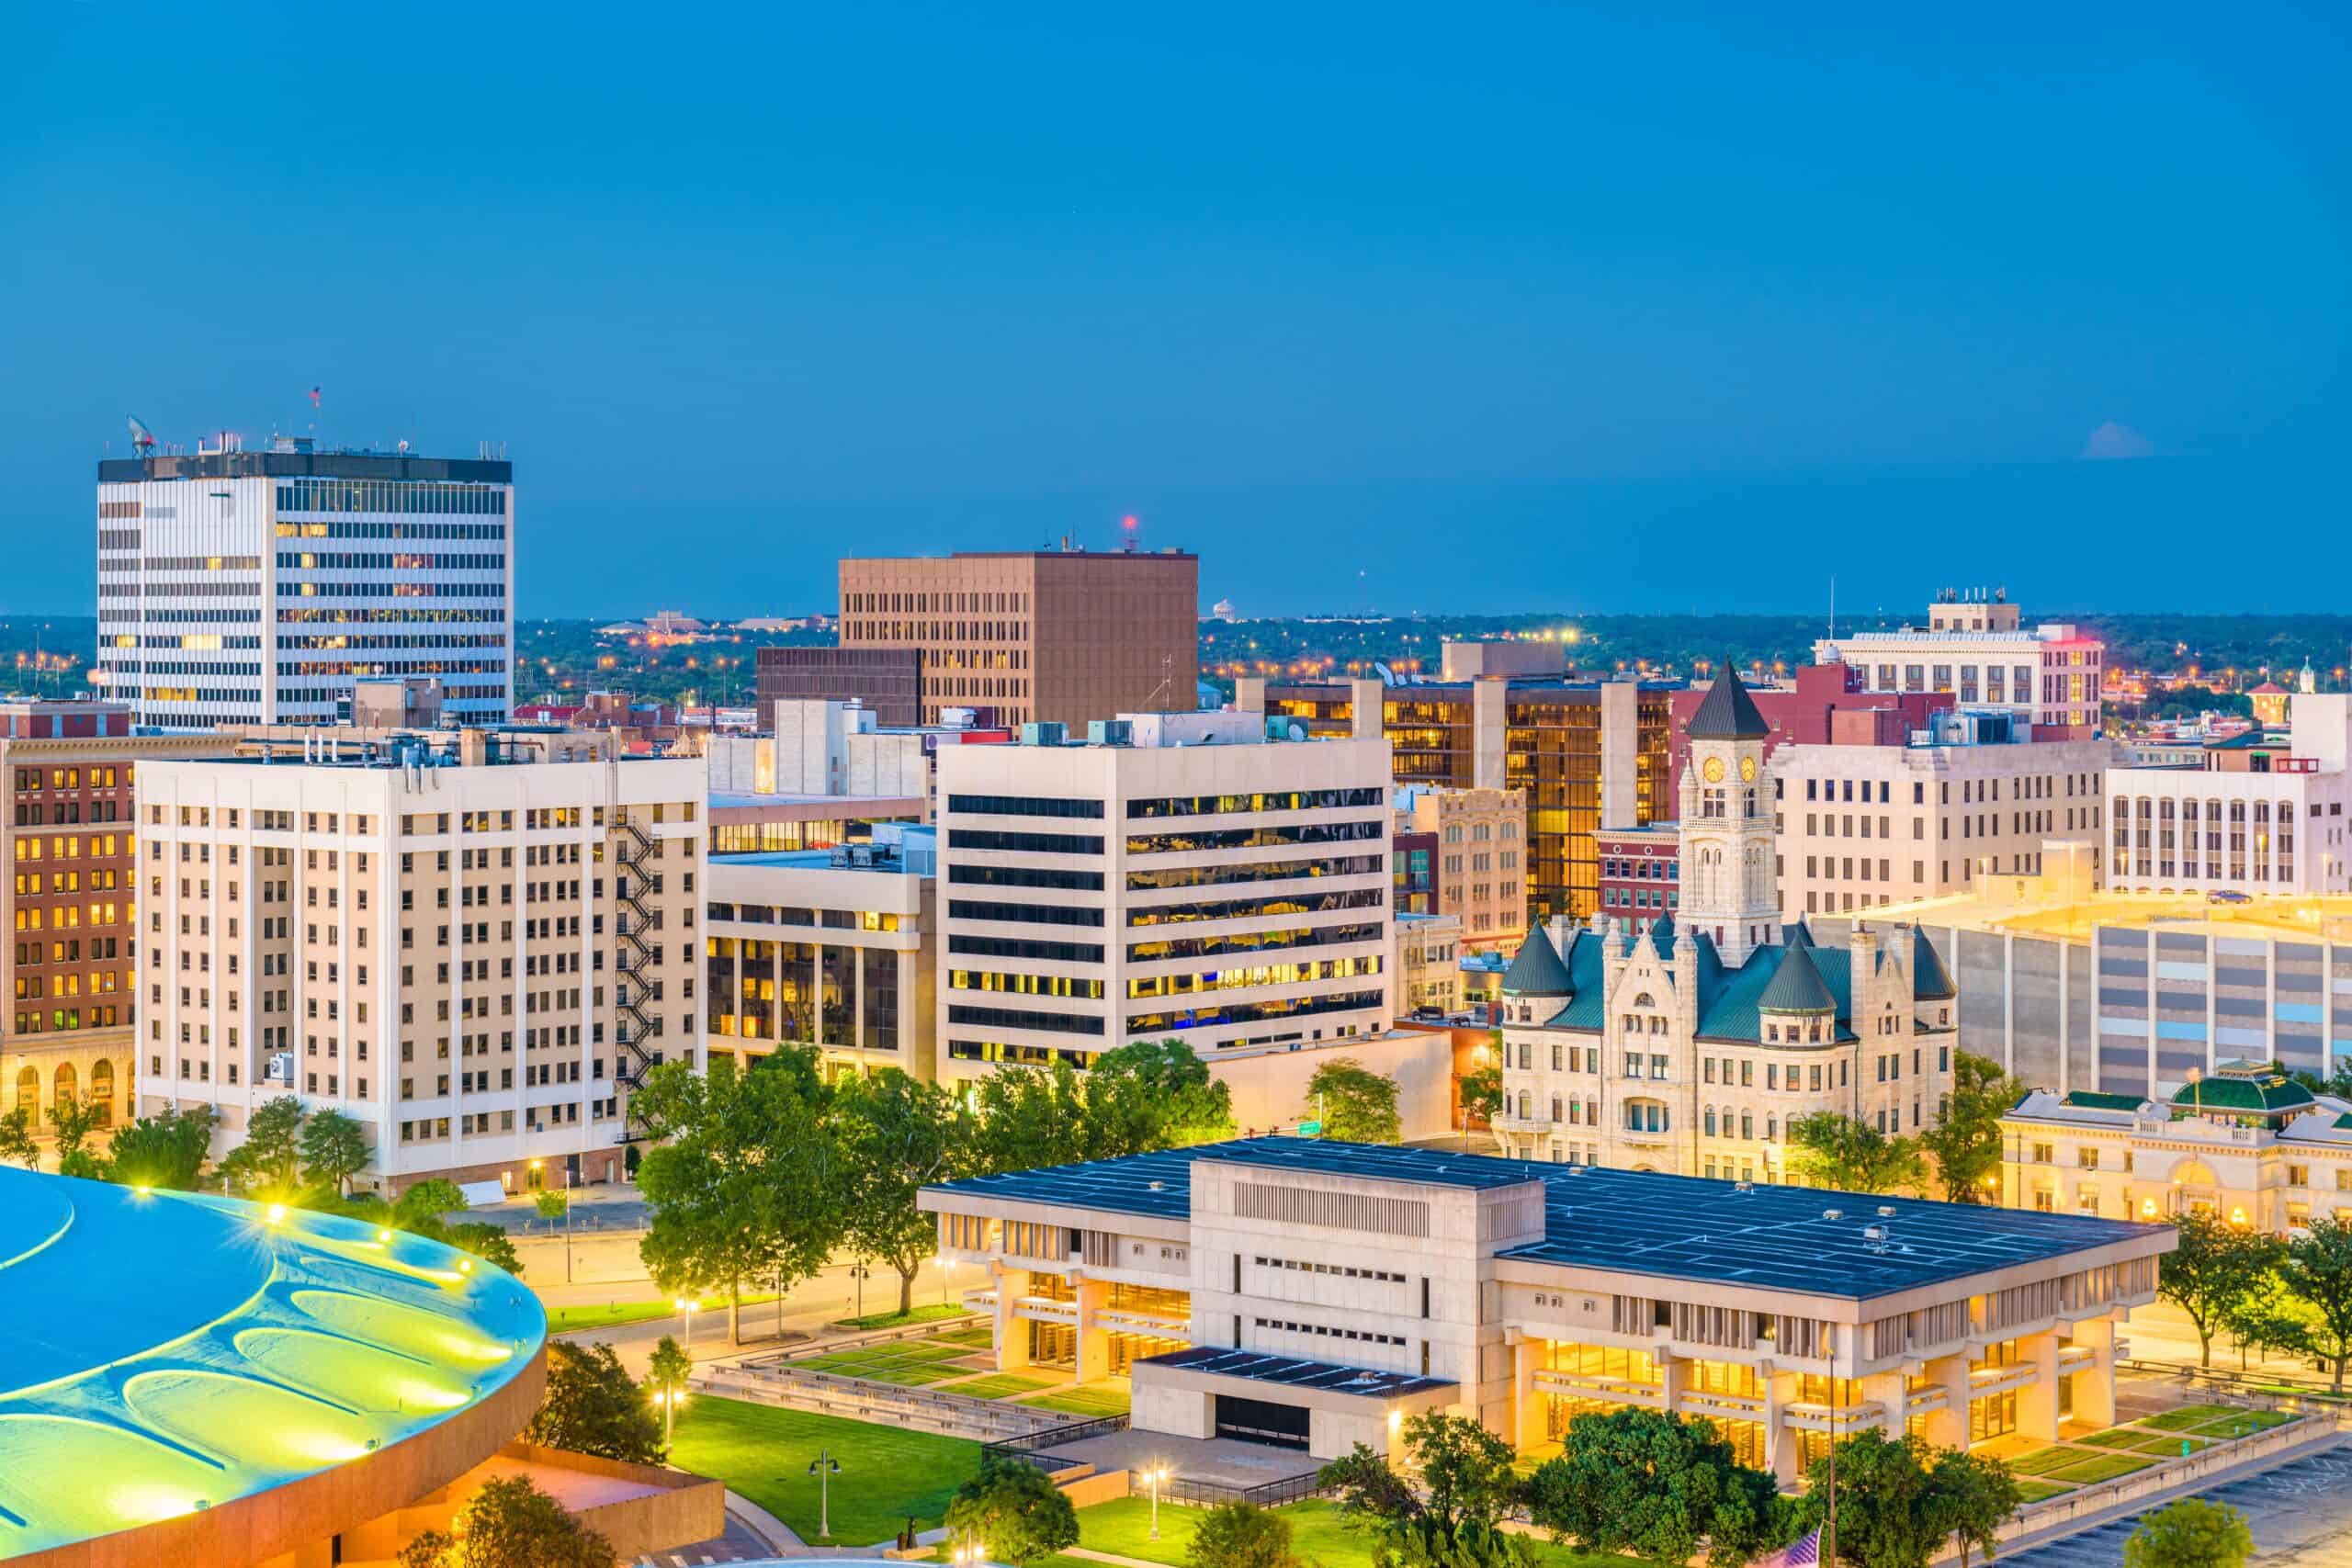
- Personal recreation expenditure, adjusted for population: $1,615 per capita
- Cost of living: -10.0% less than national average
- Total recreation expenditure: $4.7 billion
- Total population: 2.9 million
- Other major spending categories: Groceries, motor vehicles and parts, financial services and insurance, furnishings and durable household equipment, health care, gasoline and other energy goods
36. North Dakota
- Personal recreation expenditure, adjusted for population: $1,616 per capita
- Cost of living: -11.4% less than national average
- Total recreation expenditure: $1.3 billion
- Total population: 783,926
- Other major spending categories: Recreational goods and vehicles, health care, financial services and insurance, motor vehicles and parts, clothing and footwear, furnishings and durable household equipment
35. Wisconsin
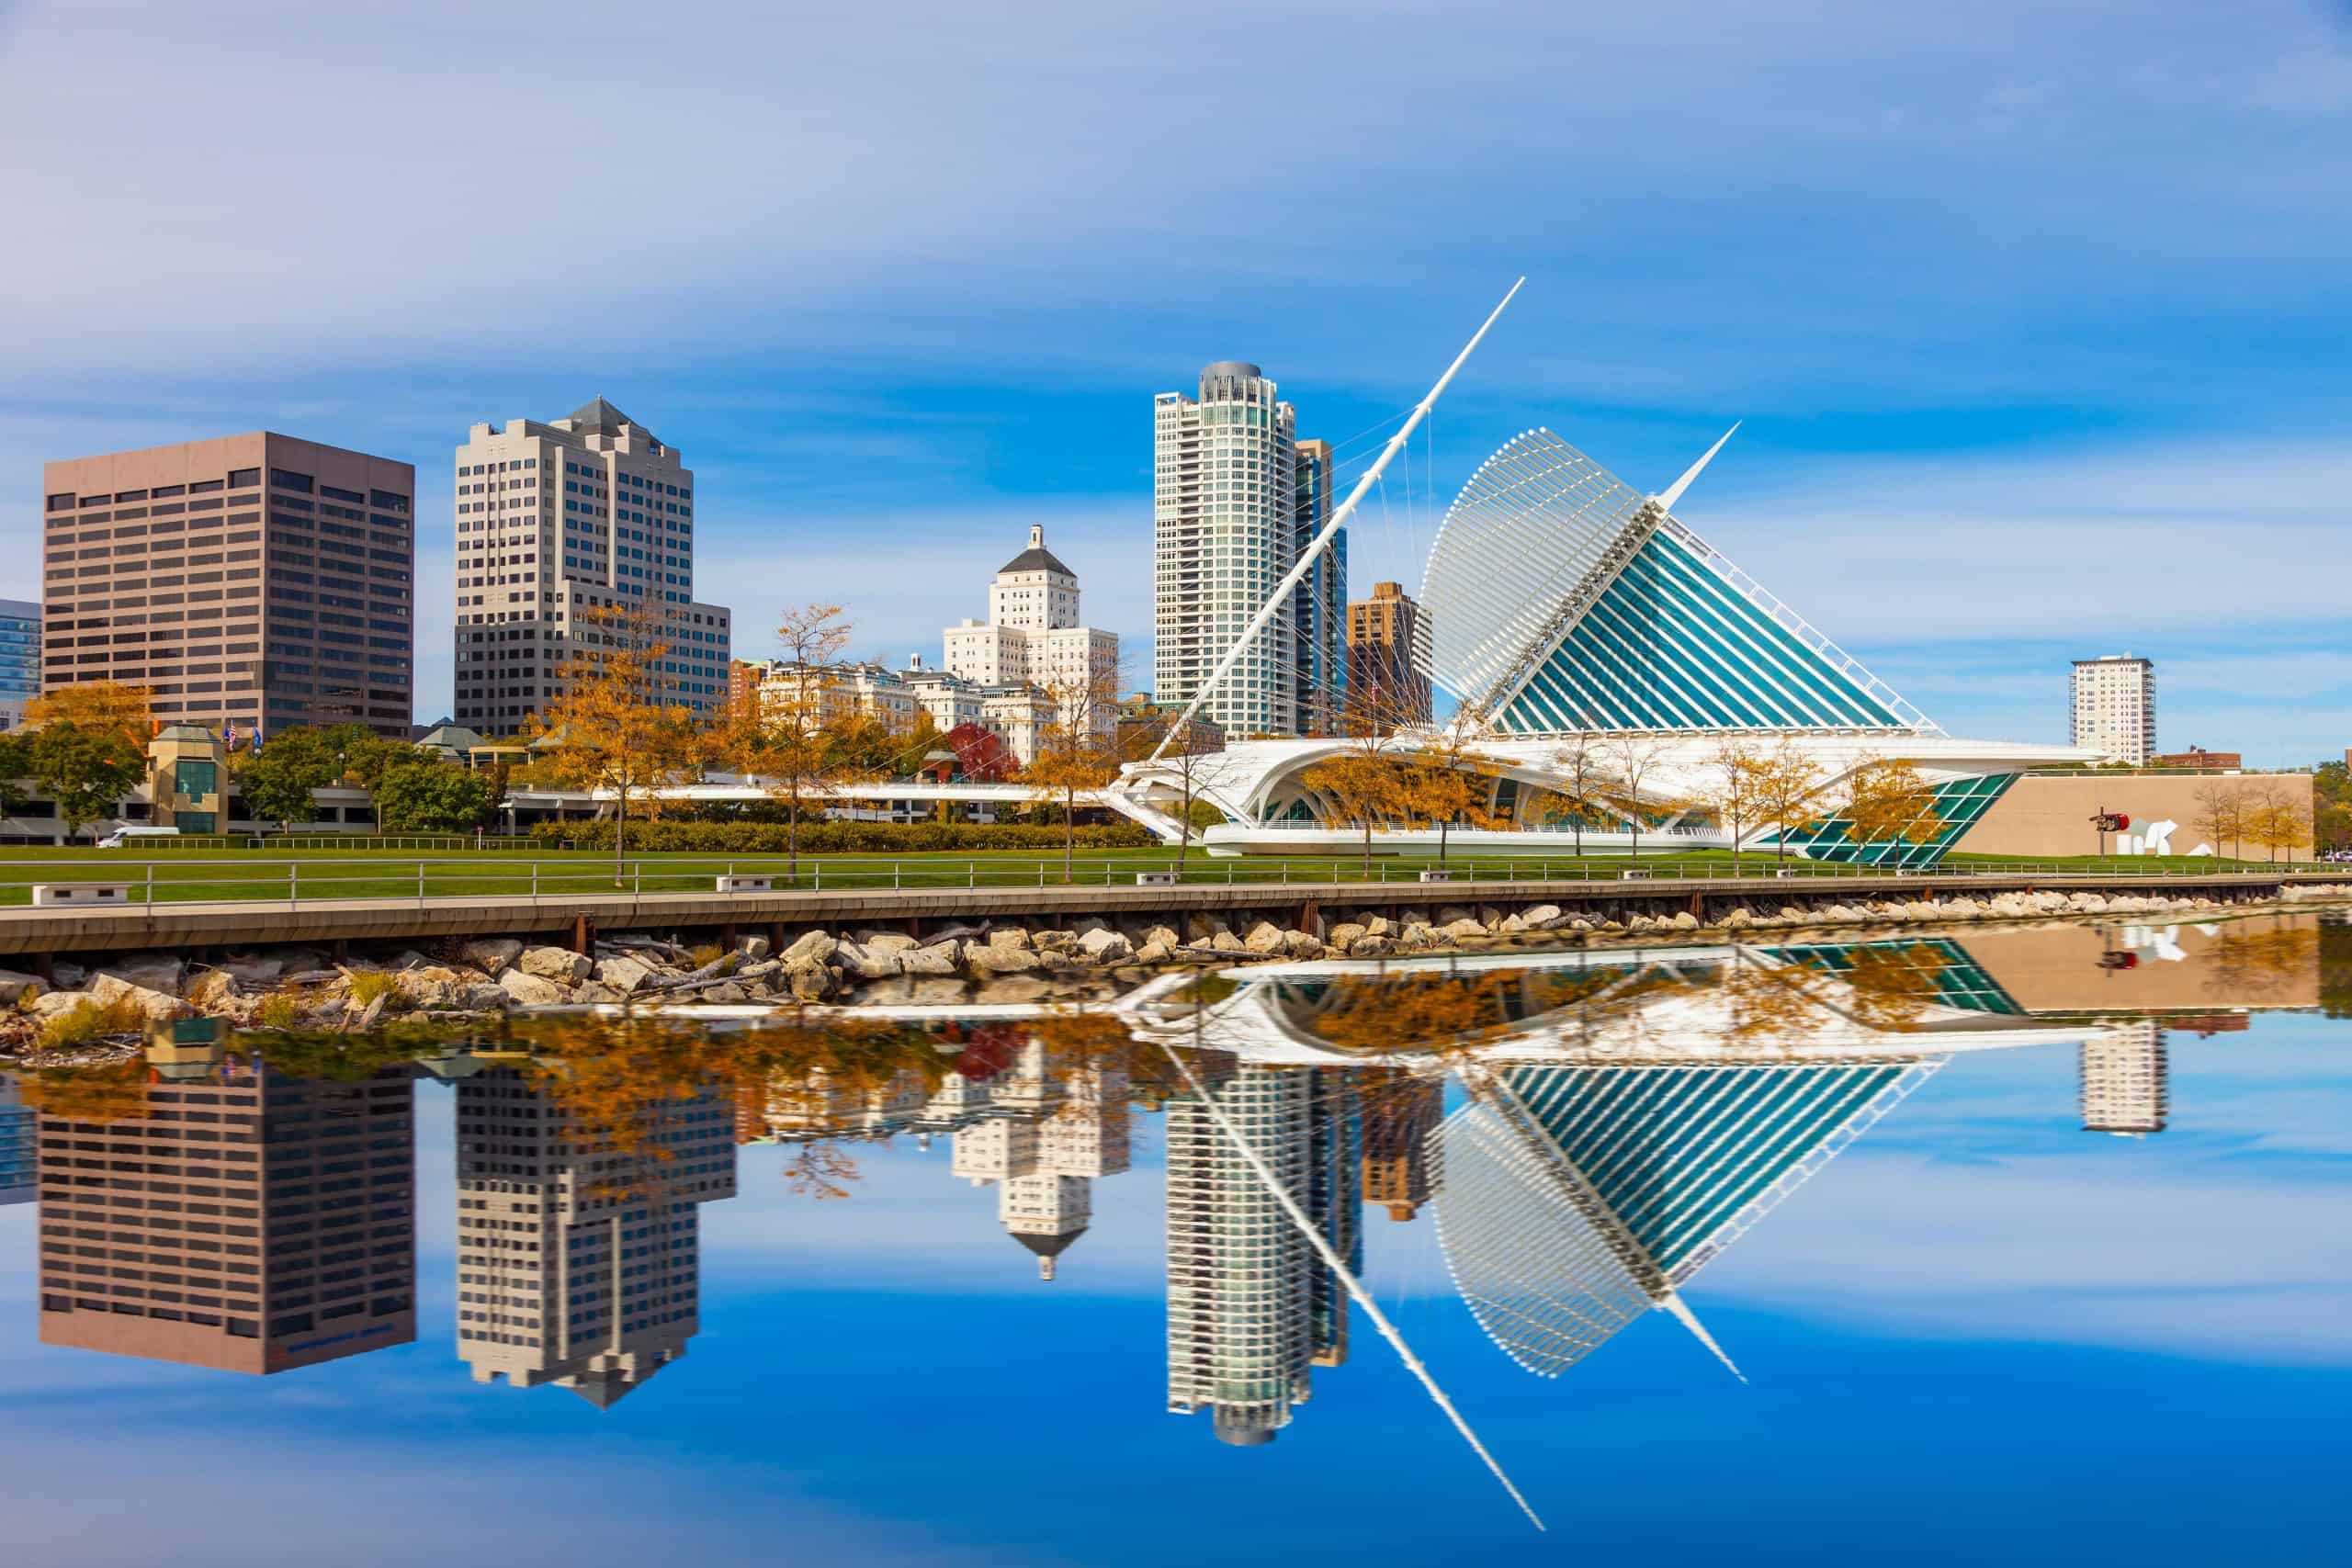
- Personal recreation expenditure, adjusted for population: $1,709 per capita
- Cost of living: -6.9% less than national average
- Total recreation expenditure: $10.1 billion
- Total population: 5.9 million
- Other major spending categories: Gasoline and other energy goods, motor vehicles and parts, recreational goods and vehicles, financial services and insurance, health care, furnishings and durable household equipment
34. Delaware
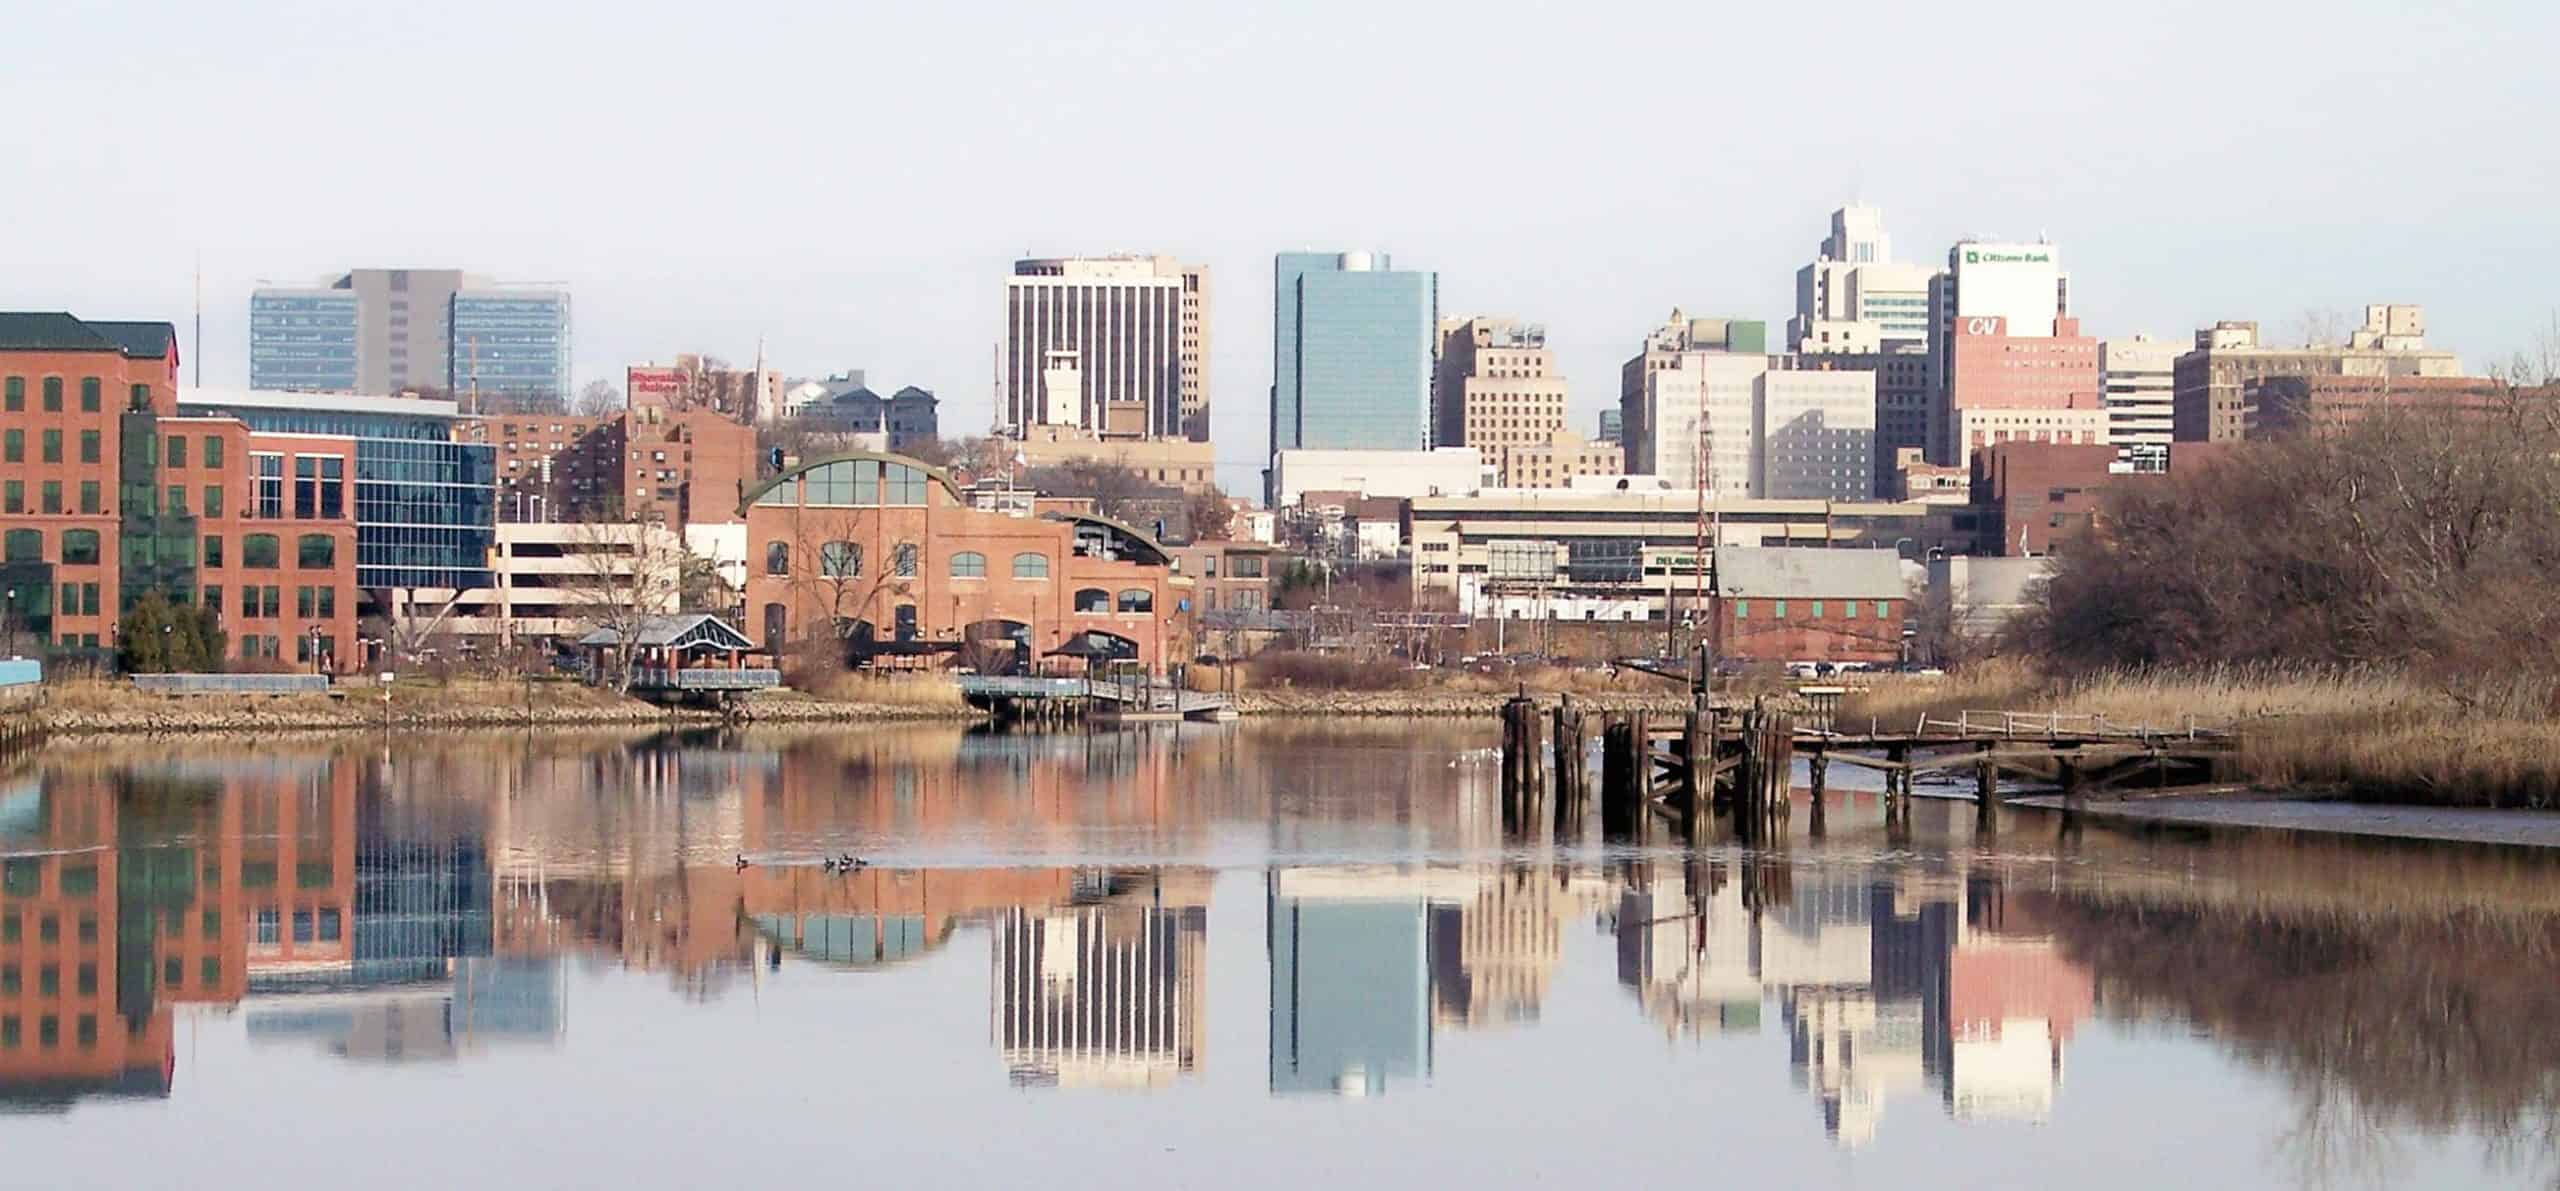
- Personal recreation expenditure, adjusted for population: $1,789 per capita
- Cost of living: -0.7% less than national average
- Total recreation expenditure: $1.8 billion
- Total population: 1.0 million
- Other major spending categories: Health care, furnishings and durable household equipment, food services and accommodations, gasoline and other energy goods, housing and utilities, clothing and footwear
33. Ohio
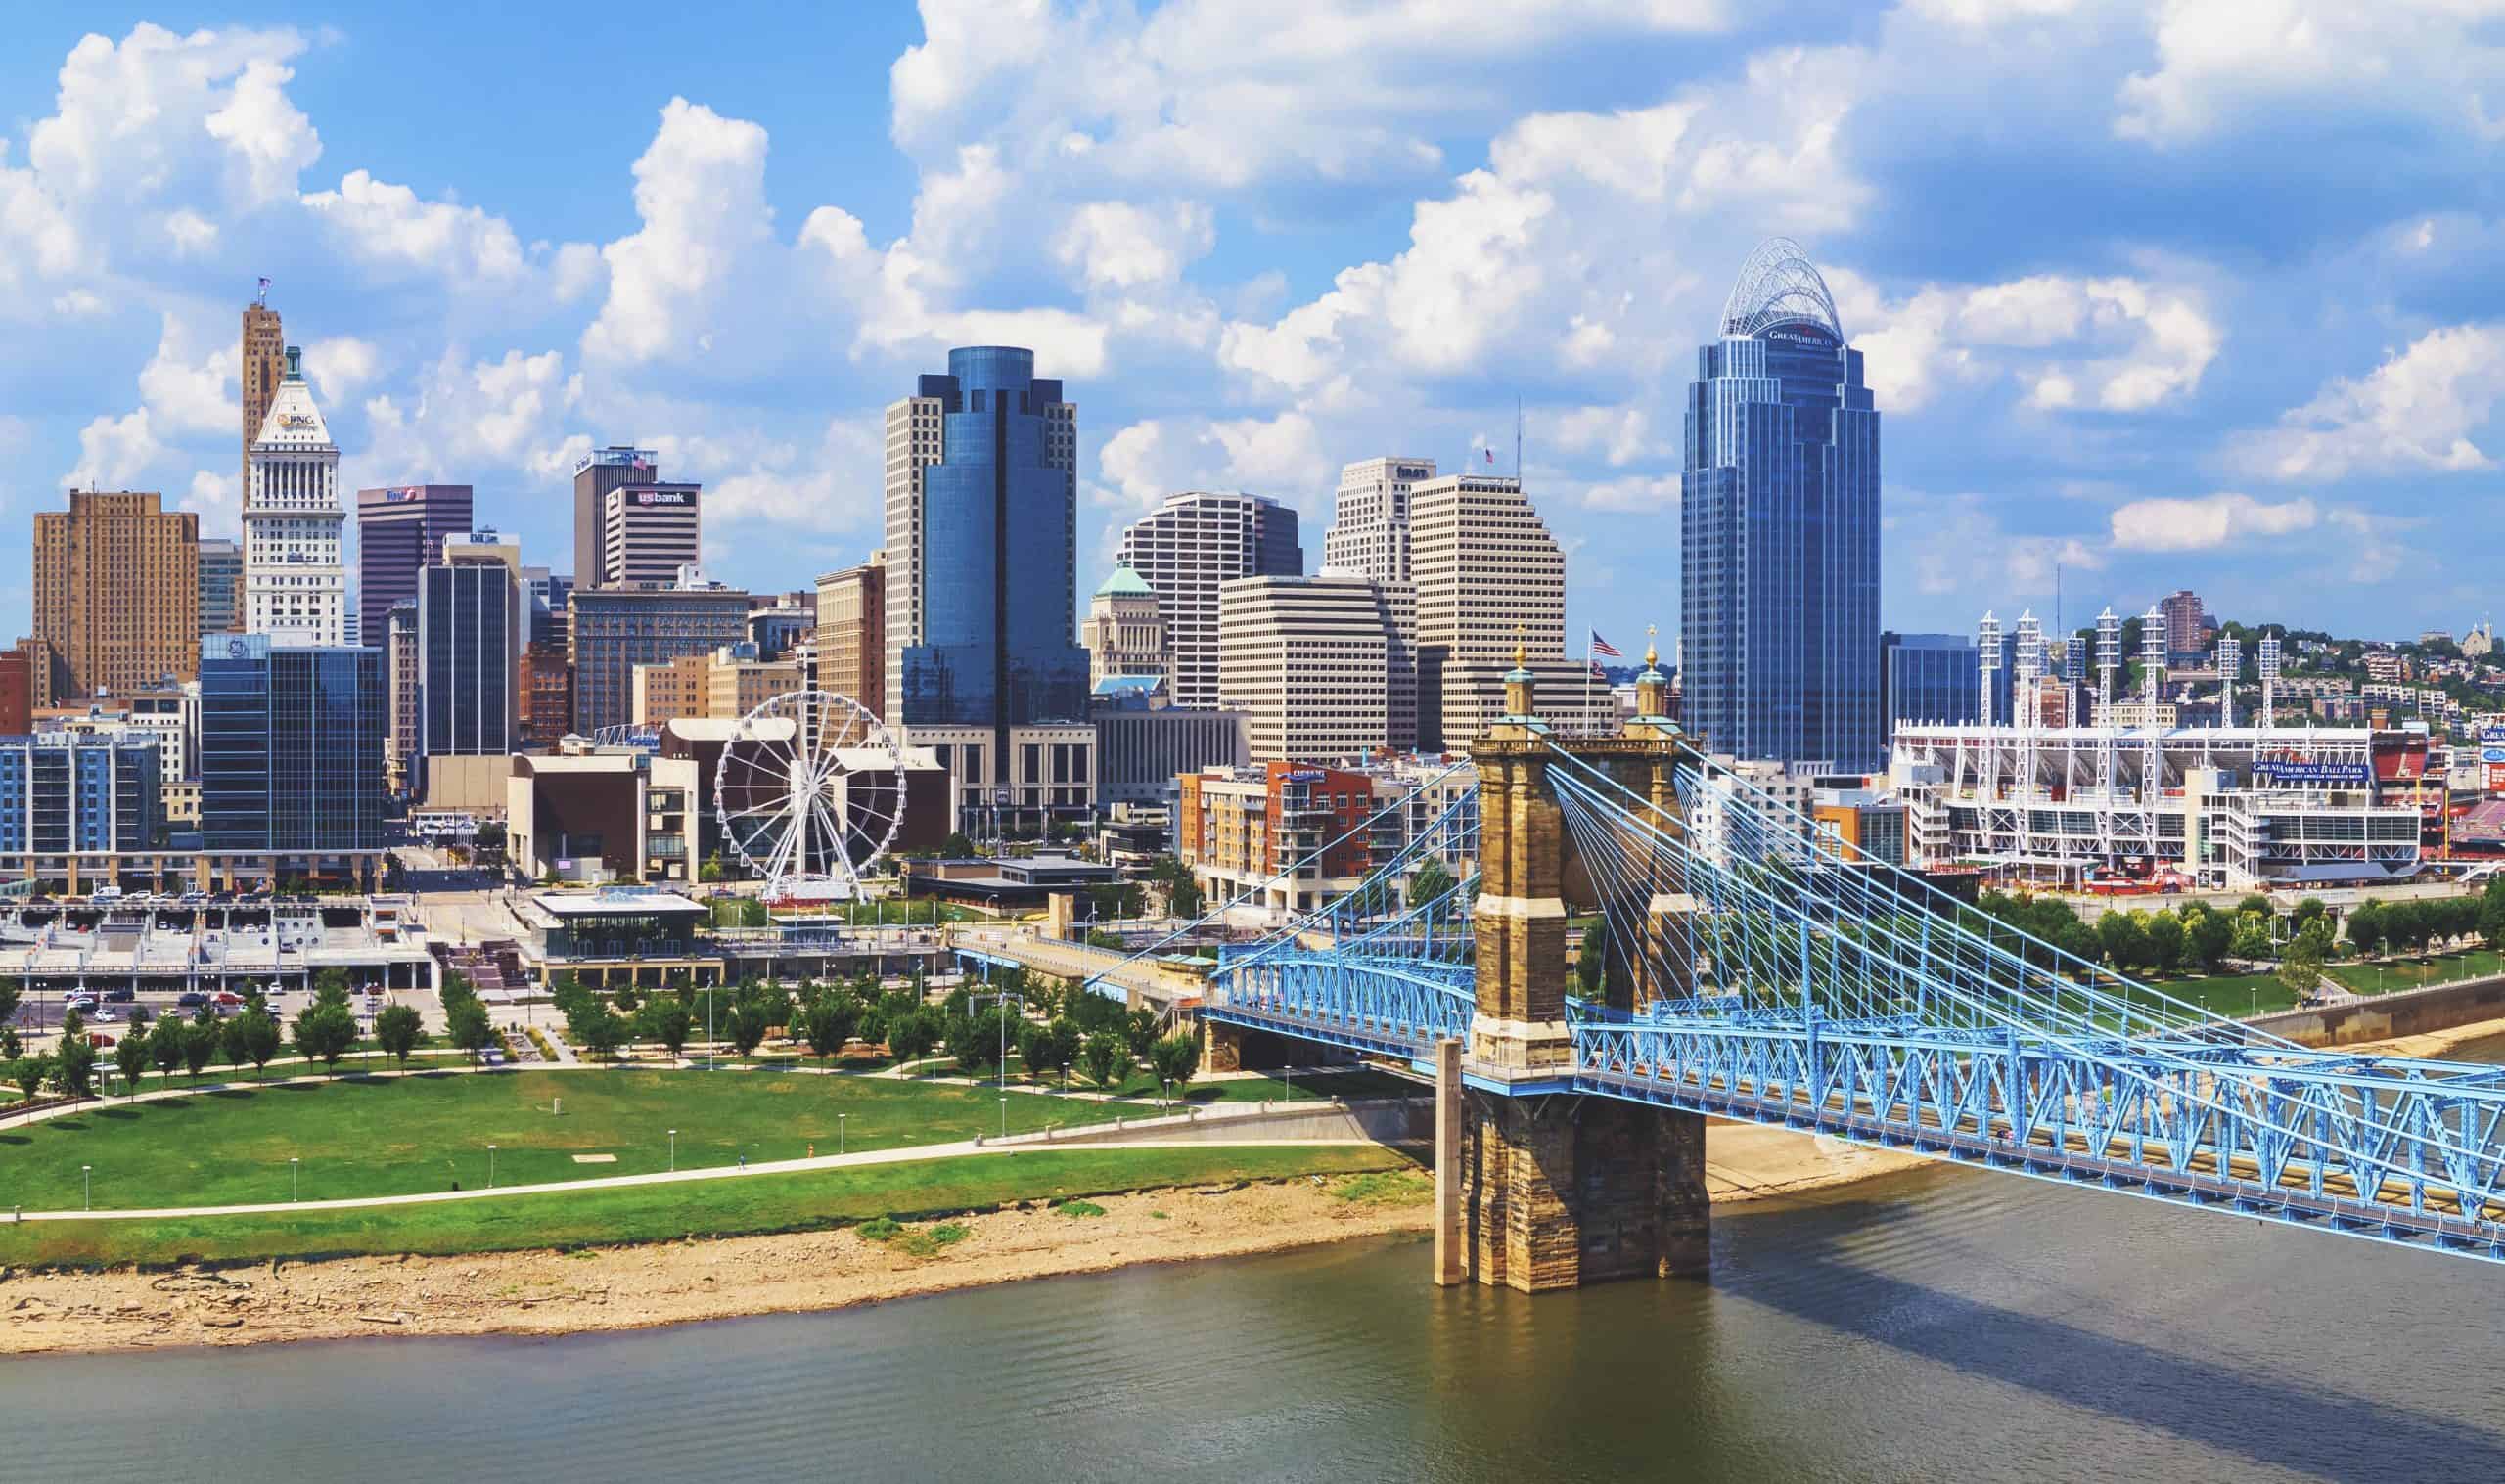
- Personal recreation expenditure, adjusted for population: $1,799 per capita
- Cost of living: -8.2% less than national average
- Total recreation expenditure: $21.2 billion
- Total population: 11.8 million
- Other major spending categories: Health care, recreational goods and vehicles, groceries, gasoline and other energy goods, furnishings and durable household equipment
32. Tennessee
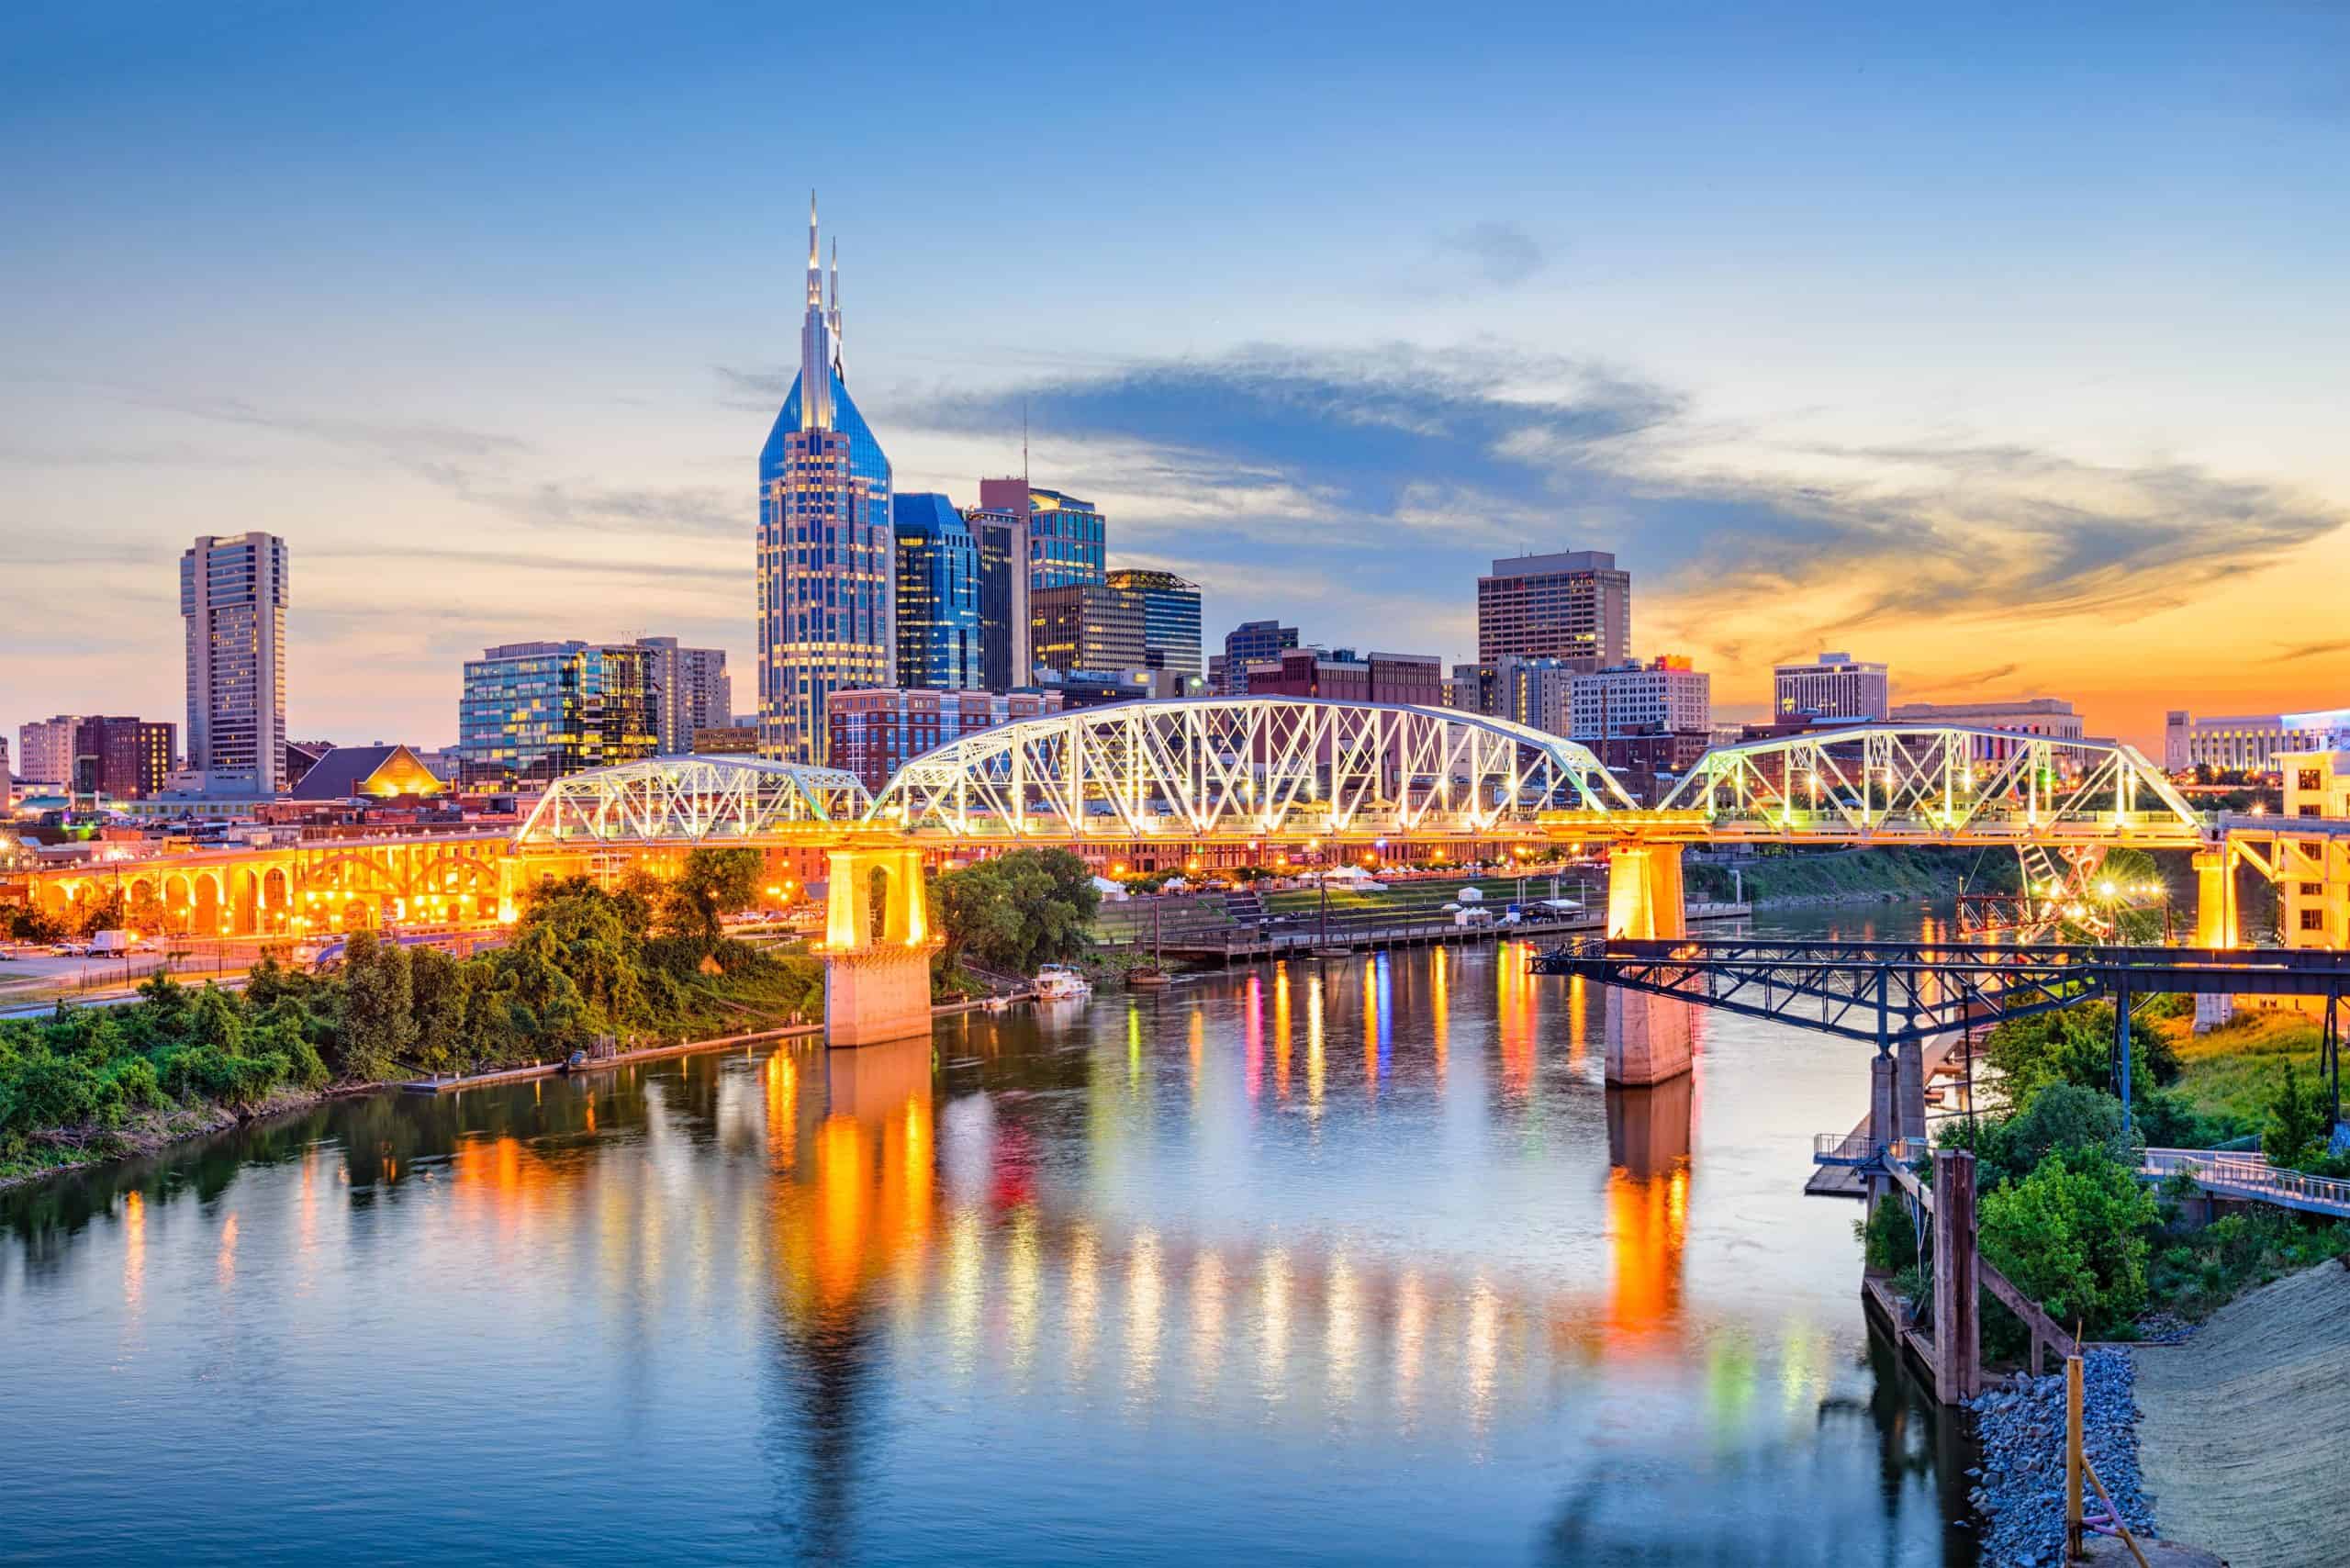
- Personal recreation expenditure, adjusted for population: $1,805 per capita
- Cost of living: -7.5% less than national average
- Total recreation expenditure: $12.9 billion
- Total population: 7.1 million
- Other major spending categories: Clothing and footwear, food services and accommodations, financial services and insurance, gasoline and other energy goods, motor vehicles and parts, furnishings and durable household equipment
31. Minnesota
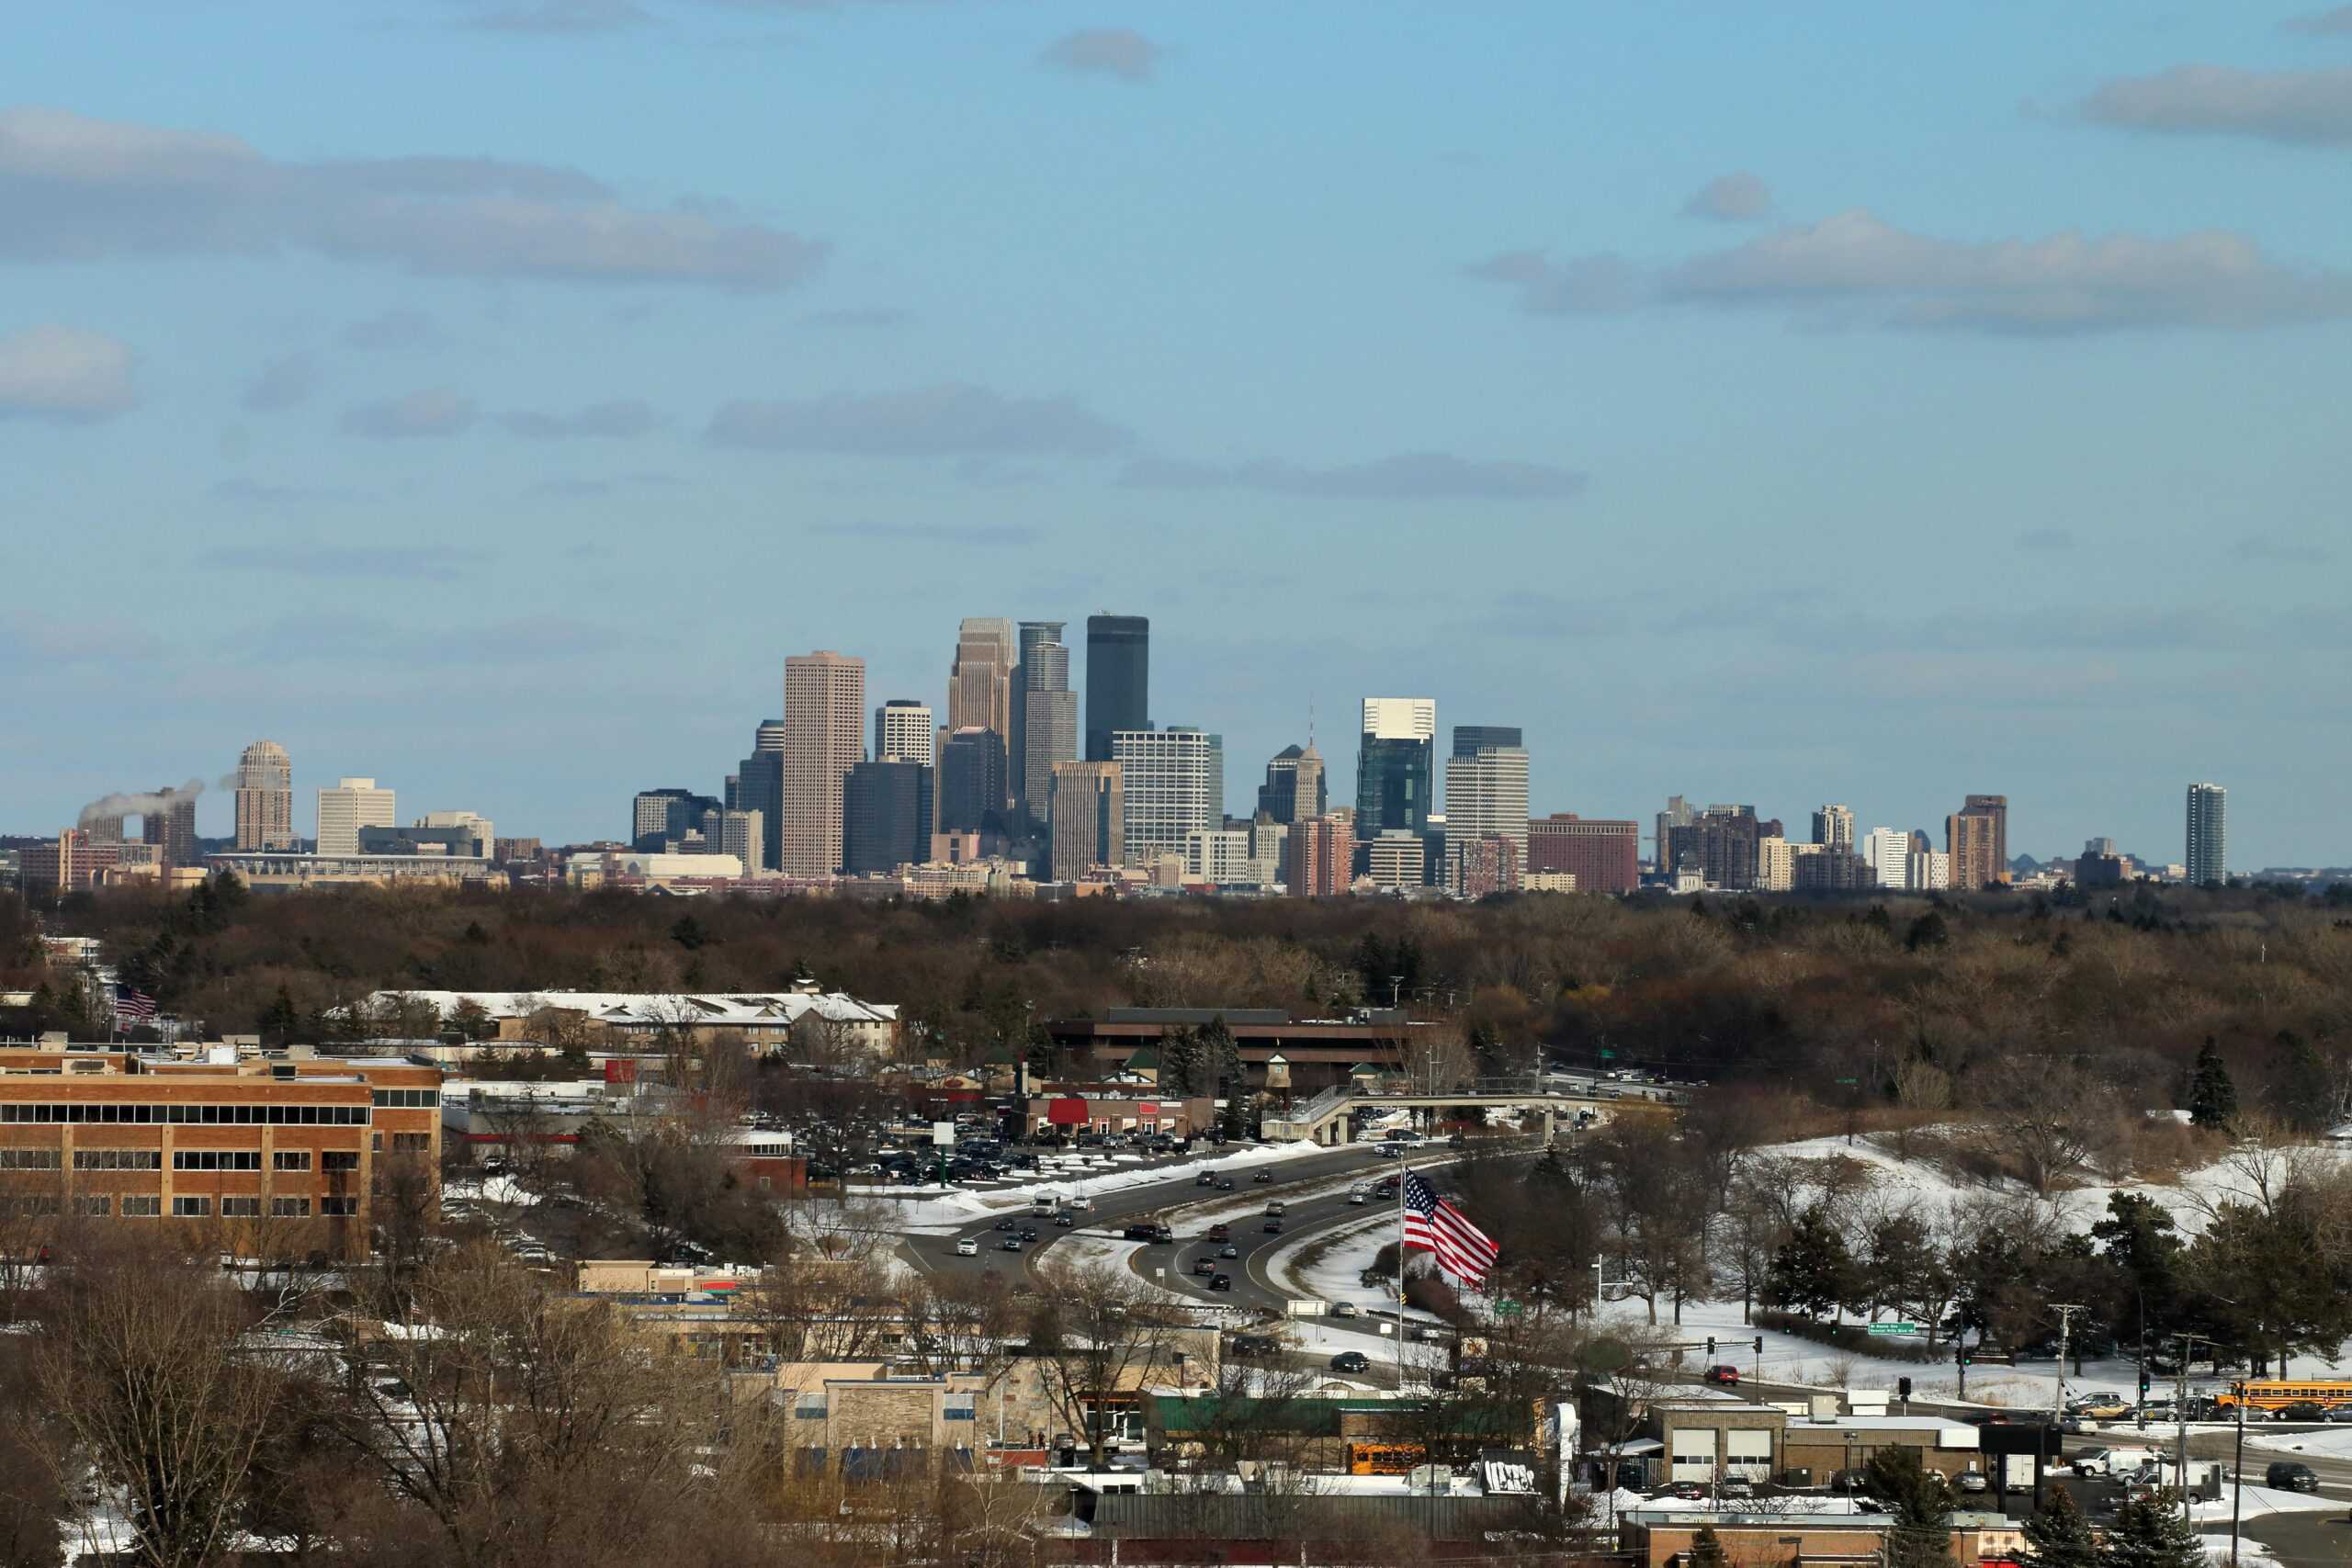
- Personal recreation expenditure, adjusted for population: $1,841 per capita
- Cost of living: -1.6% less than national average
- Total recreation expenditure: $10.6 billion
- Total population: 5.7 million
- Other major spending categories: Recreational goods and vehicles, motor vehicles and parts, financial services and insurance, health care, gasoline and other energy goods, clothing and footwear
30. South Carolina
- Personal recreation expenditure, adjusted for population: $1,966 per capita
- Cost of living: -6.8% less than national average
- Total recreation expenditure: $10.6 billion
- Total population: 5.4 million
- Other major spending categories: Gasoline and other energy goods, motor vehicles and parts, clothing and footwear, groceries, housing and utilities, food services and accommodations
29. North Carolina

- Personal recreation expenditure, adjusted for population: $1,968 per capita
- Cost of living: -5.9% less than national average
- Total recreation expenditure: $21.3 billion
- Total population: 10.8 million
- Other major spending categories: Recreational goods and vehicles, furnishings and durable household equipment, motor vehicles and parts, clothing and footwear, groceries
28. Utah

- Personal recreation expenditure, adjusted for population: $1,999 per capita
- Cost of living: -5.0% less than national average
- Total recreation expenditure: $6.8 billion
- Total population: 3.4 million
- Other major spending categories: Recreational goods and vehicles, furnishings and durable household equipment, motor vehicles and parts, transportation services, gasoline and other energy goods, housing and utilities
27. Missouri
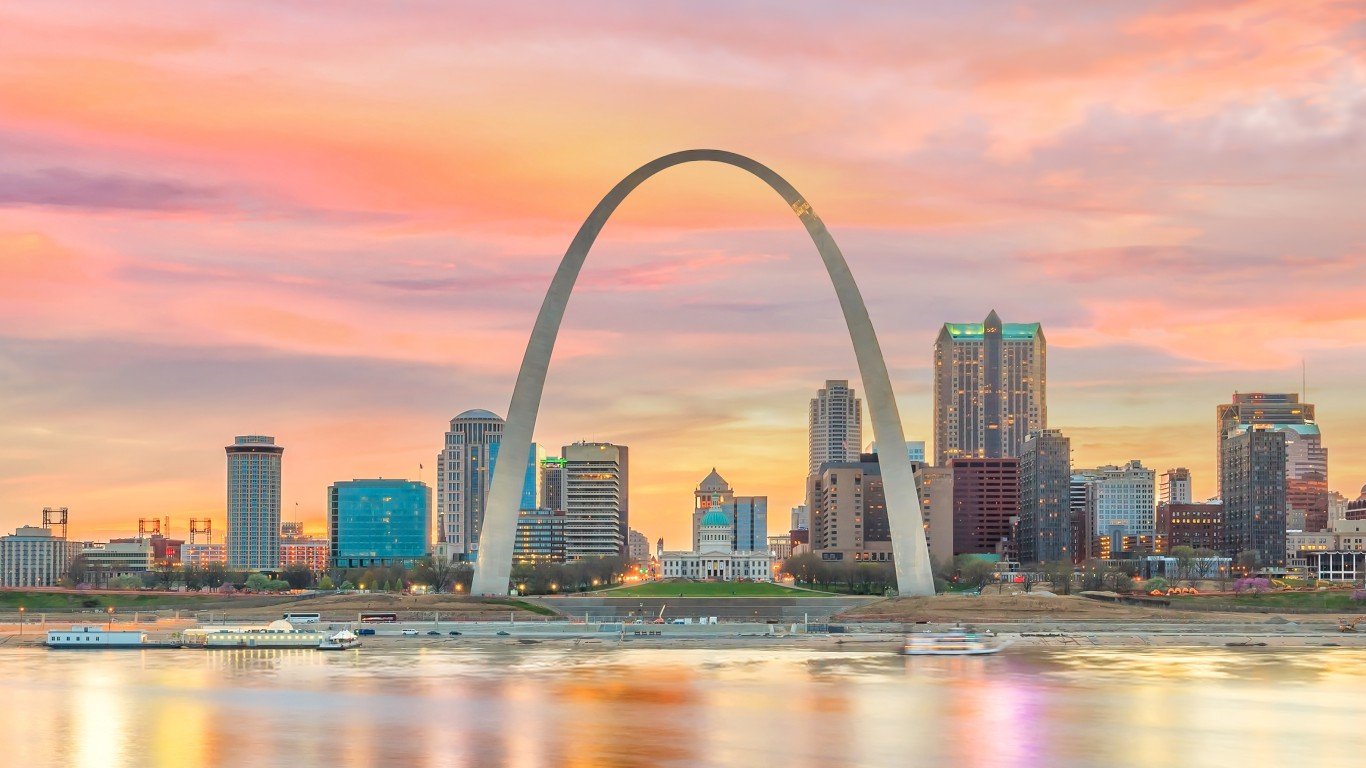
- Personal recreation expenditure, adjusted for population: $2,033 per capita
- Cost of living: -8.2% less than national average
- Total recreation expenditure: $12.6 billion
- Total population: 6.2 million
- Other major spending categories: Gasoline and other energy goods, motor vehicles and parts, financial services and insurance, health care, transportation services
26. Pennsylvania
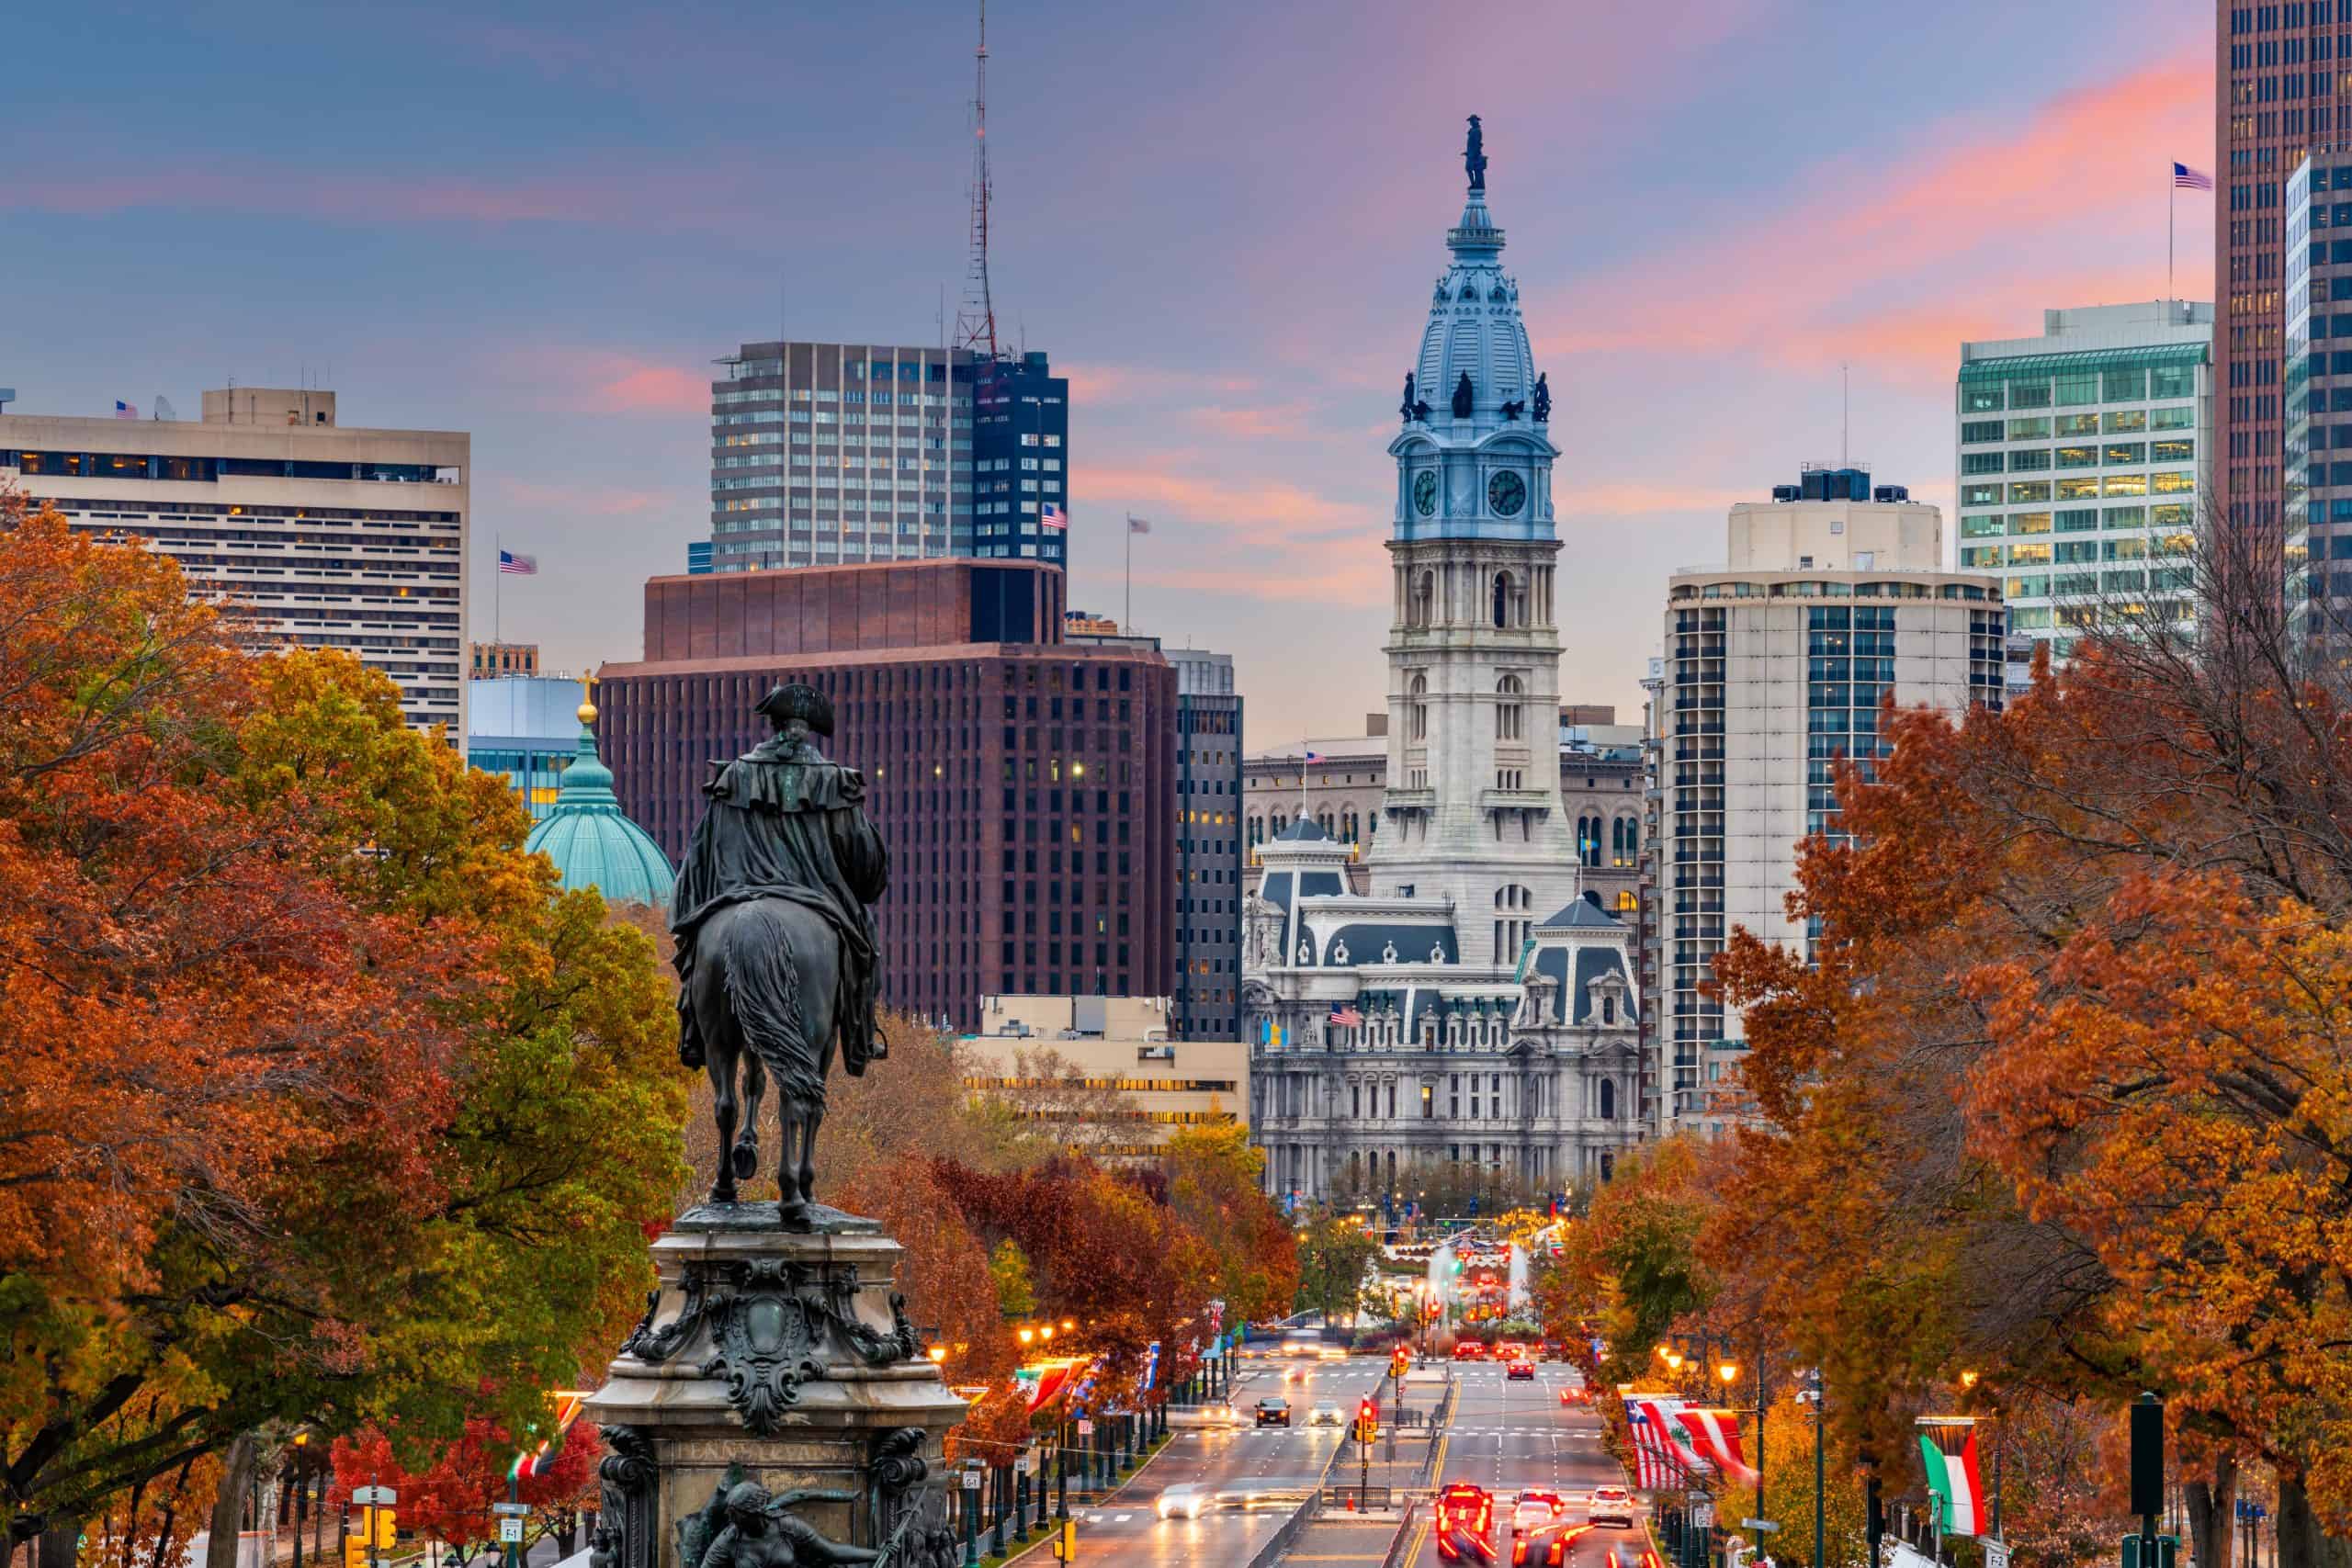
- Personal recreation expenditure, adjusted for population: $2,036 per capita
- Cost of living: -2.5% less than national average
- Total recreation expenditure: $26.4 billion
- Total population: 13.0 million
- Other major spending categories: Recreational goods and vehicles, financial services and insurance, health care, furnishings and durable household equipment, gasoline and other energy goods, clothing and footwear
25. South Dakota
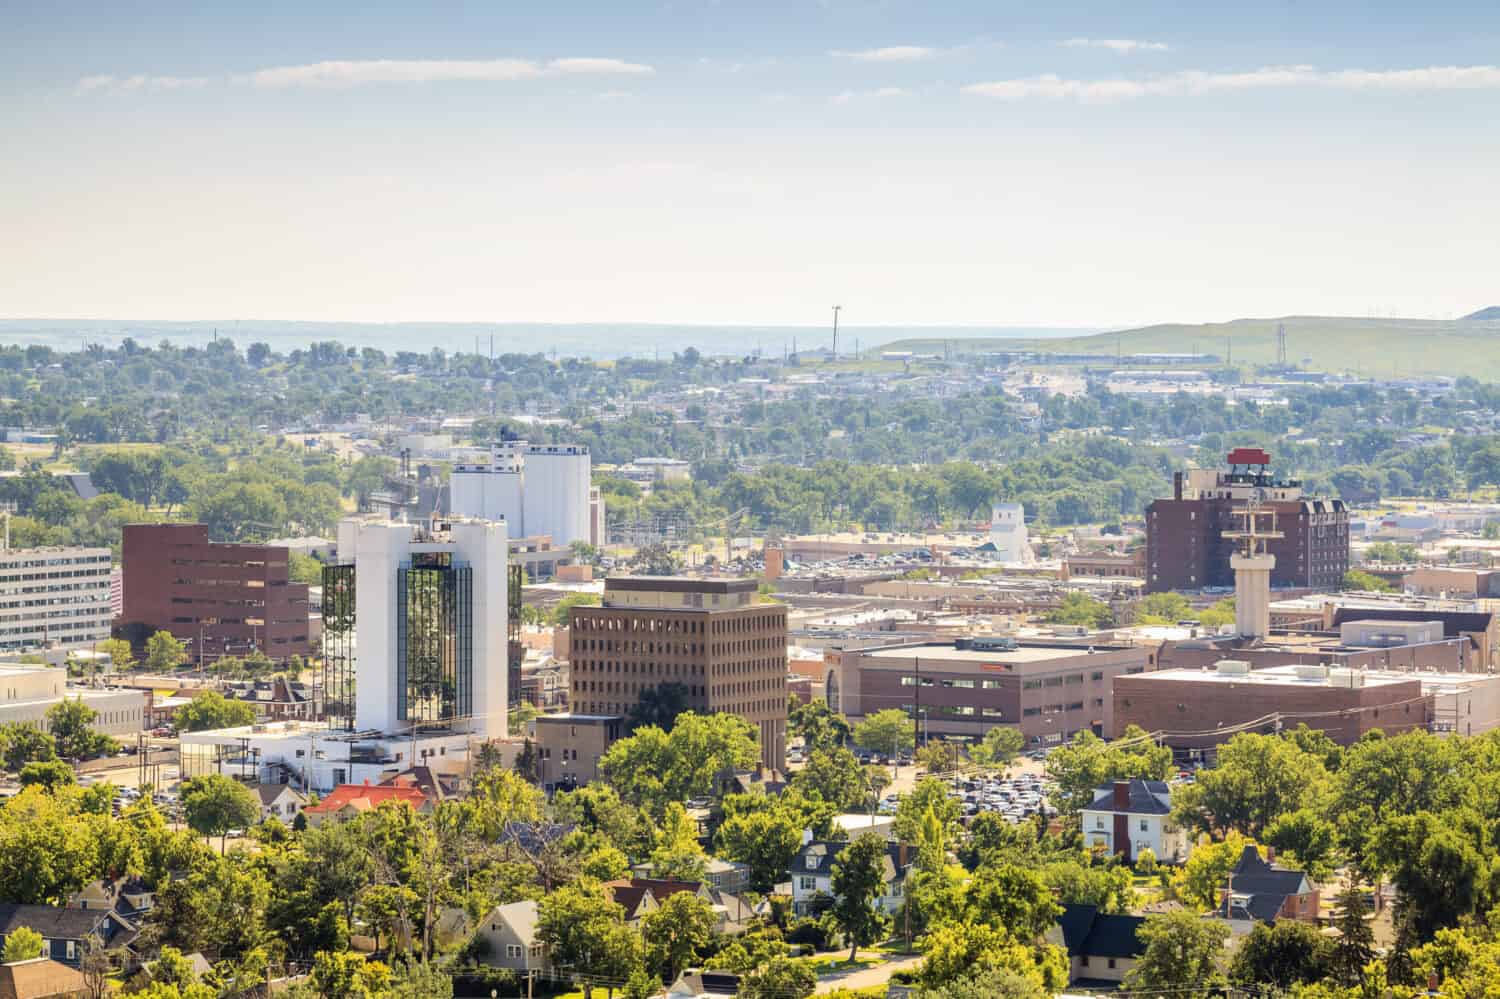
- Personal recreation expenditure, adjusted for population: $2,072 per capita
- Cost of living: -11.9% less than national average
- Total recreation expenditure: $1.9 billion
- Total population: 919,318
- Other major spending categories: Health care, furnishings and durable household equipment, transportation services, clothing and footwear, food services and accommodations
24. Illinois
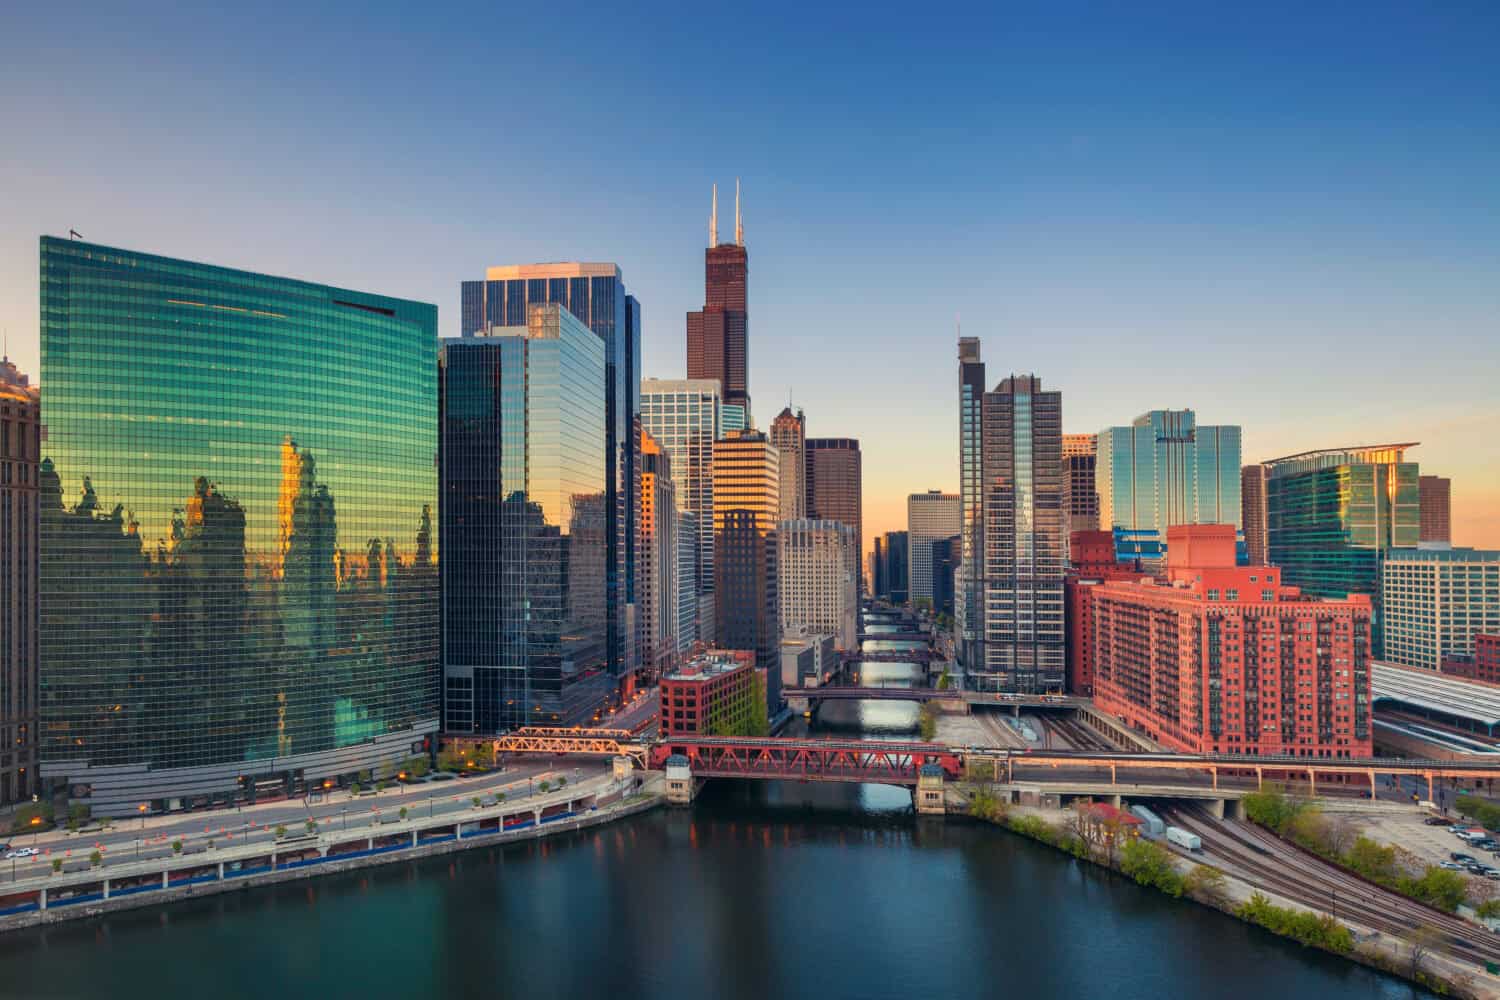
- Personal recreation expenditure, adjusted for population: $2,080 per capita
- Cost of living: -1.1% less than national average
- Total recreation expenditure: $26.1 billion
- Total population: 12.5 million
- Other major spending categories: Clothing and footwear, transportation services, recreational goods and vehicles, financial services and insurance, food services and accommodations, furnishings and durable household equipment
23. Wyoming
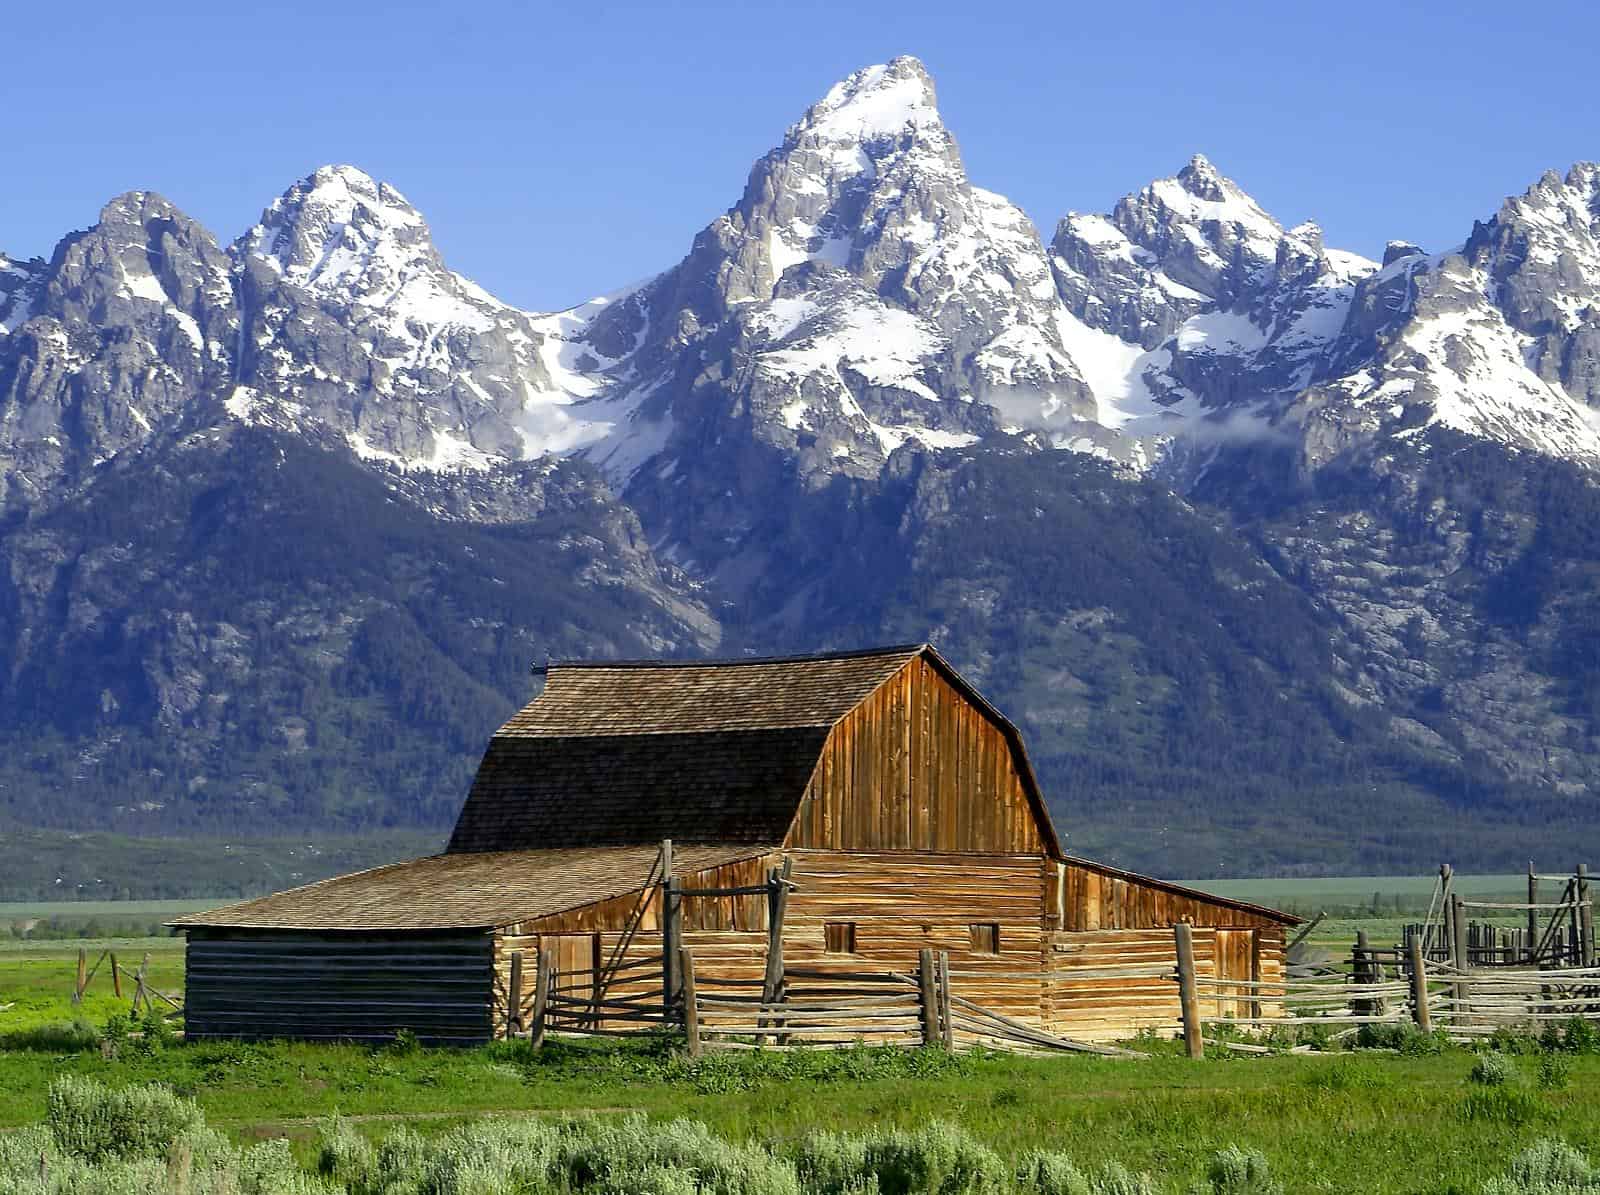
- Personal recreation expenditure, adjusted for population: $2,113 per capita
- Cost of living: -9.2% less than national average
- Total recreation expenditure: $1.2 billion
- Total population: 584,057
- Other major spending categories: Financial services and insurance, clothing and footwear, motor vehicles and parts, gasoline and other energy goods, groceries, transportation services
22. Oregon
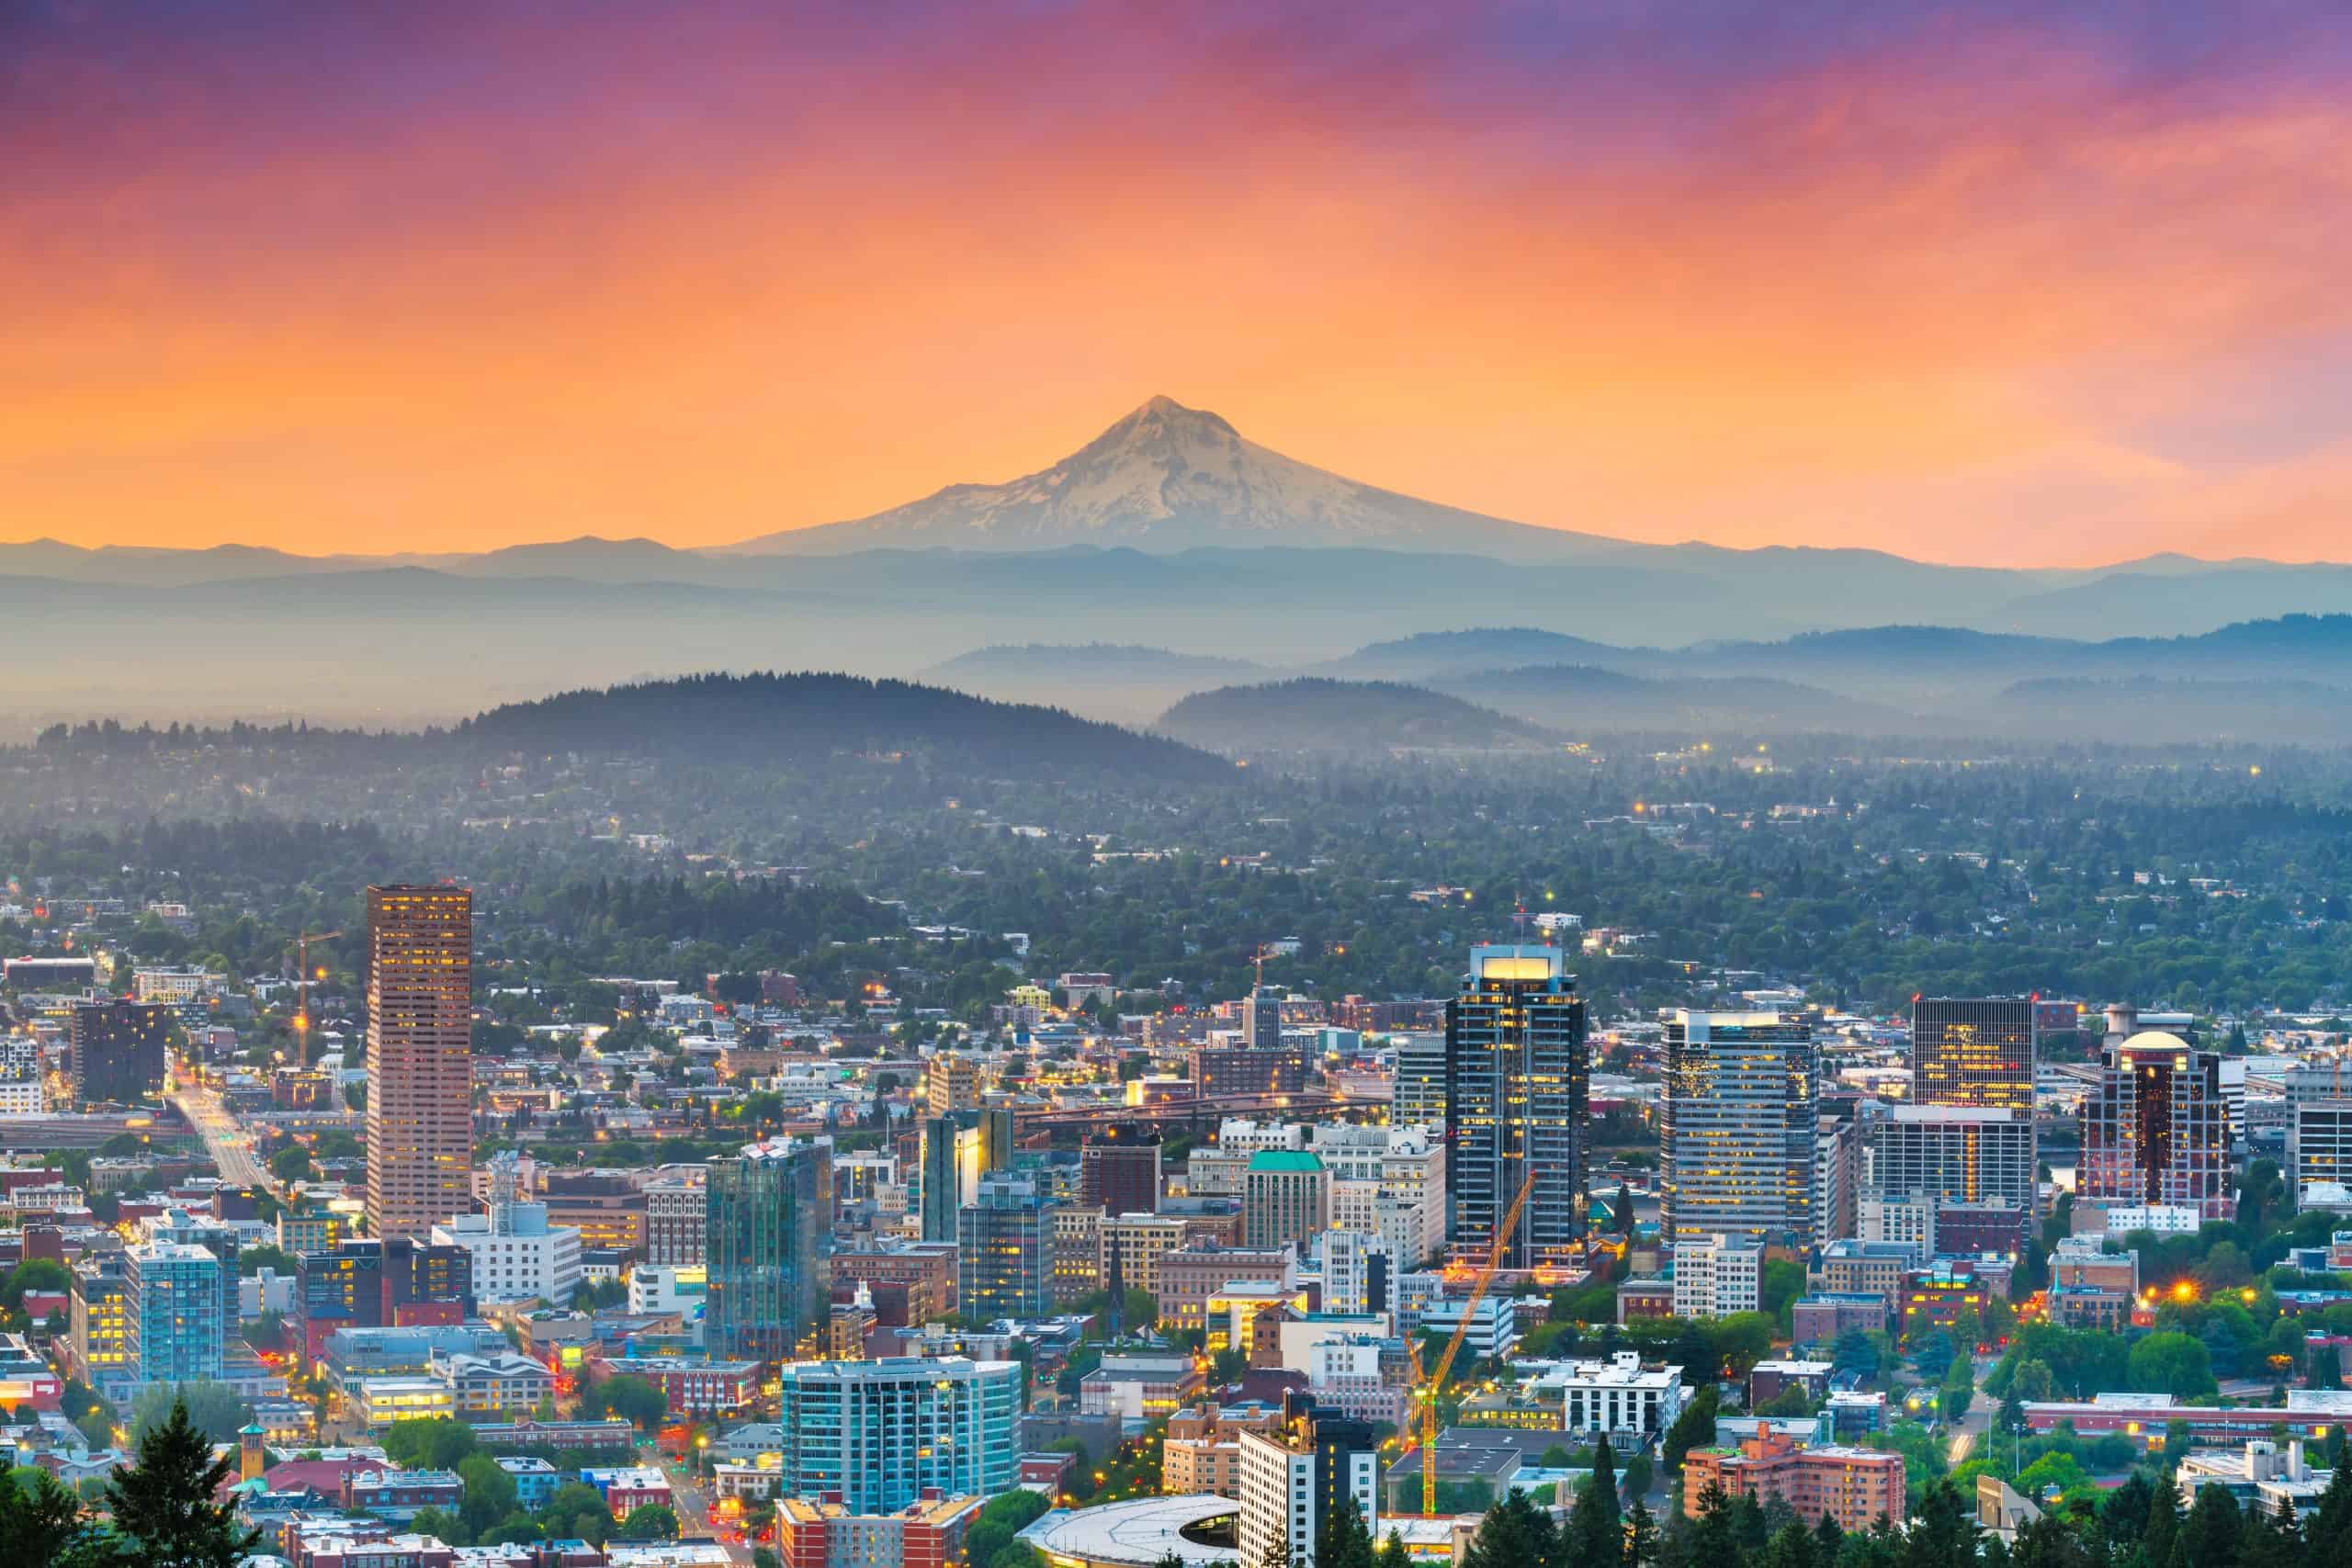
- Personal recreation expenditure, adjusted for population: $2,143 per capita
- Cost of living: +4.7% more than national average
- Total recreation expenditure: $9.1 billion
- Total population: 4.2 million
- Other major spending categories: Furnishings and durable household equipment, recreational goods and vehicles, groceries, clothing and footwear, food services and accommodations, housing and utilities
21. Georgia

- Personal recreation expenditure, adjusted for population: $2,178 per capita
- Cost of living: -3.3% less than national average
- Total recreation expenditure: $24.0 billion
- Total population: 11.0 million
- Other major spending categories: Transportation services, clothing and footwear, groceries, motor vehicles and parts, gasoline and other energy goods
20. Maryland
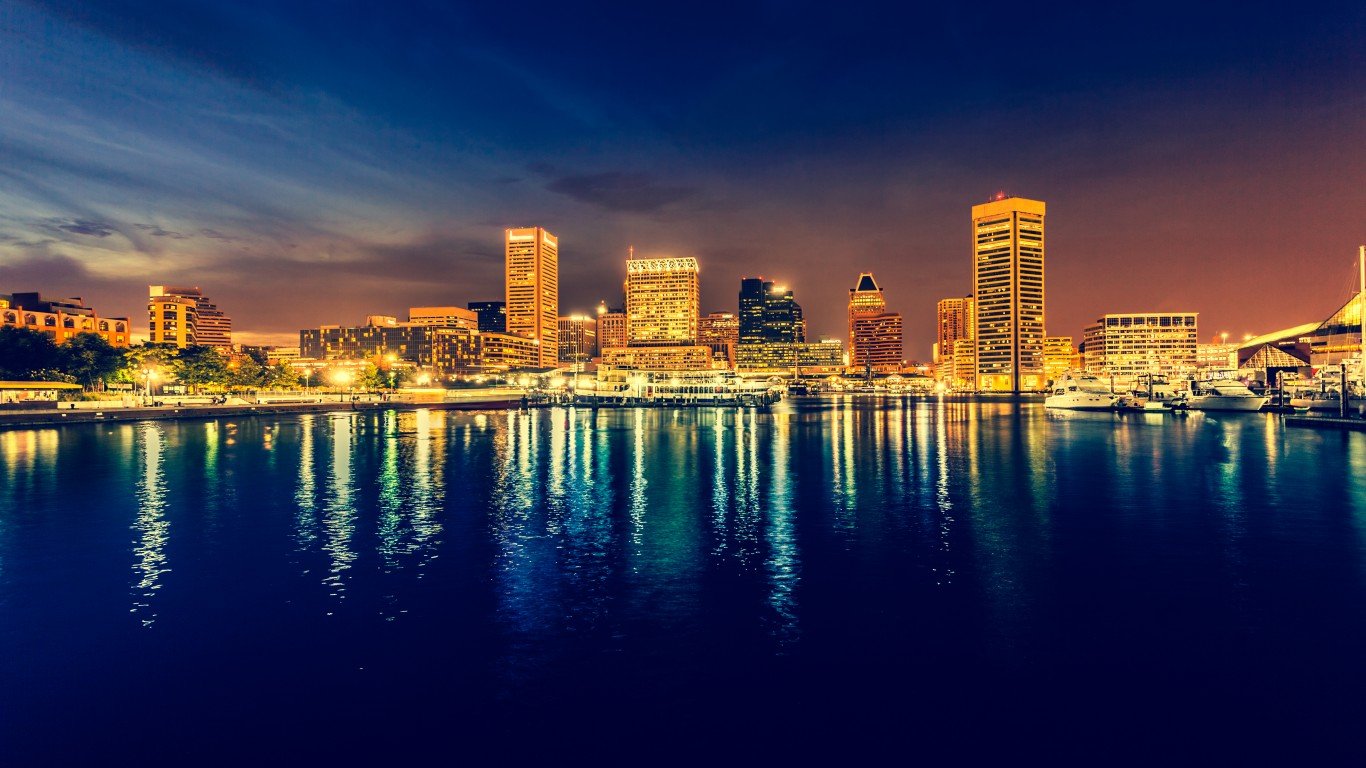
- Personal recreation expenditure, adjusted for population: $2,179 per capita
- Cost of living: +4.0% more than national average
- Total recreation expenditure: $13.5 billion
- Total population: 6.2 million
- Other major spending categories: Clothing and footwear, housing and utilities, recreational goods and vehicles, transportation services, food services and accommodations
19. New York

- Personal recreation expenditure, adjusted for population: $2,179 per capita
- Cost of living: +7.6% more than national average
- Total recreation expenditure: $42.6 billion
- Total population: 19.6 million
- Other major spending categories: Clothing and footwear, health care, financial services and insurance, food services and accommodations, transportation services, housing and utilities
18. Arizona
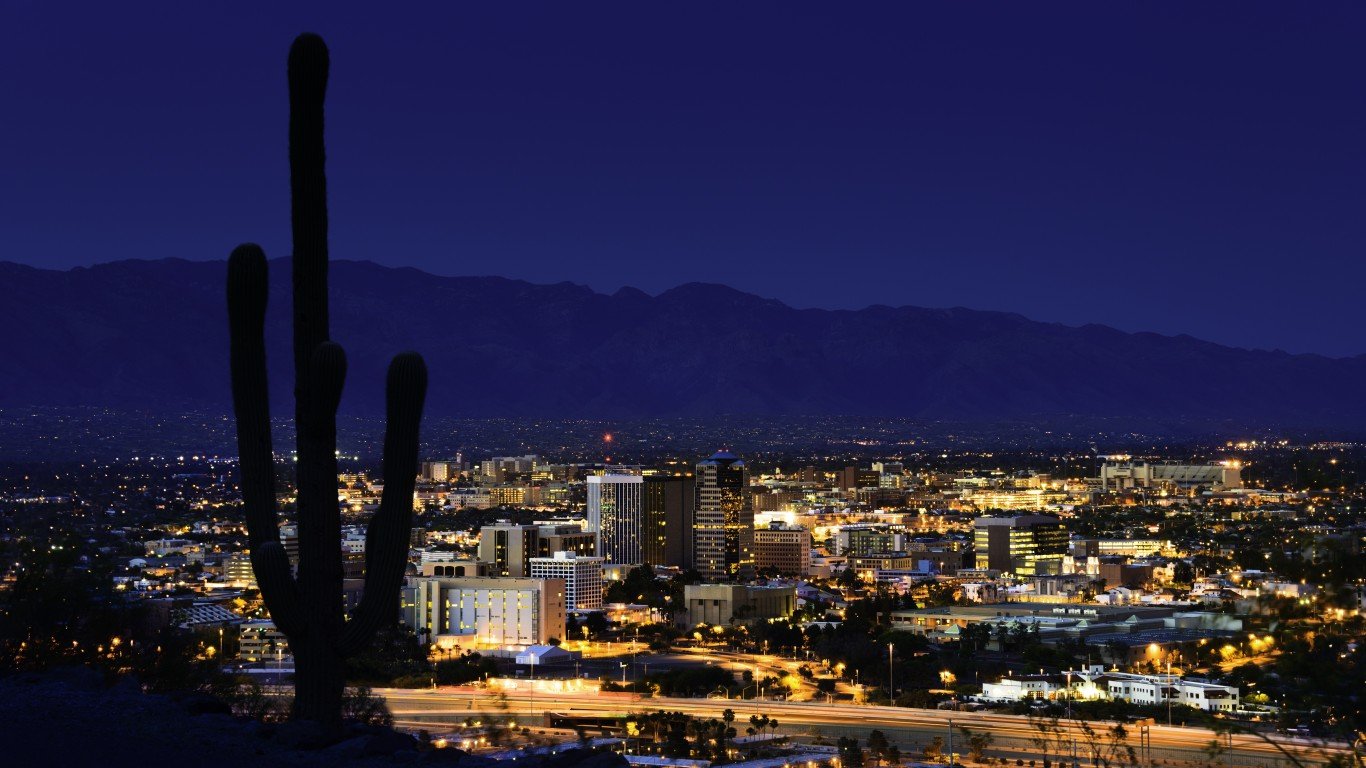
- Personal recreation expenditure, adjusted for population: $2,183 per capita
- Cost of living: +1.1% more than national average
- Total recreation expenditure: $16.2 billion
- Total population: 7.4 million
- Other major spending categories: Housing and utilities, transportation services, food services and accommodations, furnishings and durable household equipment, motor vehicles and parts
17. Texas
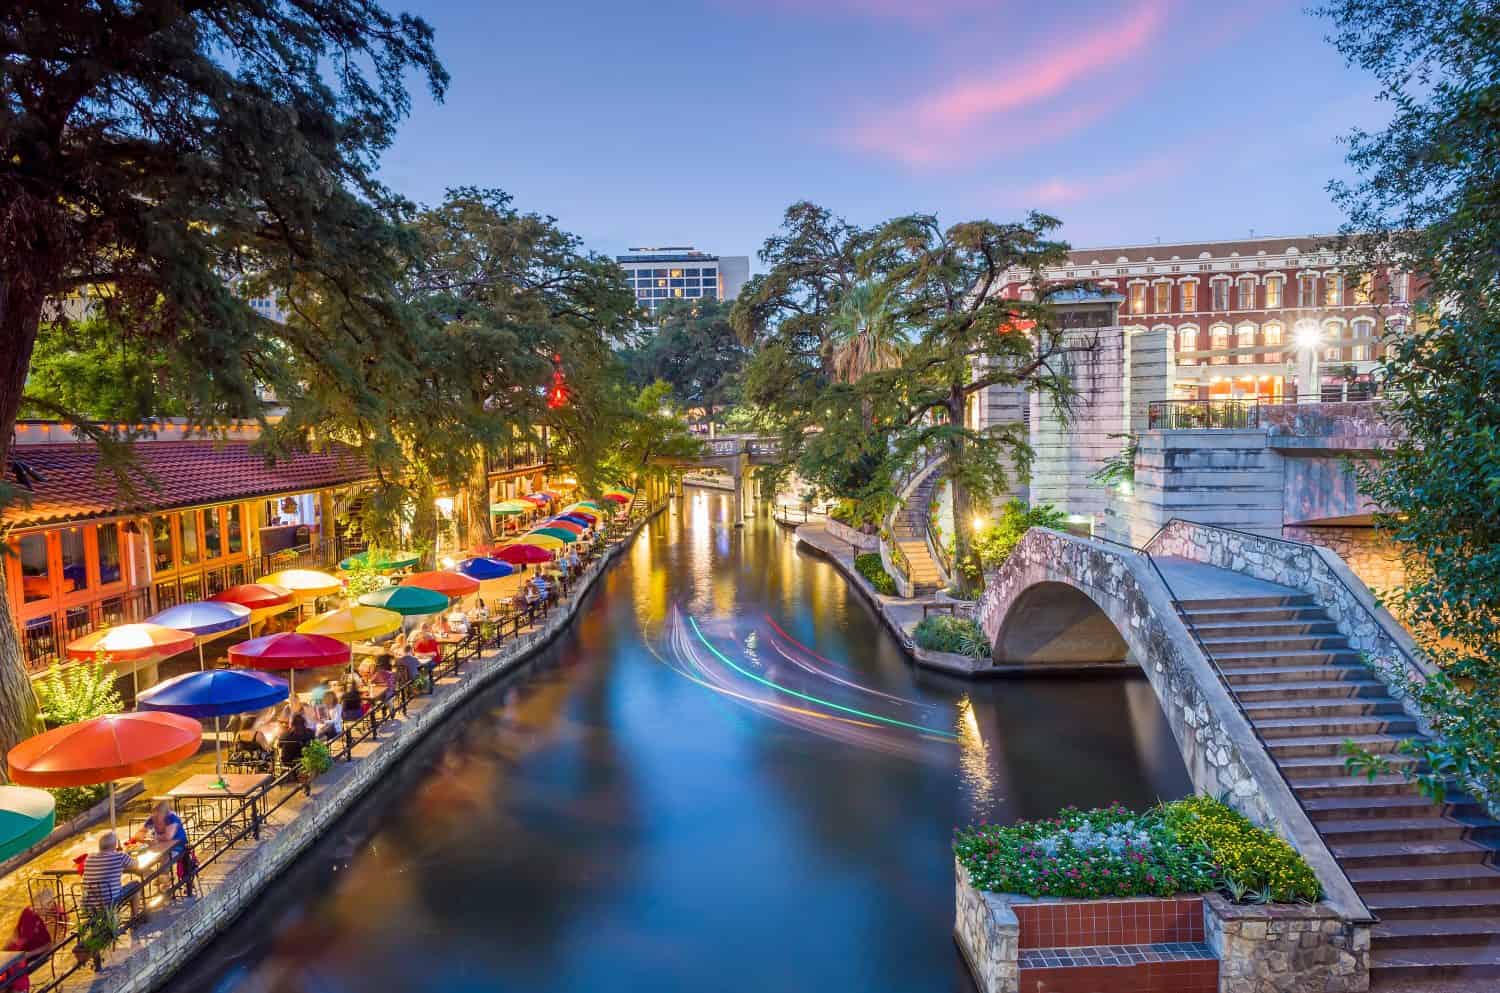
- Personal recreation expenditure, adjusted for population: $2,196 per capita
- Cost of living: -2.8% less than national average
- Total recreation expenditure: $67.0 billion
- Total population: 30.5 million
- Other major spending categories: Motor vehicles and parts, clothing and footwear, financial services and insurance, food services and accommodations, recreational goods and vehicles
16. Rhode Island
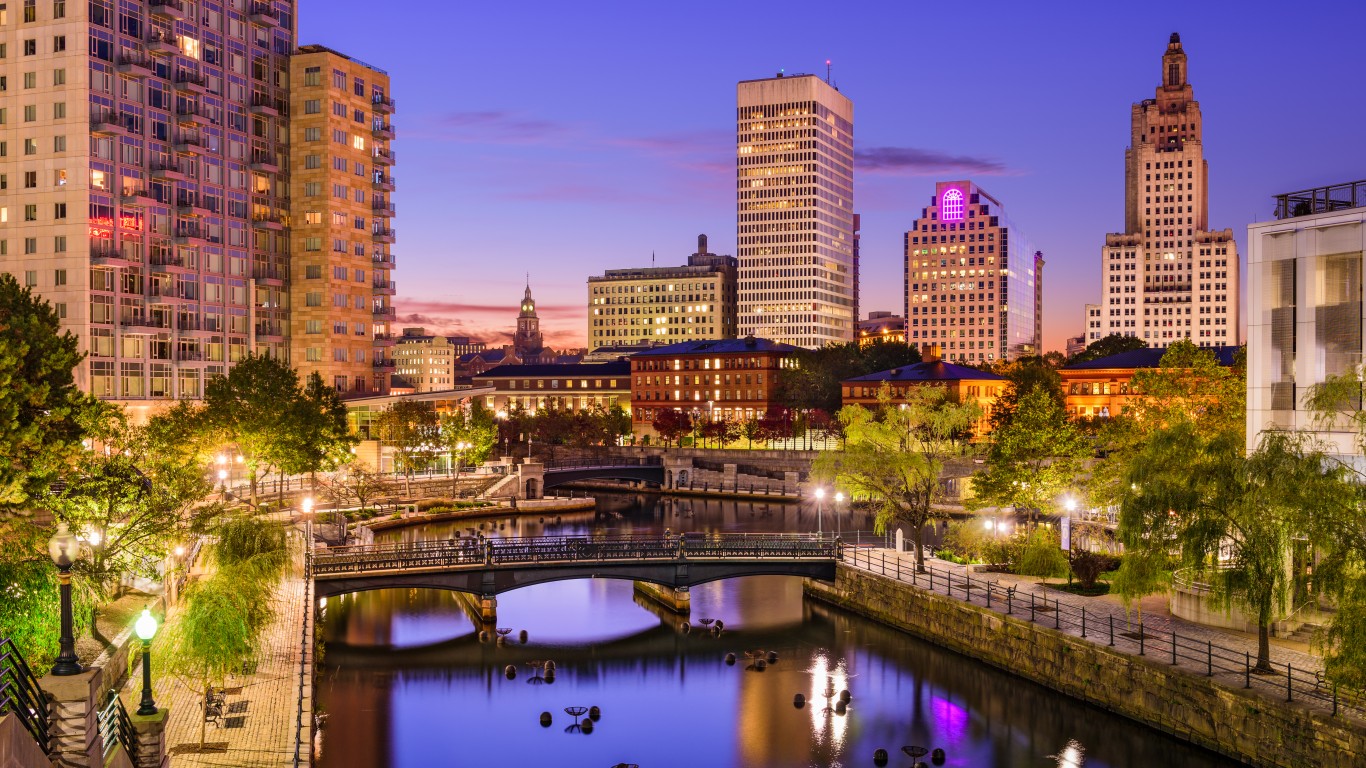
- Personal recreation expenditure, adjusted for population: $2,214 per capita
- Cost of living: +1.4% more than national average
- Total recreation expenditure: $2.4 billion
- Total population: 1.1 million
- Other major spending categories: Transportation services, food services and accommodations, groceries, housing and utilities, health care
15. Florida
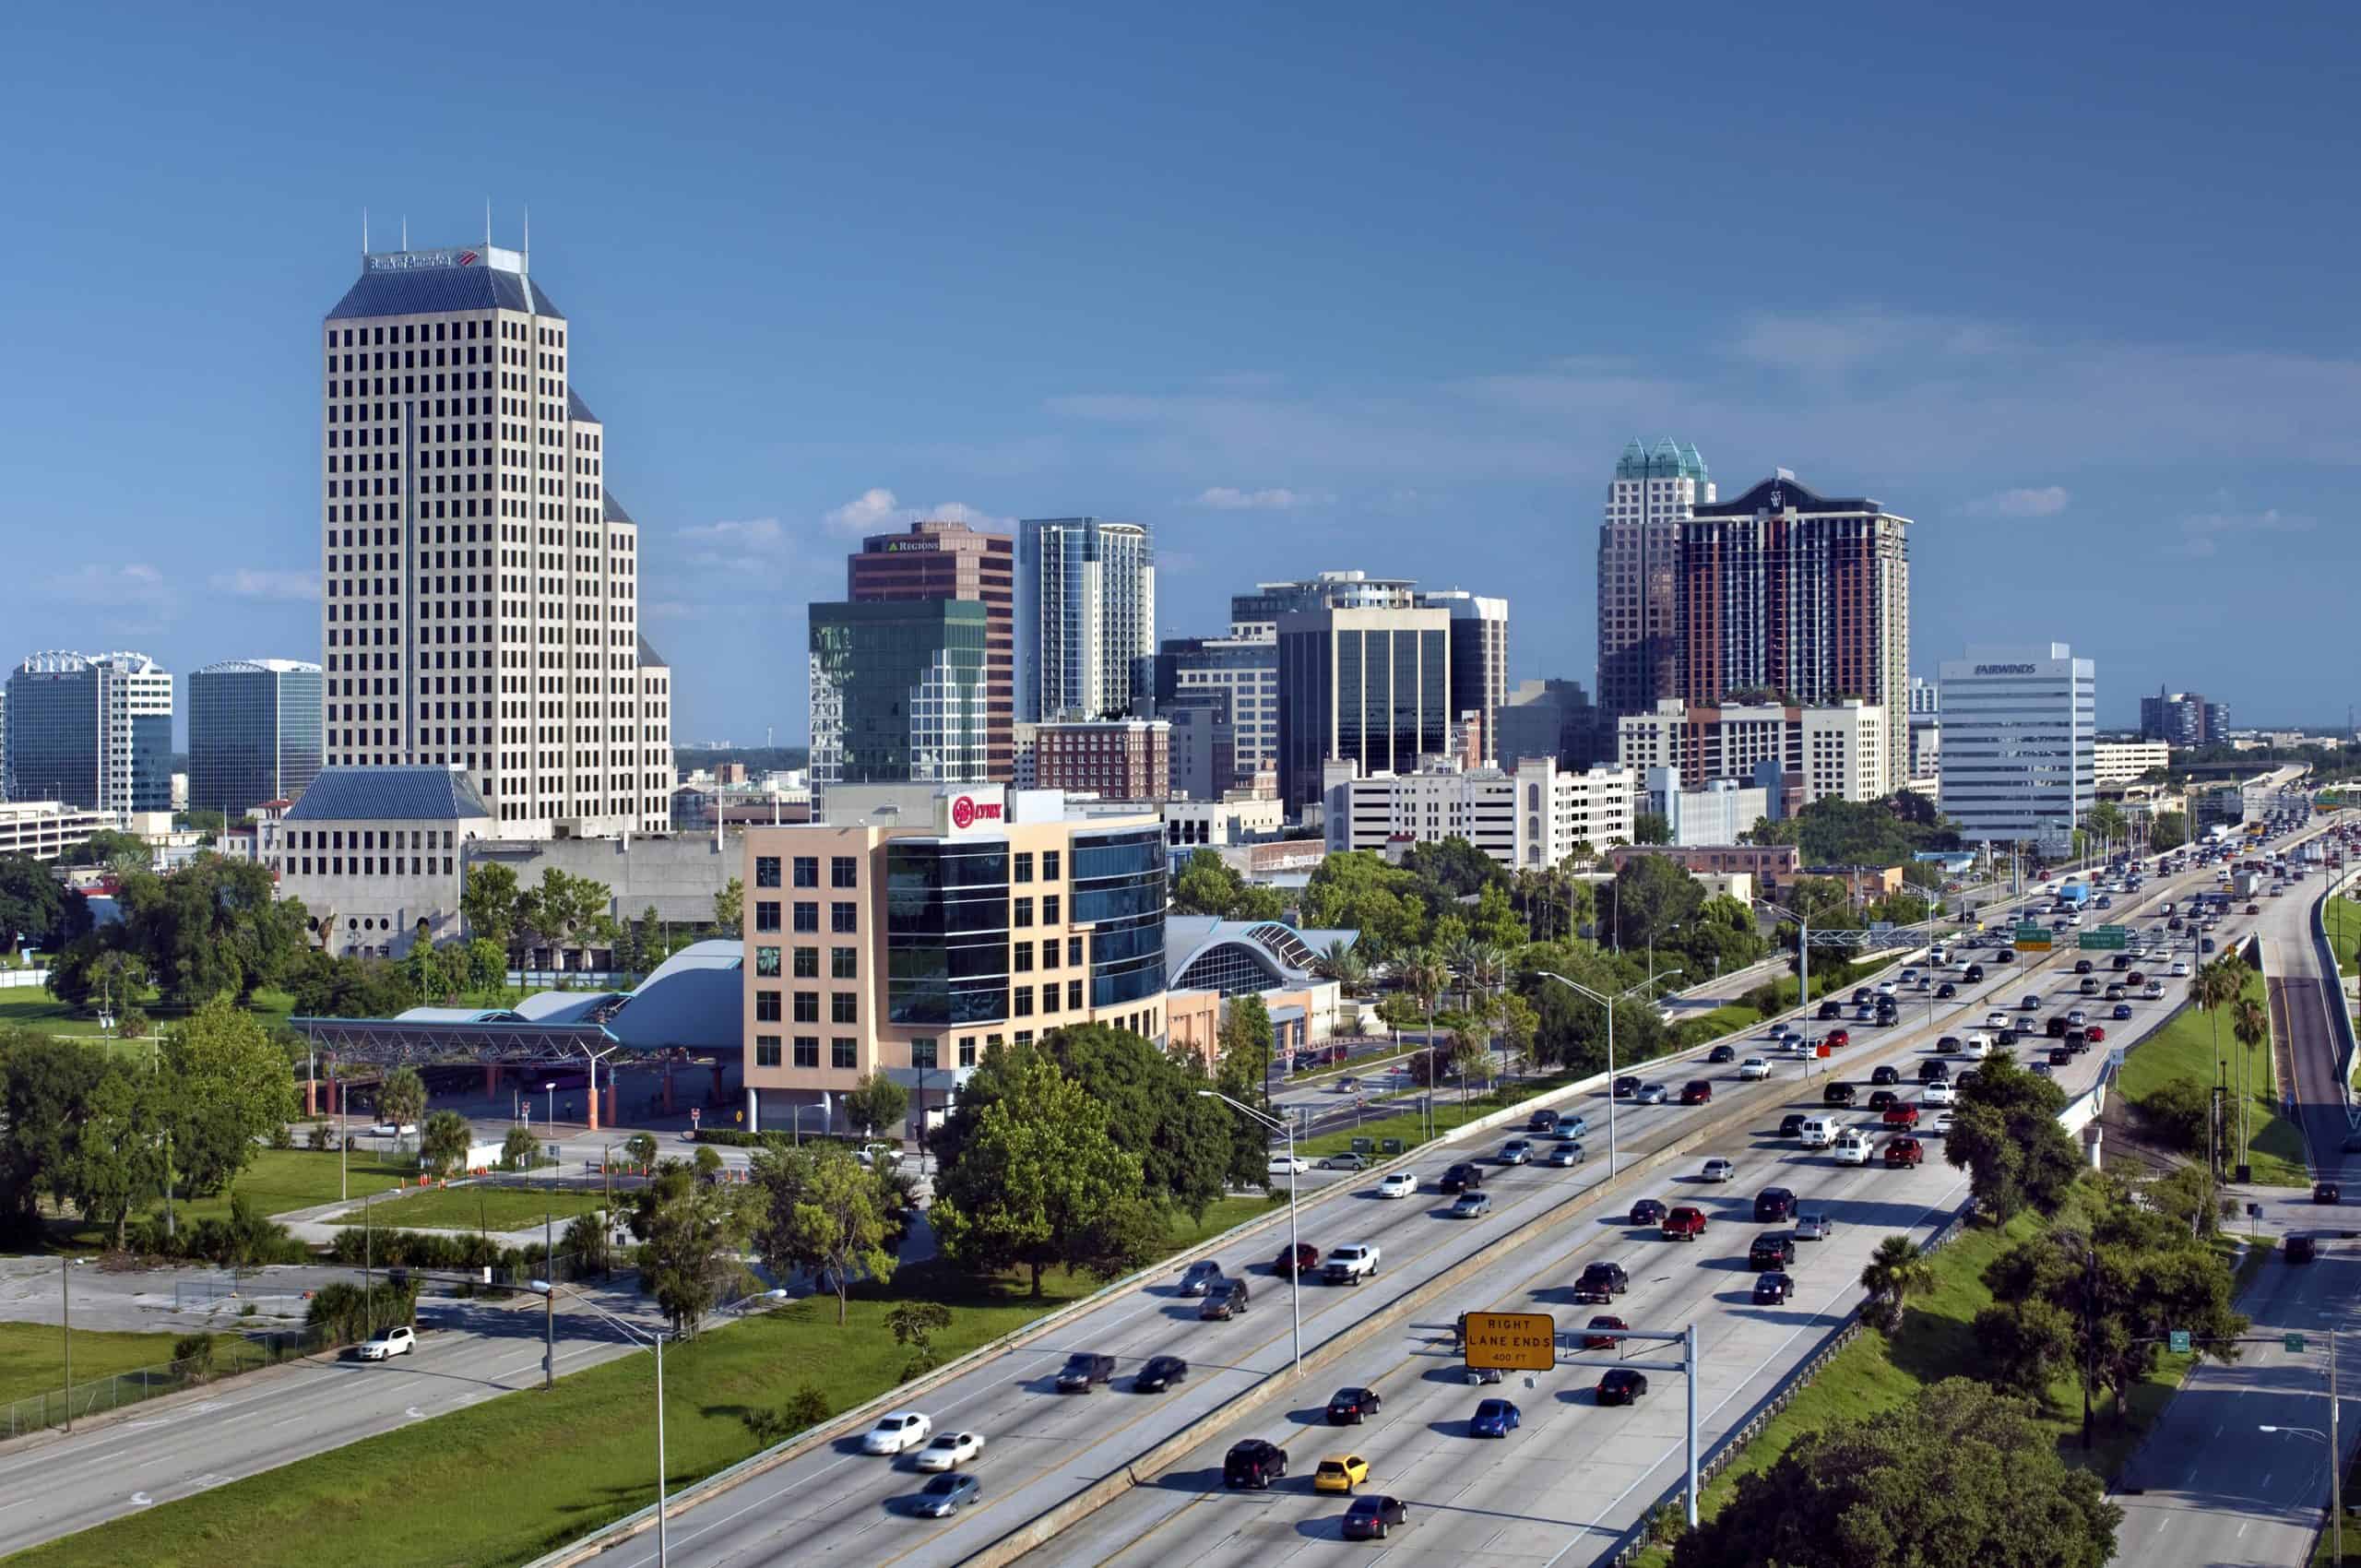
- Personal recreation expenditure, adjusted for population: $2,264 per capita
- Cost of living: +3.5% more than national average
- Total recreation expenditure: $51.2 billion
- Total population: 22.6 million
- Other major spending categories: Furnishings and durable household equipment, housing and utilities, financial services and insurance, food services and accommodations, recreational goods and vehicles, groceries
14. Nevada
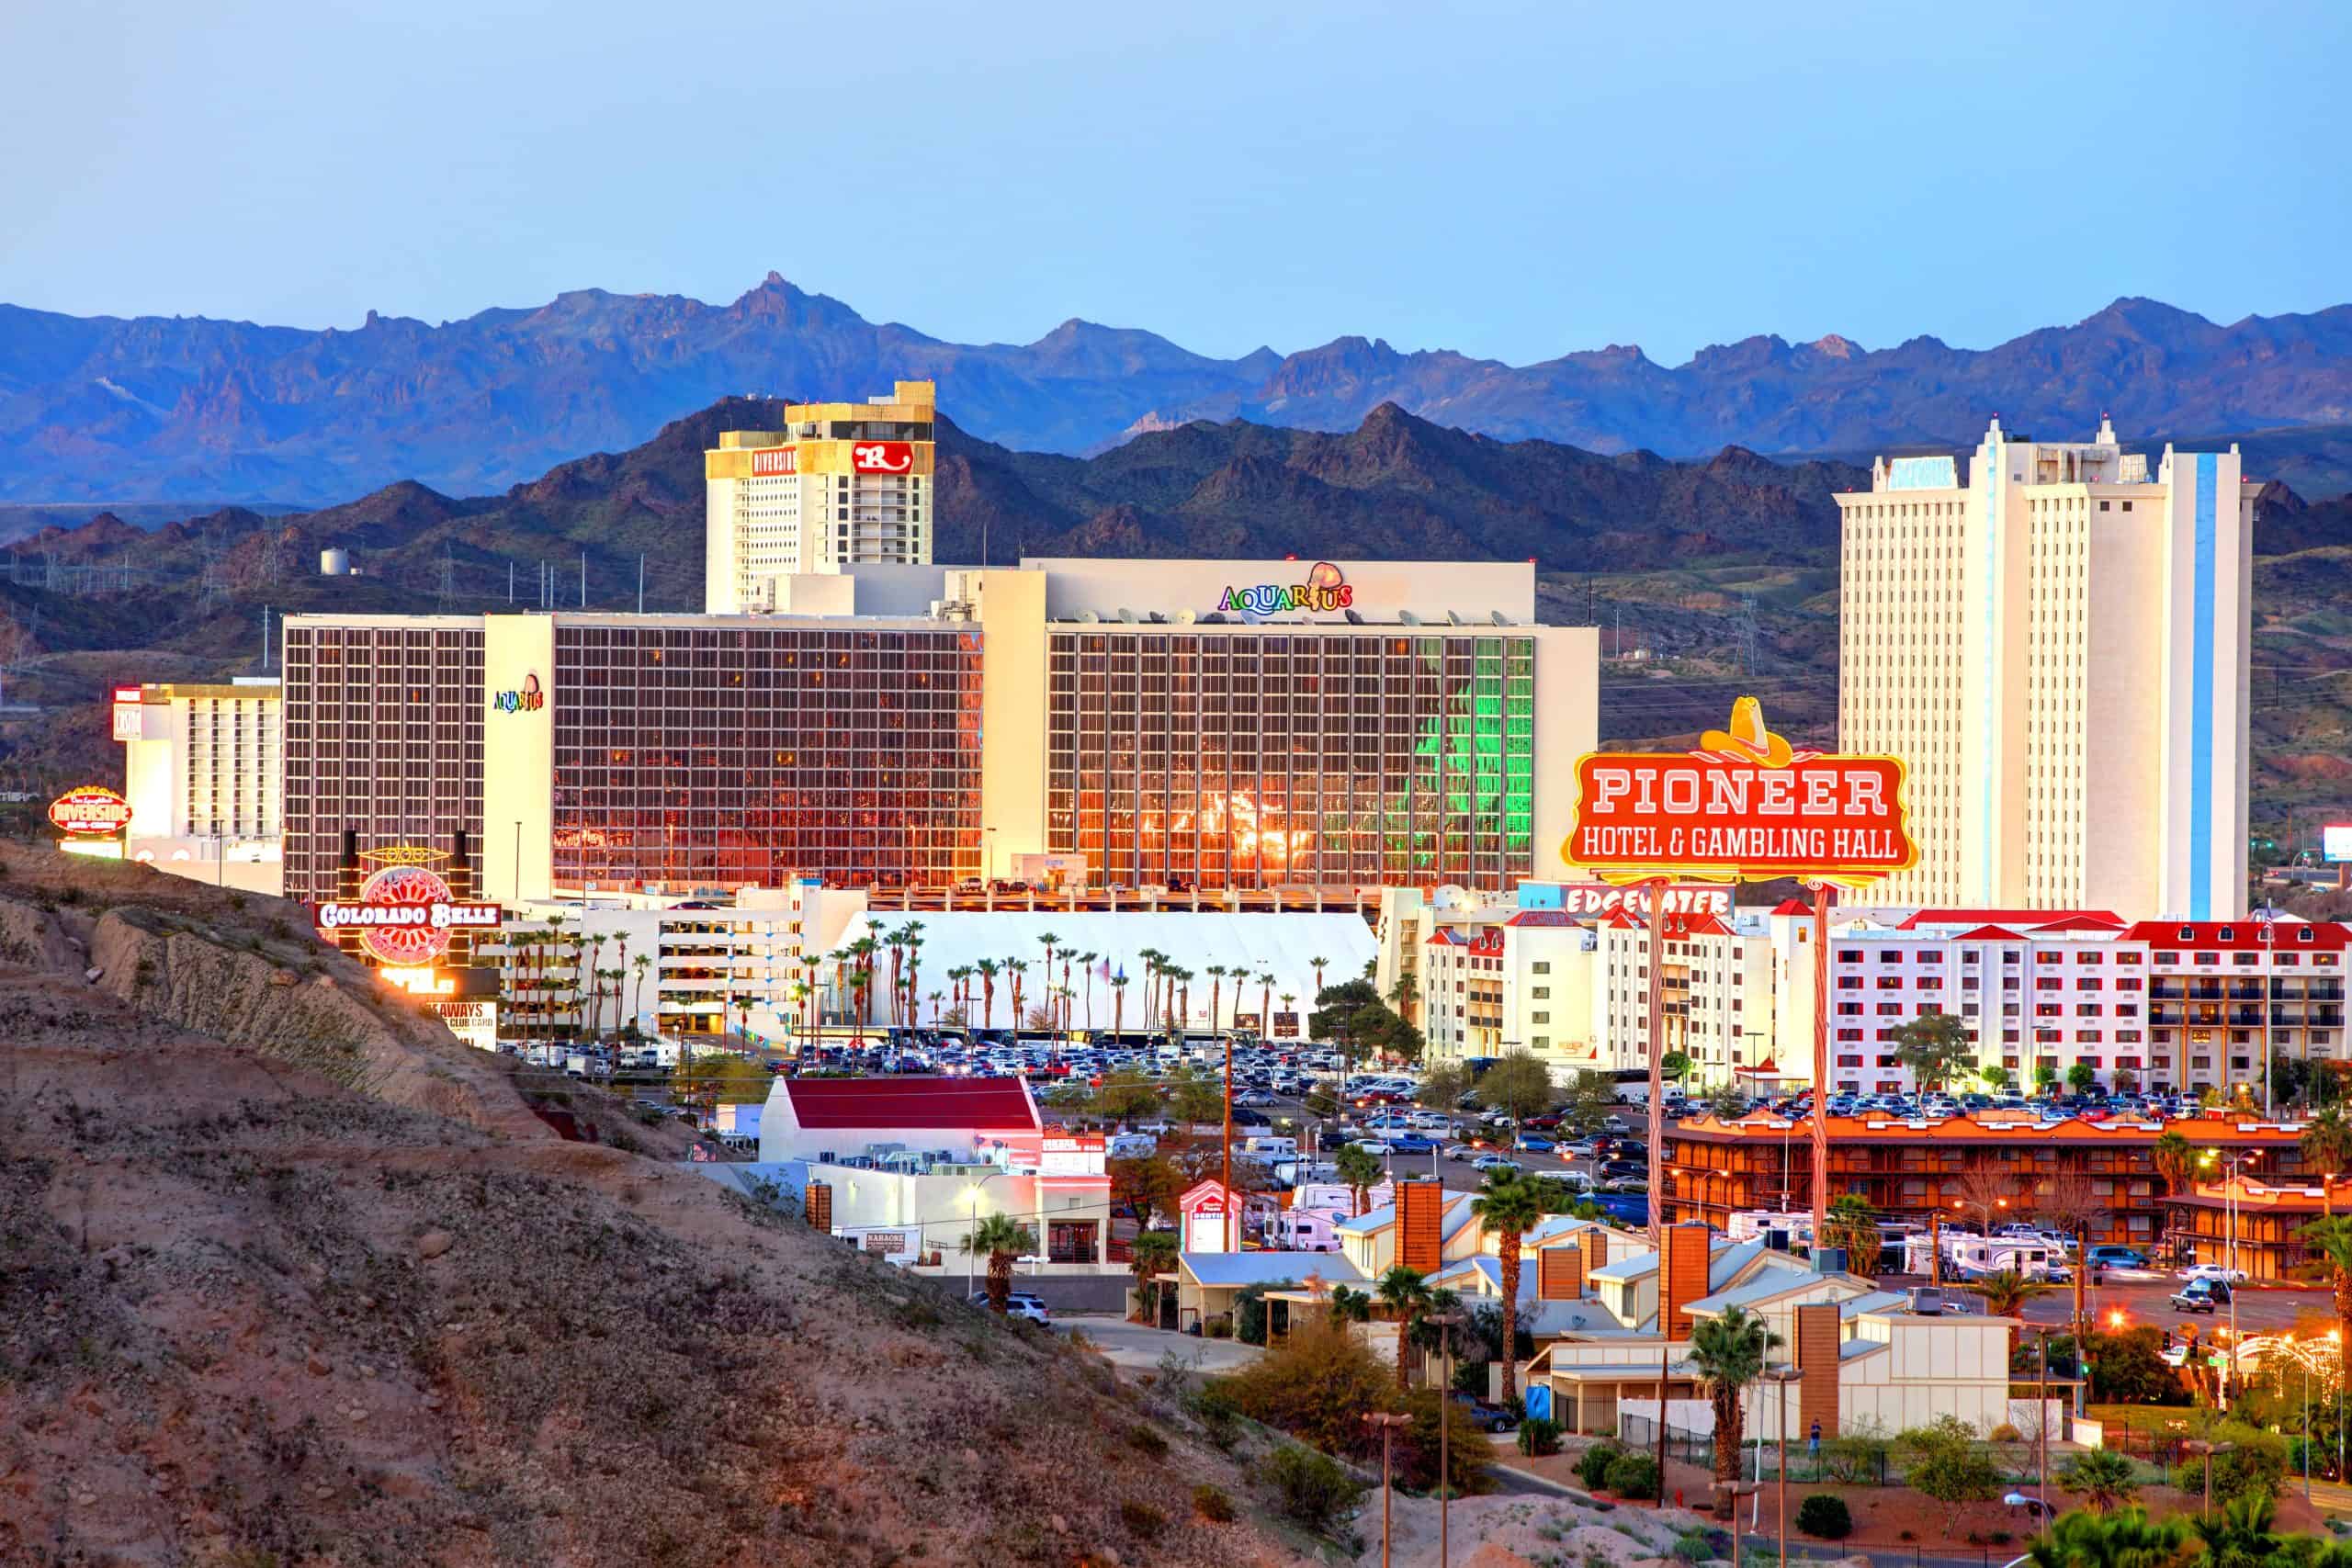
- Personal recreation expenditure, adjusted for population: $2,337 per capita
- Cost of living: -3.0% less than national average
- Total recreation expenditure: $7.5 billion
- Total population: 3.2 million
- Other major spending categories: Furnishings and durable household equipment, groceries, housing and utilities, food services and accommodations, financial services and insurance
13. Vermont
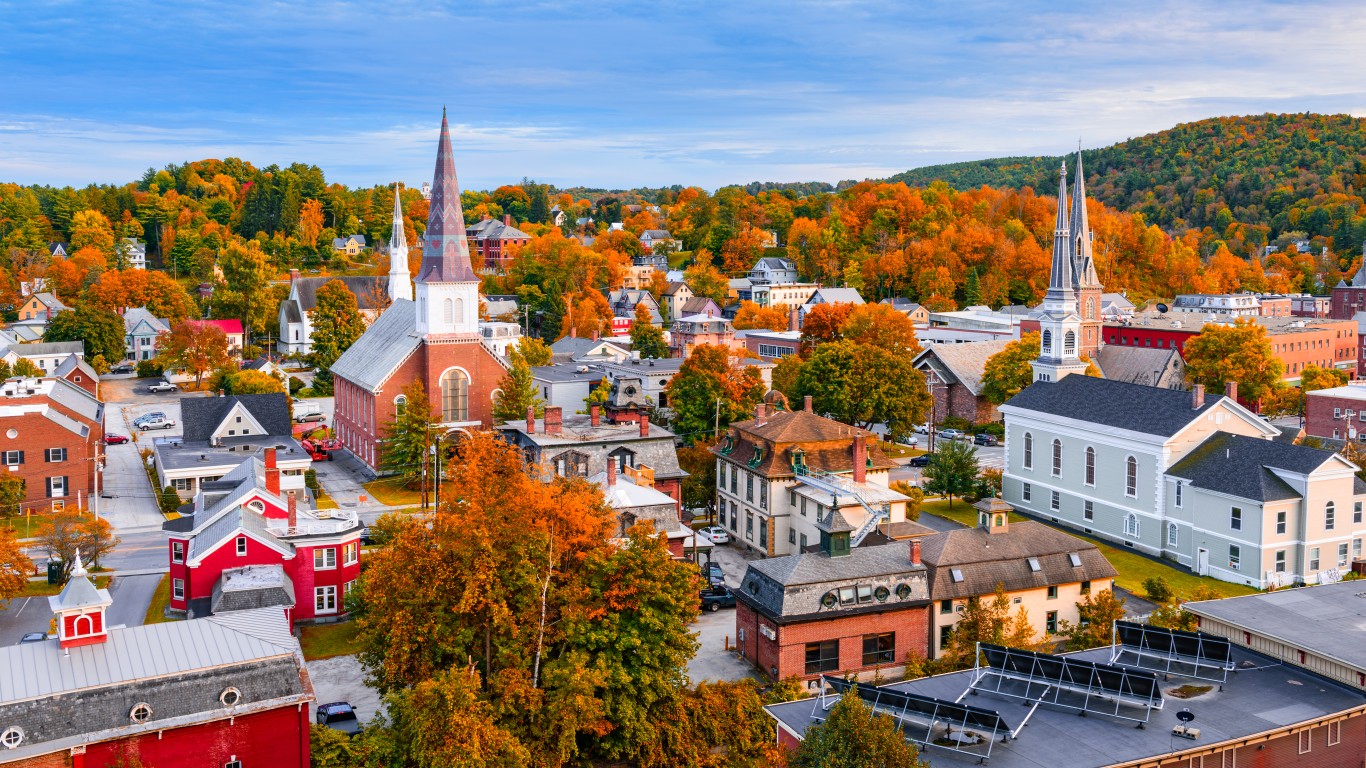
- Personal recreation expenditure, adjusted for population: $2,343 per capita
- Cost of living: -3.4% less than national average
- Total recreation expenditure: $1.5 billion
- Total population: 647,464
- Other major spending categories: Groceries, motor vehicles and parts, health care, food services and accommodations, gasoline and other energy goods
12. Hawaii
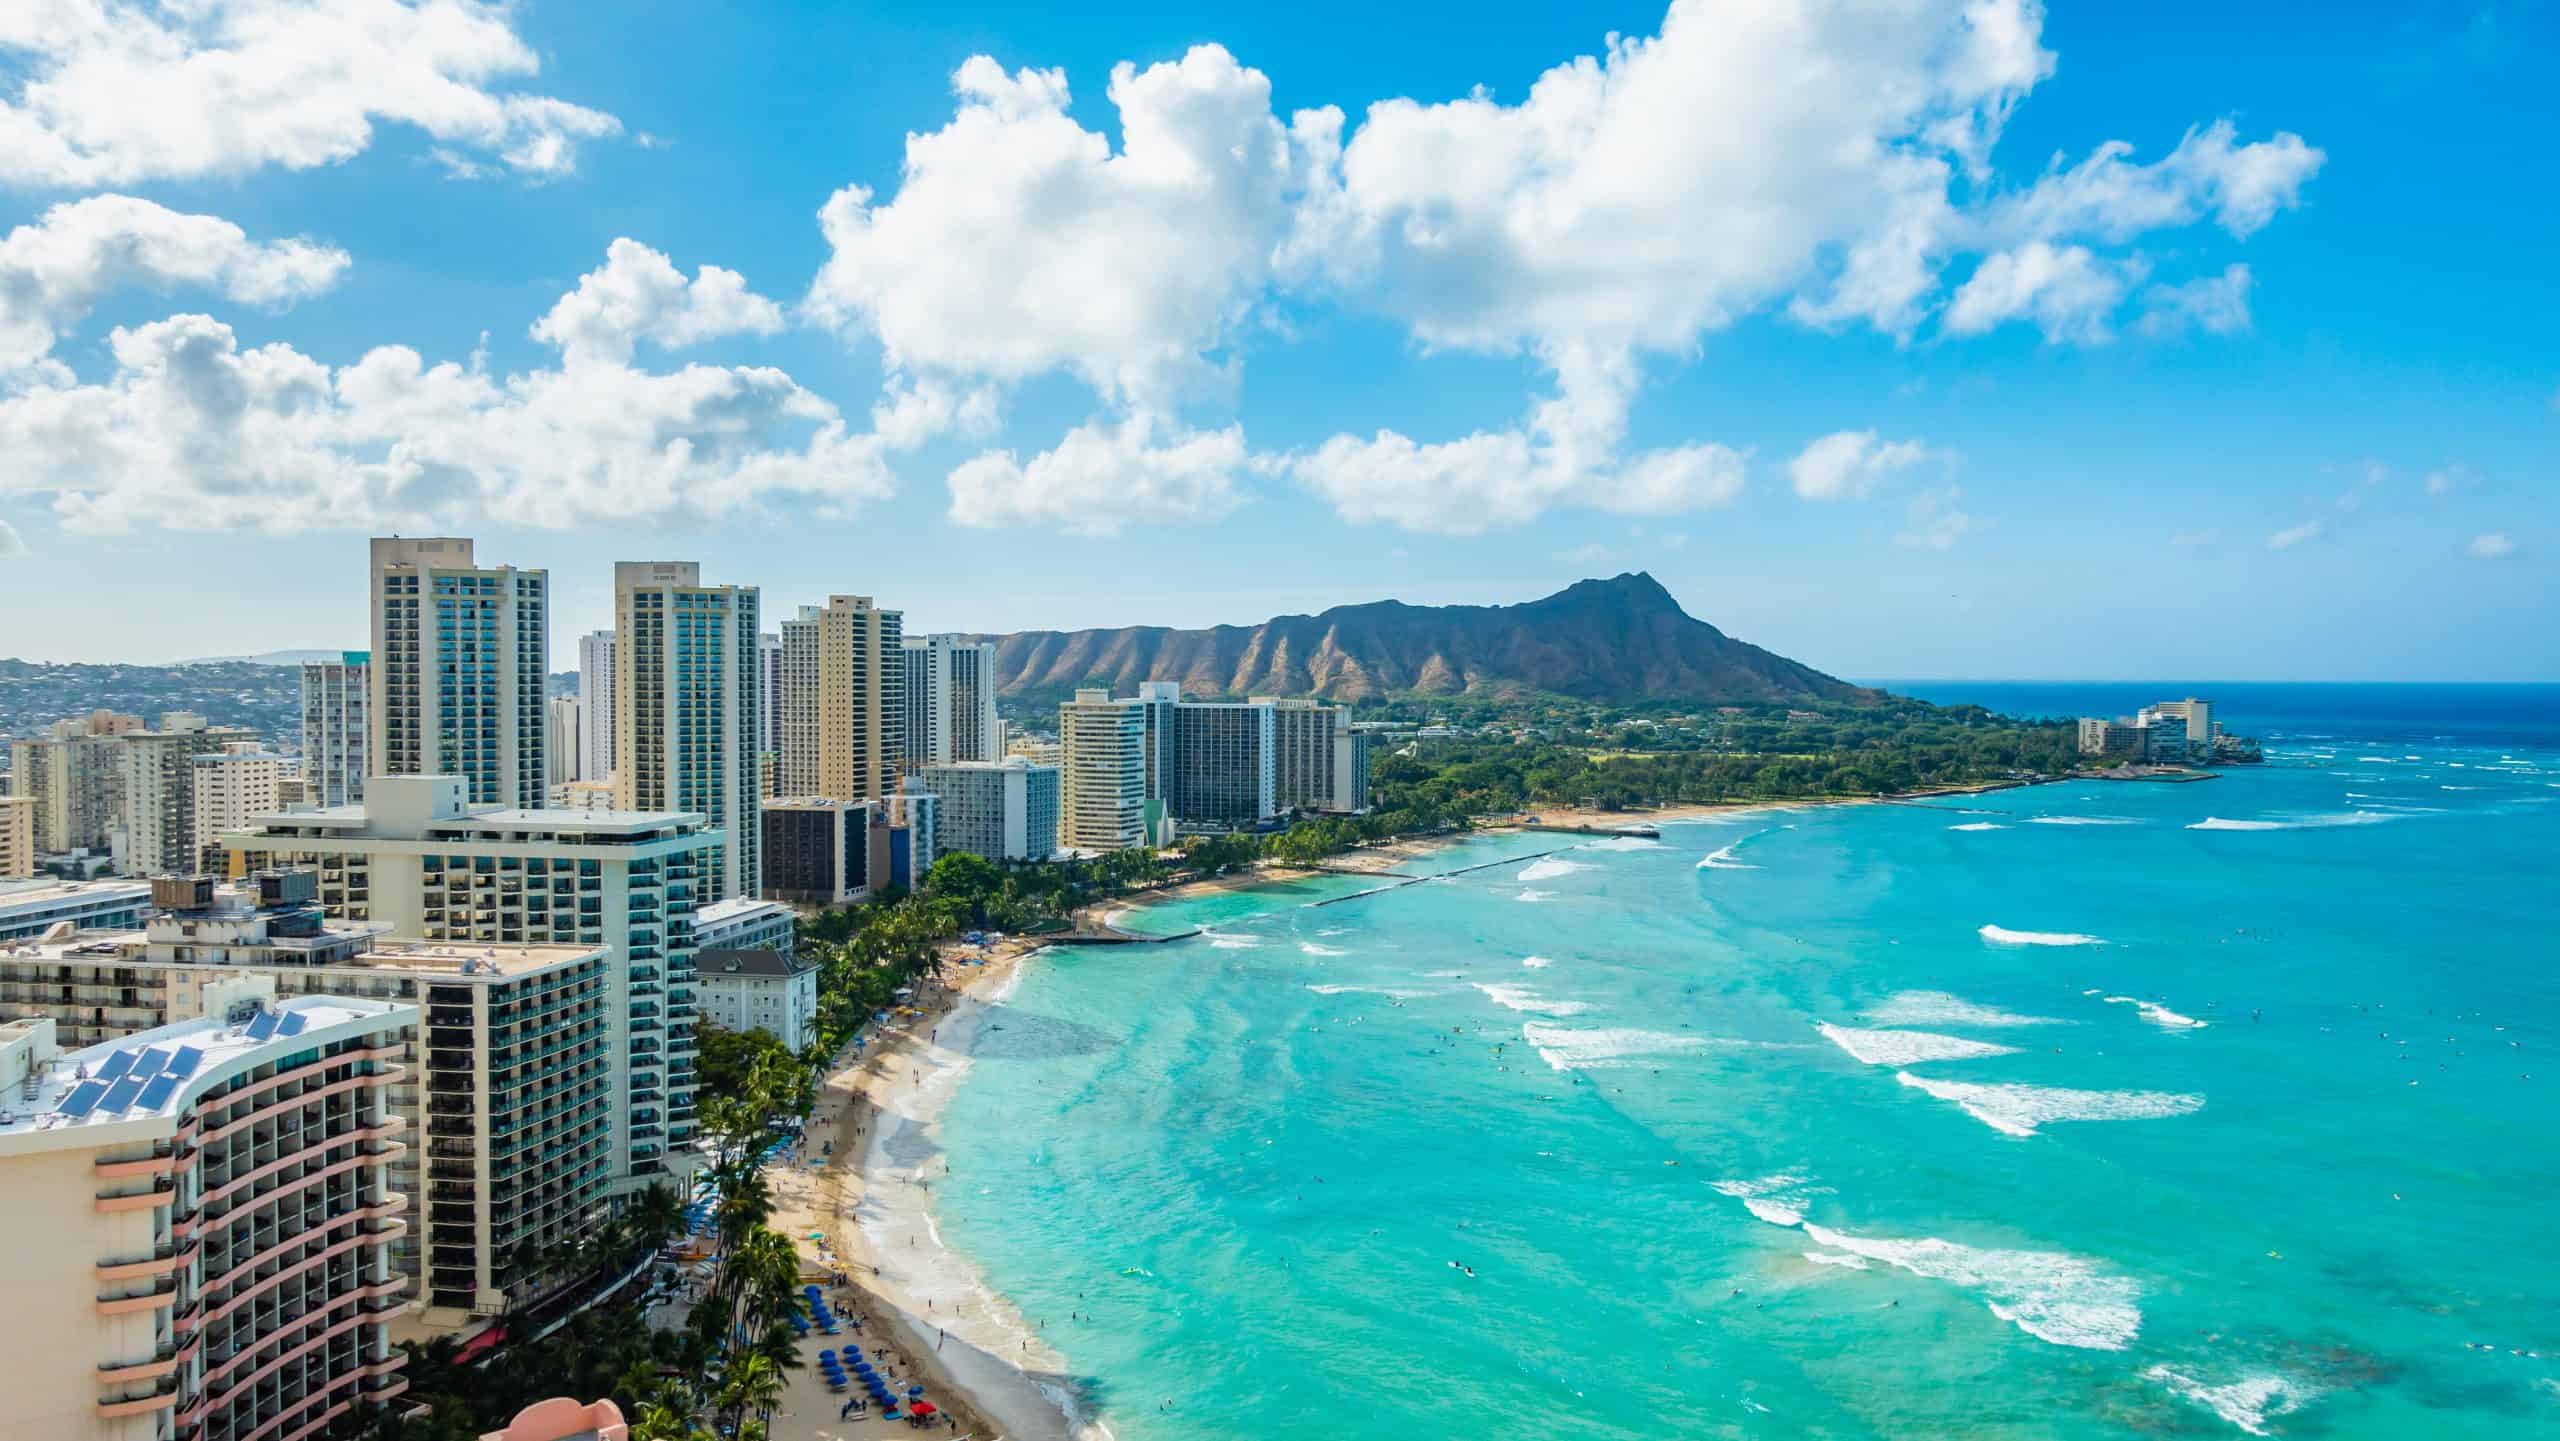
- Personal recreation expenditure, adjusted for population: $2,405 per capita
- Cost of living: +8.6% more than national average
- Total recreation expenditure: $3.5 billion
- Total population: 1.4 million
- Other major spending categories: Groceries, food services and accommodations, housing and utilities, transportation services, clothing and footwear
11. New Jersey
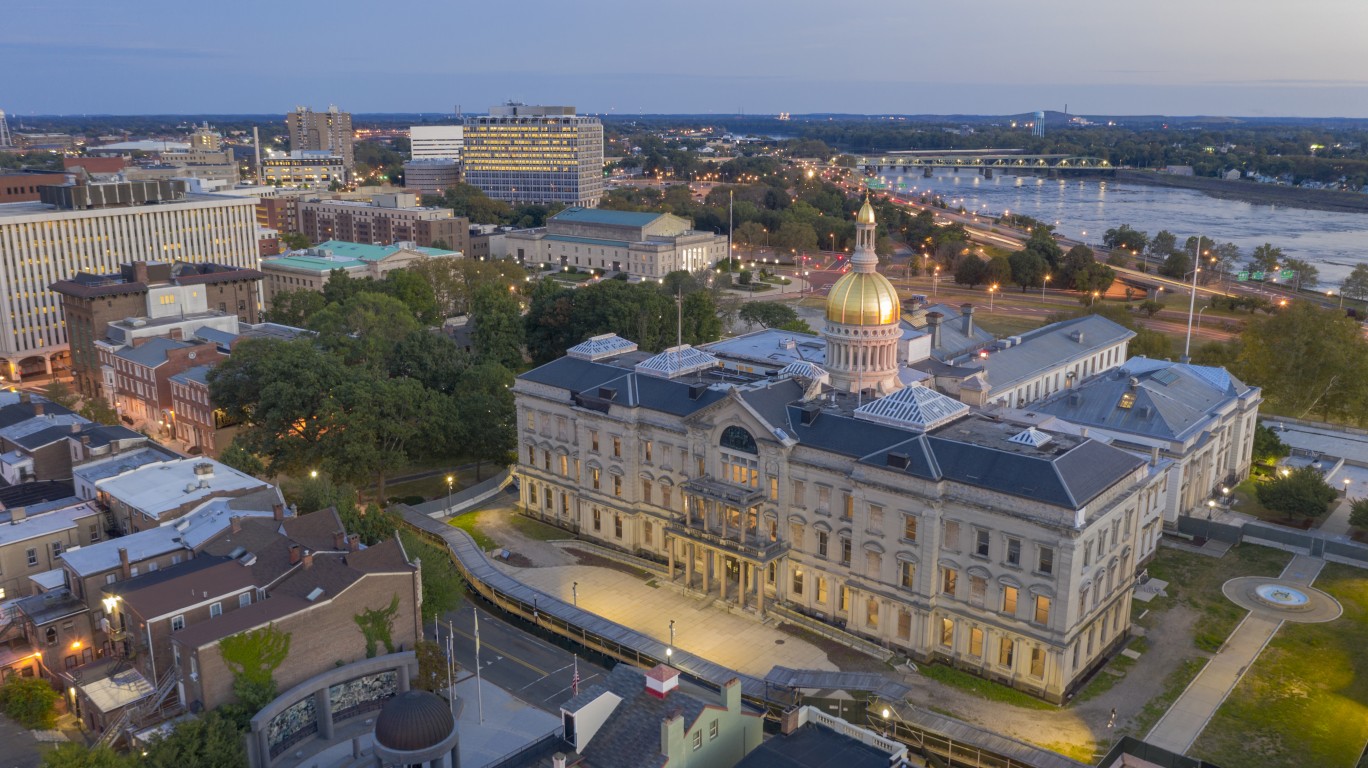
- Personal recreation expenditure, adjusted for population: $2,411 per capita
- Cost of living: +8.9% more than national average
- Total recreation expenditure: $22.4 billion
- Total population: 9.3 million
- Other major spending categories: Clothing and footwear, furnishings and durable household equipment, housing and utilities, financial services and insurance, health care
10. Montana
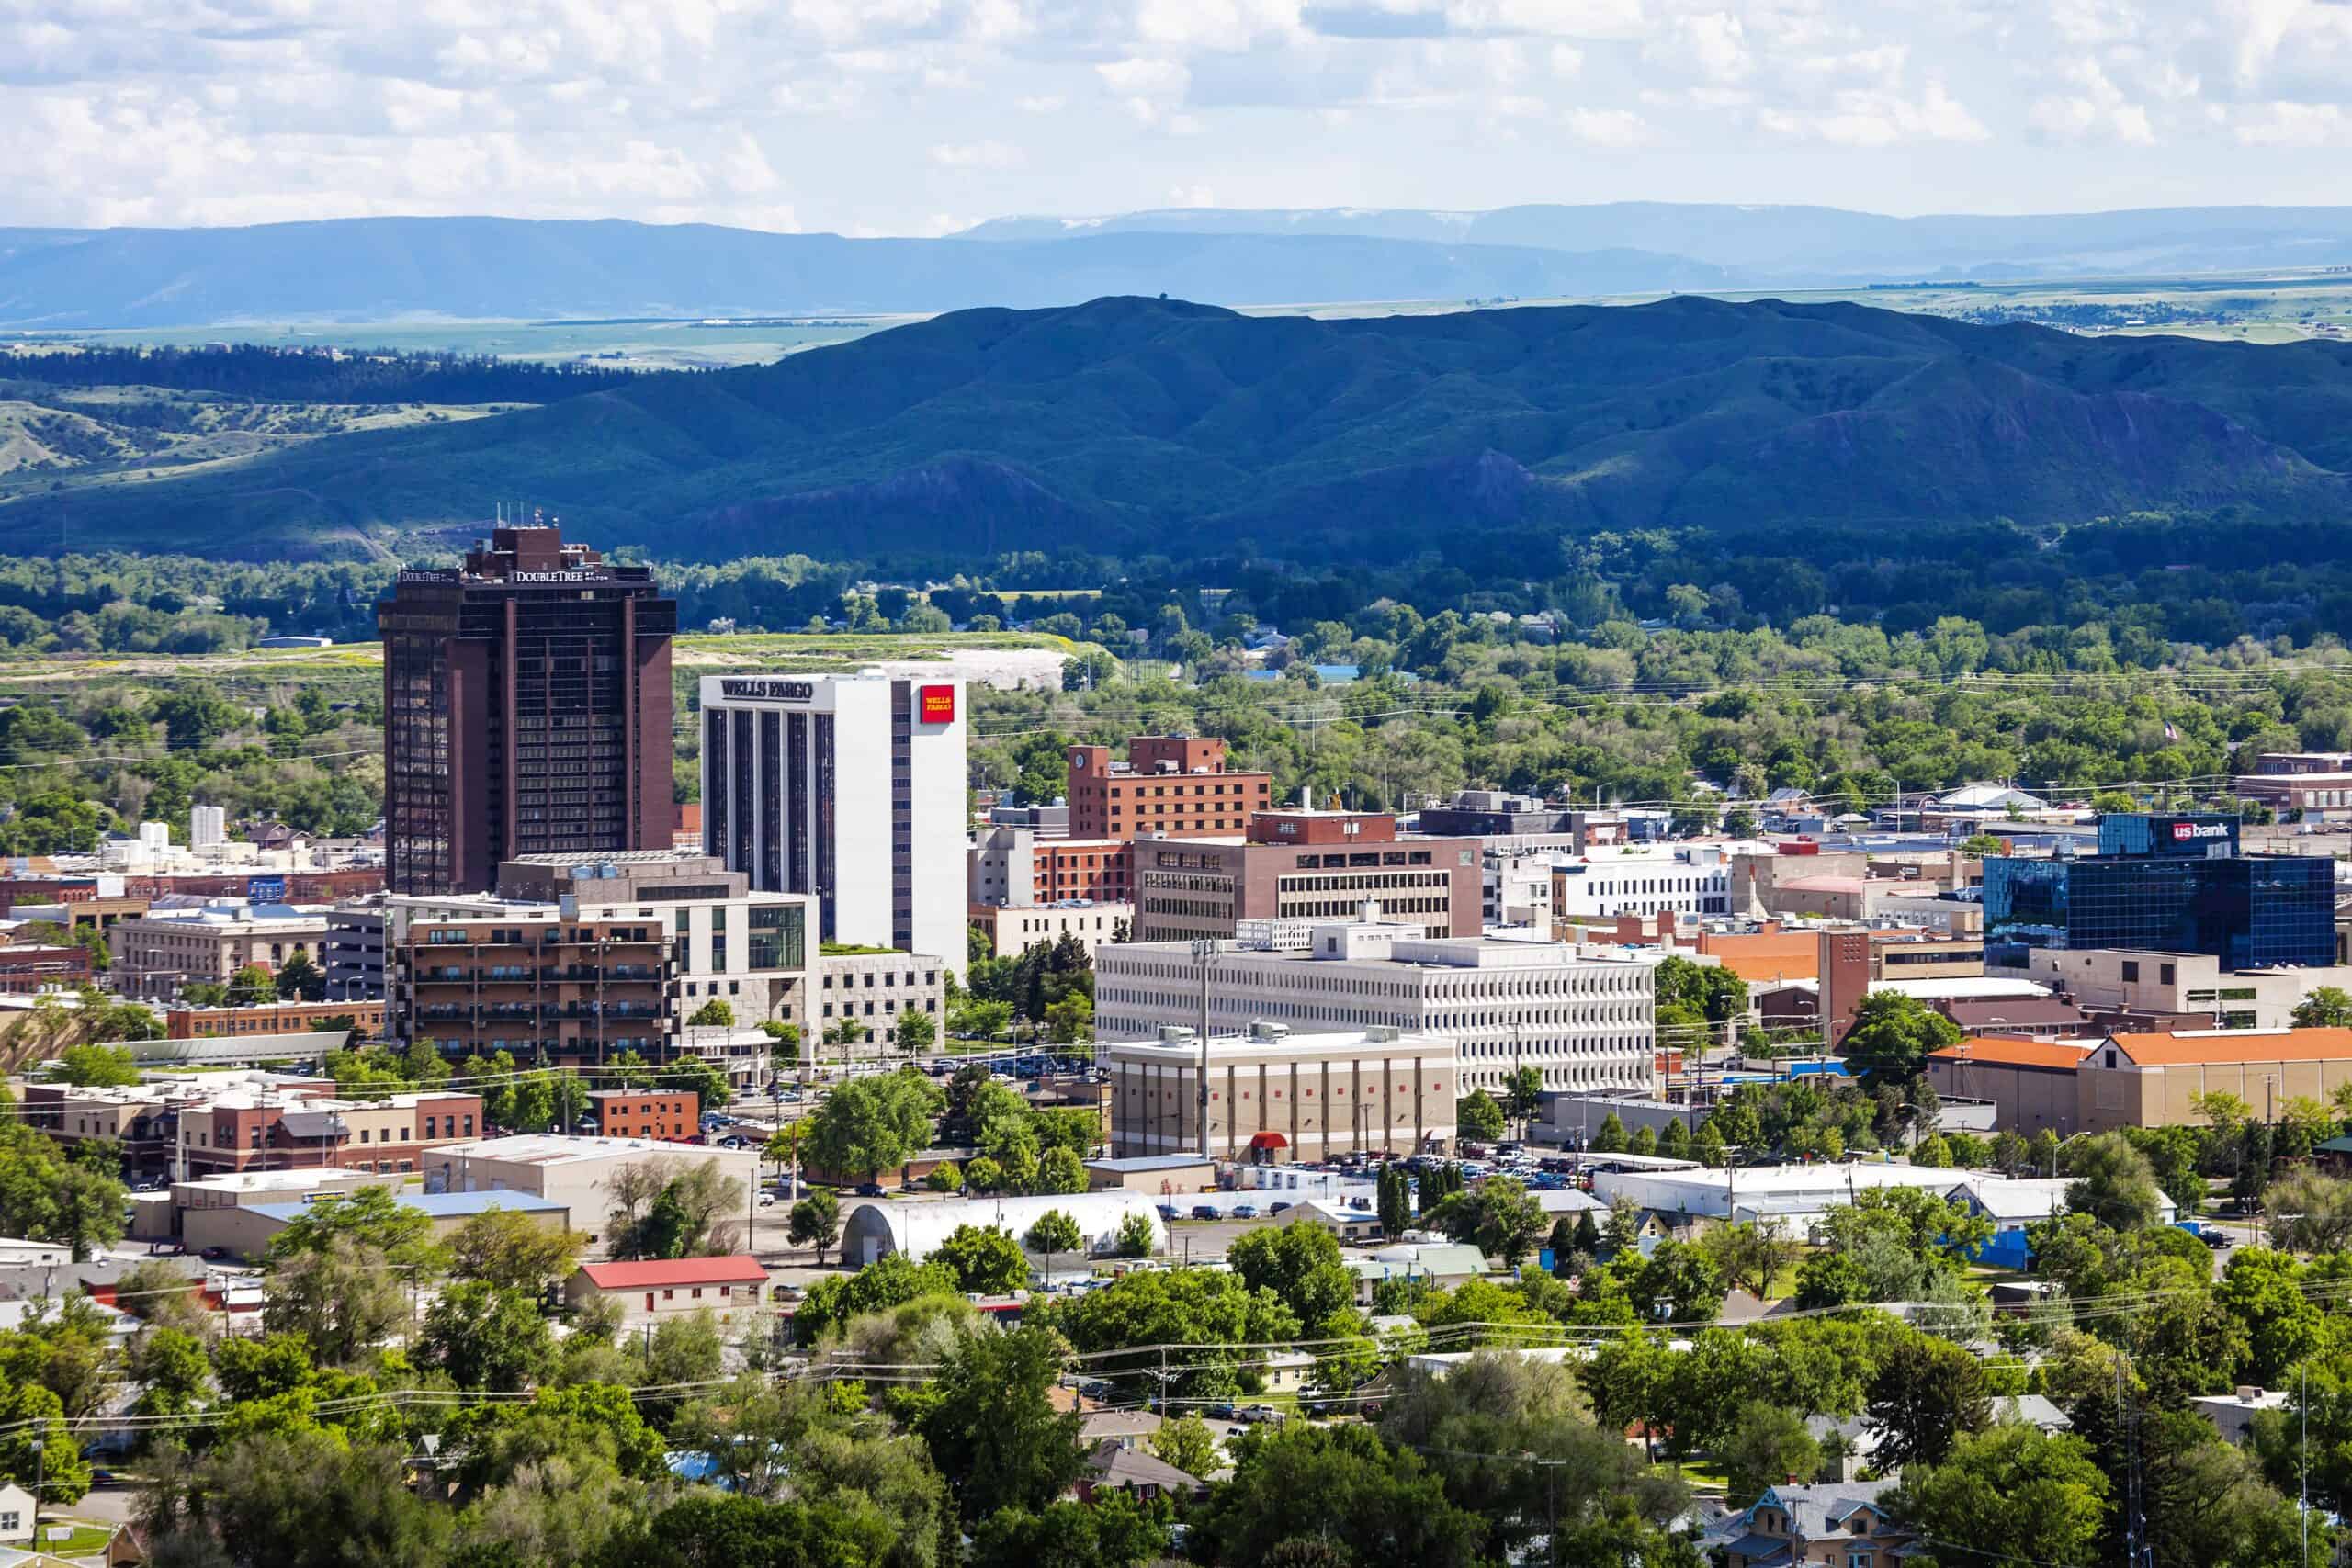
- Personal recreation expenditure, adjusted for population: $2,507 per capita
- Cost of living: -9.8% less than national average
- Total recreation expenditure: $2.8 billion
- Total population: 1.1 million
- Other major spending categories: Motor vehicles and parts, groceries, gasoline and other energy goods, transportation services, recreational goods and vehicles
9. Maine
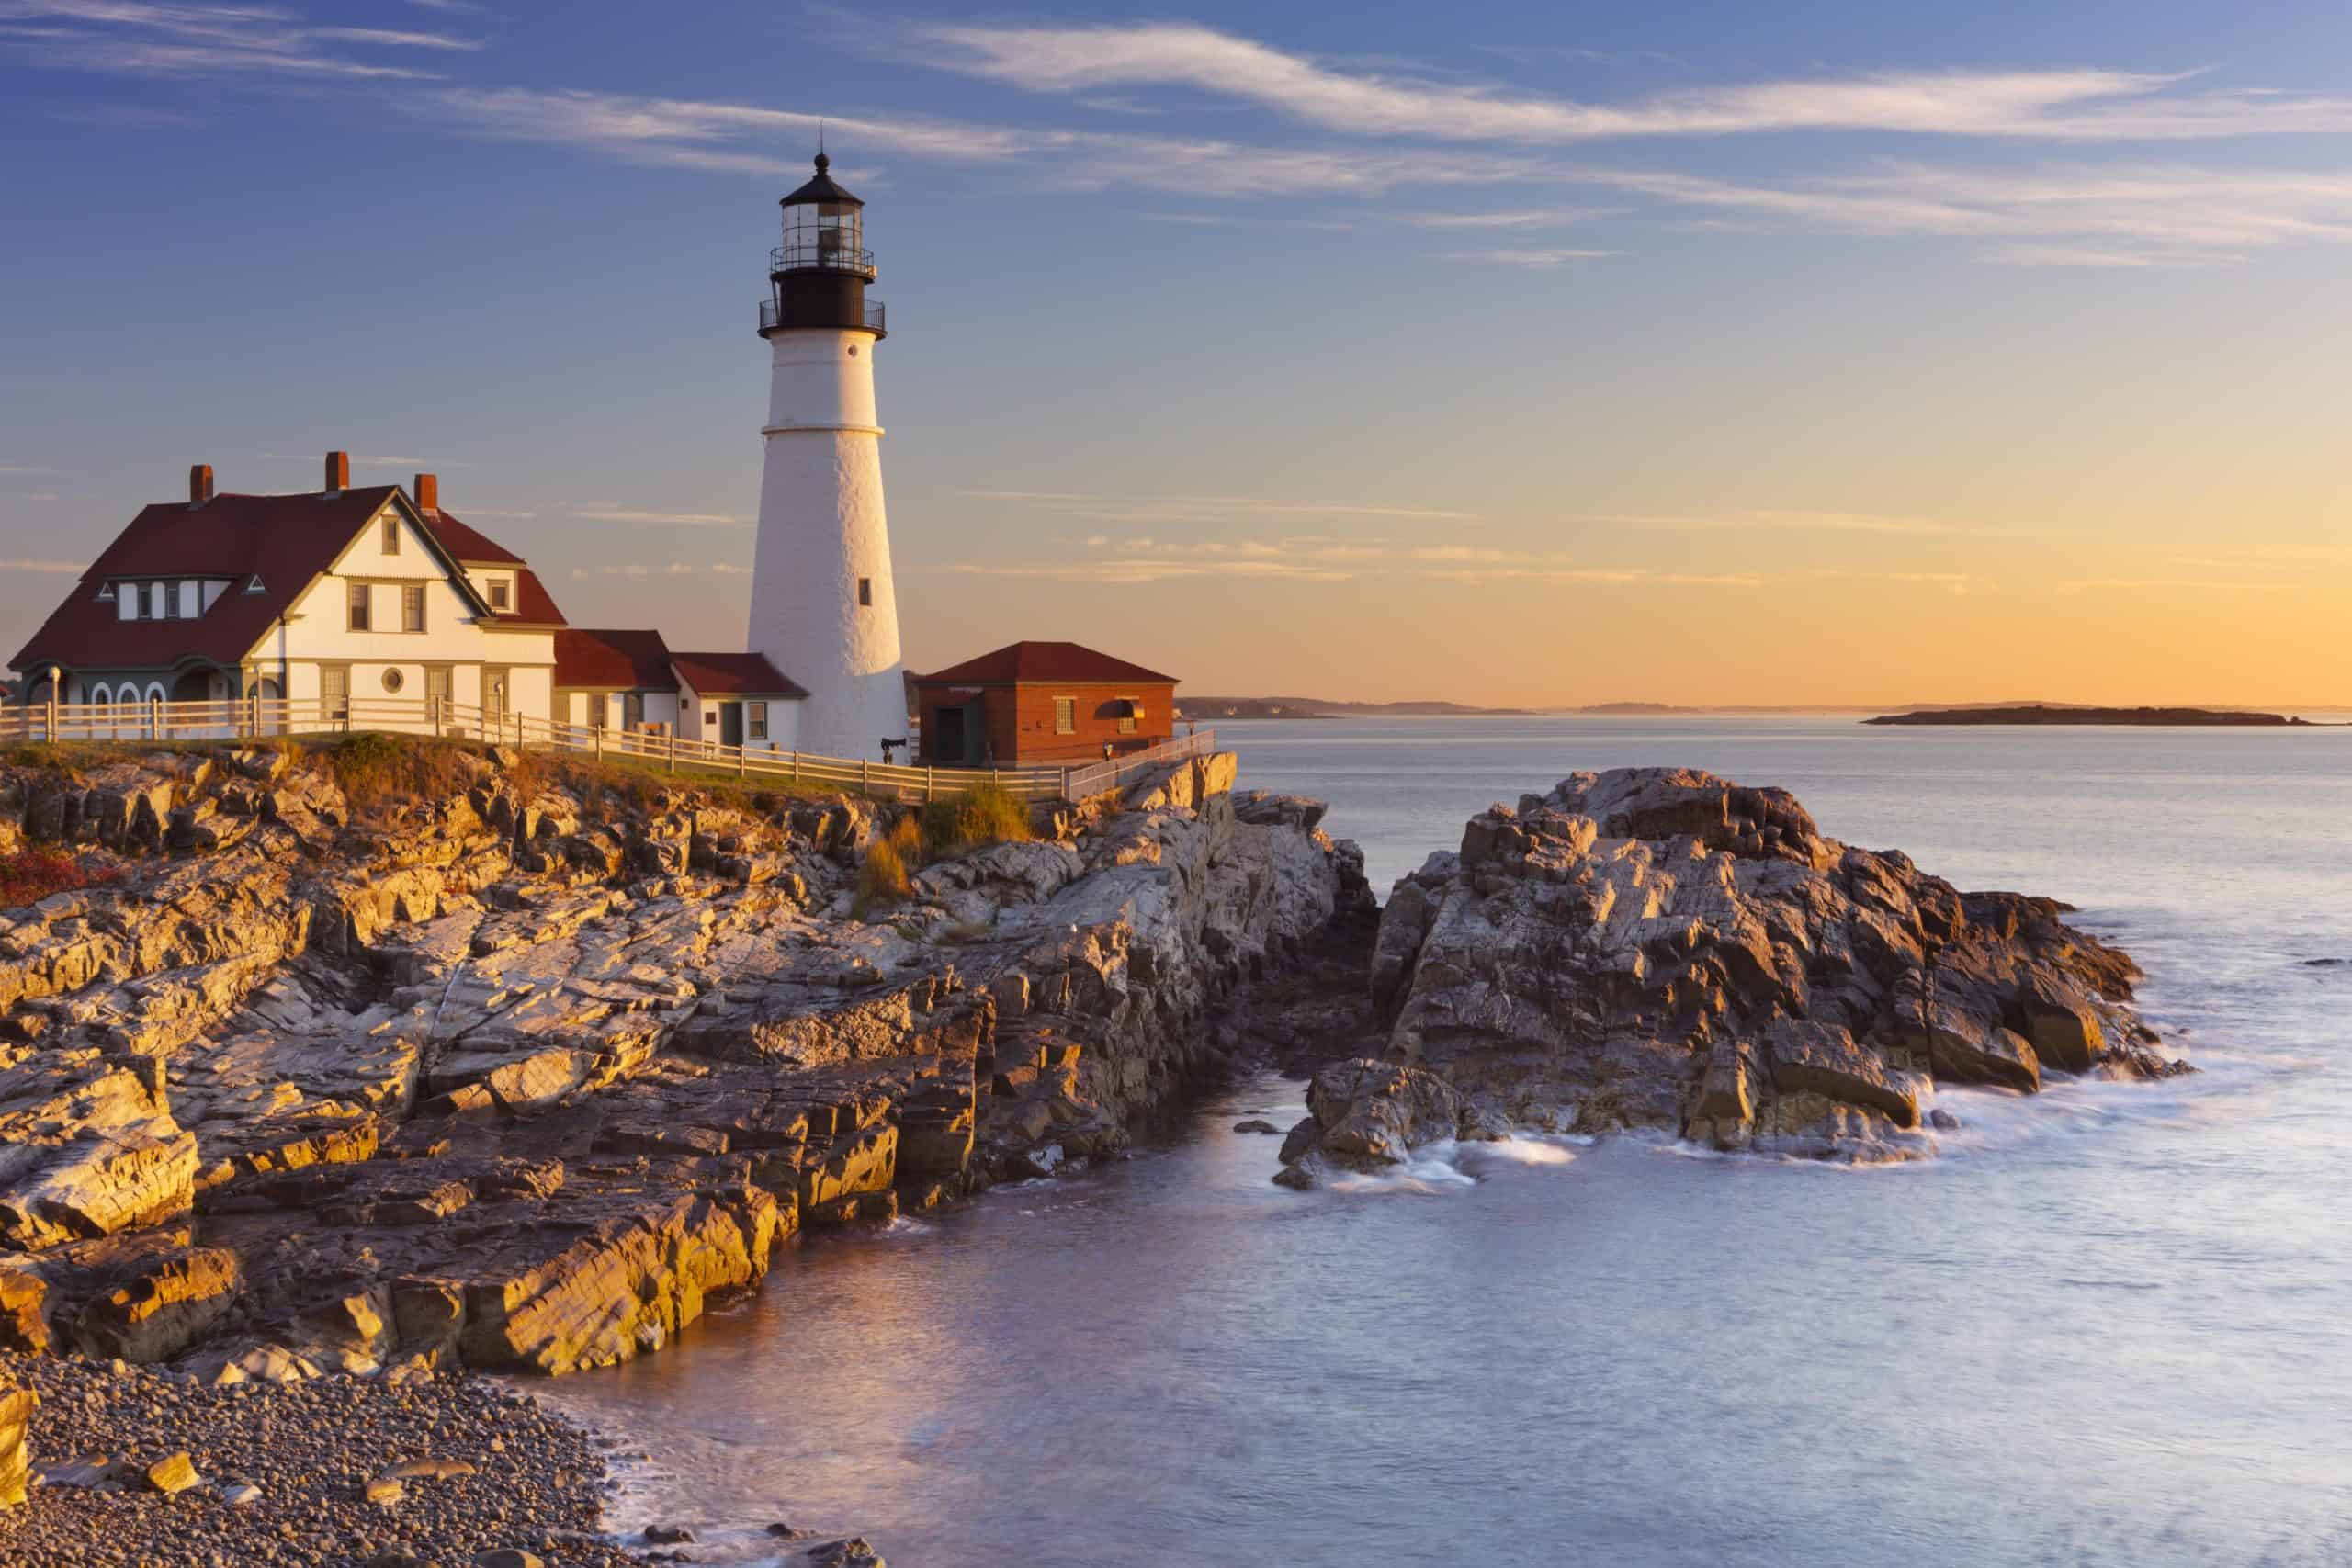
- Personal recreation expenditure, adjusted for population: $2,572 per capita
- Cost of living: -2.9% less than national average
- Total recreation expenditure: $3.6 billion
- Total population: 1.4 million
- Other major spending categories: Groceries, gasoline and other energy goods, food services and accommodations, motor vehicles and parts, health care
8. Connecticut
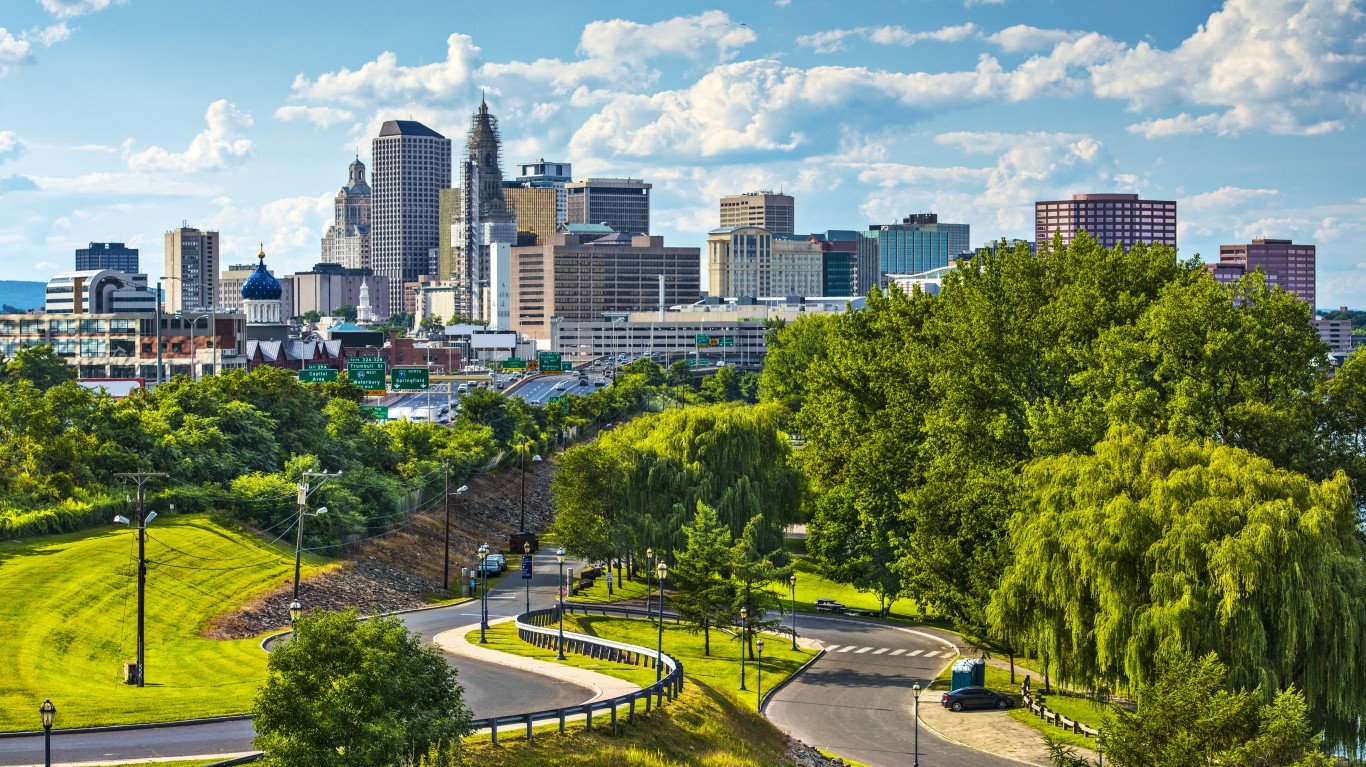
- Personal recreation expenditure, adjusted for population: $2,662 per capita
- Cost of living: +3.7% more than national average
- Total recreation expenditure: $9.6 billion
- Total population: 3.6 million
- Other major spending categories: Financial services and insurance, transportation services, furnishings and durable household equipment, housing and utilities, clothing and footwear
7. New Hampshire

- Personal recreation expenditure, adjusted for population: $2,705 per capita
- Cost of living: +5.3% more than national average
- Total recreation expenditure: $3.8 billion
- Total population: 1.4 million
- Other major spending categories: Motor vehicles and parts, groceries, furnishings and durable household equipment, financial services and insurance, housing and utilities, clothing and footwear
6. Massachusetts
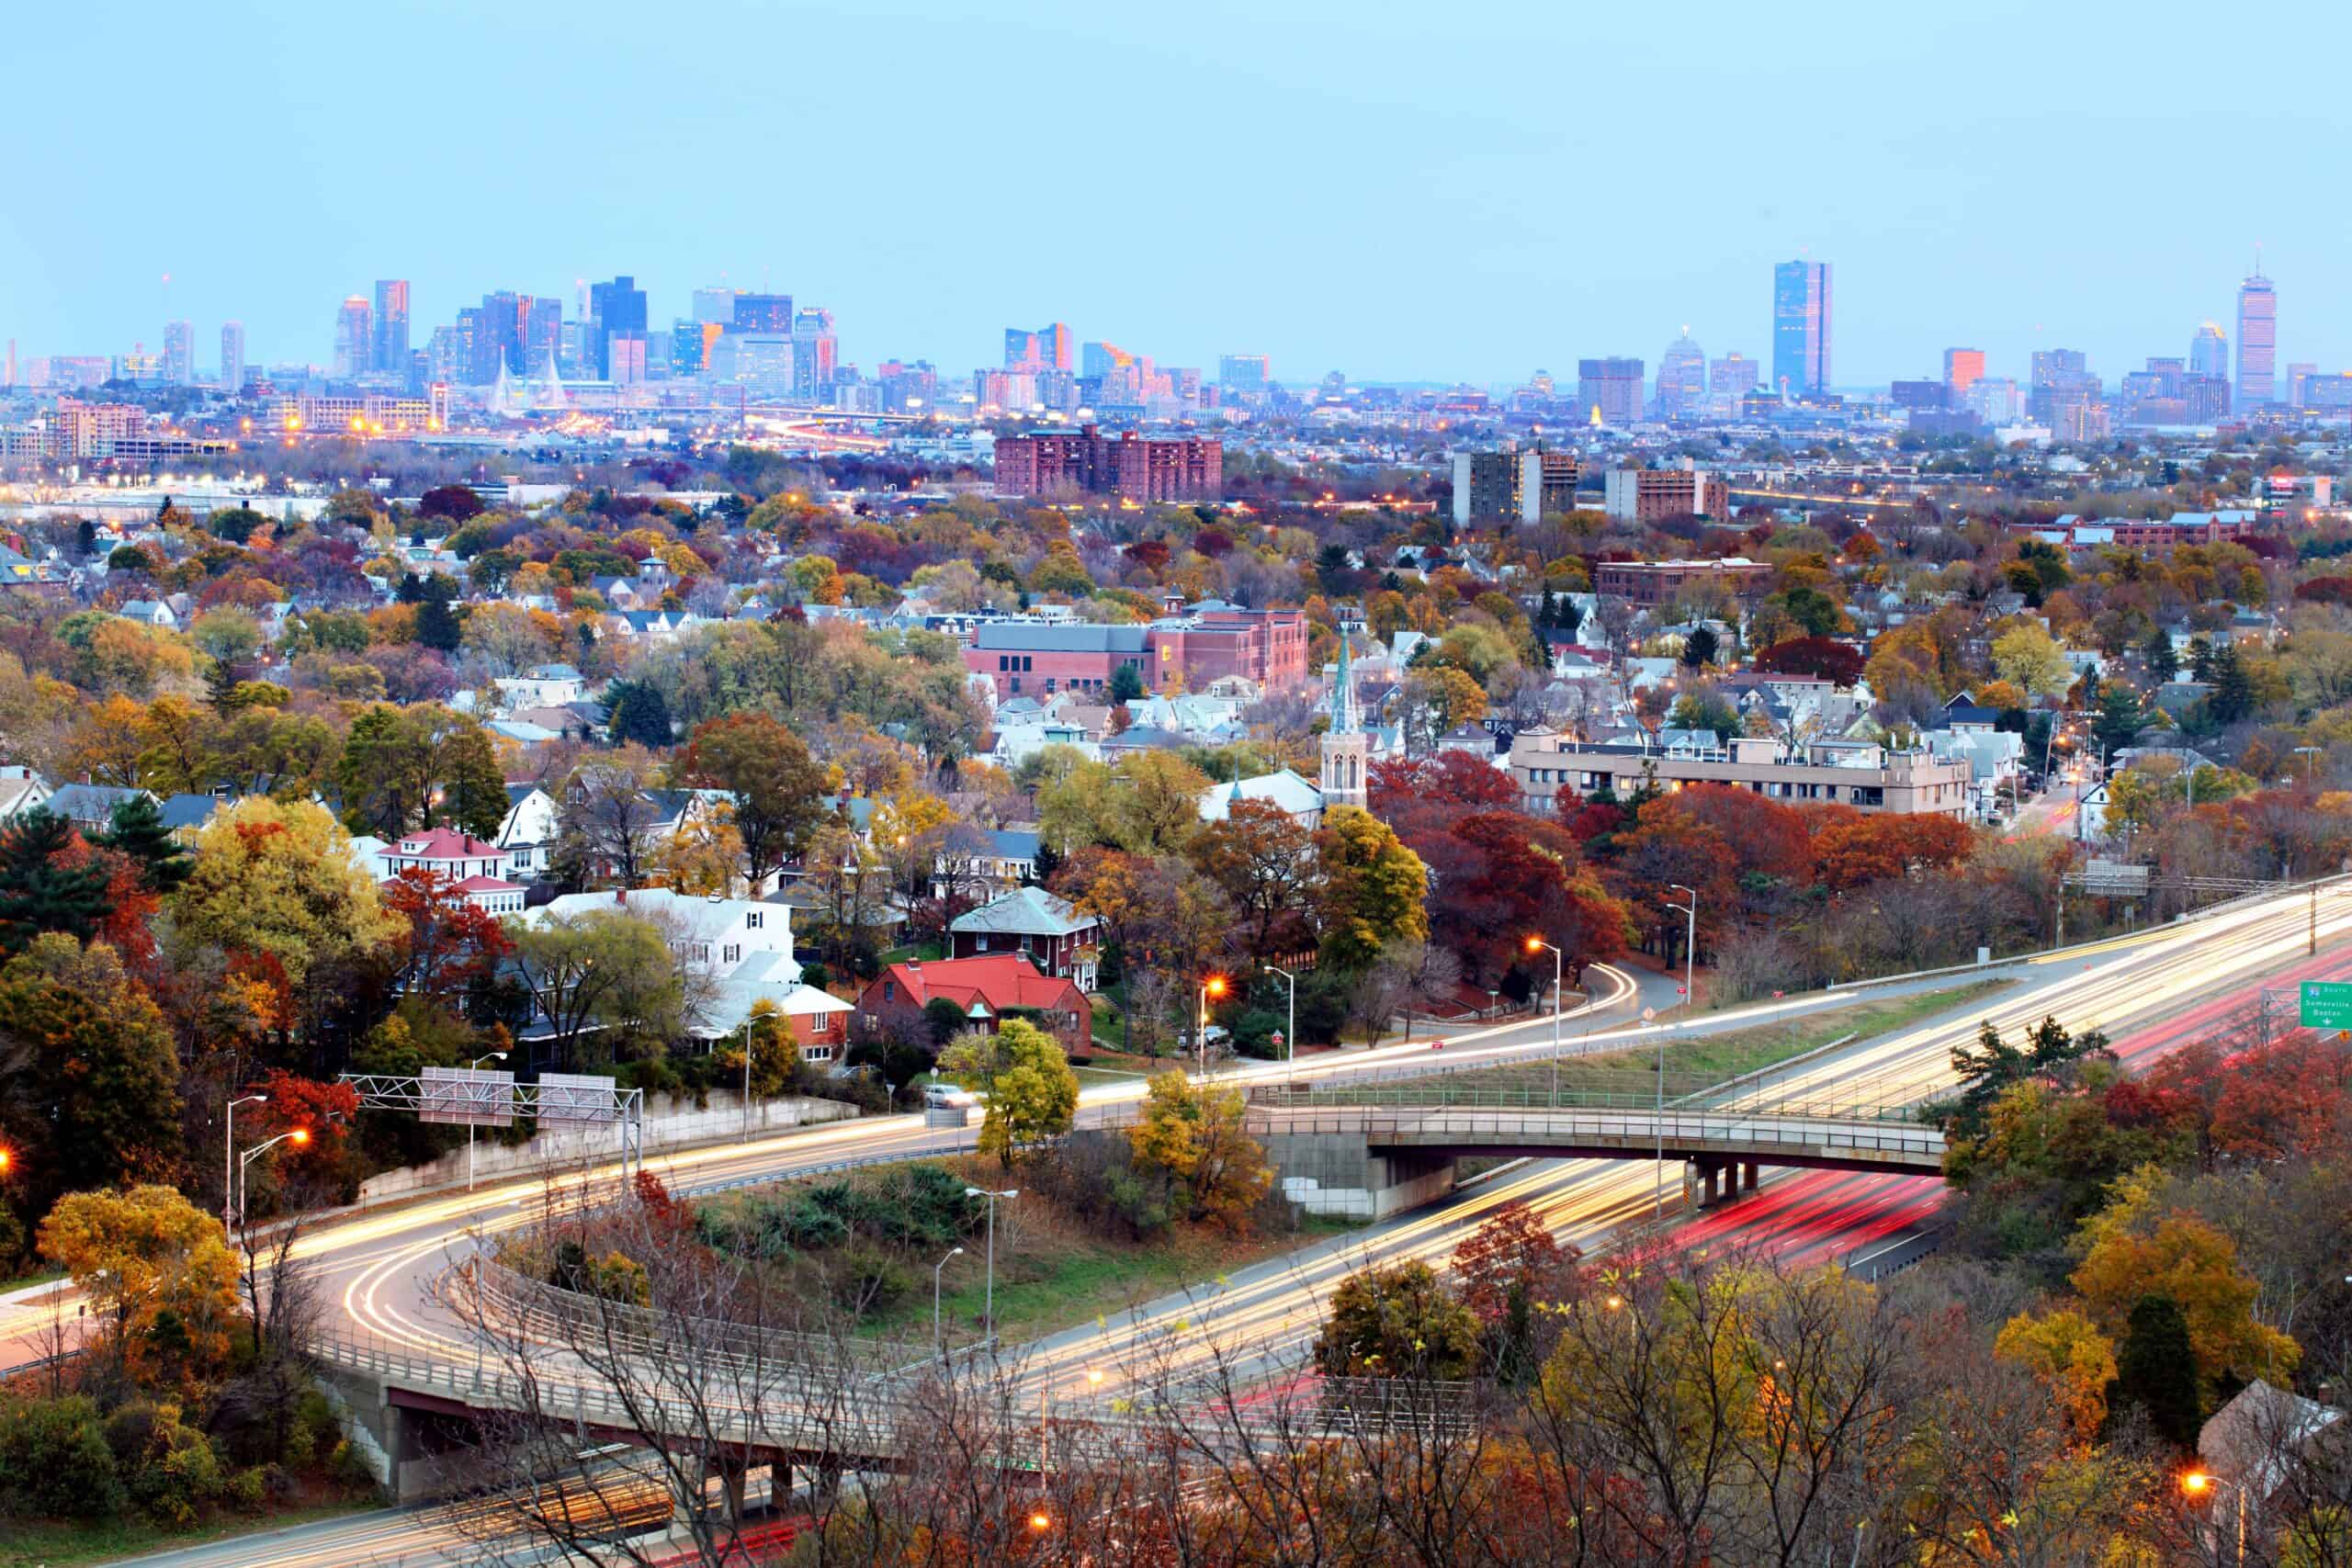
- Personal recreation expenditure, adjusted for population: $2,788 per capita
- Cost of living: +8.2% more than national average
- Total recreation expenditure: $19.5 billion
- Total population: 7.0 million
- Other major spending categories: Transportation services, housing and utilities, financial services and insurance, health care, food services and accommodations
5. Virginia

- Personal recreation expenditure, adjusted for population: $2,814 per capita
- Cost of living: +0.7% more than national average
- Total recreation expenditure: $24.5 billion
- Total population: 8.7 million
- Other major spending categories: Clothing and footwear, housing and utilities, recreational goods and vehicles, groceries, food services and accommodations
4. Washington
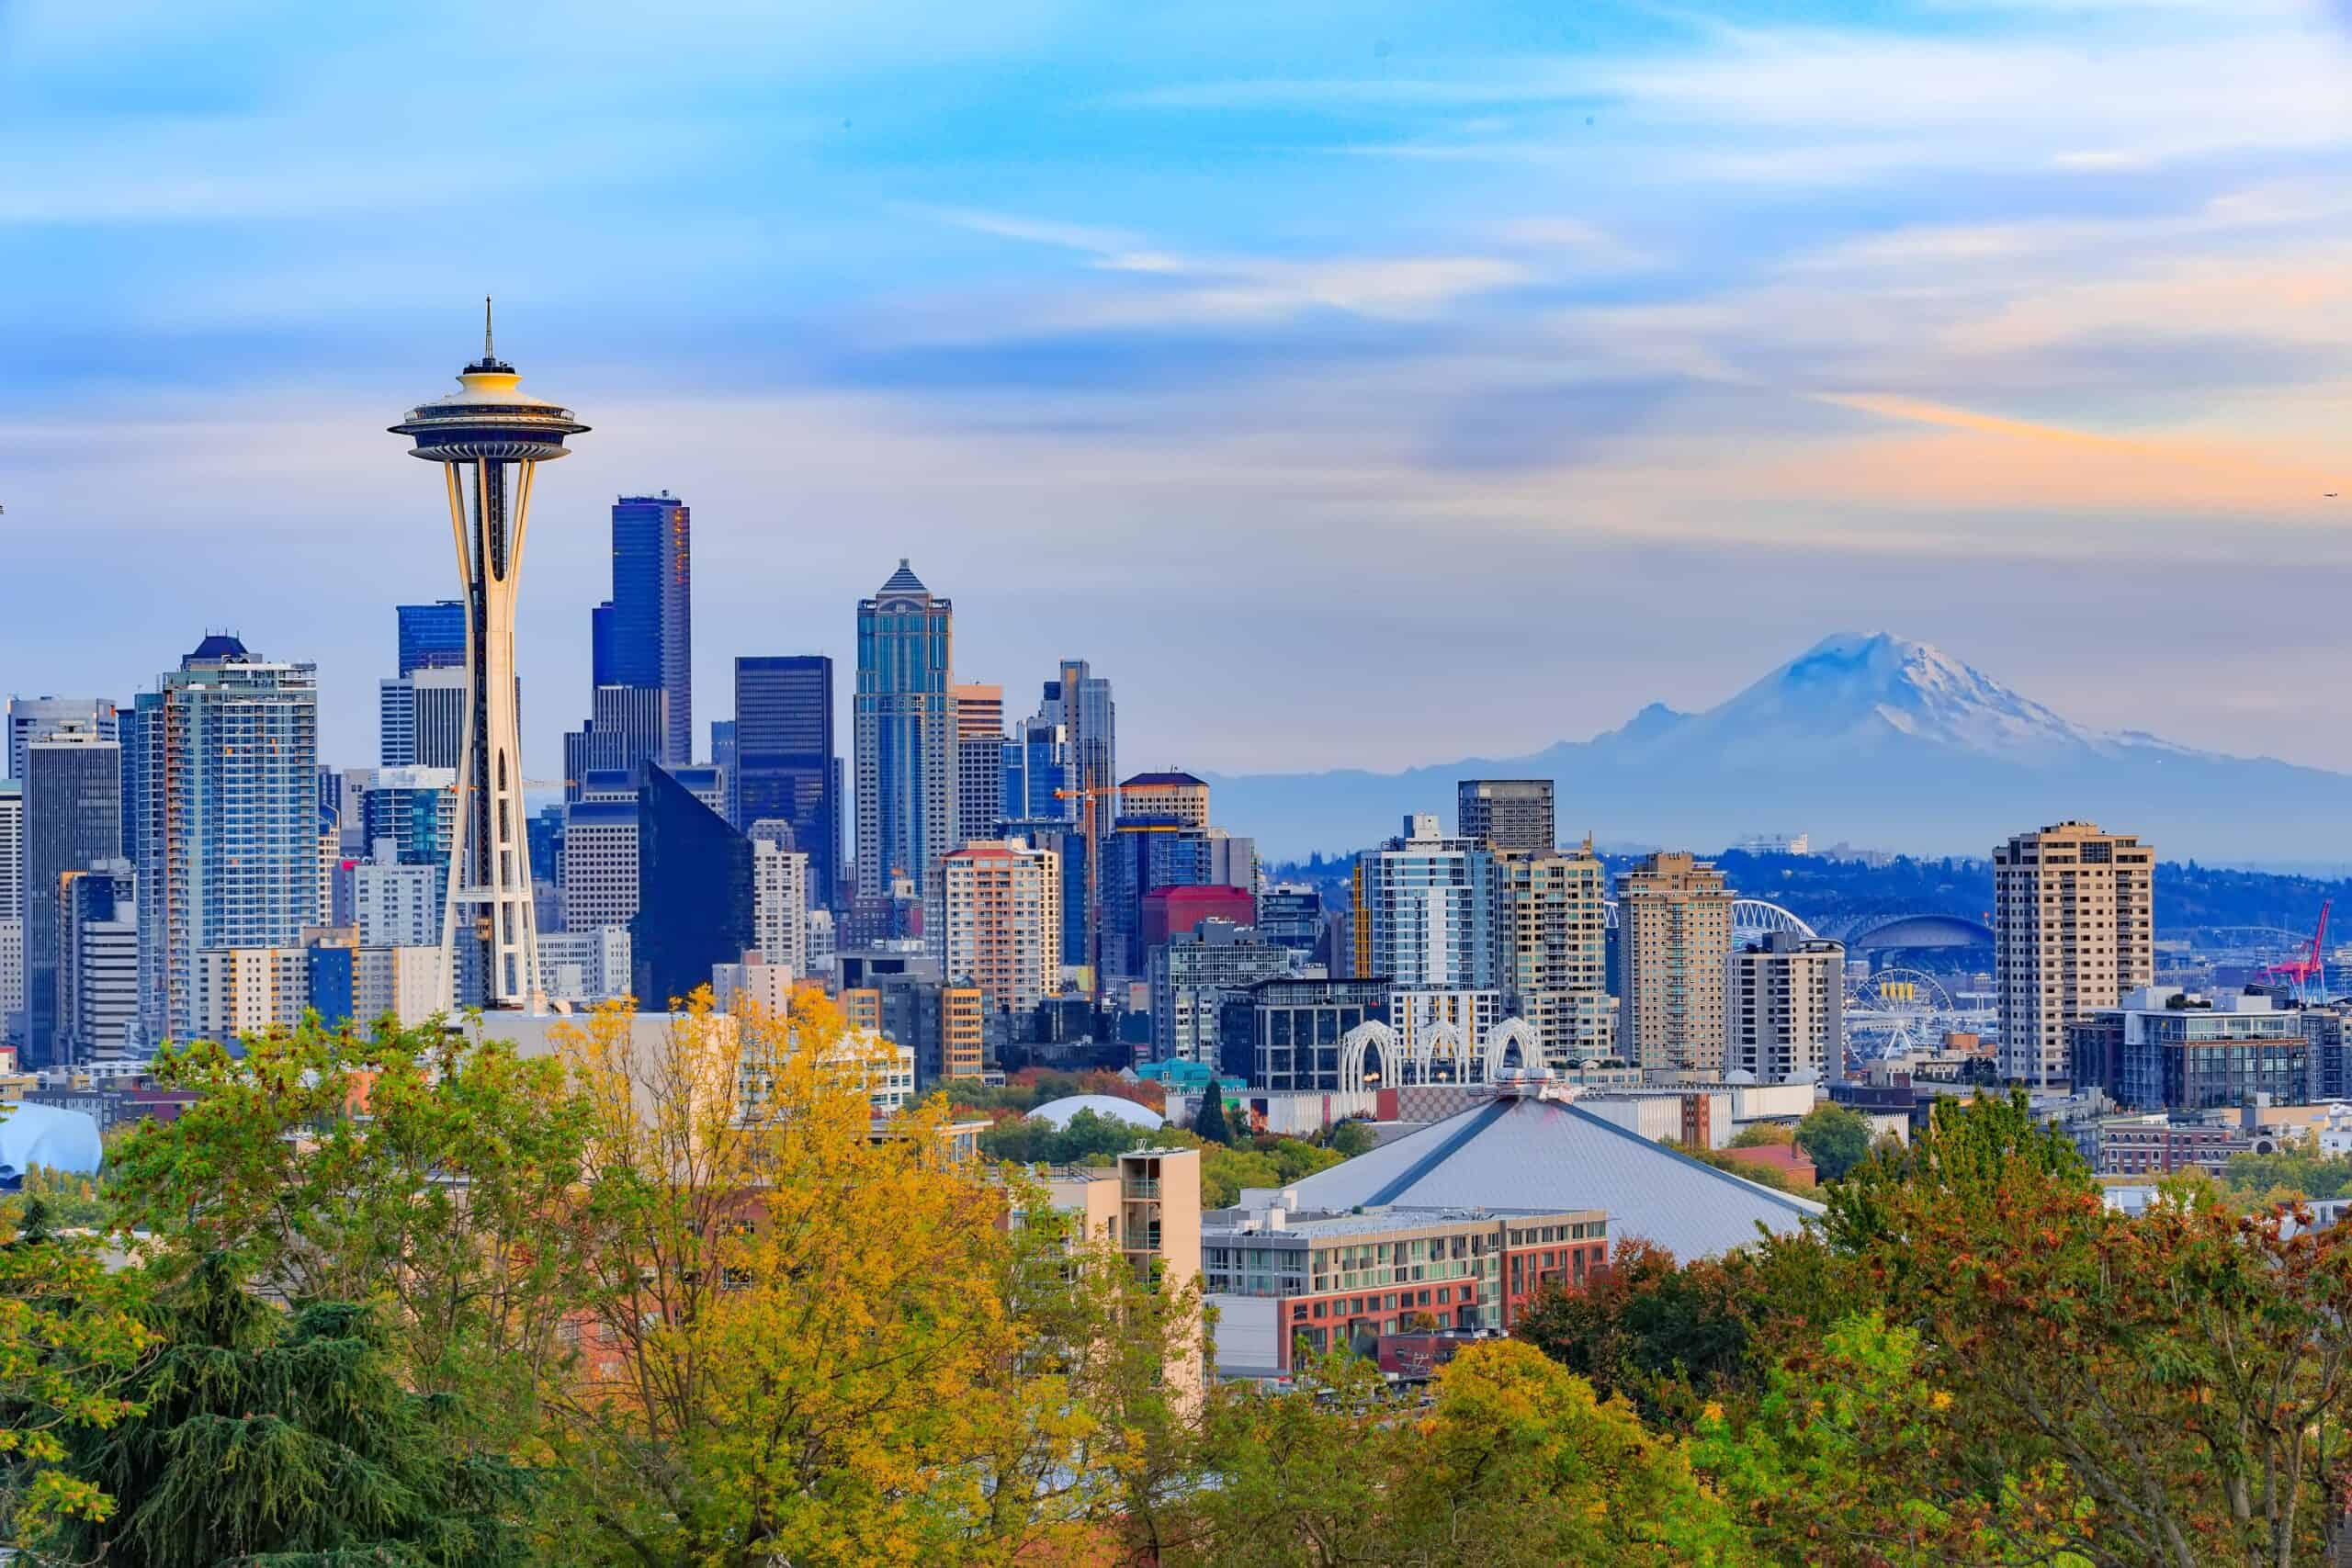
- Personal recreation expenditure, adjusted for population: $2,828 per capita
- Cost of living: +8.6% more than national average
- Total recreation expenditure: $22.1 billion
- Total population: 7.8 million
- Other major spending categories: Transportation services, recreational goods and vehicles, housing and utilities, furnishings and durable household equipment, groceries
3. California
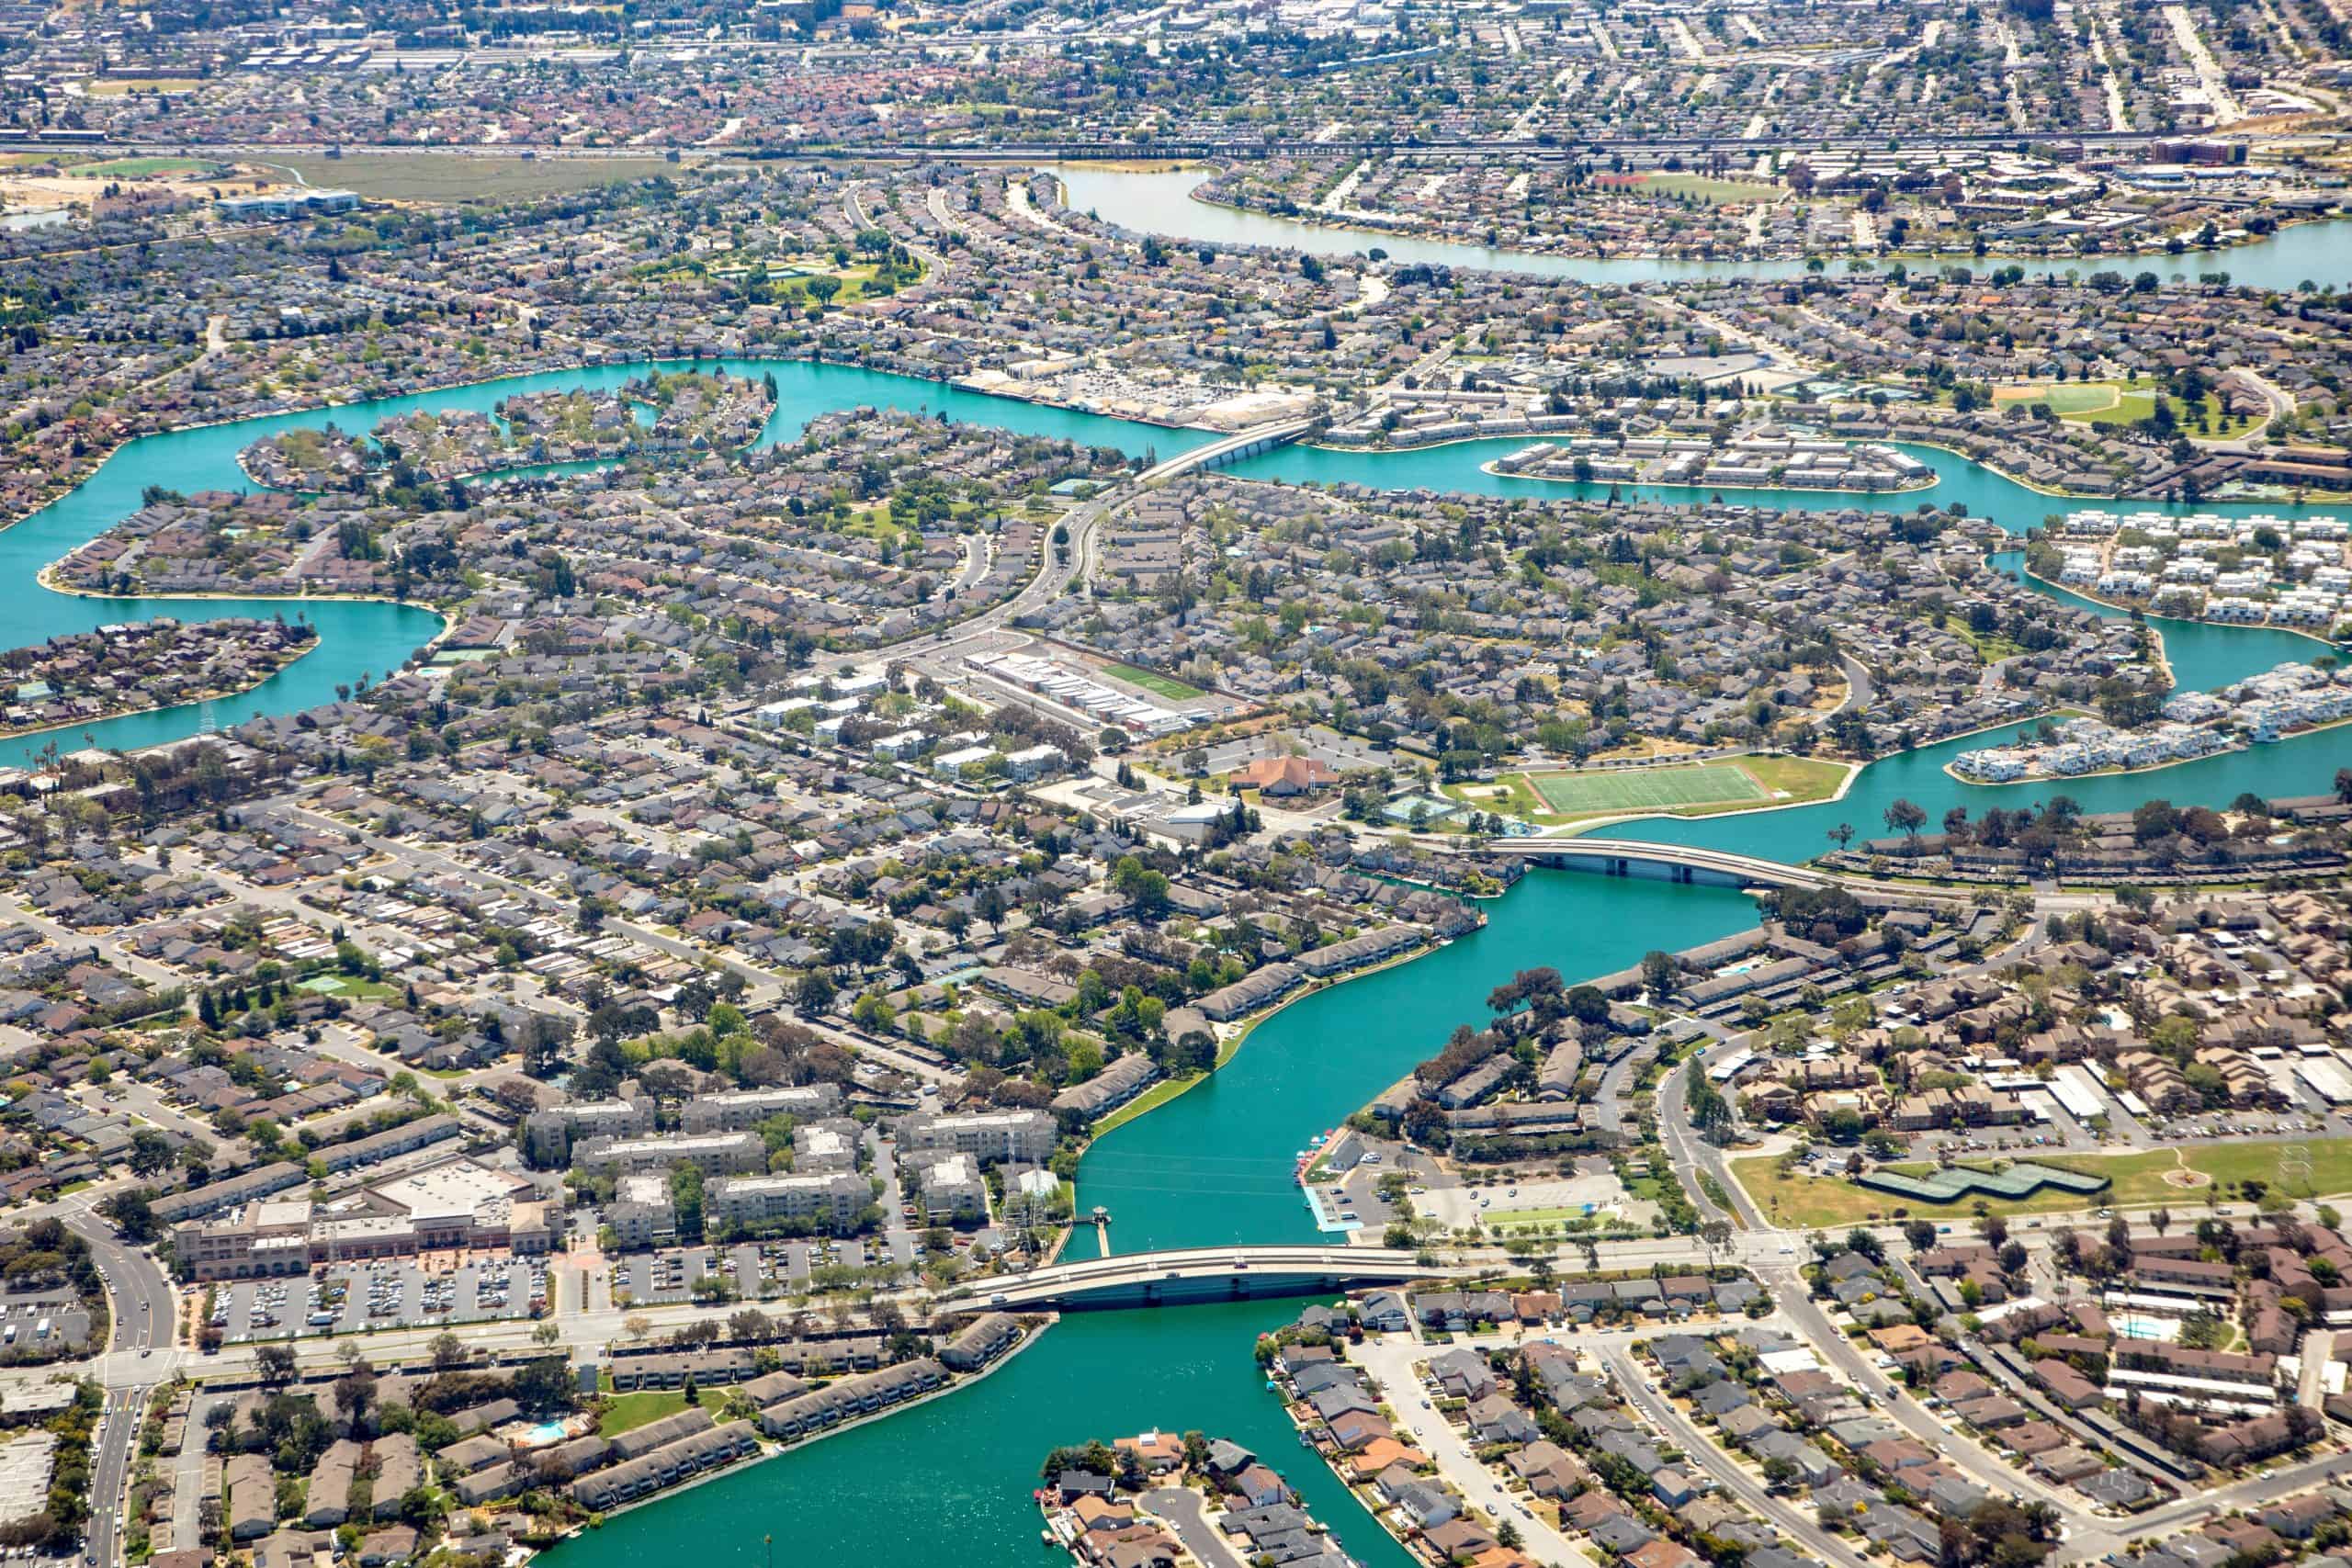
- Personal recreation expenditure, adjusted for population: $3,217 per capita
- Cost of living: +12.6% more than national average
- Total recreation expenditure: $125.4 billion
- Total population: 39.0 million
- Other major spending categories: Clothing and footwear, food services and accommodations, housing and utilities, transportation services, health care
2. Alaska
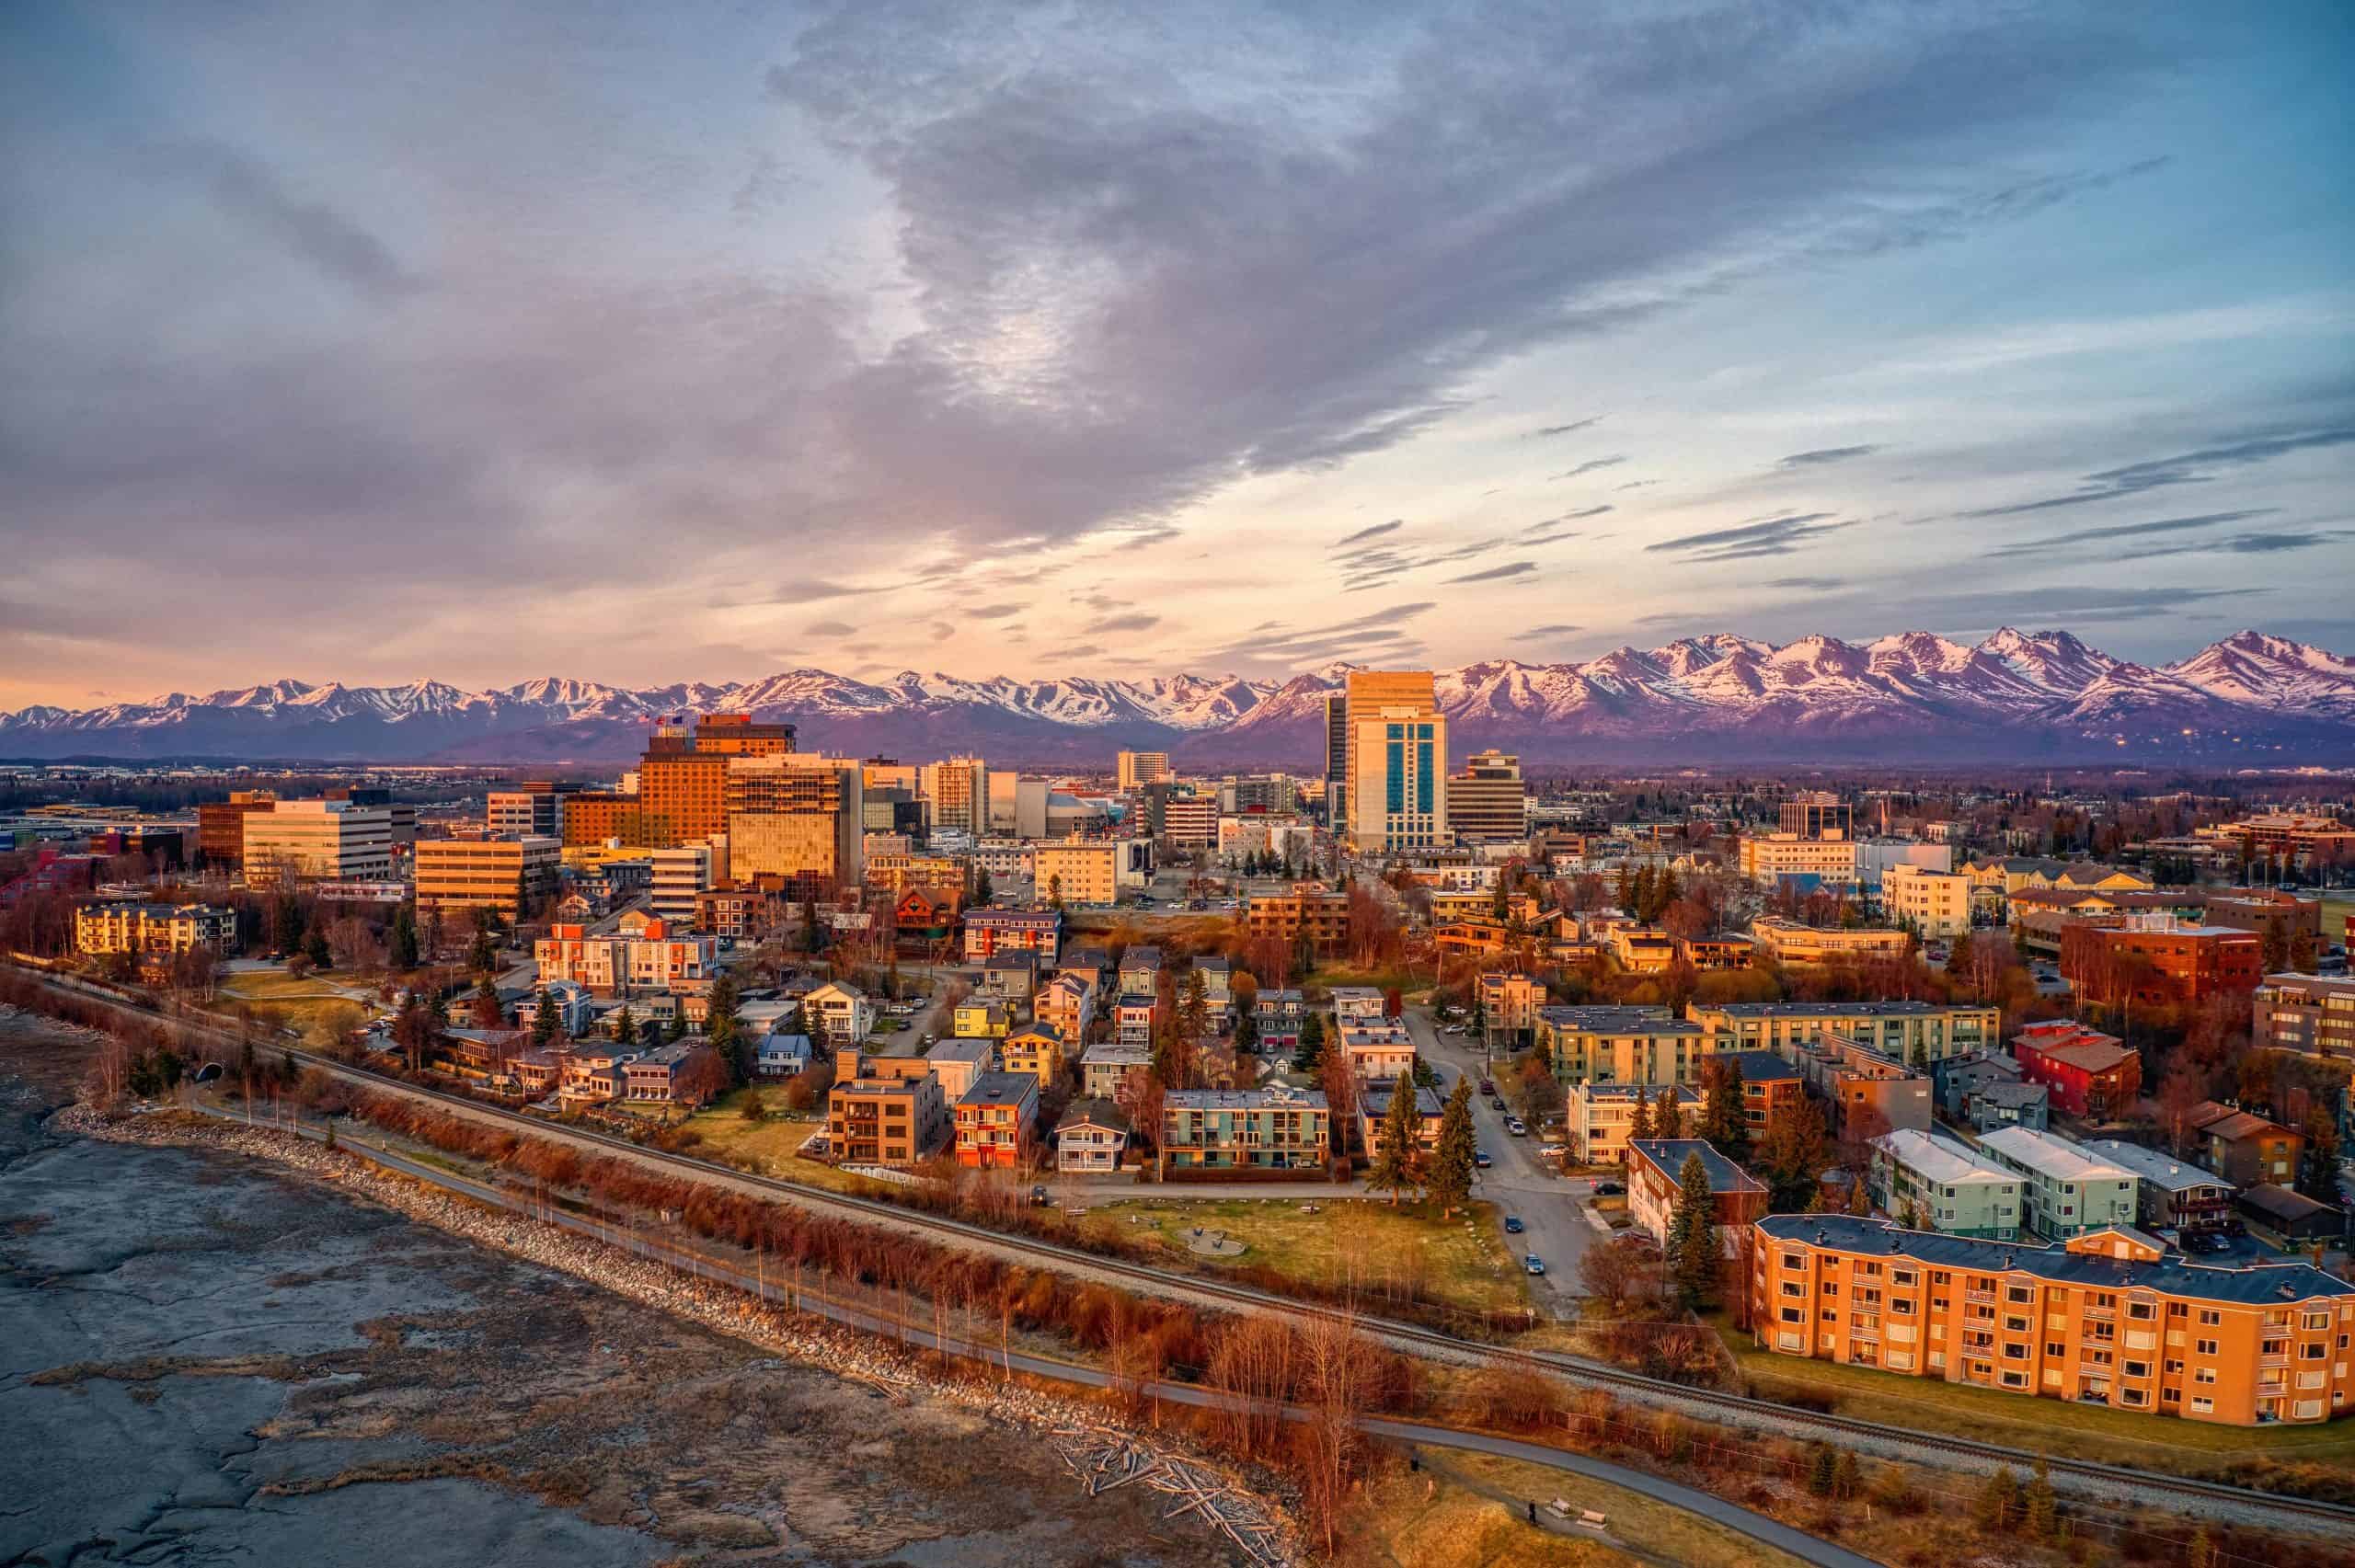
- Personal recreation expenditure, adjusted for population: $3,273 per capita
- Cost of living: +1.7% more than national average
- Total recreation expenditure: $2.4 billion
- Total population: 733,406
- Other major spending categories: Health care, recreational goods and vehicles, transportation services, food services and accommodations, furnishings and durable household equipment
1. Colorado
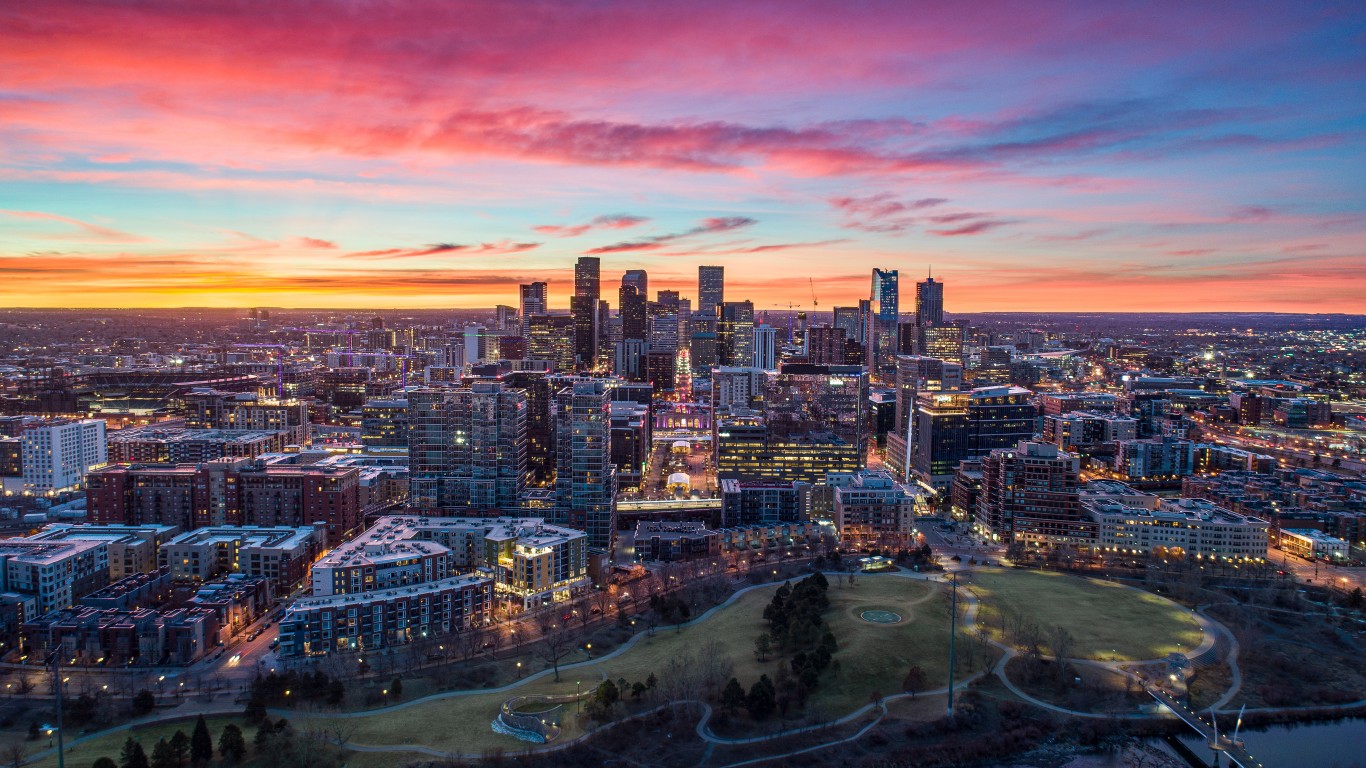
- Personal recreation expenditure, adjusted for population: $3,274 per capita
- Cost of living: +1.4% more than national average
- Total recreation expenditure: $19.2 billion
- Total population: 5.9 million
- Other major spending categories: Furnishings and durable household equipment, housing and utilities, food services and accommodations, recreational goods and vehicles, clothing and footwear
The post The States Spending The Most On Having Fun appeared first on 24/7 Wall St..