


Black Families Face the Steepest Barriers in These Cities
If you look closely at American history, it’s easy to see that racism and discriminatory practices have, unfortunately, been built into the fabric of our nation. Outside of the horrific traumas of slavery, Black individuals have not been given the same opportunities as others. Laws have, in the last 100-200 years, especially disenfranchised Black Americans. […] The post Black Families Face the Steepest Barriers in These Cities appeared first on 24/7 Wall St..

If you look closely at American history, it’s easy to see that racism and discriminatory practices have, unfortunately, been built into the fabric of our nation. Outside of the horrific traumas of slavery, Black individuals have not been given the same opportunities as others. Laws have, in the last 100-200 years, especially disenfranchised Black Americans. As professor and scholar Bernadette Atuahene writes: “White working-class families…used government-insured loans with low down payments and affordable monthly mortgage payments to buy suburban homes and take part in the American Dream. In contrast, between 1945 and 1959, African Americans received less than 2 percent of federally insured home loans.” Redlining, violence and threats, and racially restrictive covenants were only just a few other ways that Black people were harmed. This trickled through the ages, preventing many Black families from passing down generational wealth; instead, many Black families became trapped in a system of systemic racism. Many towns and cities across the country still see huge inequities between what White Americans can achieve financially, and what Black Americans can. (Hate lives here: this state is home to over 100 hate groups.)
To determine the worst cities for Black Americans, 24/7 Wall St. examined data from eight socioeconomic measures in each of the nation’s 384 metropolitan areas. For each city, we evaluated the gap between White and Black residents in poverty, high school and college education, income, homeownership, unemployment, mortality, and incarceration. We consulted data from the U.S. Census Bureau’s 2022 American Community Survey, Bureau of Justice Statistics, and Centers For Disease Control and Prevention. These figures were adjusted for population using ACS data. For each measure, we constructed an index of the gaps between Black and White Americans. The index was standardized using min-max normalization. We excluded metro areas where Black residents comprise less than 5% of the population. Because states, rather than metro areas, are responsible for the prison population, incarceration rates are for the state where the metro area is located. If a metro area spans more than one state, we used the state in which the metro area’s principal city is located. We aggregated mortality rates from the county to the metropolitan level using boundary definitions from the Census Bureau. Incarceration and mortality rates are per 100,000 residents.
Why We’re Covering Racial Inequality

You might think racial inequality is a thing of the past, especially in cities that seem to pride themselves on diversity and inclusion. But the data tells a different story. While we believe that there are hubs of opportunity, systemic barriers continue to hold Black Americans back from achieving economic mobility, financial security, homeownership, and social stability. Looking at how these cities fail their Black communities provides a better understanding of the disparities affecting real families. Through this, we can begin to identify solutions.
These are the 25 worst cities for Black Americans to live in:
25. Decatur, IL

- Median household income, 2022: $32,570 (Black); $67,048 (White)
- Homeownership rate, 2022: 35.2% (Black); 76.4% (White)
- Unemployment rate, 2022: 18.9% (Black); 5.6% (White)
- Black population, 2022: 17,530 (16.9% of total)
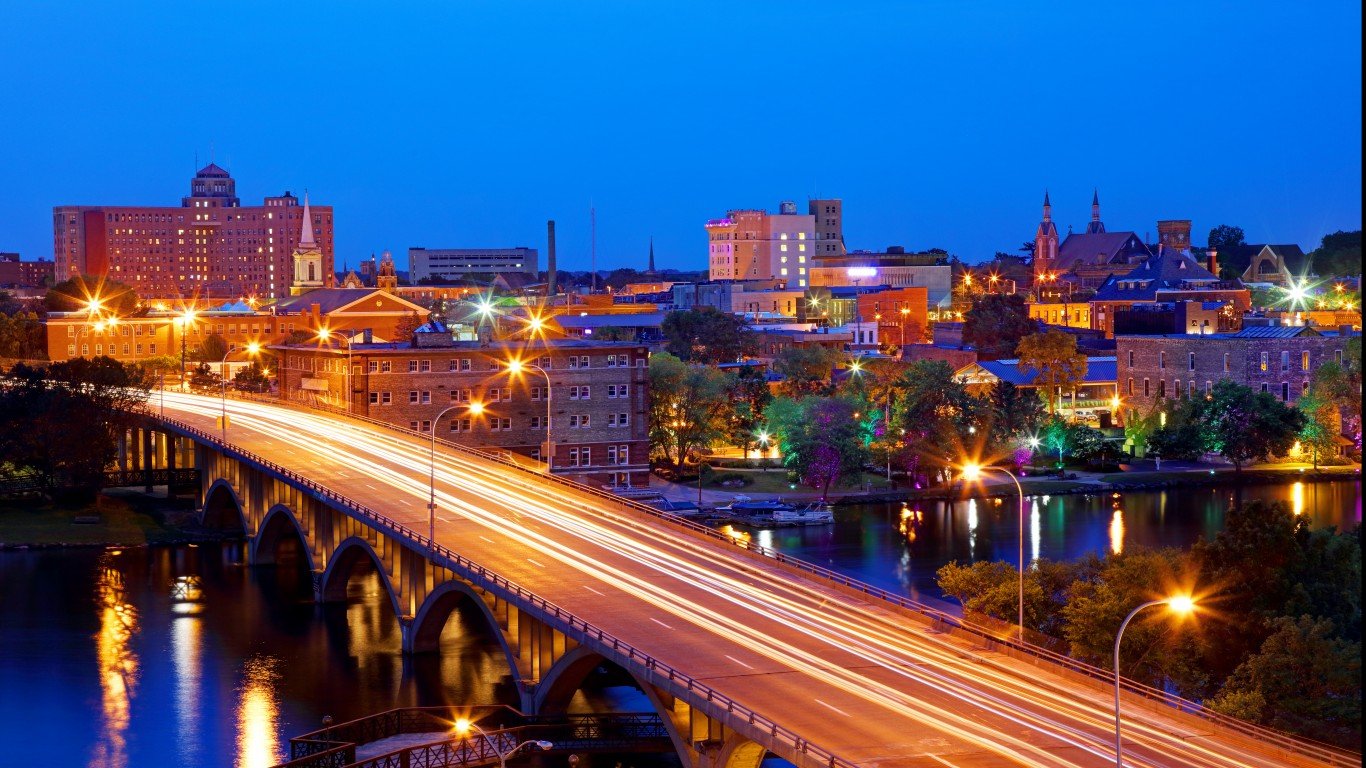
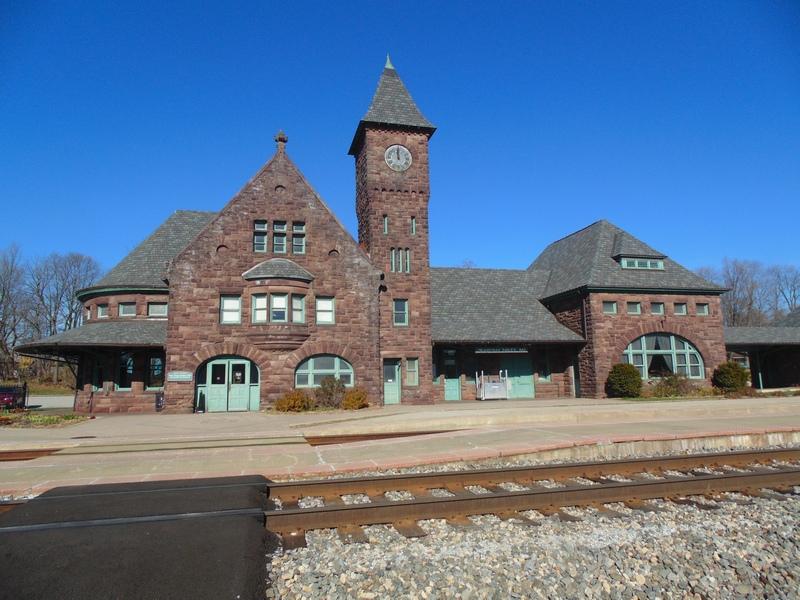
24. Erie, PA
- Median household income, 2022: $26,626 (Black); $63,010 (White)
- Homeownership rate, 2022: 33.6% (Black); 71.8% (White)
- Unemployment rate, 2022: 9.3% (Black); 5.2% (White)
- Black population, 2022: 18,087 (6.7% of total)
23. Champaign-Urbana, IL
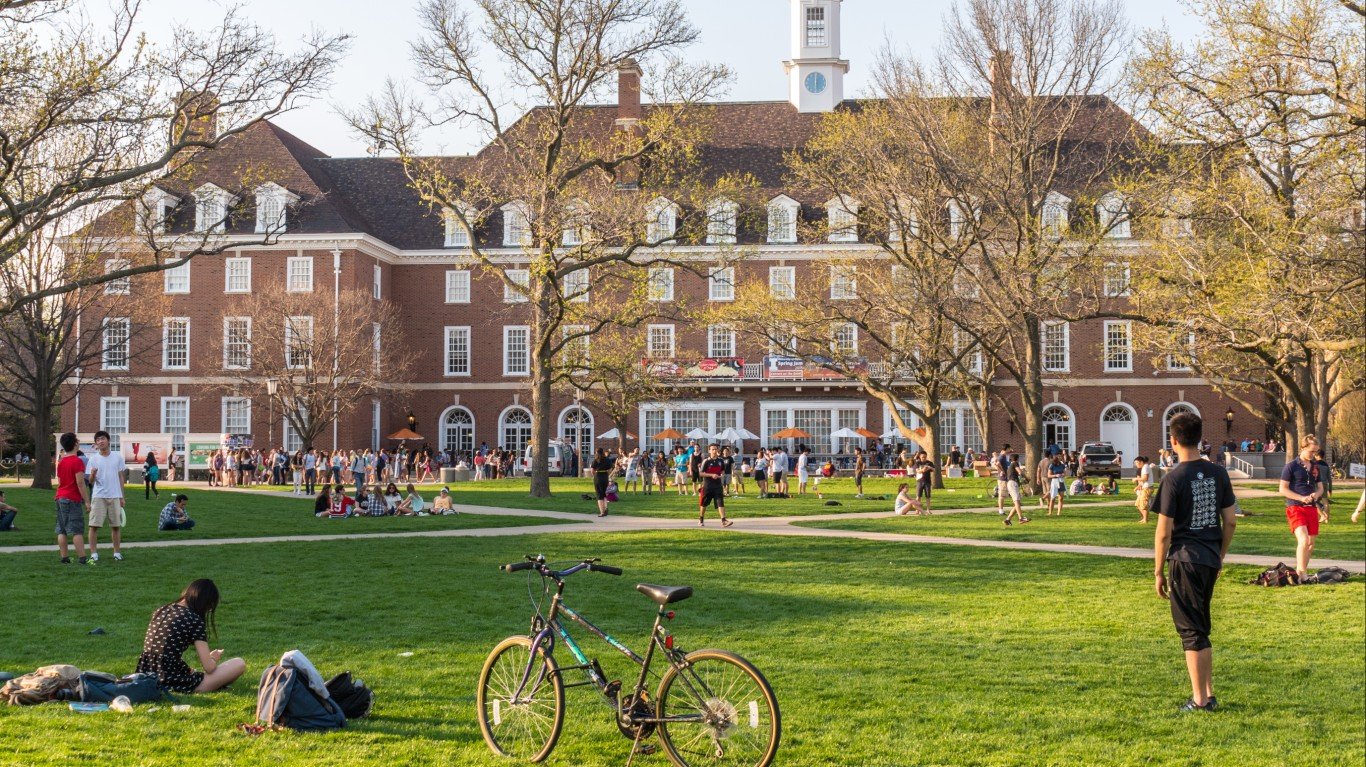
- Median household income, 2022: $37,241 (Black); $73,120 (White)
- Homeownership rate, 2022: 26.6% (Black); 65.4% (White)
- Unemployment rate, 2022: 12.5% (Black); 4.0% (White)
- Black population, 2022: 27,057 (12.1% of total)
22. Bridgeport-Stamford-Norwalk, CT
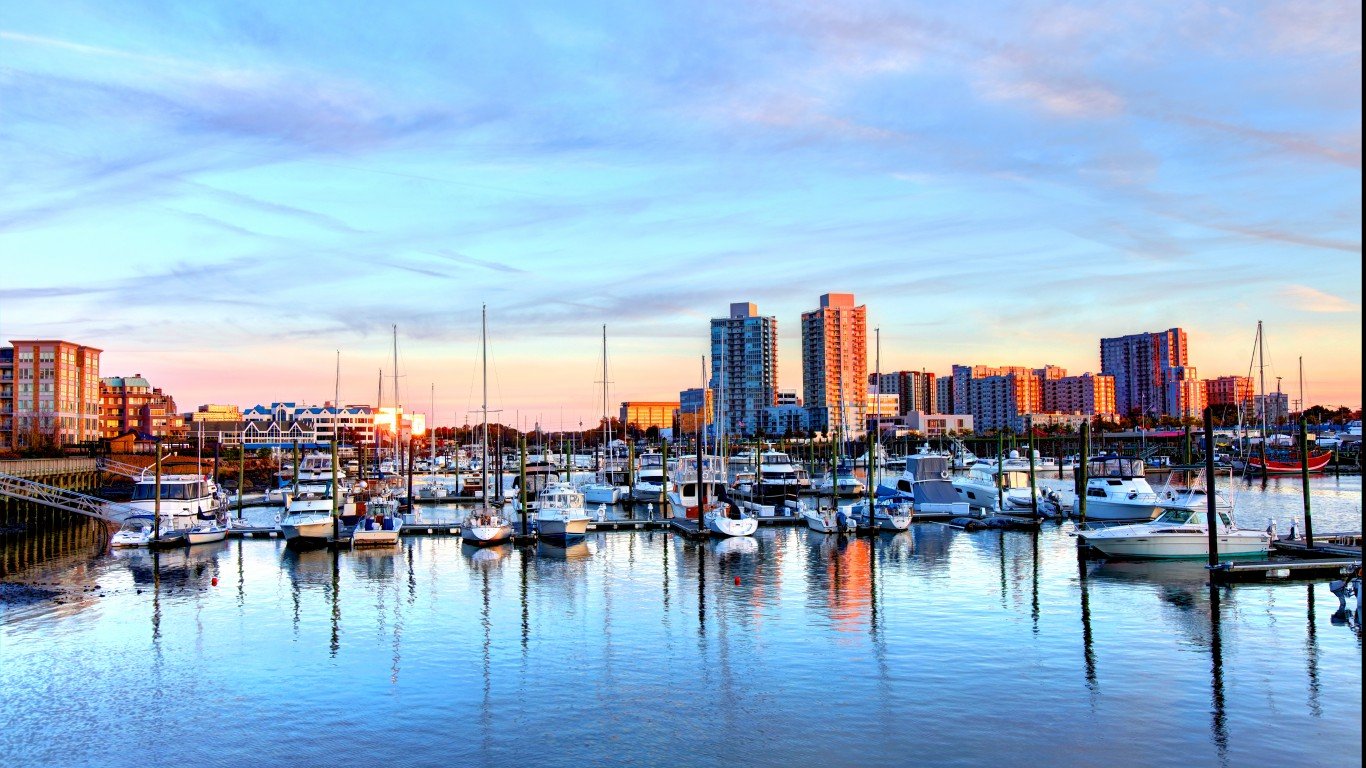
- Median household income, 2022: $70,129 (Black); $122,437 (White)
- Homeownership rate, 2022: 40.1% (Black); 74.7% (White)
- Unemployment rate, 2022: 8.5% (Black); 5.7% (White)
- Black population, 2022: 95,447 (10.0% of total)
21. Buffalo-Cheektowaga, NY
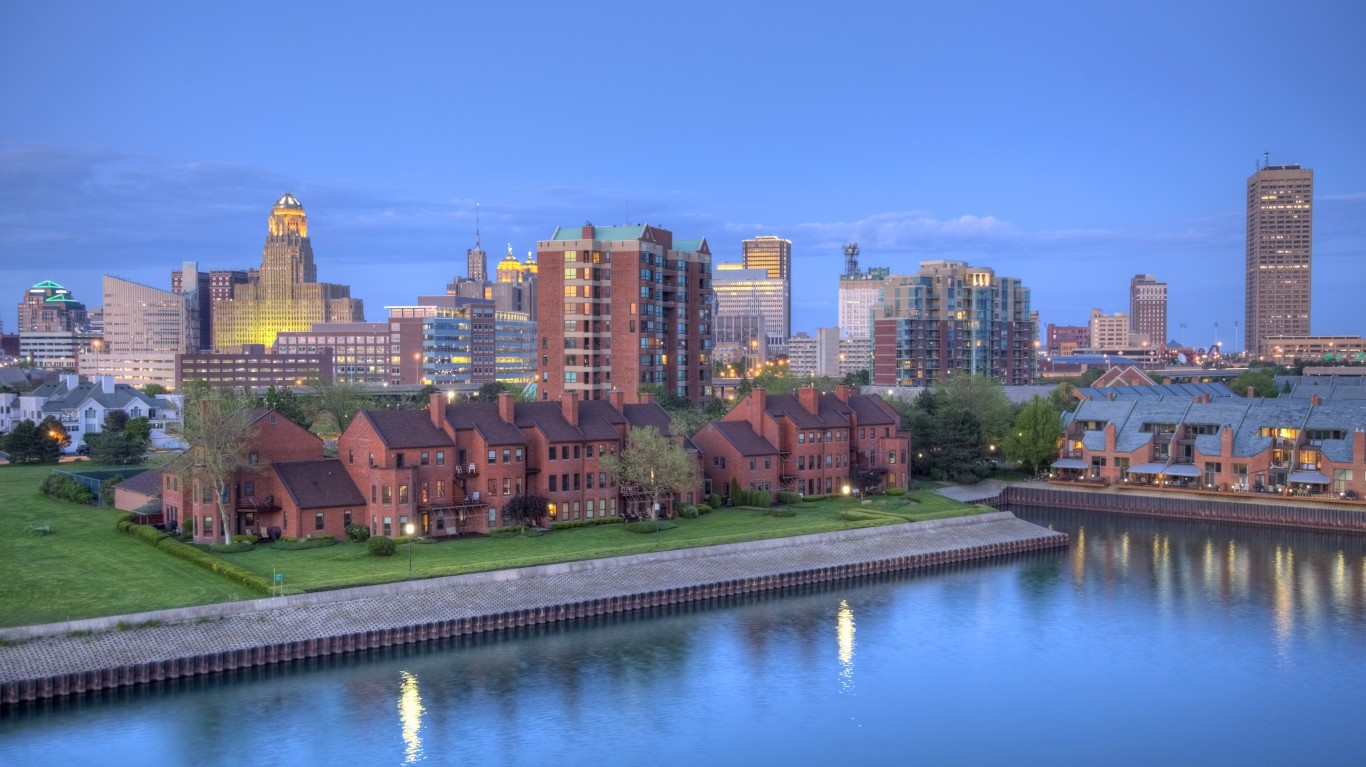
- Median household income, 2022: $39,461 (Black); $74,245 (White)
- Homeownership rate, 2022: 37.6% (Black); 72.2% (White)
- Unemployment rate, 2022: 9.8% (Black); 4.5% (White)
- Black population, 2022: 132,849 (11.4% of total)
20. Rockford, IL
- Median household income, 2022: $34,676 (Black); $69,224 (White)
- Homeownership rate, 2022: 28.0% (Black); 74.4% (White)
- Unemployment rate, 2022: 16.5% (Black); 6.6% (White)
- Black population, 2022: 38,033 (11.3% of total)
19. Albany-Schenectady-Troy, NY

- Median household income, 2022: $45,681 (Black); $88,060 (White)
- Homeownership rate, 2022: 25.1% (Black); 68.9% (White)
- Unemployment rate, 2022: 10.8% (Black); 4.2% (White)
- Black population, 2022: 65,586 (7.3% of total)
18. Omaha-Council Bluffs, NE-IA
- Median household income, 2022: $43,856 (Black); $84,385 (White)
- Homeownership rate, 2022: 31.9% (Black); 70.6% (White)
- Unemployment rate, 2022: 8.8% (Black); 3.0% (White)
- Black population, 2022: 70,849 (7.3% of total)
17. Peoria, IL
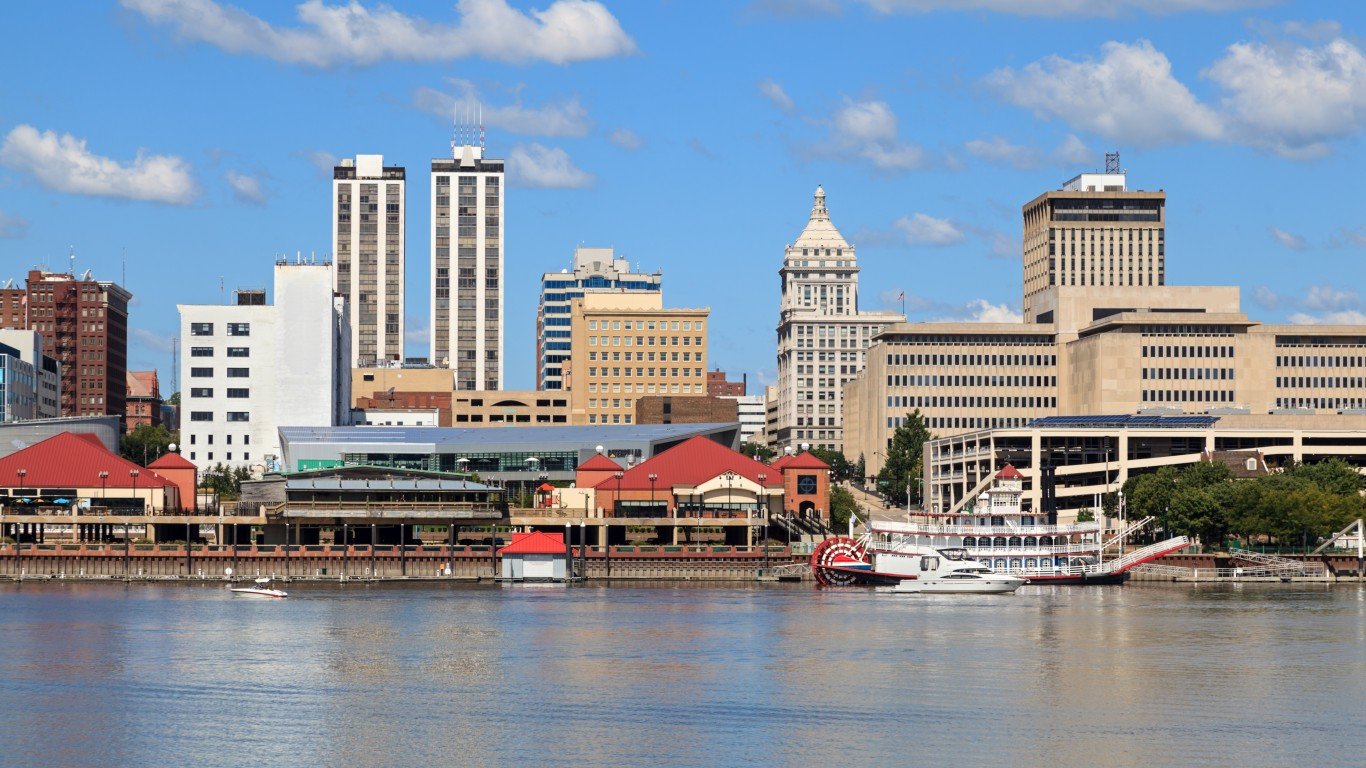
- Median household income, 2022: $34,891 (Black); $70,355 (White)
- Homeownership rate, 2022: 33.4% (Black); 76.5% (White)
- Unemployment rate, 2022: 15.6% (Black); 4.5% (White)
- Black population, 2022: 34,545 (8.6% of total)
16. Minneapolis-St. Paul-Bloomington, MN-WI
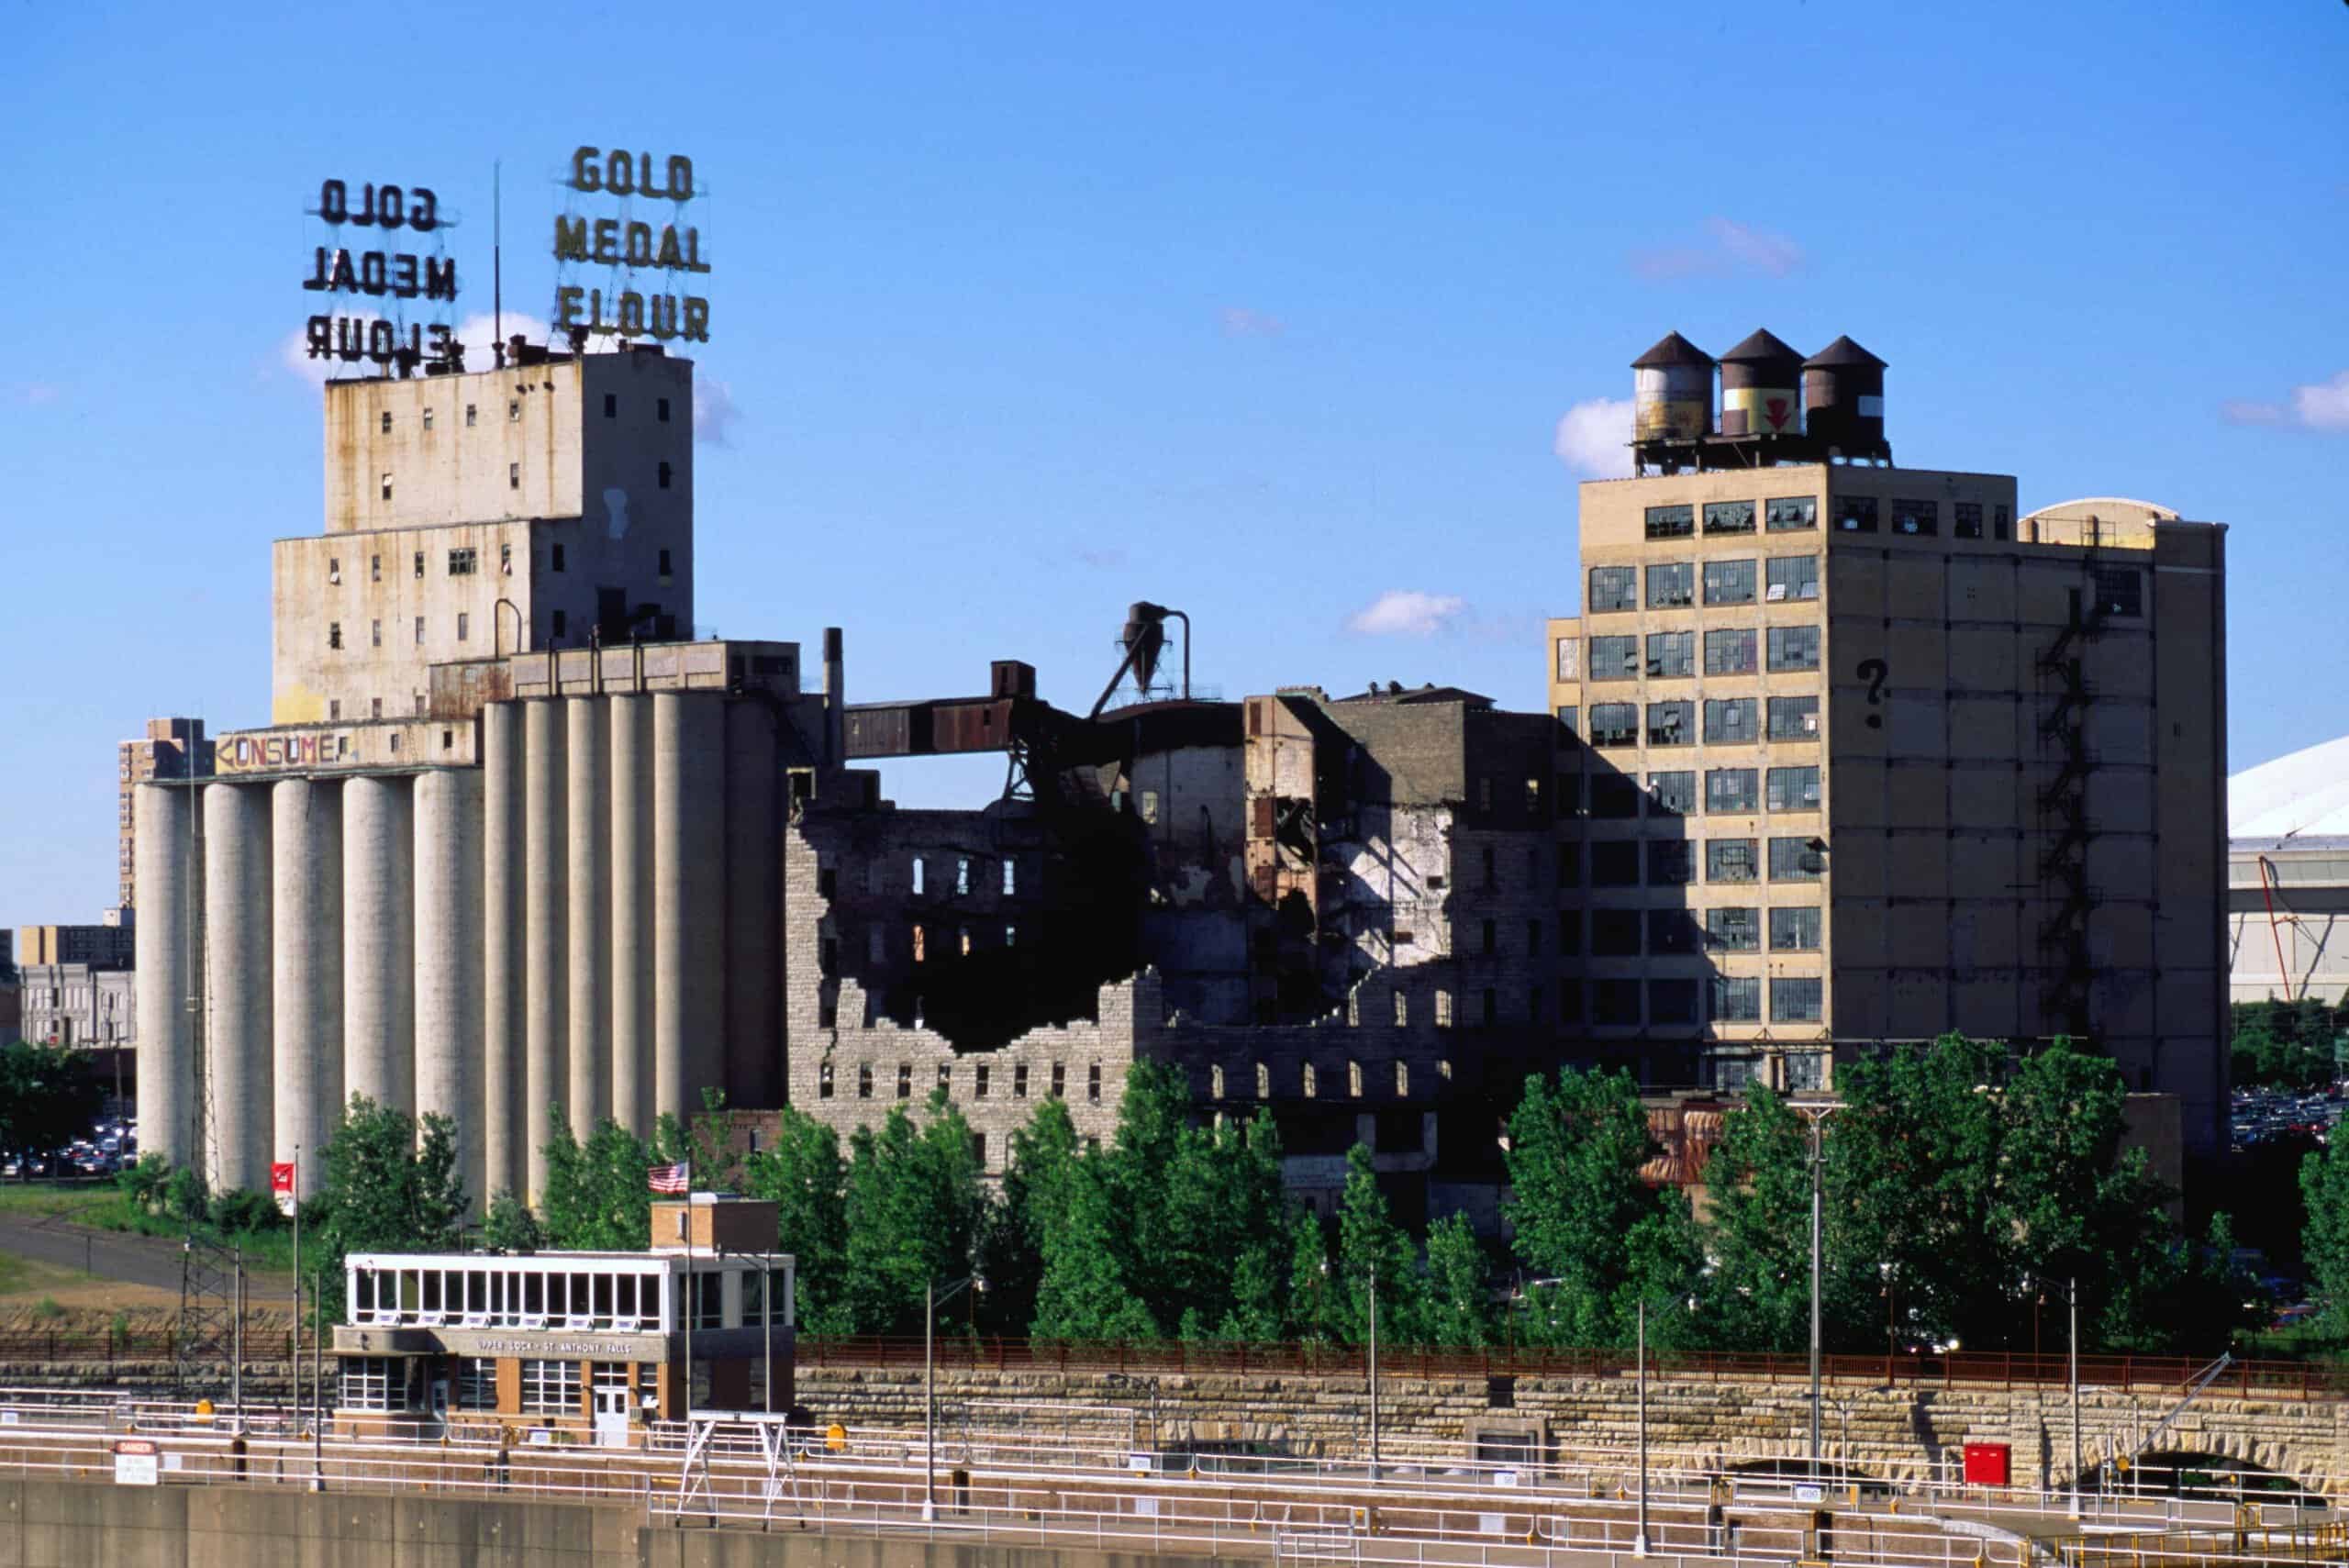
- Median household income, 2022: $51,321 (Black); $100,582 (White)
- Homeownership rate, 2022: 29.9% (Black); 76.4% (White)
- Unemployment rate, 2022: 8.2% (Black); 3.3% (White)
- Black population, 2022: 320,181 (8.7% of total)
15. Niles, MI
- Median household income, 2022: $29,073 (Black); $67,707 (White)
- Homeownership rate, 2022: 38.3% (Black); 79.2% (White)
- Unemployment rate, 2022: 15.4% (Black); 5.0% (White)
- Black population, 2022: 21,433 (13.9% of total)
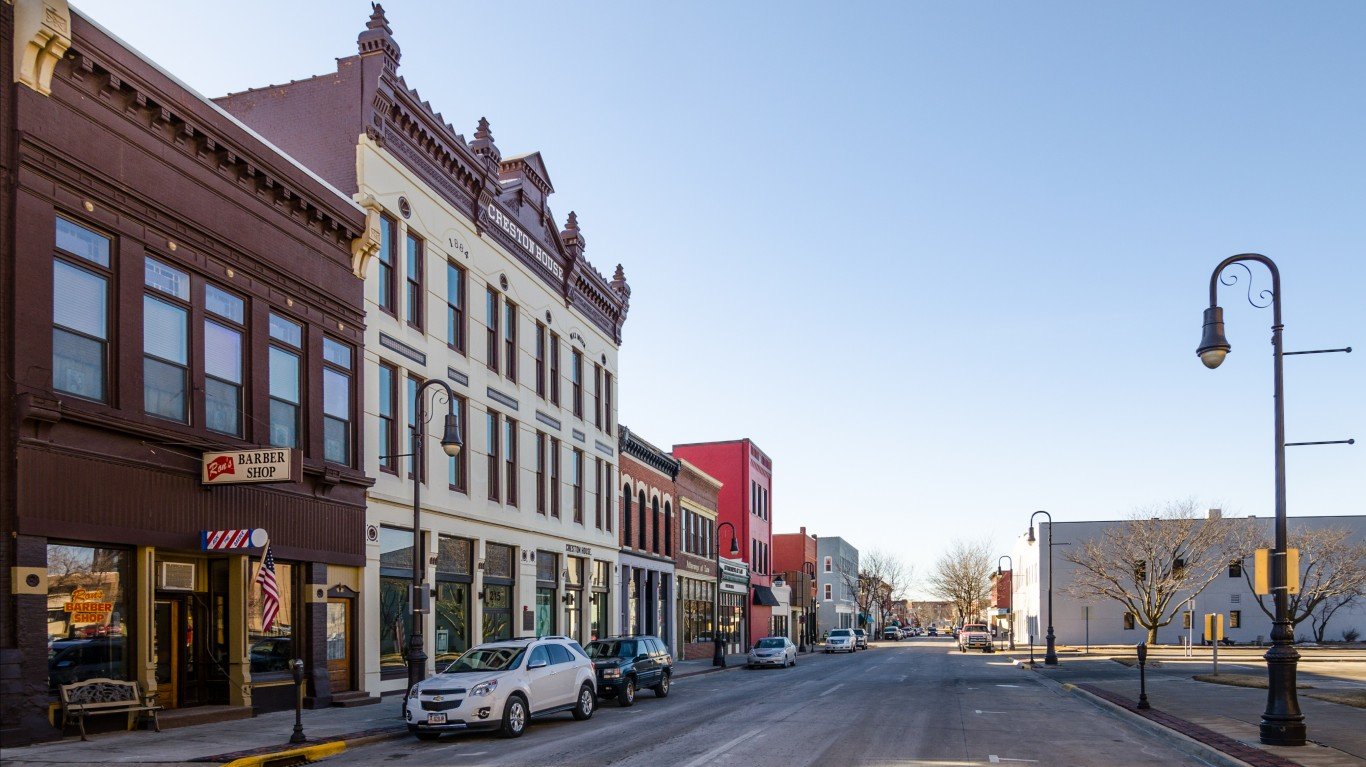
14. Des Moines-West Des Moines, IA
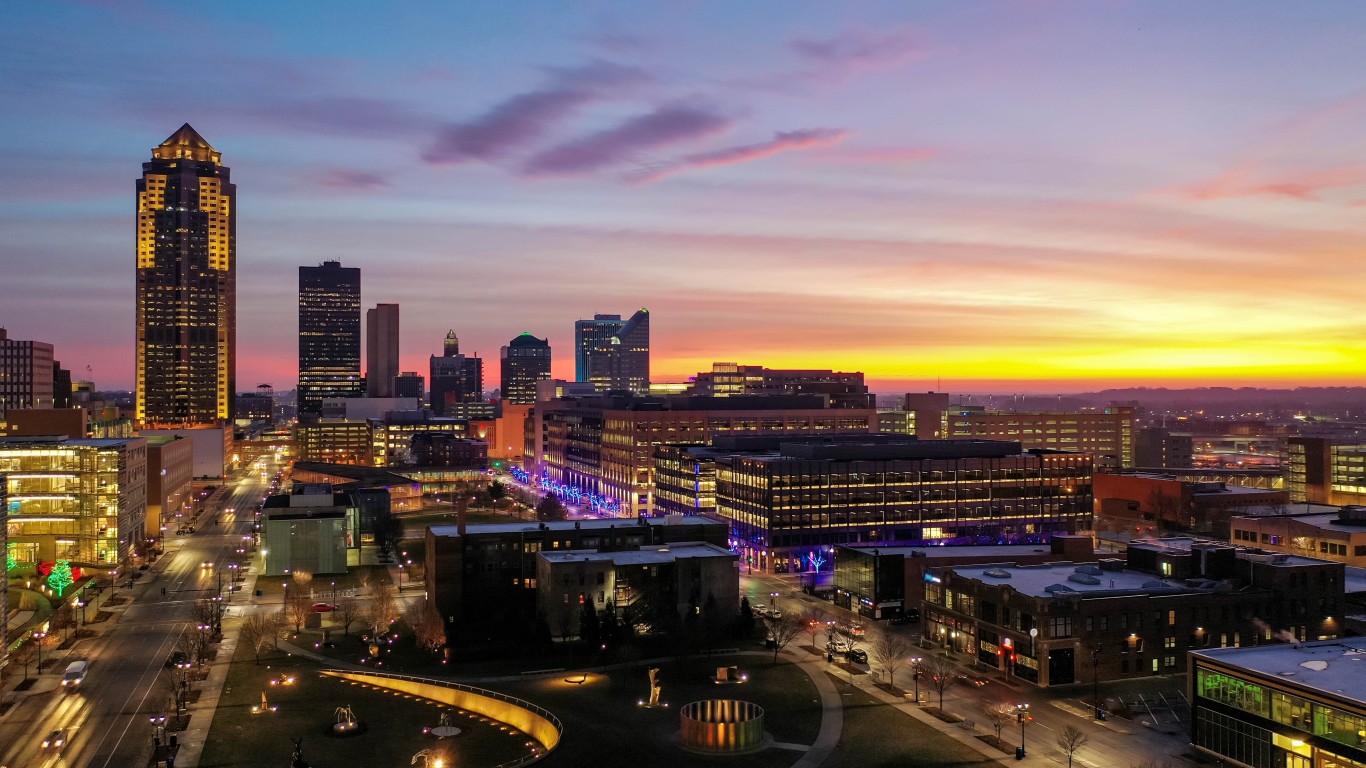
- Median household income, 2022: $45,529 (Black); $83,994 (White)
- Homeownership rate, 2022: 30.2% (Black); 73.0% (White)
- Unemployment rate, 2022: 8.9% (Black); 3.6% (White)
- Black population, 2022: 38,739 (5.4% of total)
13. Atlantic City-Hammonton, NJ
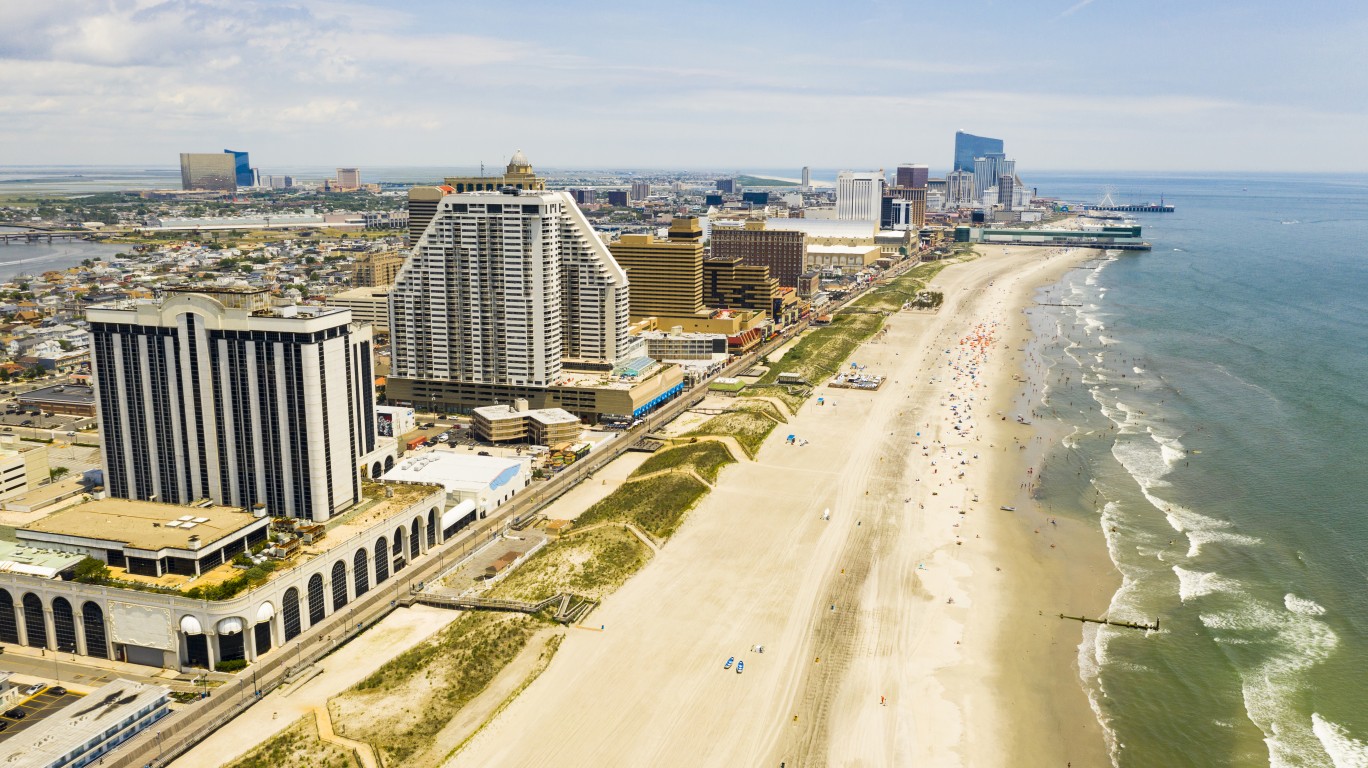
- Median household income, 2022: $49,658 (Black); $83,877 (White)
- Homeownership rate, 2022: 42.1% (Black); 76.8% (White)
- Unemployment rate, 2022: 11.3% (Black); 6.9% (White)
- Black population, 2022: 35,485 (12.9% of total)
12. Rochester, NY
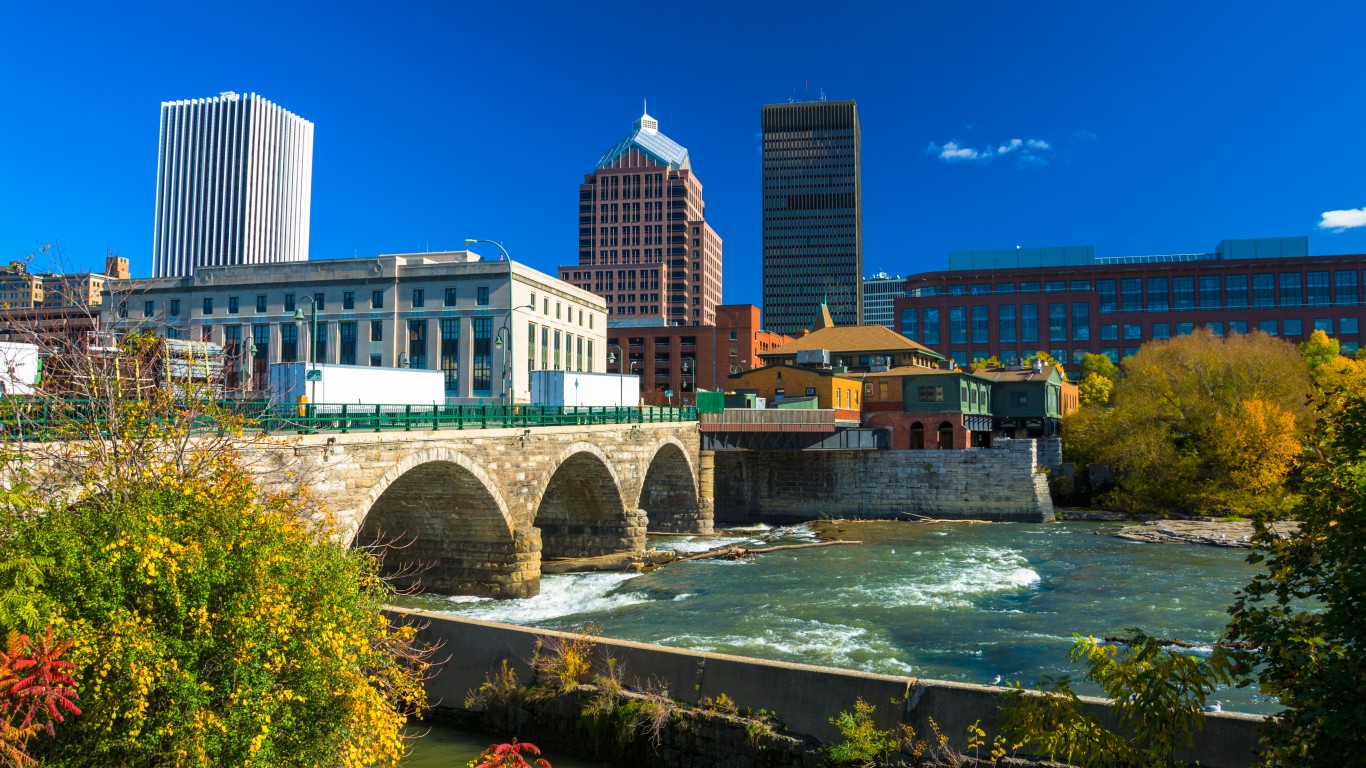
- Median household income, 2022: $40,670 (Black); $77,124 (White)
- Homeownership rate, 2022: 35.0% (Black); 73.3% (White)
- Unemployment rate, 2022: 10.7% (Black); 4.1% (White)
- Black population, 2022: 114,029 (10.5% of total)
11. Chicago-Naperville-Elgin, IL-IN-WI
- Median household income, 2022: $49,194 (Black); $97,568 (White)
- Homeownership rate, 2022: 41.6% (Black); 73.5% (White)
- Unemployment rate, 2022: 13.7% (Black); 4.8% (White)
- Black population, 2022: 1,522,030 (15.9% of total)
10. Syracuse, NY

- Median household income, 2022: $37,127 (Black); $74,176 (White)
- Homeownership rate, 2022: 30.2% (Black); 72.6% (White)
- Unemployment rate, 2022: 12.5% (Black); 5.3% (White)
- Black population, 2022: 51,468 (7.8% of total)
9. Davenport-Moline-Rock Island, IA-IL

- Median household income, 2022: $40,288 (Black); $71,697 (White)
- Homeownership rate, 2022: 30.9% (Black); 74.6% (White)
- Unemployment rate, 2022: 16.2% (Black); 4.0% (White)
- Black population, 2022: 27,796 (7.3% of total)
8. Waterloo-Cedar Falls, IA

- Median household income, 2022: $34,268 (Black); $70,413 (White)
- Homeownership rate, 2022: 31.7% (Black); 73.4% (White)
- Unemployment rate, 2022: 18.1% (Black); 3.4% (White)
- Black population, 2022: 12,996 (7.7% of total)
7. San Francisco-Oakland-Berkeley, CA

- Median household income, 2022: $70,119 (Black); $145,999 (White)
- Homeownership rate, 2022: 35.1% (Black); 60.0% (White)
- Unemployment rate, 2022: 9.2% (Black); 4.8% (White)
- Black population, 2022: 326,676 (7.0% of total)
6. Trenton-Princeton, NJ
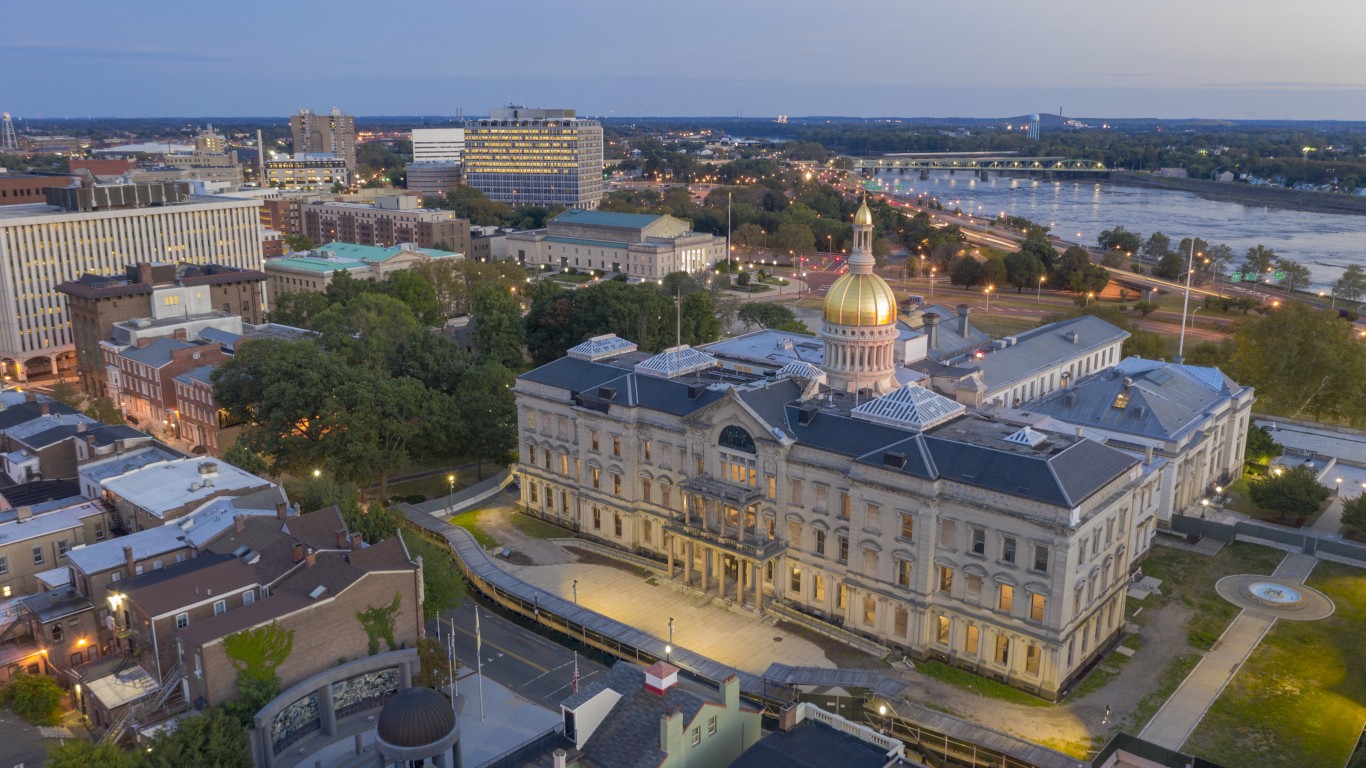
- Median household income, 2022: $56,828 (Black); $103,481 (White)
- Homeownership rate, 2022: 40.1% (Black); 71.7% (White)
- Unemployment rate, 2022: 10.0% (Black); 5.6% (White)
- Black population, 2022: 73,261 (19.1% of total)
5. Springfield, IL
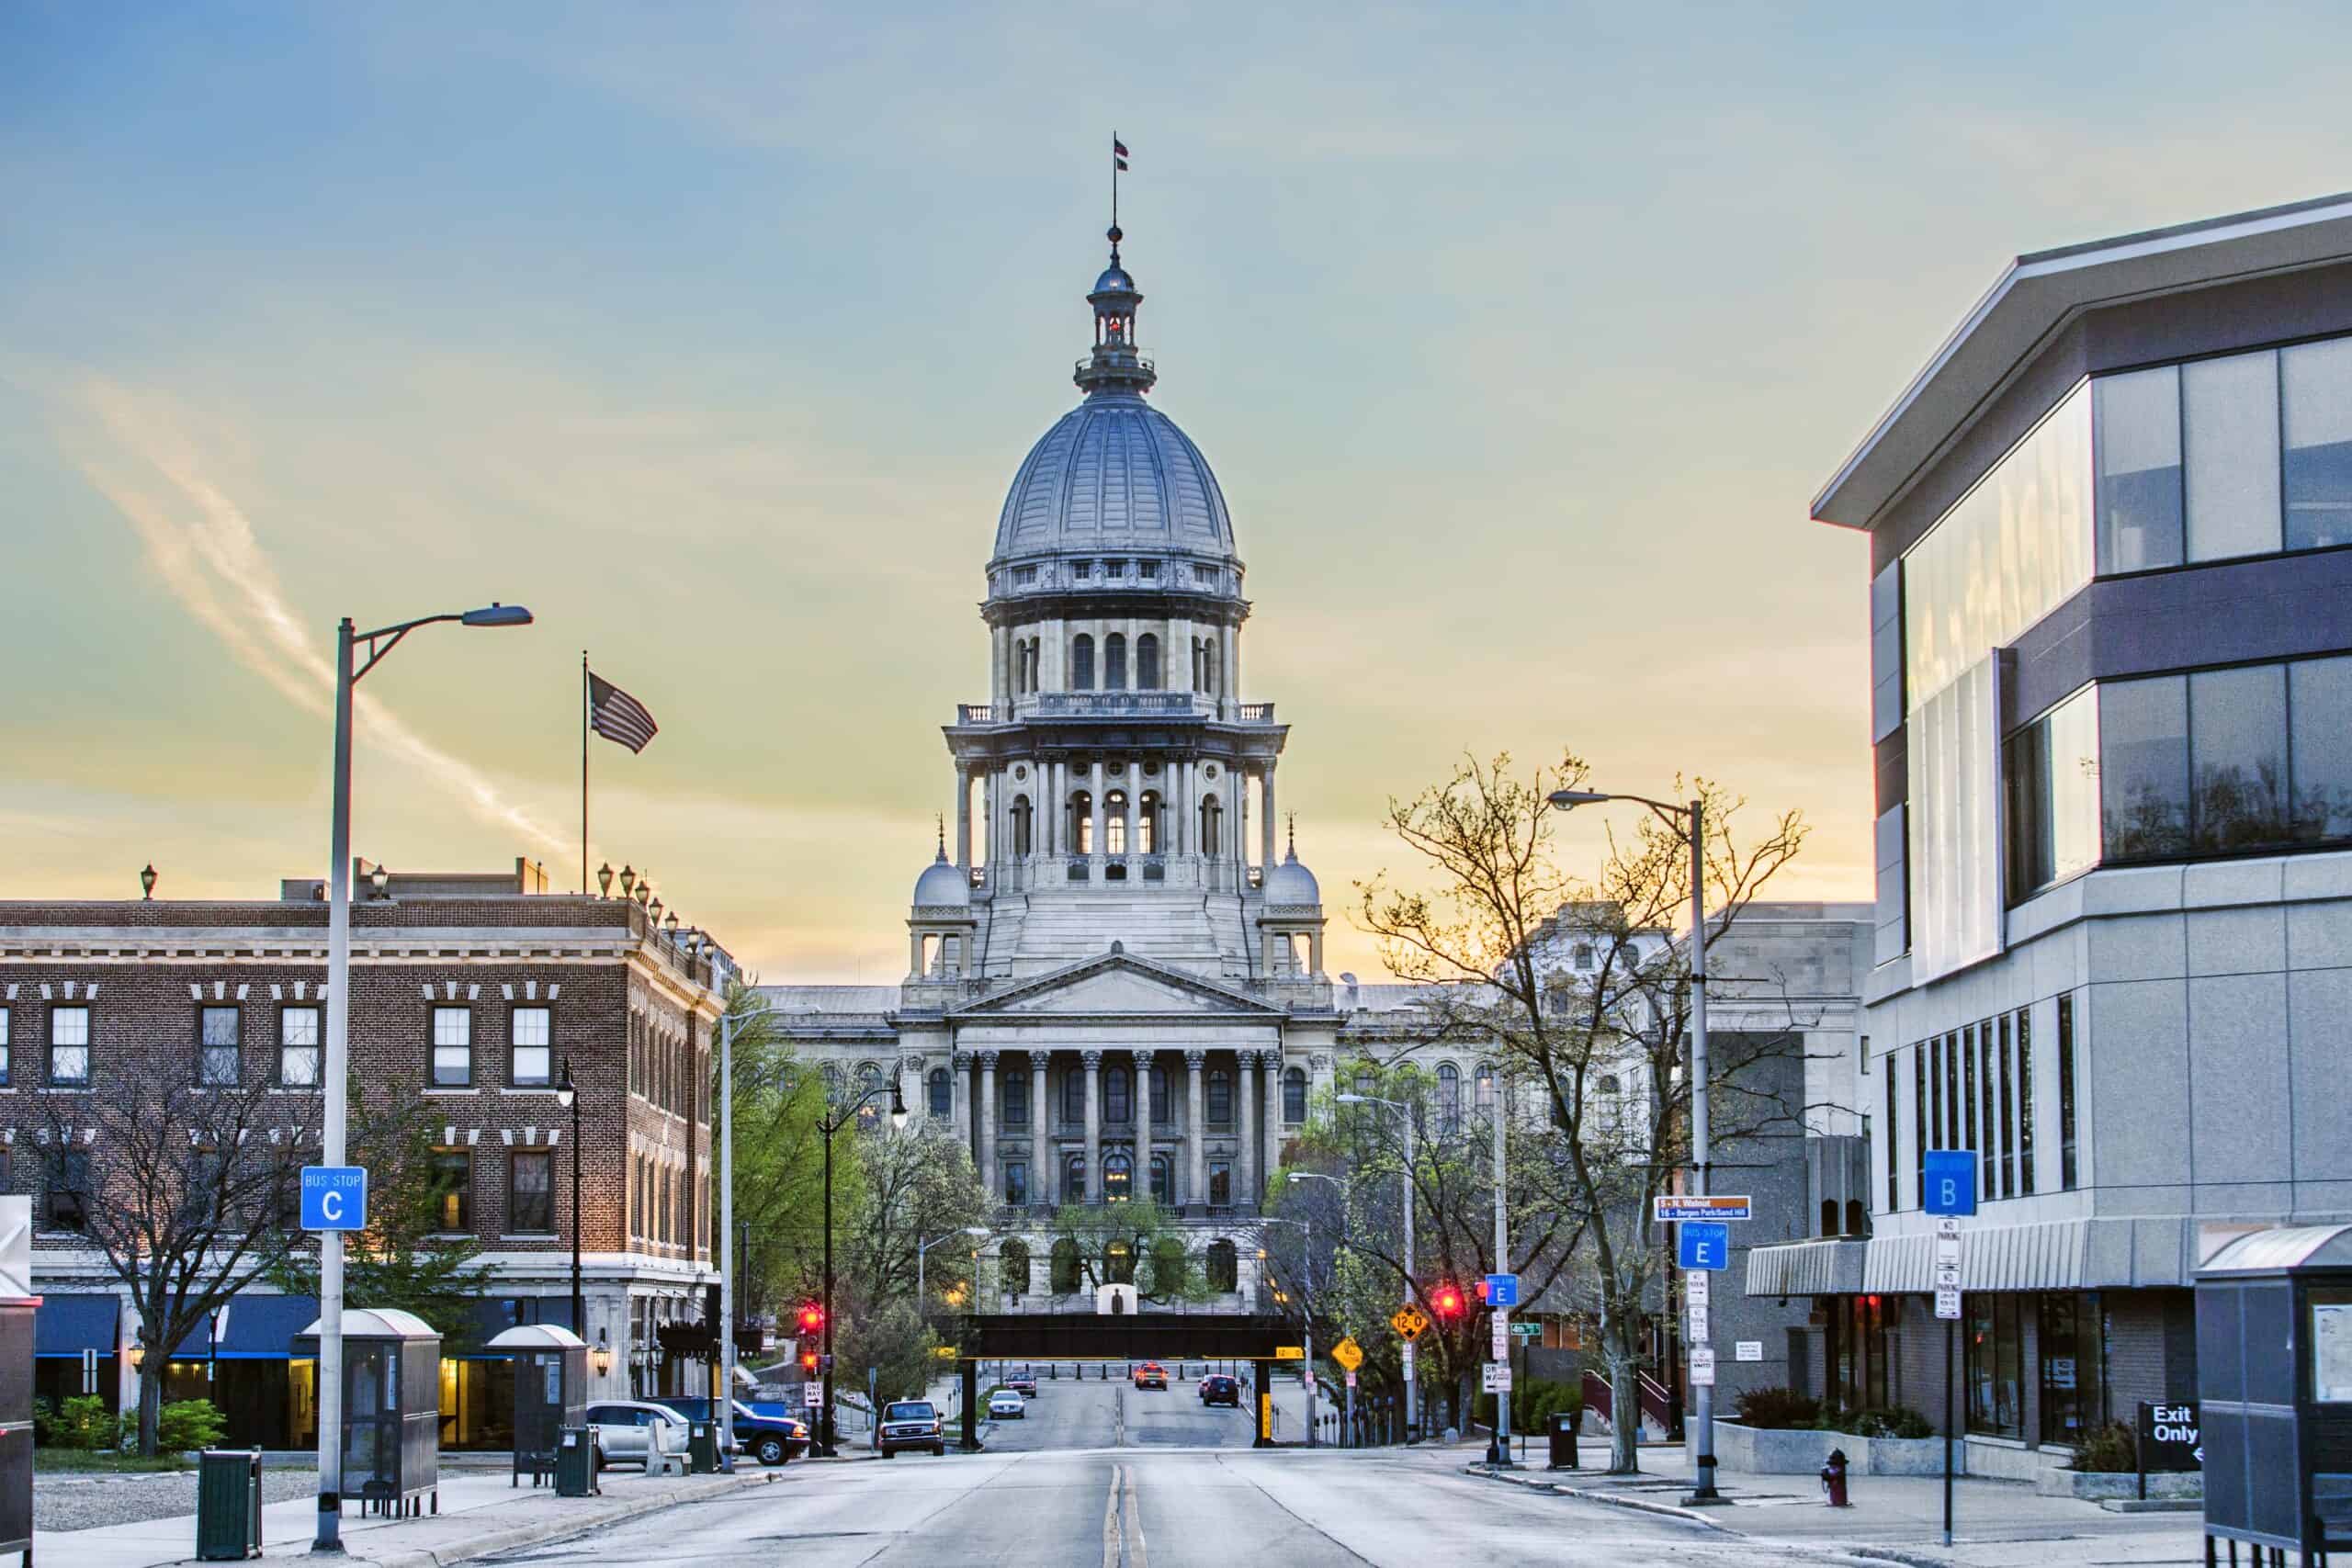
- Median household income, 2022: $29,482 (Black); $78,904 (White)
- Homeownership rate, 2022: 27.8% (Black); 77.3% (White)
- Unemployment rate, 2022: 15.8% (Black); 3.9% (White)
- Black population, 2022: 24,804 (11.9% of total)
4. Racine, WI
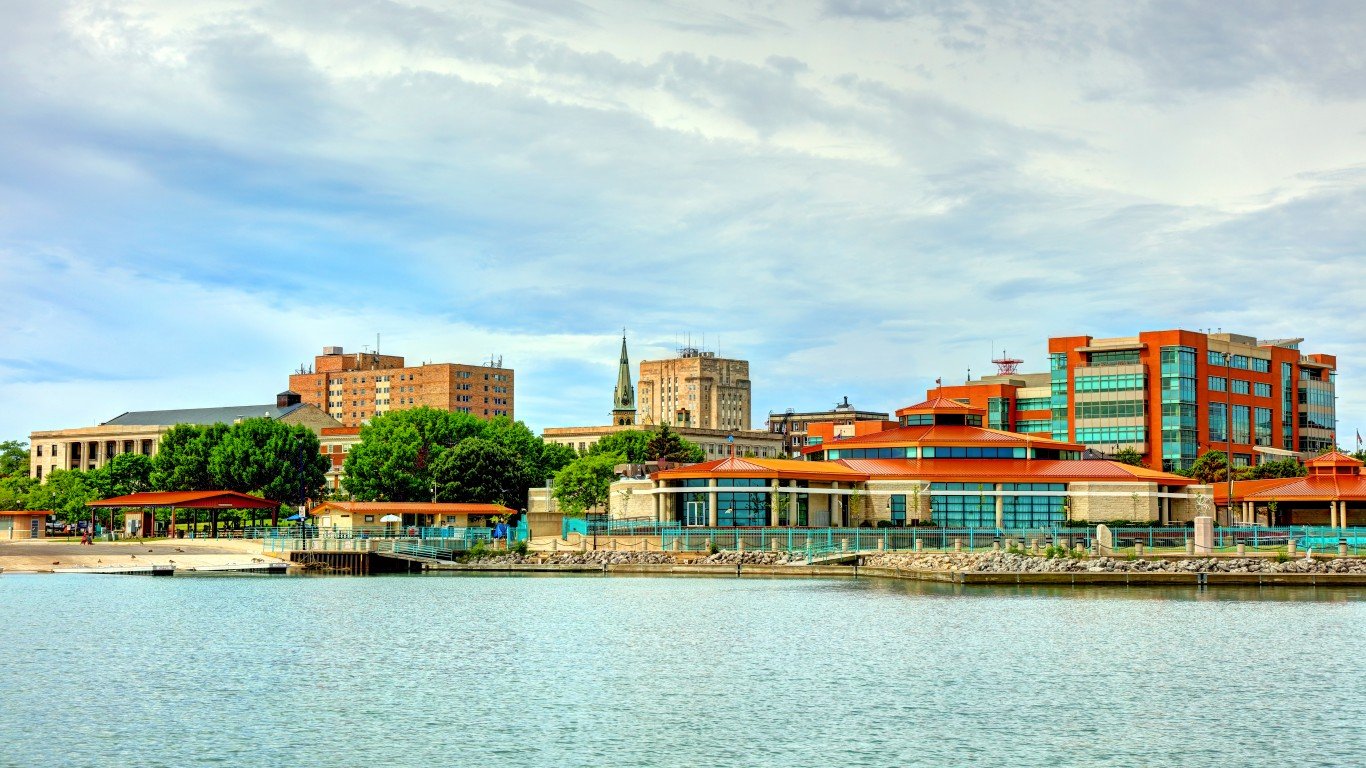
- Median household income, 2022: $41,458 (Black); $79,477 (White)
- Homeownership rate, 2022: 29.6% (Black); 76.3% (White)
- Unemployment rate, 2022: 7.6% (Black); 3.4% (White)
- Black population, 2022: 21,090 (10.7% of total)
3. Rochester, MN
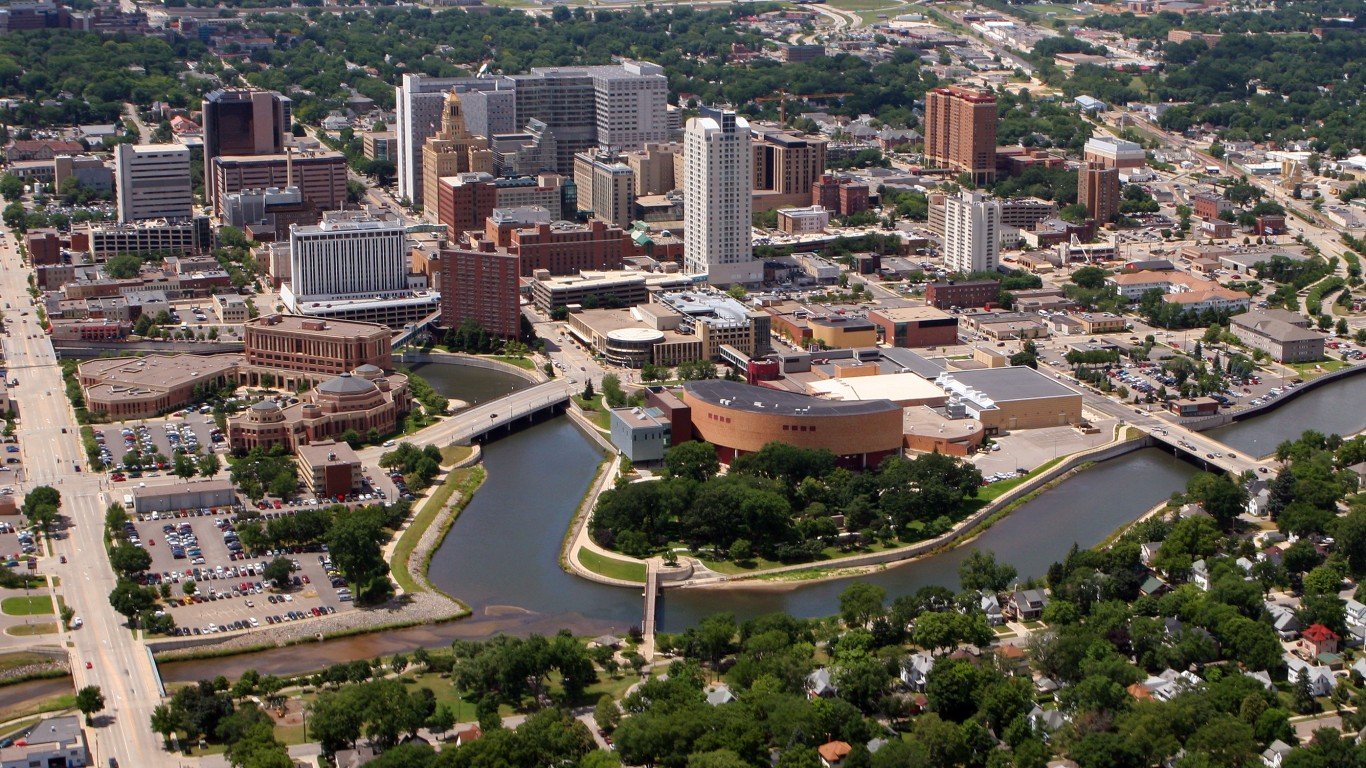
- Median household income, 2022: $38,617 (Black); $90,820 (White)
- Homeownership rate, 2022: 20.8% (Black); 78.1% (White)
- Unemployment rate, 2022: 9.2% (Black); 2.8% (White)
- Black population, 2022: 11,618 (5.1% of total)
2. St. Cloud, MN

- Median household income, 2022: $44,597 (Black); $76,223 (White)
- Homeownership rate, 2022: 11.5% (Black); 72.5% (White)
- Unemployment rate, 2022: 16.3% (Black); 3.6% (White)
- Black population, 2022: 15,003 (7.5% of total)
1. Milwaukee-Waukesha, WI

- Median household income, 2022: $37,182 (Black); $84,267 (White)
- Homeownership rate, 2022: 27.5% (Black); 69.0% (White)
- Unemployment rate, 2022: 8.5% (Black); 3.0% (White)
- Black population, 2022: 248,989 (15.9% of total)
The post Black Families Face the Steepest Barriers in These Cities appeared first on 24/7 Wall St..