


Avoid These States with the Highest Concentration of Hate Groups
In terms of Civil Rights, we’ve come a long way in America. Unfortunately, hate groups are far from eliminated. In Charlotte, NC, a hate crime investigation is underway, after an Audrey Kell student was left injured in a classroom fight on March 7. The victimized student, who had to undergo surgery to repair broken facial […] The post Avoid These States with the Highest Concentration of Hate Groups appeared first on 24/7 Wall St..
In terms of Civil Rights, we’ve come a long way in America. Unfortunately, hate groups are far from eliminated. In Charlotte, NC, a hate crime investigation is underway, after an Audrey Kell student was left injured in a classroom fight on March 7. The victimized student, who had to undergo surgery to repair broken facial bones, stated “(The other student) called me the ‘n-word’ and told me to go back to my country.”
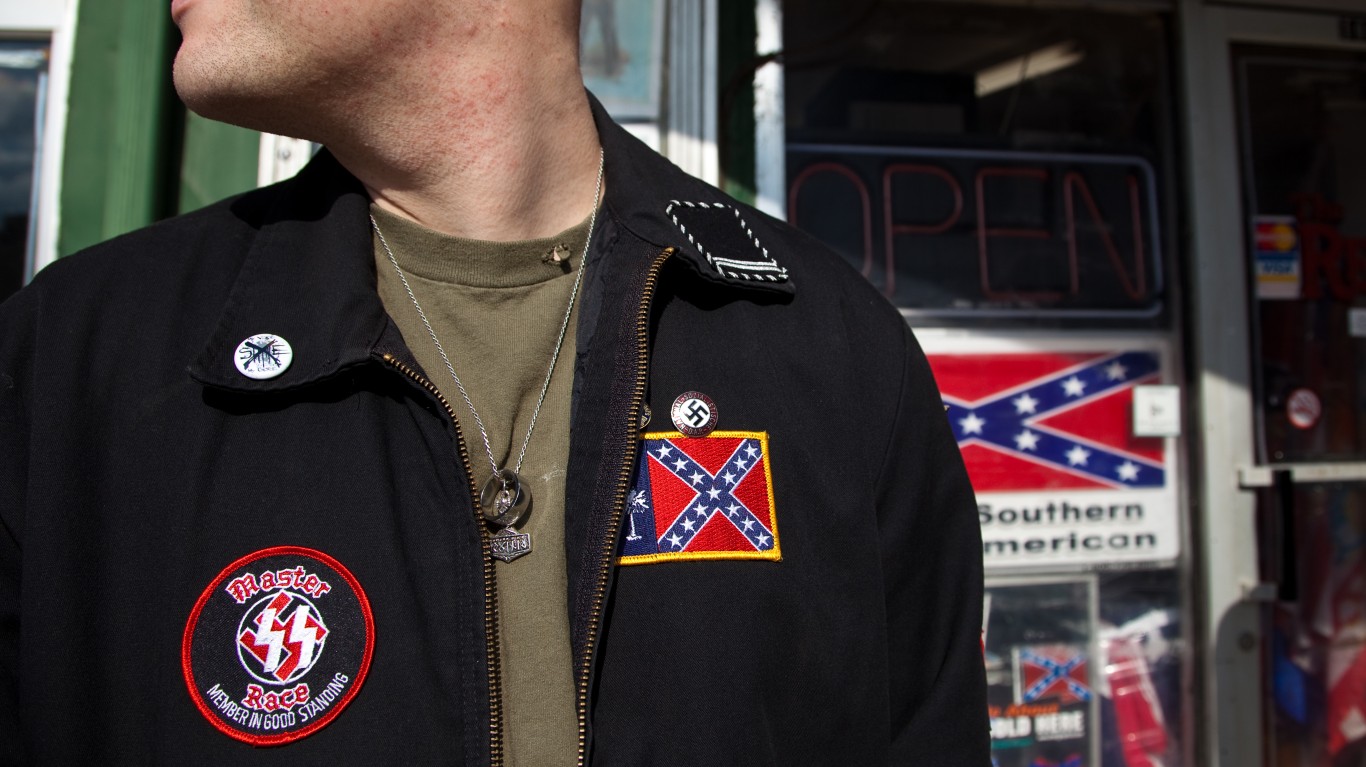
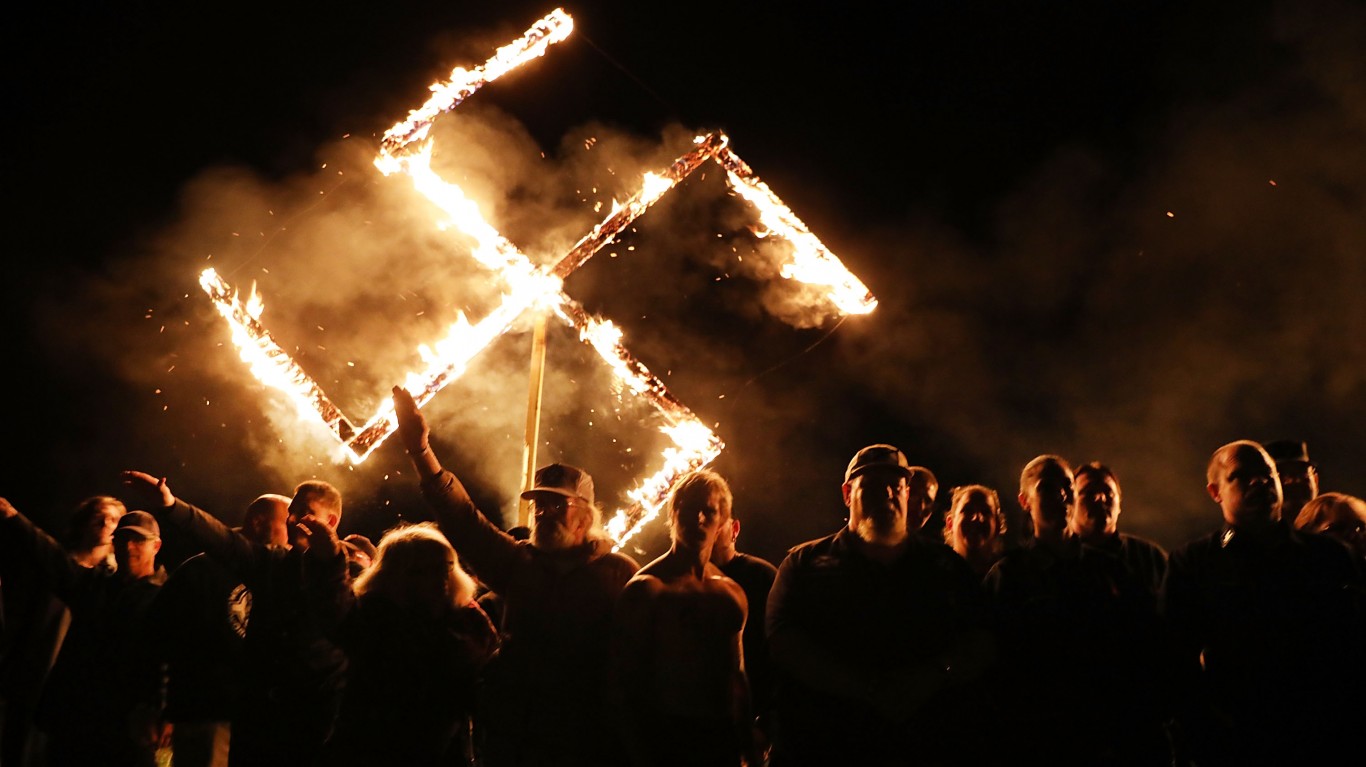
Hate crimes are rampant in the United States, with multiple groups dedicated to taking advantage of and undermining vulnerable populations. Groups such as the Proud Boys and the Ku Klux Klan primarily target Black Americans, while neo-Nazi groups like Aryan Nations and 14 First target Jews, as well as every minority under the sun.
To identify the states with the highest number of hate groups, including extremist anti-government groups, 24/7 Wall St. used data from the Southern Poverty Law Center report entitled The Year in Hate and Extremism 2022. The U.S. Census Bureau’s 2021 American Community Survey provided population data.
(This article was updated on March 12, 2025 to reflect recent hate crimes committed in America)
Why This Matters

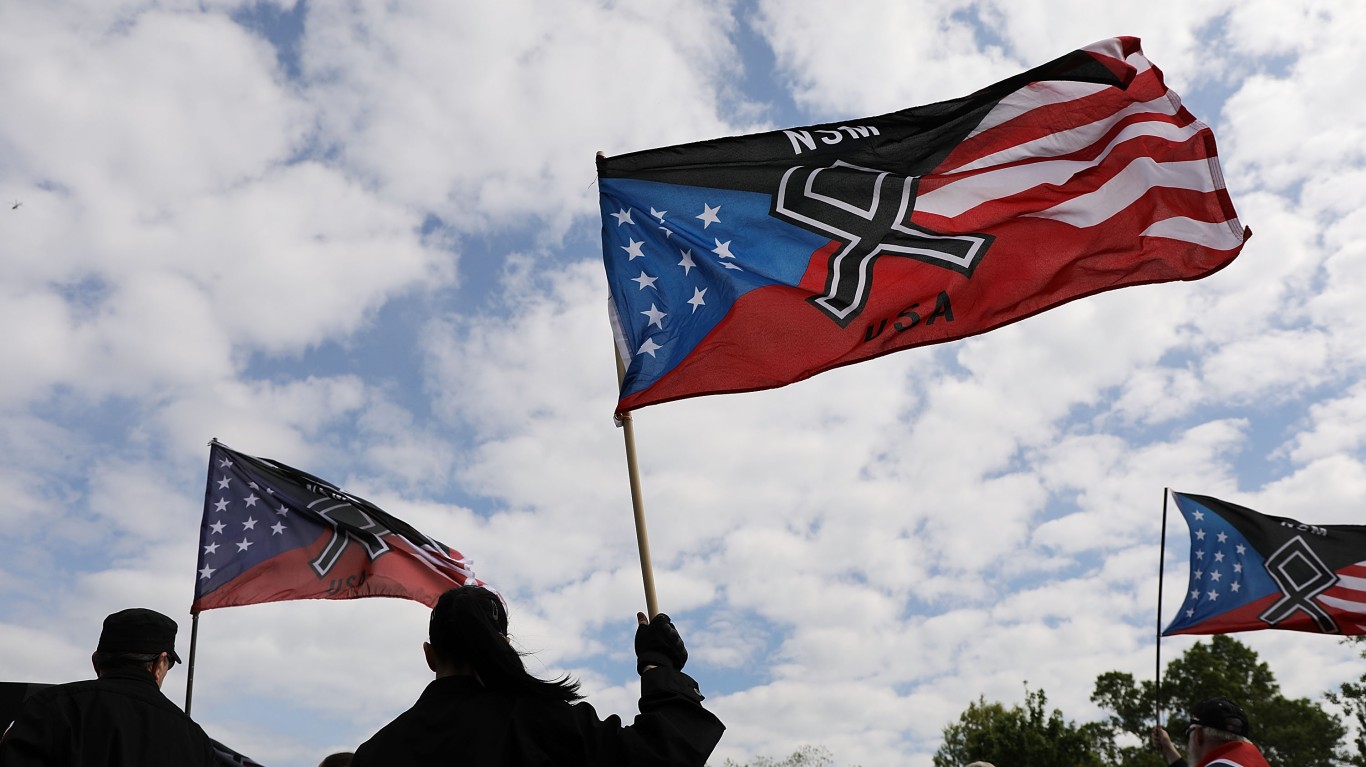
As we continue to evolve, both in the United States and worldwide, one might think hate groups are fading out. Unfortunately, this is not the case; hate groups in the U.S. and beyond continue to gain new members. These groups are made up of racially motivated individuals, anti-government radicals, and terrorist extremists. In fact, domestic terrorism acts, like the one on Bourbon Street at the start of 2025, have more than doubled in the last five years. Though not every person who engages in these types of hate crimes is linked to a designated group, the great majority of them are. With so much instability and polarization occurring in America, especially as we enter a new Trump presidency, 24/7 Wall St. thought it was important to take a look at the areas of the U.S. with the most violent hate groups. Whether traveling or going about your day-to-day life, it may be beneficial to maintain an awareness of the size of these hate groups throughout the nation.
Here are the U.S. states with the highest concentration of hate groups:
50. Louisiana

- Hate groups in 2022: 1.5 per million people (7 total)
- Hate groups in 2021: #10 most, with 3.2 per million people (15 total)
- Population: 4,624,047
- Most common ideologies: Anti-Government Movement (3), Neo-Confederate (1)
- State demographic makeup: 56.9% white; 31.0% Black; 4.3% foreign-born
49. Massachusetts

- Hate groups in 2022: 1.6 per million people (11 total)
- Hate groups in 2021: #34 most, with 2.0 per million people (14 total)
- Population: 6,984,723
- Most common ideologies: Anti-Government Movement (6), Anti-LGBTQ (2), White Nationalist (1)
- State demographic makeup: 67.5% white; 6.3% Black; 17.6% foreign-born
48. Kansas

- Hate groups in 2022: 2 per million people (6 total)
- Hate groups in 2021: #46 most, with 1.4 per million people (4 total)
- Population: 2,934,582
- Most common ideologies: Anti-Government Movement (3), White Nationalist (1)
- State demographic makeup: 73.4% white; 5.1% Black; 6.9% foreign-born
47. Kentucky

- Hate groups in 2022: 2 per million people (9 total)
- Hate groups in 2021: #35 most, with 2.0 per million people (9 total)
- Population: 4,509,394
- Most common ideologies: Anti-Government Movement (3), General Hate (2), Neo-Völkisch (1)
- State demographic makeup: 82.7% white; 7.1% Black; 4.0% foreign-born
46. Georgia
- Hate groups in 2022: 2.2 per million people (24 total)
- Hate groups in 2021: #31 most, with 2.2 per million people (24 total)
- Population: 10,799,566
- Most common ideologies: Anti-Government Movement (13), White Nationalist (3), Anti-LGBTQ (2)
- State demographic makeup: 50.2% white; 30.4% Black; 10.0% foreign-born
45. Texas

- Hate groups in 2022: 2.4 per million people (72 total)
- Hate groups in 2021: #41 most, with 1.8 per million people (52 total)
- Population: 29,527,941
- Most common ideologies: Anti-Government Movement (39), General Hate (10), Anti-LGBTQ (5)
- State demographic makeup: 39.4% white; 11.6% Black; 17.2% foreign-born
44. Mississippi
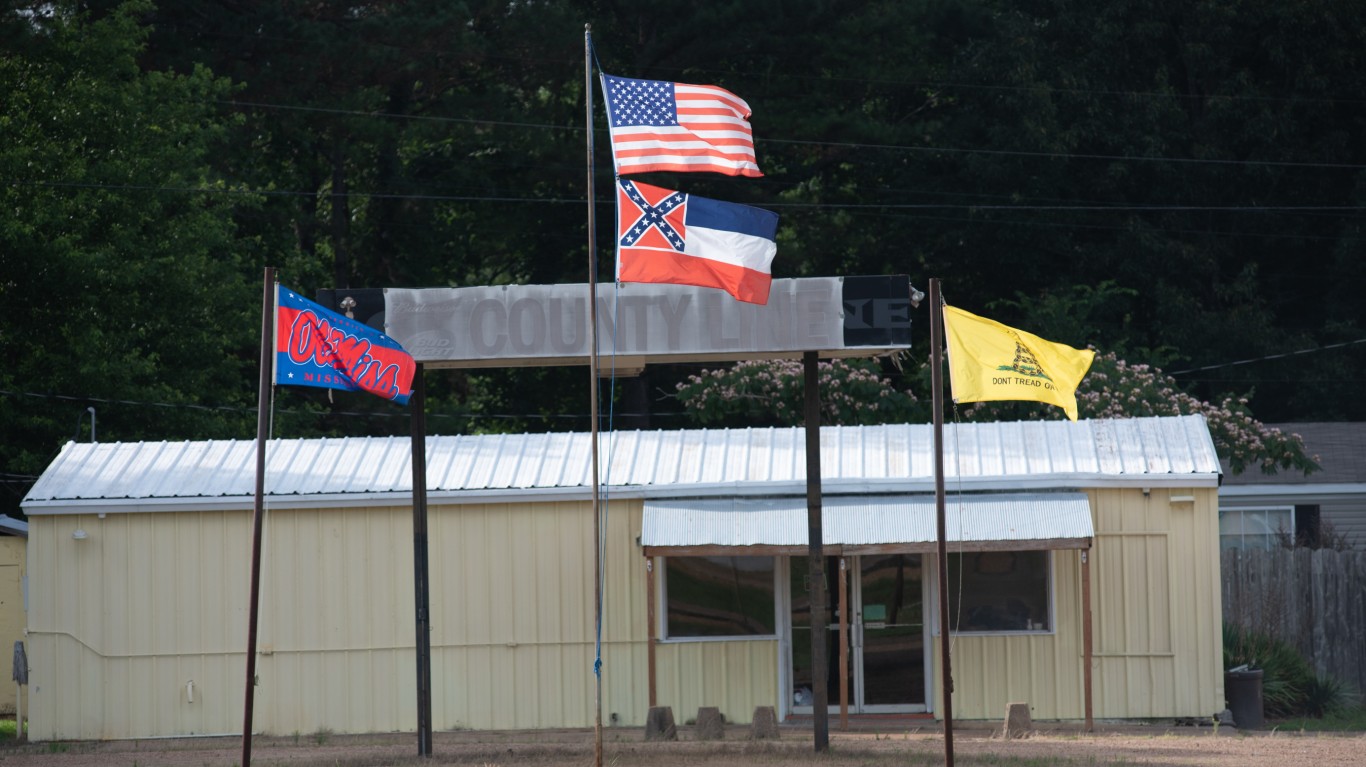
- Hate groups in 2022: 2.4 per million people (7 total)
- Hate groups in 2021: #21 most, with 2.7 per million people (8 total)
- Population: 2,949,965
- Most common ideologies: Anti-Government Movement (4), White Nationalist (1)
- State demographic makeup: 55.4% white; 36.0% Black; 2.1% foreign-born
43. New Jersey

- Hate groups in 2022: 2.4 per million people (22 total)
- Hate groups in 2021: #47 most, with 1.3 per million people (12 total)
- Population: 9,267,130
- Most common ideologies: Anti-Government Movement (16), White Nationalist (2), Anti-Immigrant (1)
- State demographic makeup: 52.1% white; 12.3% Black; 23.0% foreign-born
42. New Mexico

- Hate groups in 2022: 2.4 per million people (5 total)
- Hate groups in 2021: #50 most, with 0.5 per million people (1 total)
- Population: 2,115,877
- Most common ideologies: Anti-Government Movement (4), White Nationalist (1)
- State demographic makeup: 34.9% white; 1.7% Black; 9.1% foreign-born
41. California

- Hate groups in 2022: 2.6 per million people (103 total)
- Hate groups in 2021: #43 most, with 1.7 per million people (65 total)
- Population: 39,237,836
- Most common ideologies: Anti-Government Movement (57), General Hate (15), Anti-Muslim (8)
- State demographic makeup: 34.3% white; 5.3% Black; 26.6% foreign-born
40. Alabama
- Hate groups in 2022: 2.6 per million people (13 total)
- Hate groups in 2021: #24 most, with 2.6 per million people (13 total)
- Population: 5,039,877
- Most common ideologies: Anti-Government Movement (8), Neo-Confederate (2)
- State demographic makeup: 64.2% white; 25.8% Black; 3.5% foreign-born
39. New York

- Hate groups in 2022: 2.7 per million people (53 total)
- Hate groups in 2021: #40 most, with 1.8 per million people (35 total)
- Population: 19,835,913
- Most common ideologies: Anti-Government Movement (25), General Hate (12), White Nationalist (4)
- State demographic makeup: 53.5% white; 13.4% Black; 22.3% foreign-born
38. Illinois

- Hate groups in 2022: 2.8 per million people (35 total)
- Hate groups in 2021: #37 most, with 1.8 per million people (23 total)
- Population: 12,671,469
- Most common ideologies: Anti-Government Movement (17), Anti-LGBTQ (4)
- State demographic makeup: 58.9% white; 13.4% Black; 14.2% foreign-born
37. Michigan

- Hate groups in 2022: 2.9 per million people (29 total)
- Hate groups in 2021: #38 most, with 1.8 per million people (18 total)
- Population: 10,050,811
- Most common ideologies: Anti-Government Movement (19), White Nationalist (3)
- State demographic makeup: 72.9% white; 13.2% Black; 6.8% foreign-born
36. Connecticut

- Hate groups in 2022: 3.1 per million people (11 total)
- Hate groups in 2021: #36 most, with 1.9 per million people (7 total)
- Population: 3,605,597
- Most common ideologies: Anti-Government Movement (7), White Nationalist (1)
- State demographic makeup: 62.7% white; 9.9% Black; 15.2% foreign-born
35. Oklahoma

- Hate groups in 2022: 3.3 per million people (13 total)
- Hate groups in 2021: #30 most, with 2.3 per million people (9 total)
- Population: 3,986,639
- Most common ideologies: Anti-Government Movement (9), Neo-Völkisch (1)
- State demographic makeup: 62.8% white; 6.7% Black; 5.8% foreign-born
34. Minnesota

- Hate groups in 2022: 3.3 per million people (19 total)
- Hate groups in 2021: #44 most, with 1.6 per million people (9 total)
- Population: 5,707,390
- Most common ideologies: Anti-Government Movement (11), Neo-Völkisch (2)
- State demographic makeup: 76.9% white; 6.7% Black; 8.5% foreign-born
33. Wisconsin
 Aerial view of Madison city downtown at sunset, Wisconsin
- Hate groups in 2022: 3.6 per million people (21 total)
- Hate groups in 2021: #33 most, with 2.0 per million people (12 total)
- Population: 5,895,908
- Most common ideologies: Anti-Government Movement (13), Neo-Völkisch (2)
- State demographic makeup: 79.0% white; 6.1% Black; 5.1% foreign-born
32. Missouri
- Hate groups in 2022: 3.6 per million people (22 total)
- Hate groups in 2021: #19 most, with 2.8 per million people (17 total)
- Population: 6,168,187
- Most common ideologies: Anti-Government Movement (12), General Hate (4), White Nationalist (2)
- State demographic makeup: 76.6% white; 10.7% Black; 4.1% foreign-born
31. Washington

- Hate groups in 2022: 3.7 per million people (29 total)
- Hate groups in 2021: #25 most, with 2.5 per million people (19 total)
- Population: 7,738,692
- Most common ideologies: Anti-Government Movement (13), Anti-LGBTQ (3)
- State demographic makeup: 64.3% white; 3.9% Black; 14.8% foreign-born
30. Nevada
- Hate groups in 2022: 3.8 per million people (12 total)
- Hate groups in 2021: #17 most, with 2.9 per million people (9 total)
- Population: 3,143,991
- Most common ideologies: Anti-Government Movement (6), General Hate (2), Neo-Völkisch (1)
- State demographic makeup: 45.2% white; 8.7% Black; 18.4% foreign-born
29. Iowa

- Hate groups in 2022: 3.8 per million people (12 total)
- Hate groups in 2021: #48 most, with 0.6 per million people (2 total)
- Population: 3,193,079
- Most common ideologies: Anti-Government Movement (10), White Nationalist (1)
- State demographic makeup: 83.0% white; 3.5% Black; 5.4% foreign-born
28. Florida

- Hate groups in 2022: 4.1 per million people (89 total)
- Hate groups in 2021: #26 most, with 2.4 per million people (53 total)
- Population: 21,781,128
- Most common ideologies: Anti-Government Movement (54), General Hate (11), Anti-LGBTQ (6)
- State demographic makeup: 51.1% white; 14.6% Black; 21.2% foreign-born
27. North Carolina

- Hate groups in 2022: 4.1 per million people (43 total)
- Hate groups in 2021: #22 most, with 2.7 per million people (28 total)
- Population: 10,551,162
- Most common ideologies: Anti-Government Movement (27), General Hate (5), Neo-Confederate (3)
- State demographic makeup: 60.9% white; 19.9% Black; 8.2% foreign-born
26. Maryland

- Hate groups in 2022: 4.1 per million people (25 total)
- Hate groups in 2021: #39 most, with 1.8 per million people (11 total)
- Population: 6,165,129
- Most common ideologies: Anti Government Movement (15), General Hate (4), Neo-Confederate (1)
- State demographic makeup: 47.8% white; 29.0% Black; 15.9% foreign-born
25. Indiana

- Hate groups in 2022: 4.3 per million people (29 total)
- Hate groups in 2021: #32 most, with 2.1 per million people (14 total)
- Population: 6,805,985
- Most common ideologies: Anti-Government Movement (16), White Nationalist (3), Neo-Völkisch (2)
- State demographic makeup: 76.6% white; 8.7% Black; 5.6% foreign-born
24. Vermont

- Hate groups in 2022: 4.6 per million people (3 total)
- Hate groups in 2021: #12 most, with 3.1 per million people (2 total)
- Population: 645,570
- Most common ideologies: Anti-Government Movement (2), White Nationalist (1), Neo-Völkisch(0)
- State demographic makeup: 90.6% white; 1.0% Black; 4.2% foreign-born
23. Ohio

- Hate groups in 2022: 4.7 per million people (55 total)
- Hate groups in 2021: #42 most, with 1.7 per million people (20 total)
- Population: 11,780,017
- Most common ideologies: Anti-Government Movement (35), Anti-LGBTQ (4)
- State demographic makeup: 76.6% white; 11.8% Black; 5.0% foreign-born
22. Tennessee

- Hate groups in 2022: 4.7 per million people (33 total)
- Hate groups in 2021: #4 most, with 4.0 per million people (28 total)
- Population: 6,975,218
- Most common ideologies: Anti-Government Movement (12), White Nationalist (4), Neo-Nazi (3)
- State demographic makeup: 72.1% white; 15.4% Black; 5.3% foreign-born
21. Virginia

- Hate groups in 2022: 5 per million people (43 total)
- Hate groups in 2021: #28 most, with 2.3 per million people (20 total)
- Population: 8,642,274
- Most common ideologies: Anti-Government Movement (28), White Nationalist (5), General Hate (3)
- State demographic makeup: 59.2% white; 18.0% Black; 12.4% foreign-born
20. West Virginia

- Hate groups in 2022: 5 per million people (9 total)
- Hate groups in 2021: #8 most, with 3.4 per million people (6 total)
- Population: 1,782,959
- Most common ideologies: Anti-Government Movement (3), Anti-Government Movement (3), Neo-Völkisch (1)
- State demographic makeup: 90.4% white; 2.8% Black; 1.6% foreign-born
19. Colorado

- Hate groups in 2022: 5.3 per million people (31 total)
- Hate groups in 2021: #13 most, with 3.1 per million people (18 total)
- Population: 5,812,069
- Most common ideologies: Anti-Government Movement (17), Anti-LGBTQ (4)
- State demographic makeup: 65.2% white; 3.7% Black; 9.8% foreign-born
18. Arkansas

- Hate groups in 2022: 5.3 per million people (16 total)
- Hate groups in 2021: #15 most, with 3.0 per million people (9 total)
- Population: 3,025,891
- Most common ideologies: Anti-Government Movement (9), White Nationalist (3), Neo-Völkisch (1)
- State demographic makeup: 68.2% white; 14.7% Black; 4.7% foreign-born
17. Arizona

- Hate groups in 2022: 5.4 per million people (39 total)
- Hate groups in 2021: #14 most, with 3.0 per million people (22 total)
- Population: 7,276,316
- Most common ideologies: Anti-Government Movement (21), Anti-LGBTQ (5), White Nationalist (4)
- State demographic makeup: 52.0% white; 4.3% Black; 12.6% foreign-born
16. Utah
- Hate groups in 2022: 5.4 per million people (18 total)
- Hate groups in 2021: #49 most, with 0.6 per million people (2 total)
- Population: 3,337,975
- Most common ideologies: Anti-Government Movement (16), White Nationalist (1)
- State demographic makeup: 76.0% white; 1.0% Black; 8.3% foreign-born
15. Alaska

- Hate groups in 2022: 5.5 per million people (4 total)
- Hate groups in 2021: #45 most, with 1.4 per million people (1 total)
- Population: 732,673
- Most common ideologies: Anti-Government Movement (3), Neo-Völkisch (1)
- State demographic makeup: 57.9% white; 2.9% Black; 8.1% foreign-born
14. Hawaii

- Hate groups in 2022: 5.5 per million people (8 total)
- Hate groups in 2021: #18 most, with 2.8 per million people (4 total)
- Population: 1,441,553
- Most common ideologies: Anti-Government Movement (6), Neo-Nazi (1), State demographic makeup: 20.8% white; 1.8% Black; 18.8% foreign-born
13. Pennsylvania

- Hate groups in 2022: 5.6 per million people (72 total)
- Hate groups in 2021: #29 most, with 2.3 per million people (30 total)
- Population: 12,964,056
- Most common ideologies: Anti-Government Movement (51), White Nationalist (7), Neo-Nazi (3)
- State demographic makeup: 73.6% white; 10.2% Black; 7.2% foreign-born
12. Oregon

- Hate groups in 2022: 5.7 per million people (24 total)
- Hate groups in 2021: #27 most, with 2.4 per million people (10 total)
- Population: 4,246,155
- Most common ideologies: Anti-Government Movement (14), General Hate (4), White Nationalist (3)
- State demographic makeup: 72.0% white; 1.8% Black; 9.7% foreign-born
11. South Carolina

- Hate groups in 2022: 5.8 per million people (30 total)
- Hate groups in 2021: #9 most, with 3.3 per million people (17 total)
- Population: 5,190,705
- Most common ideologies: Anti-Government Movement (18), White Nationalist (5), Neo-Völkisch (2)
- State demographic makeup: 62.6% white; 24.9% Black; 5.2% foreign-born
10. Nebraska

- Hate groups in 2022: 6.1 per million people (12 total)
- Hate groups in 2021: #1 most, with 4.6 per million people (9 total)
- Population: 1,963,692
- Most common ideologies: Anti-Government Movement (4), Neo-Nazi (3), White Nationalist (1)
- State demographic makeup: 76.4% white; 4.6% Black; 7.4% foreign-born
9. Rhode Island

- Hate groups in 2022: 6.4 per million people (7 total)
- Hate groups in 2021: #20 most, with 2.7 per million people (3 total)
- Population: 1,095,610
- Most common ideologies: Anti-Government Movement (4), White Nationalist (1)
- State demographic makeup: 68.9% white; 4.5% Black; 14.5% foreign-born
8. Maine

- Hate groups in 2022: 6.6 per million people (9 total)
- Hate groups in 2021: #16 most, with 2.9 per million people (4 total)
- Population: 1,372,247
- Most common ideologies: Anti-Government Movement (4), White Nationalist (2), Neo-Völkisch (1)
- State demographic makeup: 90.0% white; 1.5% Black; 4.1% foreign-born
7. Delaware

- Hate groups in 2022: 7 per million people (7 total)
- Hate groups in 2021: #5 most, with 4.0 per million people (4 total)
- Population: 1,003,384
- Most common ideologies: Anti-Government Movement (5), White Nationalist (1)
- State demographic makeup: 59.3% white; 20.5% Black; 10.1% foreign-born
6. South Dakota

- Hate groups in 2022: 8.9 per million people (8 total)
- Hate groups in 2021: #2 most, with 4.5 per million people (4 total)
- Population: 895,376
- Most common ideologies: Anti-Government Movement (4), White Nationalist (2), Neo-Nazi (1)
- State demographic makeup: 80.0% white; 1.9% Black; 3.5% foreign-born
5. North Dakota

- Hate groups in 2022: 10.3 per million people (8 total)
- Hate groups in 2021: #23 most, with 2.6 per million people (2 total)
5. North Dakota (continued)

- Population: 774,948
- Most common ideologies: Anti-Government Movement (3), Neo-Völkisch (2), White Nationalist (1)
- State demographic makeup: 82.3% white; 2.9% Black; 4.4% foreign-born
4. New Hampshire

- Hate groups in 2022: 10.8 per million people (15 total)
- Hate groups in 2021: #3 most, with 4.3 per million people (6 total)
4. New Hampshire (continued)
- Population: 1,388,992
- Most common ideologies: Anti-Government Movement (8), White Nationalist (2)
- State demographic makeup: 87.3% white; 1.3% Black; 5.9% foreign-born
3. Montana

- Hate groups in 2022: 10.9 per million people (12 total)
- Hate groups in 2021: #6 most, with 3.6 per million people (4 total)
3. Montana (continued)
- Population: 1,104,271
- Most common ideologies: Anti-Government Movement (6), White Nationalist (2)
- State demographic makeup: 83.8% white; 0.5% Black; 2.2% foreign-born
2. Idaho

- Hate groups in 2022: 11 per million people (21 total)
- Hate groups in 2021: #11 most, with 3.2 per million people (6 total)
2. Idaho (continued)

- Population: 1,900,923
- Most common ideologies: Anti-Government Movement (12), General Hate (2), Neo-Völkisch (1)
- State demographic makeup: 78.7% white; 0.7% Black; 6.1% foreign-born
1. Wyoming

- Hate groups in 2022: 15.5 per million people (9 total)
- Hate groups in 2021: #7 most, with 3.5 per million people (2 total)
1. Wyoming (continued)

- Population: 578,803
- Most common ideologies: Anti-Government Movement (6), White Nationalist (1)
- State demographic makeup: 81.5% white; 1.0% Black; 3.4% foreign-born
The post Avoid These States with the Highest Concentration of Hate Groups appeared first on 24/7 Wall St..