


XRP bulls in ‘denial’ as price trend mirrors previous 75-90% crashes
XRP (XRP) has lost more than 40% since hitting a multi-year high near $3.40 in January, and onchain data suggests the downtrend could deepen in the weeks ahead.“Denial” preceding past 75-90% XRP crashes is backXRP’s Net Unrealized Profit/Loss (NUPL) data from Glassnode suggests the token may be heading for another extended downturn. The metric, which gauges the aggregate unrealized gains or losses of XRP holders, has historically served as a reliable barometer of potential trend reversals. In past market cycles, NUPL has peaked in the so-called “euphoria” zone just before major price tops. In 2018, XRP soared above $3.00 as NUPL signaled extreme optimism, only to collapse 90% to below $0.30 as sentiment deteriorated through “denial” and into “capitulation.” XRP NUPL historical performance chart. Source: GlassnodeA similar pattern played out in 2021 when XRP hit $1.96 before sliding 75% to $0.50 amid a sharp shift from euphoria to fear.As of March 2025, XRP’s NUPL has once again entered the “denial” zone, with the price trading around $2.50 following a strong rally. If the pattern holds, XRP could face further downsides akin to the bear markets in 2018 and 2021.XRP/USD weekly price chart. Source: TradingViewXRP now faces similar risks, trading sideways between $1.80 and $3.40, following a blistering 585% rally in just two months.The rally accelerated after pro-crypto candidate Donald Trump won the US presidential election, while speculation grew around Ripple’s potential victory in its SEC lawsuit and the possible approval of a spot XRP ETF in 2025.Related: SEC dropping XRP case was ‘priced in’ since Trump’s election: AnalystsAs a result of these supportive fundamentals, some traders said XRP’s ongoing consolidation may eventually lead to a breakout. That includes market analyst Stellar Babe, who anticipates XRP’s price to gain 450%. Technical fractal suggests XRP is topping out XRP’s weekly chart suggests a bearish fractal from 2021 may be unfolding again.In both 2021 and 2025, the XRP price formed a local top while the RSI printed a lower high, signaling bearish divergence and weakening upside momentum.XRP/USD weekly price chart. Source: TradingViewBack in 2021, that divergence preceded an 85.50% sell-off that broke below the 50-week (the red wave) and 200-week (the blue wave) exponential moving averages (EMA) supports.In 2025, XRP has again shown a similar RSI divergence, followed by a 40%-plus decline from its recent highs. It now risks an extended decline toward the 50-week EMA at around $1.58, down about 21.6% from the current price levels by June. If the correction deepens and breaks below the 50-week EMA support, history suggests XRP could slide further toward the 200-week EMA around $0.87, or about 60% from the current price levels.This article does not contain investment advice or recommendations. Every investment and trading move involves risk, and readers should conduct their own research when making a decision.

XRP (XRP) has lost more than 40% since hitting a multi-year high near $3.40 in January, and onchain data suggests the downtrend could deepen in the weeks ahead.
“Denial” preceding past 75-90% XRP crashes is back
XRP’s Net Unrealized Profit/Loss (NUPL) data from Glassnode suggests the token may be heading for another extended downturn.
The metric, which gauges the aggregate unrealized gains or losses of XRP holders, has historically served as a reliable barometer of potential trend reversals. In past market cycles, NUPL has peaked in the so-called “euphoria” zone just before major price tops.
In 2018, XRP soared above $3.00 as NUPL signaled extreme optimism, only to collapse 90% to below $0.30 as sentiment deteriorated through “denial” and into “capitulation.” XRP NUPL historical performance chart. Source: Glassnode

A similar pattern played out in 2021 when XRP hit $1.96 before sliding 75% to $0.50 amid a sharp shift from euphoria to fear.
As of March 2025, XRP’s NUPL has once again entered the “denial” zone, with the price trading around $2.50 following a strong rally. If the pattern holds, XRP could face further downsides akin to the bear markets in 2018 and 2021. XRP/USD weekly price chart. Source: TradingView

XRP now faces similar risks, trading sideways between $1.80 and $3.40, following a blistering 585% rally in just two months.
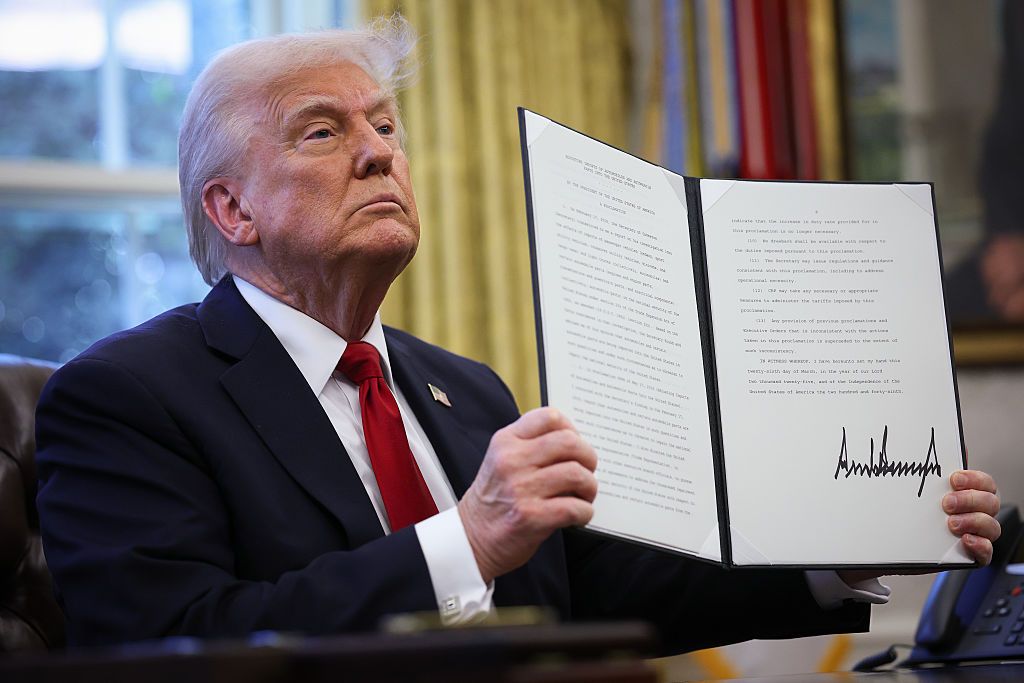
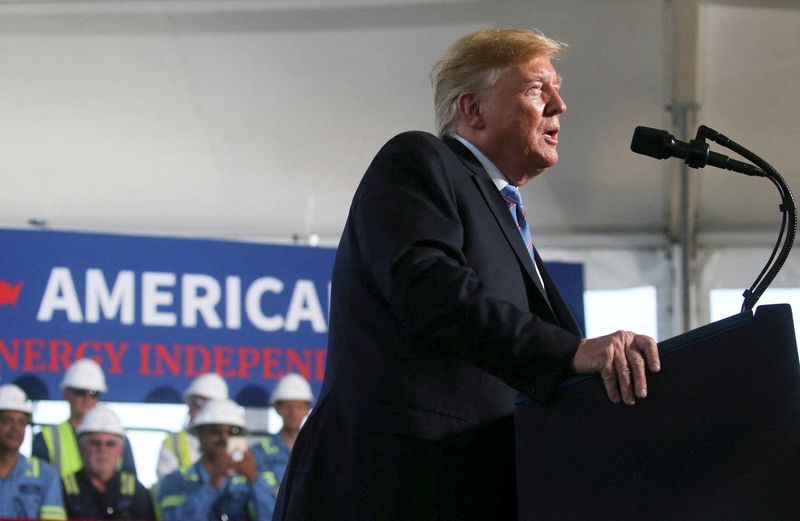
The rally accelerated after pro-crypto candidate Donald Trump won the US presidential election, while speculation grew around Ripple’s potential victory in its SEC lawsuit and the possible approval of a spot XRP ETF in 2025.
Related: SEC dropping XRP case was ‘priced in’ since Trump’s election: Analysts
As a result of these supportive fundamentals, some traders said XRP’s ongoing consolidation may eventually lead to a breakout. That includes market analyst Stellar Babe, who anticipates XRP’s price to gain 450%.
Technical fractal suggests XRP is topping out
XRP’s weekly chart suggests a bearish fractal from 2021 may be unfolding again.
In both 2021 and 2025, the XRP price formed a local top while the RSI printed a lower high, signaling bearish divergence and weakening upside momentum. XRP/USD weekly price chart. Source: TradingView

Back in 2021, that divergence preceded an 85.50% sell-off that broke below the 50-week (the red wave) and 200-week (the blue wave) exponential moving averages (EMA) supports.
In 2025, XRP has again shown a similar RSI divergence, followed by a 40%-plus decline from its recent highs. It now risks an extended decline toward the 50-week EMA at around $1.58, down about 21.6% from the current price levels by June.
If the correction deepens and breaks below the 50-week EMA support, history suggests XRP could slide further toward the 200-week EMA around $0.87, or about 60% from the current price levels.
This article does not contain investment advice or recommendations. Every investment and trading move involves risk, and readers should conduct their own research when making a decision.