


This US President Increased the National Debt by Over 700%
Nothing dominates headlines today as much as President Donald Trump and his administration’s rapid pace of policy change across every nook and cranny of the U.S. government. In this article, our team at 24/7 Wall St. focuses on one of the big targets of the Trump administration: our national debt. In recent months, the Trump […] The post This US President Increased the National Debt by Over 700% appeared first on 24/7 Wall St..

Nothing dominates headlines today as much as President Donald Trump and his administration’s rapid pace of policy change across every nook and cranny of the U.S. government. In this article, our team at 24/7 Wall St. focuses on one of the big targets of the Trump administration: our national debt.
In recent months, the Trump administration has taken steps to reduce government spending and tackle America’s debt. A major effort has been the creation of the Department of Government Efficiency (DOGE), led by Elon Musk. DOGE is focused on cutting unnecessary costs, leading to staff cuts across federal agencies. For example, NASA has started reorganizing, closing three departments, and laying off 23 employees. Similarly, the U.S. Agency for International Development (USAID) eliminated 83% of its programs and significantly reduced its staff, marking a big change in how the U.S. provides aid to other countries.
To address the rising national debt, now at $36 trillion or more than 120% of GDP, the administration is also considering unusual solutions, such as selling U.S. residency permits for $5 million each. In addition, the administration has proposed large tariffs on imports from China, Mexico, and Canada. Although these measures aim to improve finances, economists have expressed concerns about whether they are practical and how they could affect the economy.
But how did the United States get to where we are today with our debt?
Using data from the U.S. Treasury Department, 24/7 Wall St. determined how the national debt changed under each of the U.S. presidents who took the oath of office in the 20th or 21st centuries. For each presidential administration, we calculated the compound annual growth rate of the national debt, from their first year in office to their last. Annual debt measurements used in these calculations are for the end of each government fiscal year and are not adjusted for inflation, therefore the numbers don’t match up perfectly with each president’s days in office. It’s also important to note that data President Biden, whose term just concluded in January 2025, only includes 3 years of debt growth. Presidents are ranked from the largest average annual decrease toward the national debt to the largest increase, which helps to address any differences in term lengths between presidents.
(This is an updated version of a previously published article that reflects new national debt data and a change in administration)
Why It Matters

The federal budget and the U.S. economy are among the chief responsibilities of Congress and the President. But as decades of deficit spending have sent the national debt soaring, borrowing costs stand at all-time highs. Higher interest payments mean less money for investment in public services like infrastructure, education, and research. Additionally, at current levels, the national debt reduces the government’s ability to effectively respond to crises and also jeopardizes the long-term viability of social safety net programs.
21. Calvin Coolidge (in office from 1923–1929)

- Avg. annual change in national debt, fiscal 1923-1929: -4.5% (-$903.1 million)
- Total change in national debt, fiscal 1923-1929: -24.2% (-$5.4 billion)
- National debt at the end of fiscal 1929: $16.9 billion
- National debt at the end of fiscal 1923: $22.3 billion
- Party affiliation: Republican
20. Warren G. Harding (in office from 1921–1923)
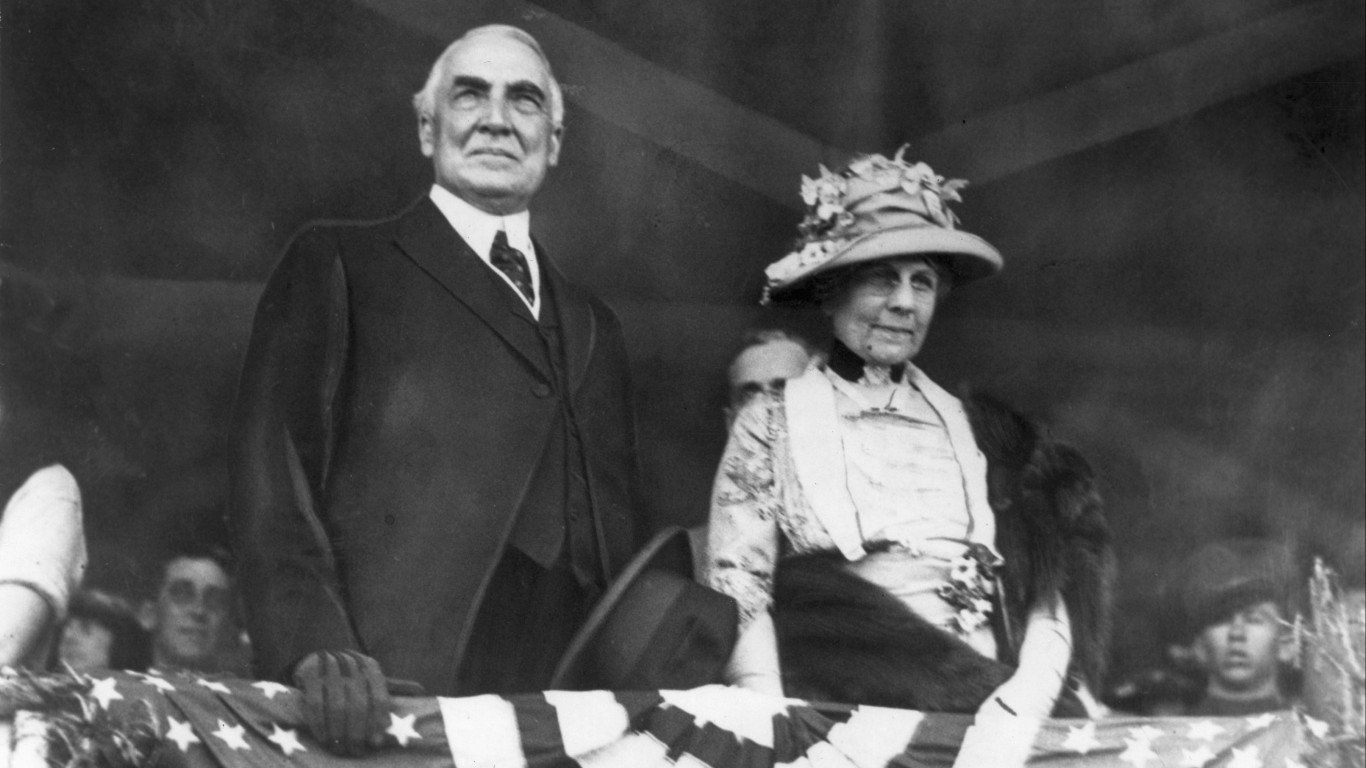
- Avg. annual change in national debt, fiscal 1921-1923: -3.5% (-$813.9 million)
- Total change in national debt, fiscal 1921-1923: -6.8% (-$1.6 billion)
- National debt at the end of fiscal 1923: $22.3 billion
- National debt at the end of fiscal 1921: $24.0 billion
- Party affiliation: Republican
19. Harry S. Truman (in office from 1945–1953)

- Avg. annual change in national debt, fiscal 1945-1953: +0.4% (+$923.6 million)
- Total change in national debt, fiscal 1945-1953: +2.9% (+$7.4 billion)
- National debt at the end of fiscal 1953: $266.1 billion
- National debt at the end of fiscal 1945: $258.7 billion
- Party affiliation: Democratic
18. Dwight D. Eisenhower (in office from 1953–1961)

- Avg. annual change in national debt, fiscal 1953-1961: +1.0% (+$2.9 billion)
- Total change in national debt, fiscal 1953-1961: +8.6% (+$22.9 billion)
- National debt at the end of fiscal 1961: $289.0 billion
- National debt at the end of fiscal 1953: $266.1 billion
- Party affiliation: Republican
17. Lyndon B. Johnson (in office from 1963–1969)
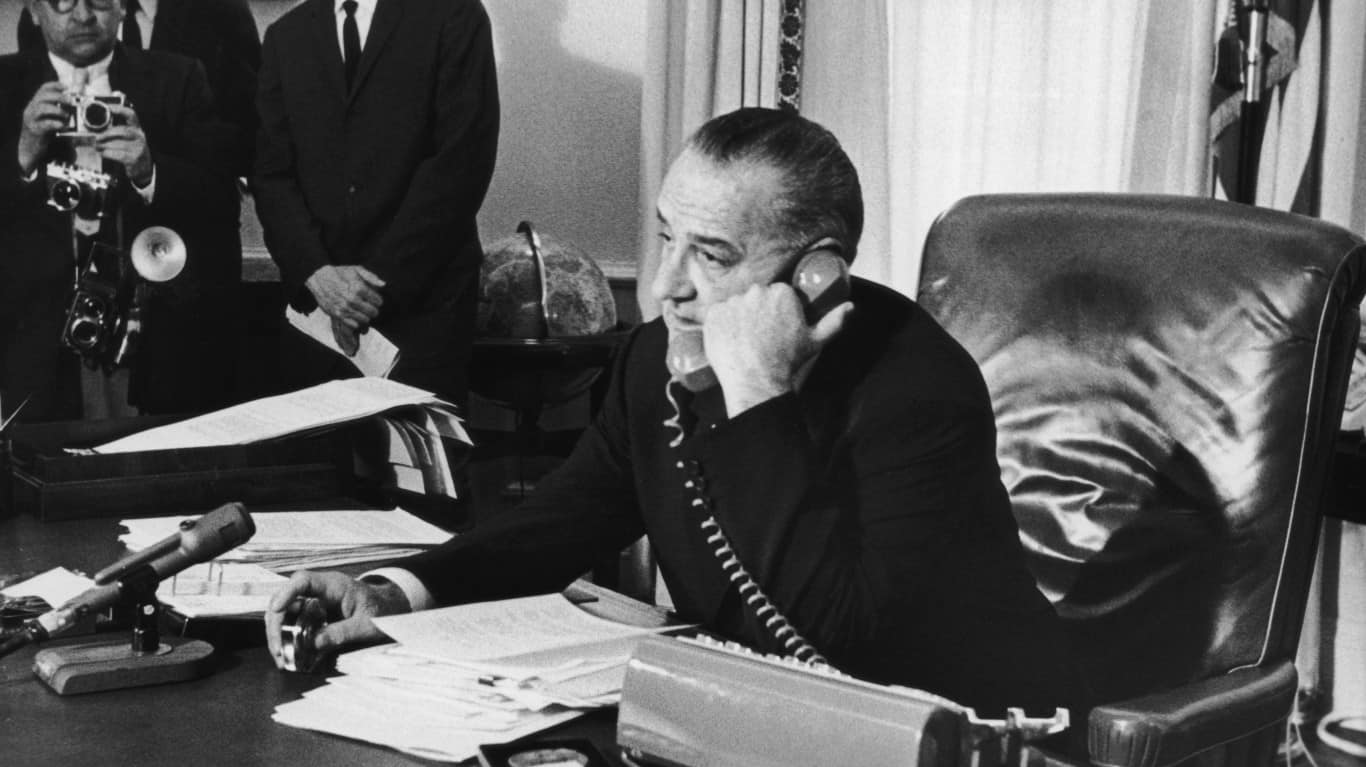
- Avg. annual change in national debt, fiscal 1963-1969: +2.5% (+$8.0 billion)
- Total change in national debt, fiscal 1963-1969: +15.6% (+$47.9 billion)
- National debt at the end of fiscal 1969: $353.7 billion
- National debt at the end of fiscal 1963: $305.9 billion
- Party affiliation: Democratic
16. William Howard Taft (in office from 1909–1913)

- Avg. annual change in national debt, fiscal 1909-1913: +2.5% (+$69.2 million)
- Total change in national debt, fiscal 1909-1913: +10.5% (+$276.7 million)
- National debt at the end of fiscal 1913: $2.9 billion
- National debt at the end of fiscal 1909: $2.6 billion
- Party affiliation: Republican
15. Theodore Roosevelt (in office from 1901–1909)

- Avg. annual change in national debt, fiscal 1901-1909: +2.6% (+$62.0 million)
- Total change in national debt, fiscal 1901-1909: +23.2% (+$496.2 million)
- National debt at the end of fiscal 1909: $2.6 billion
- National debt at the end of fiscal 1901: $2.1 billion
- Party affiliation: Republican
14. John F. Kennedy (in office from 1961–1963)

- Avg. annual change in national debt, fiscal 1961-1963: +2.9% (+$8.4 billion)
- Total change in national debt, fiscal 1961-1963: +5.8% (+$16.9 billion)
- National debt at the end of fiscal 1963: $305.9 billion
- National debt at the end of fiscal 1961: $289.0 billion
- Party affiliation: Democratic
13. William J. Clinton (in office from 1993–2001)

- Avg. annual change in national debt, fiscal 1993-2001: +3.5% (+$174.5 billion)
- Total change in national debt, fiscal 1993-2001: +31.6% (+$1.4 trillion)
- National debt at the end of fiscal 2001: $5.8 trillion
- National debt at the end of fiscal 1993: $4.4 trillion
- Party affiliation: Democratic
12. Richard M. Nixon (in office from 1969–1974)
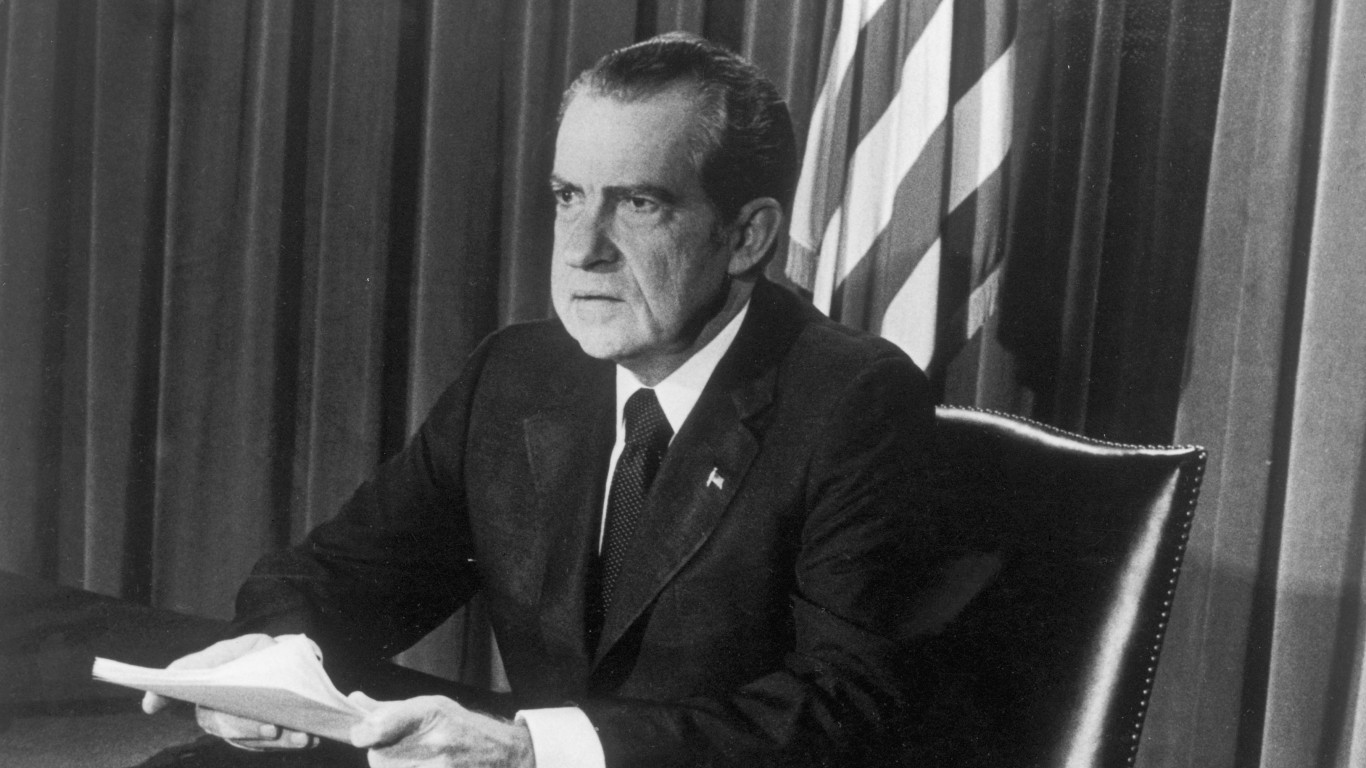
- Avg. annual change in national debt, fiscal 1969-1974: +6.1% (+$24.3 billion)
- Total change in national debt, fiscal 1969-1974: +34.3% (+$121.3 billion)
- National debt at the end of fiscal 1974: $475.1 billion
- National debt at the end of fiscal 1969: $353.7 billion
- Party affiliation: Republican
11. Barack Obama (in office from 2009–2017)

- Avg. annual change in national debt, fiscal 2009-2017: +6.9% (+$1.0 trillion)
- Total change in national debt, fiscal 2009-2017: +70.0% (+$8.3 trillion)
- National debt at the end of fiscal 2017: $20.2 trillion
- National debt at the end of fiscal 2009: $11.9 trillion
- Party affiliation: Democratic
10. Herbert Hoover (in office from 1929–1933)
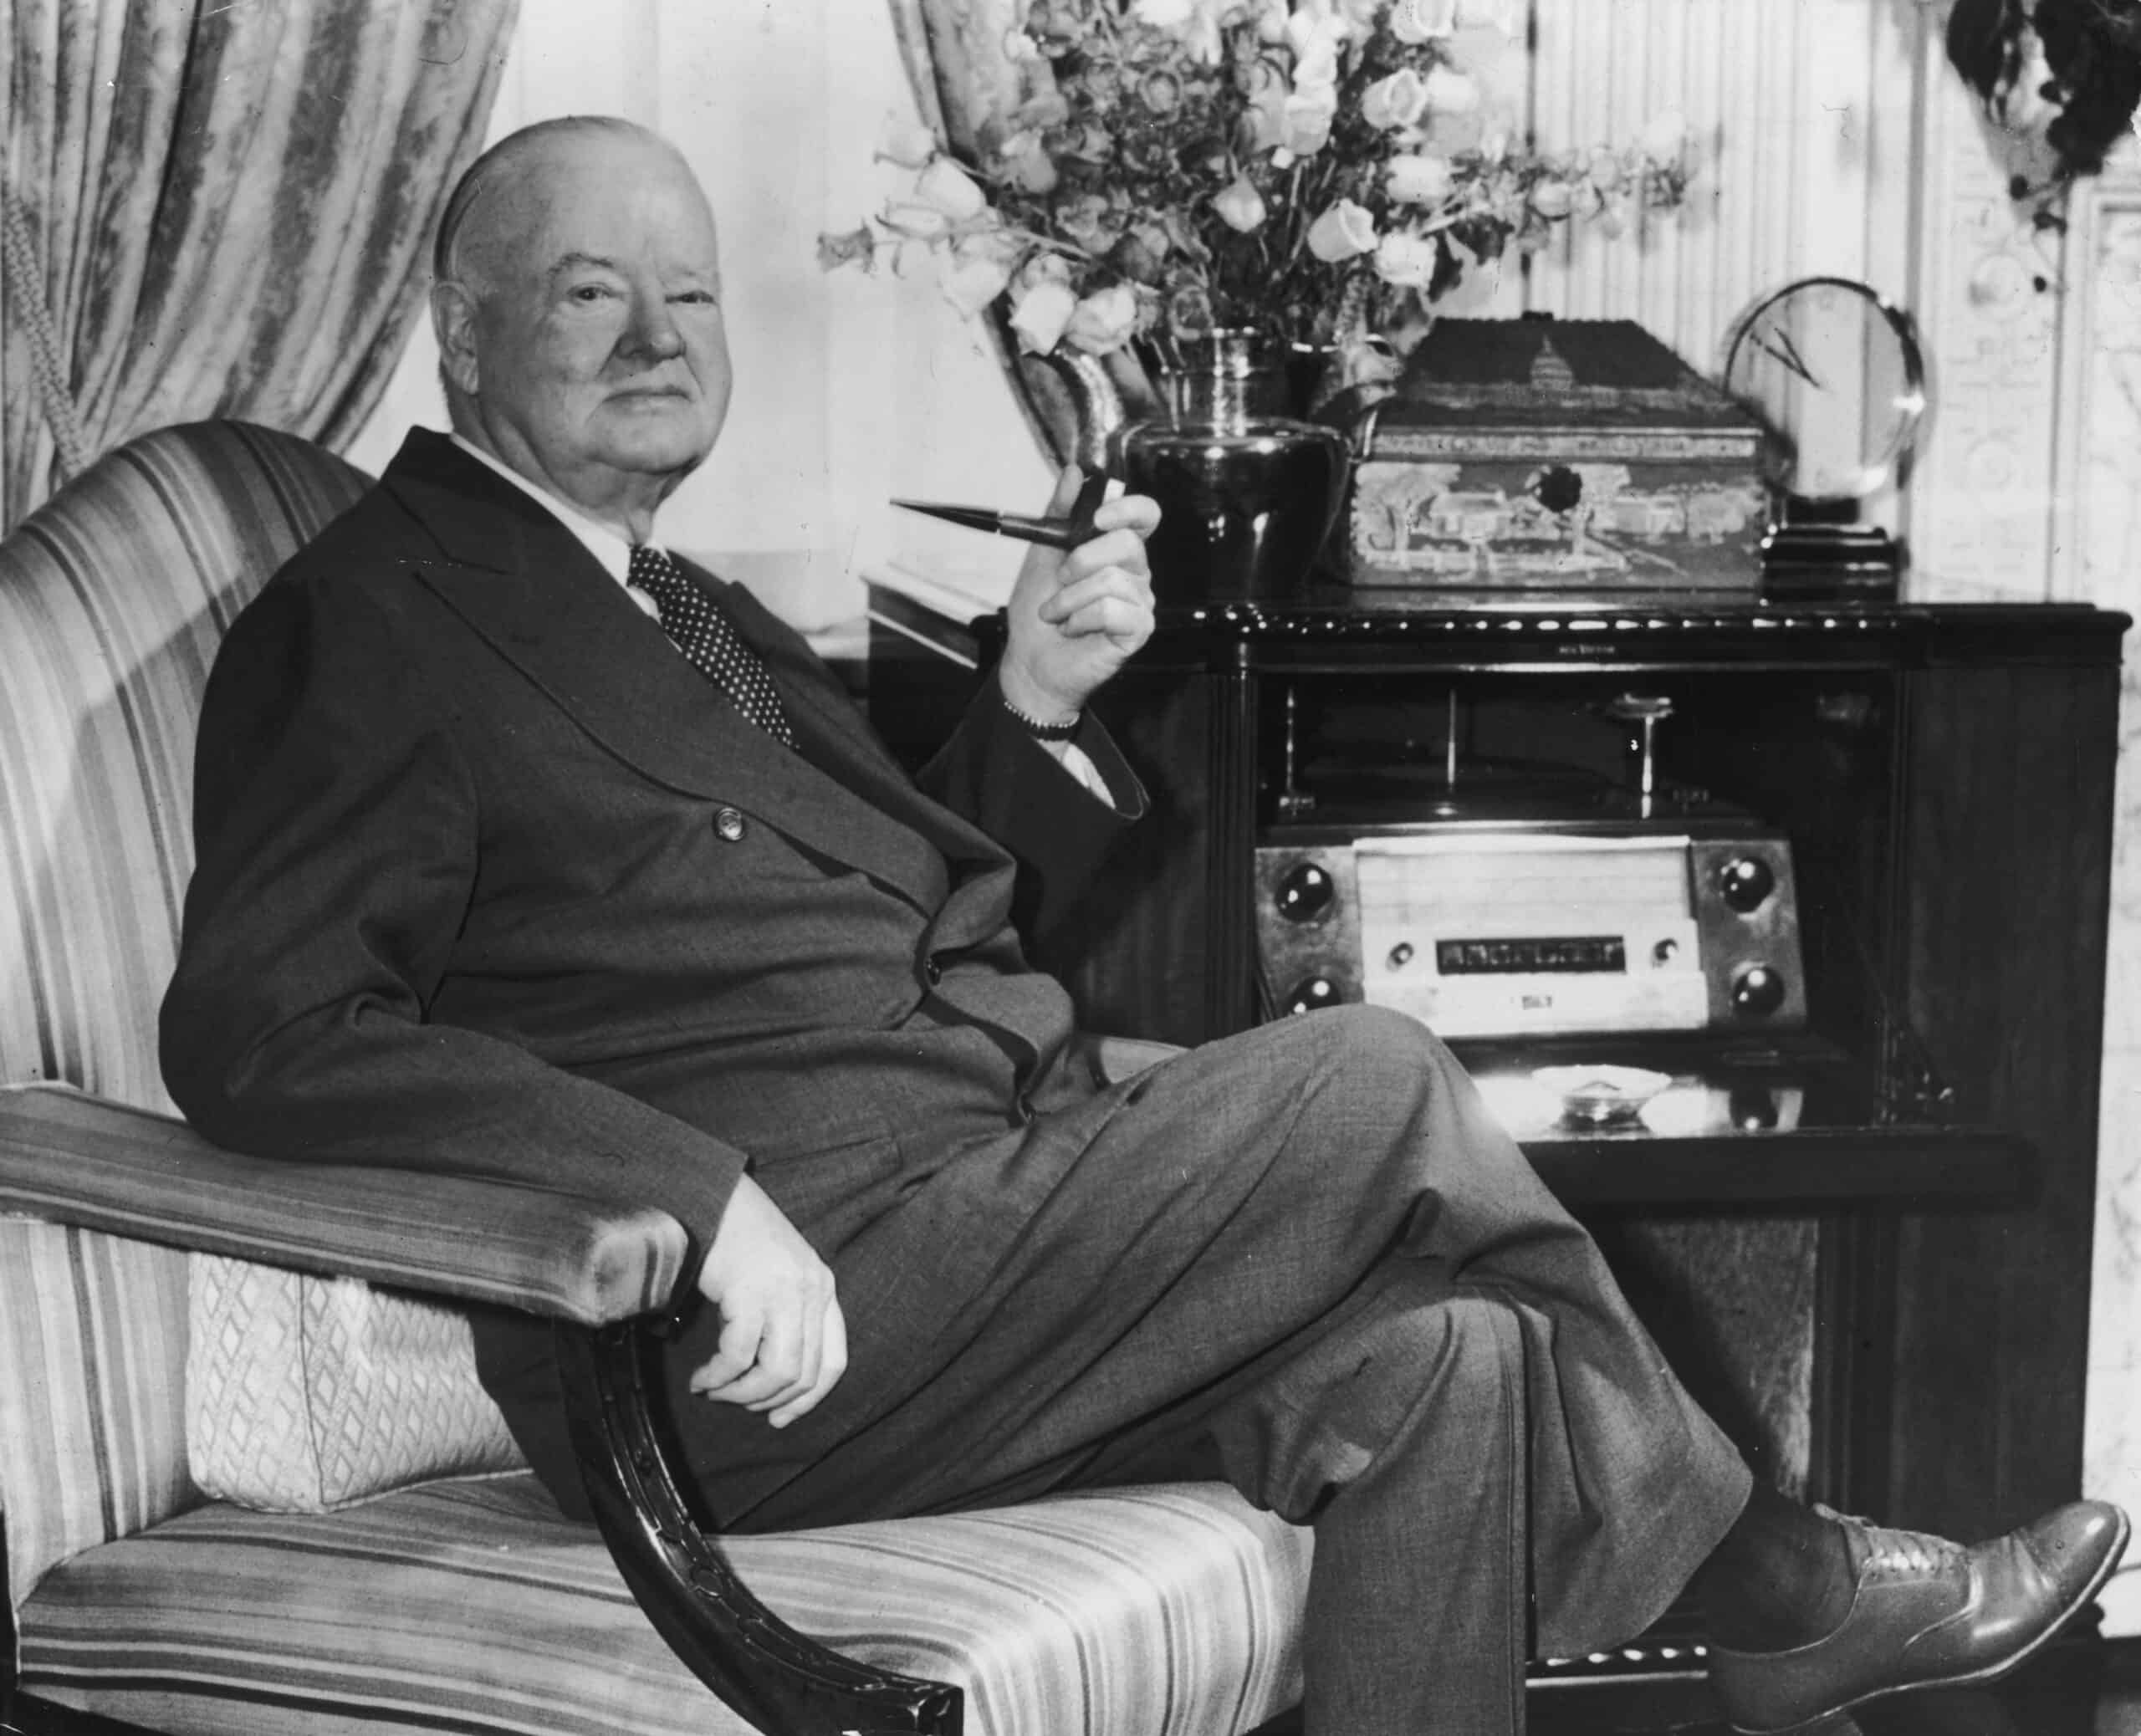
- Avg. annual change in national debt, fiscal 1929-1933: +7.4% (+$1.4 billion)
- Total change in national debt, fiscal 1929-1933: +33.1% (+$5.6 billion)
- National debt at the end of fiscal 1933: $22.5 billion
- National debt at the end of fiscal 1929: $16.9 billion
- Party affiliation: Republican
9. Joseph R. Biden Jr. (in office from 2021–2025) *only 3 years of data
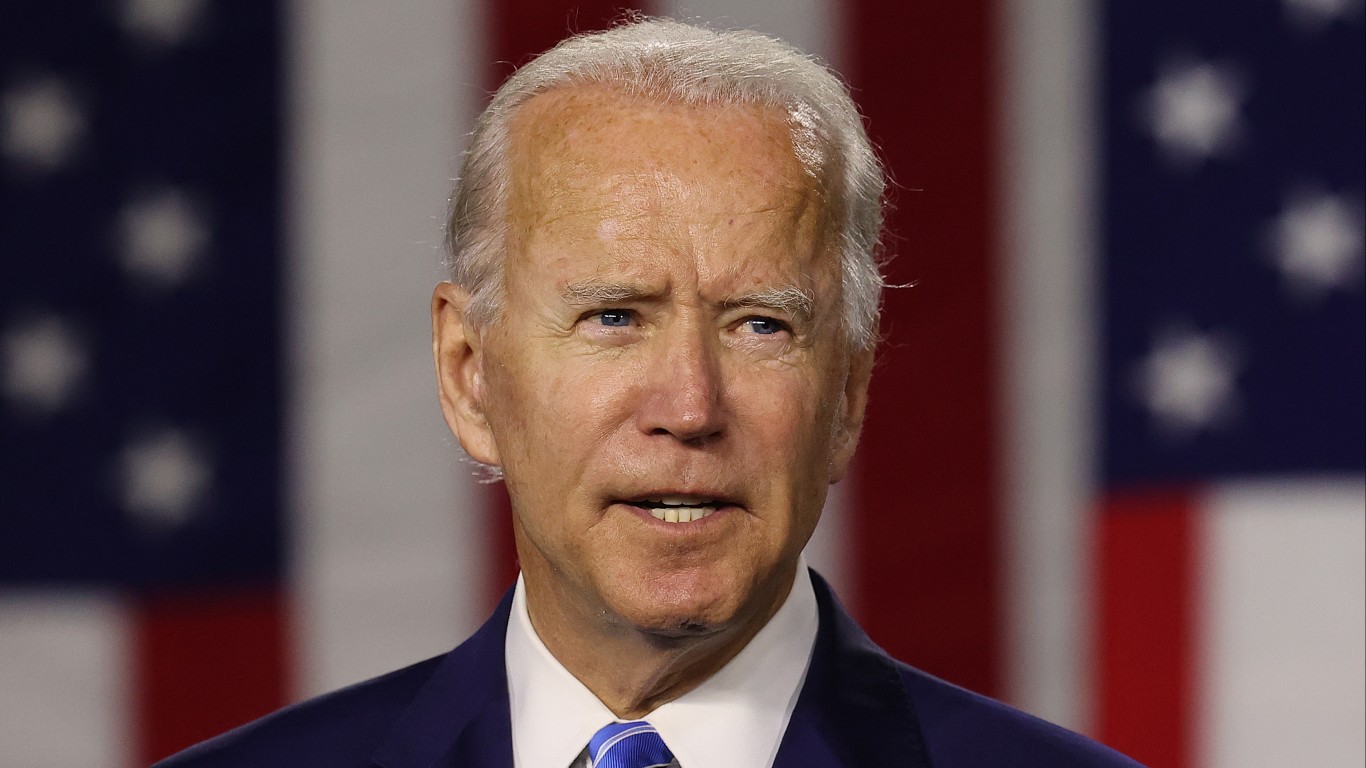
- Avg. annual change in national debt, fiscal 2021-2024: +7.6% (+$2.3 trillion)
- Total change in national debt, fiscal 2021-2024: +24.7% (+$7.0 trillion)
- National debt at the end of fiscal 2024: $35.5 trillion
- National debt at the end of fiscal 2021: $28.4 trillion
- Party affiliation: Democratic
8. Donald J. Trump (in office from 2017–2021)

- Avg. annual change in national debt, fiscal 2017-2021: +8.9% (+$2.0 trillion)
- Total change in national debt, fiscal 2017-2021: +40.4% (+$8.2 trillion)
- National debt at the end of fiscal 2021: $28.4 trillion
- National debt at the end of fiscal 2017: $20.2 trillion
- Party affiliation: Republican
7. Jimmy Carter (in office from 1977–1981)
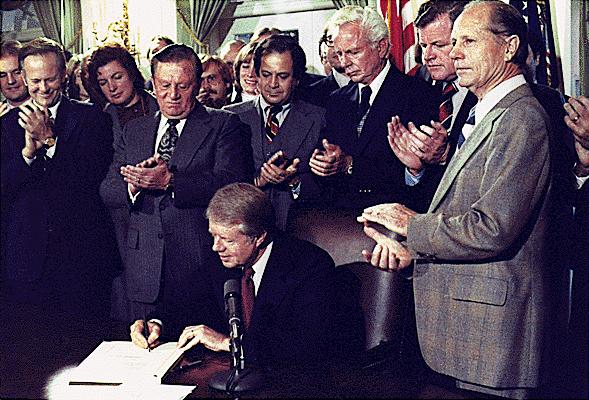
- Avg. annual change in national debt, fiscal 1977-1981: +9.3% (+$74.8 billion)
- Total change in national debt, fiscal 1977-1981: +42.8% (+$299.0 billion)
- National debt at the end of fiscal 1981: $997.9 billion
- National debt at the end of fiscal 1977: $698.8 billion
- Party affiliation: Democratic
6. George W. Bush (in office from 2001–2009)
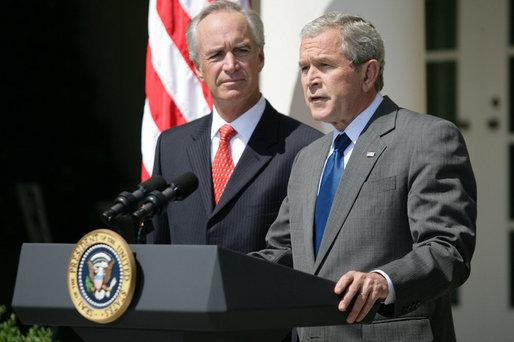
- Avg. annual change in national debt, fiscal 2001-2009: +9.4% (+$762.8 billion)
- Total change in national debt, fiscal 2001-2009: +105.1% (+$6.1 trillion)
- National debt at the end of fiscal 2009: $11.9 trillion
- National debt at the end of fiscal 2001: $5.8 trillion
- Party affiliation: Republican
5. George H.W. Bush (in office from 1989–1993)
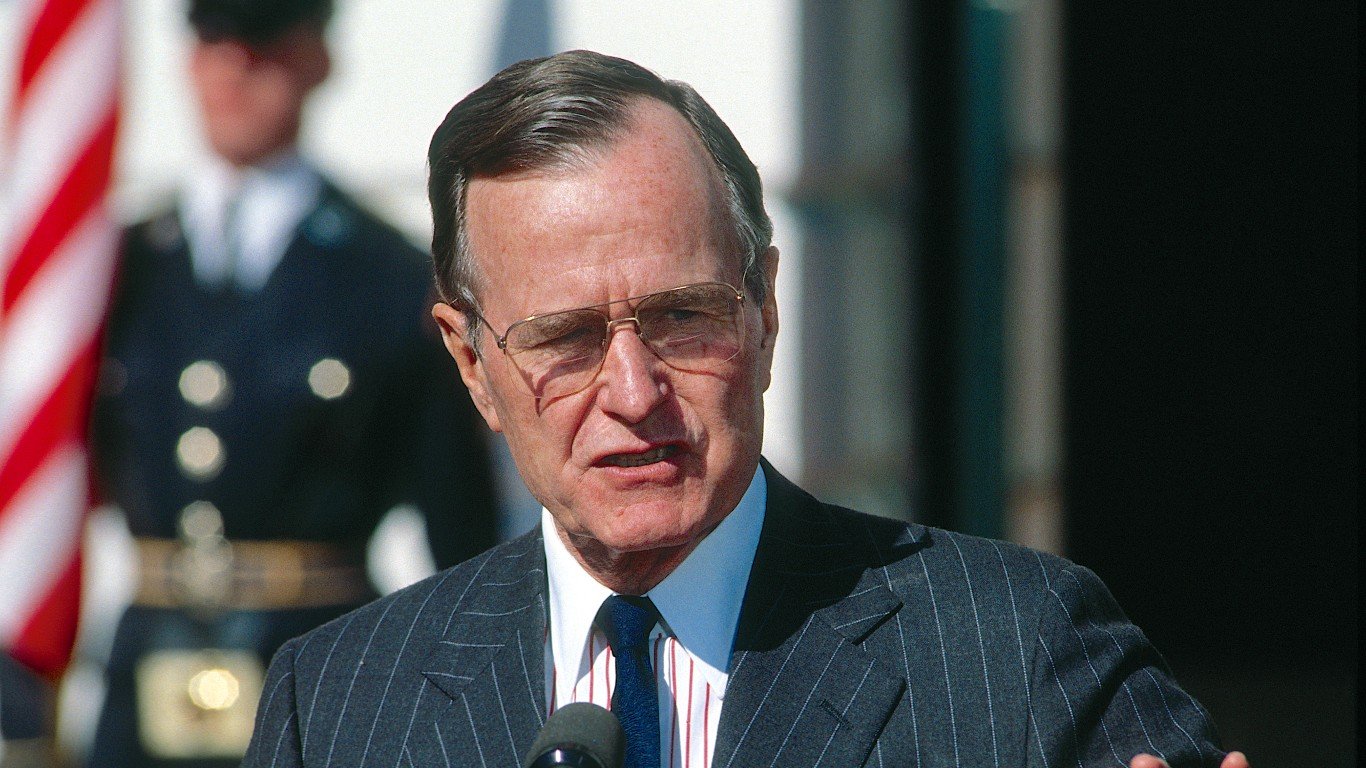
- Avg. annual change in national debt, fiscal 1989-1993: +11.5% (+$388.5 billion)
- Total change in national debt, fiscal 1989-1993: +54.4% (+$1.6 trillion)
- National debt at the end of fiscal 1993: $4.4 trillion
- National debt at the end of fiscal 1989: $2.9 trillion
- Party affiliation: Republican
4. Gerald R. Ford (in office from 1974–1977)
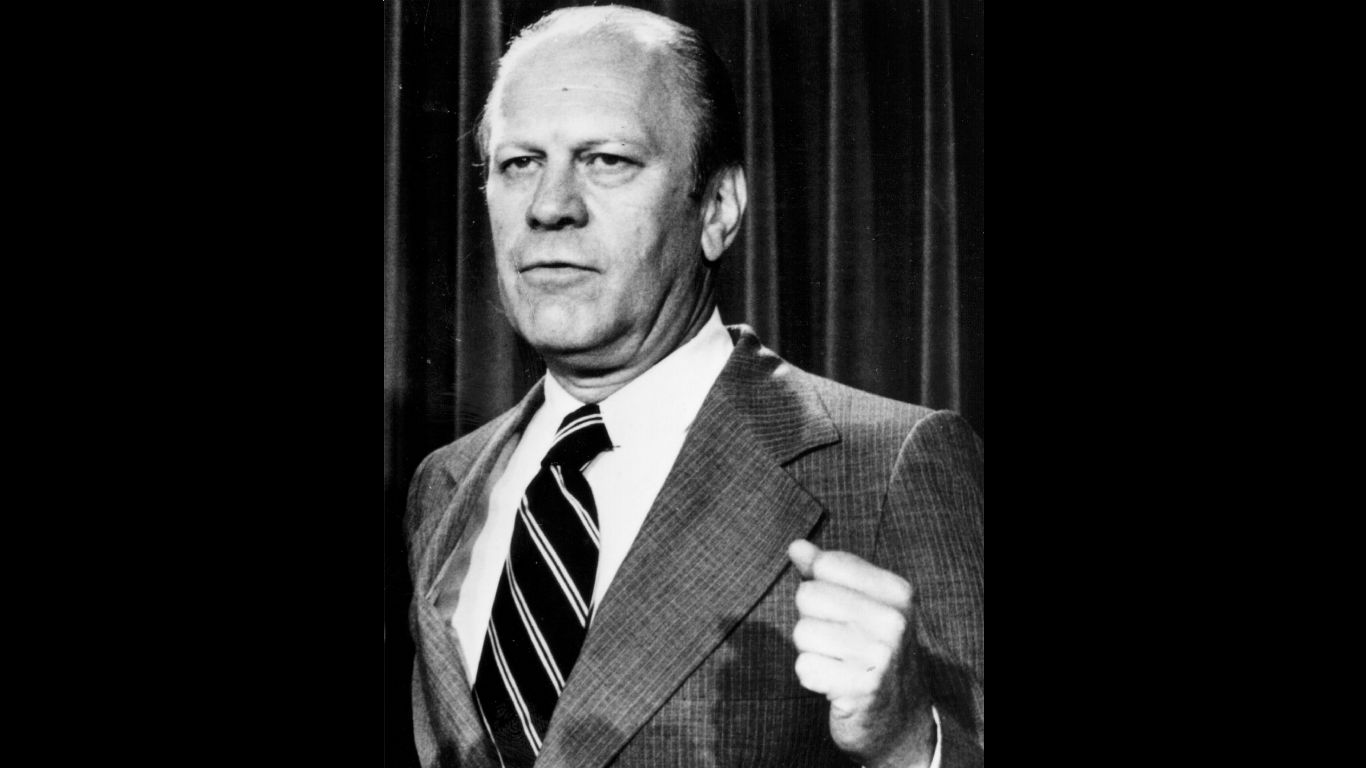
- Avg. annual change in national debt, fiscal 1974-1977: +13.7% (+$74.6 billion)
- Total change in national debt, fiscal 1974-1977: +47.1% (+$223.8 billion)
- National debt at the end of fiscal 1977: $698.8 billion
- National debt at the end of fiscal 1974: $475.1 billion
- Party affiliation: Republican
3. Ronald Reagan (in office from 1981–1989)

- Avg. annual change in national debt, fiscal 1981-1989: +14.1% (+$232.4 billion)
- Total change in national debt, fiscal 1981-1989: +186.4% (+$1.9 trillion)
- National debt at the end of fiscal 1989: $2.9 trillion
- National debt at the end of fiscal 1981: $997.9 billion
- Party affiliation: Republican
2. Franklin D. Roosevelt (in office from 1933–1945)

- Avg. annual change in national debt, fiscal 1933-1945: +22.6% (+$19.7 billion)
- Total change in national debt, fiscal 1933-1945: +1,047.7% (+$236.1 billion)
- National debt at the end of fiscal 1945: $258.7 billion
- National debt at the end of fiscal 1933: $22.5 billion
- Party affiliation: Democratic
1. Woodrow Wilson (in office from 1913–1921)
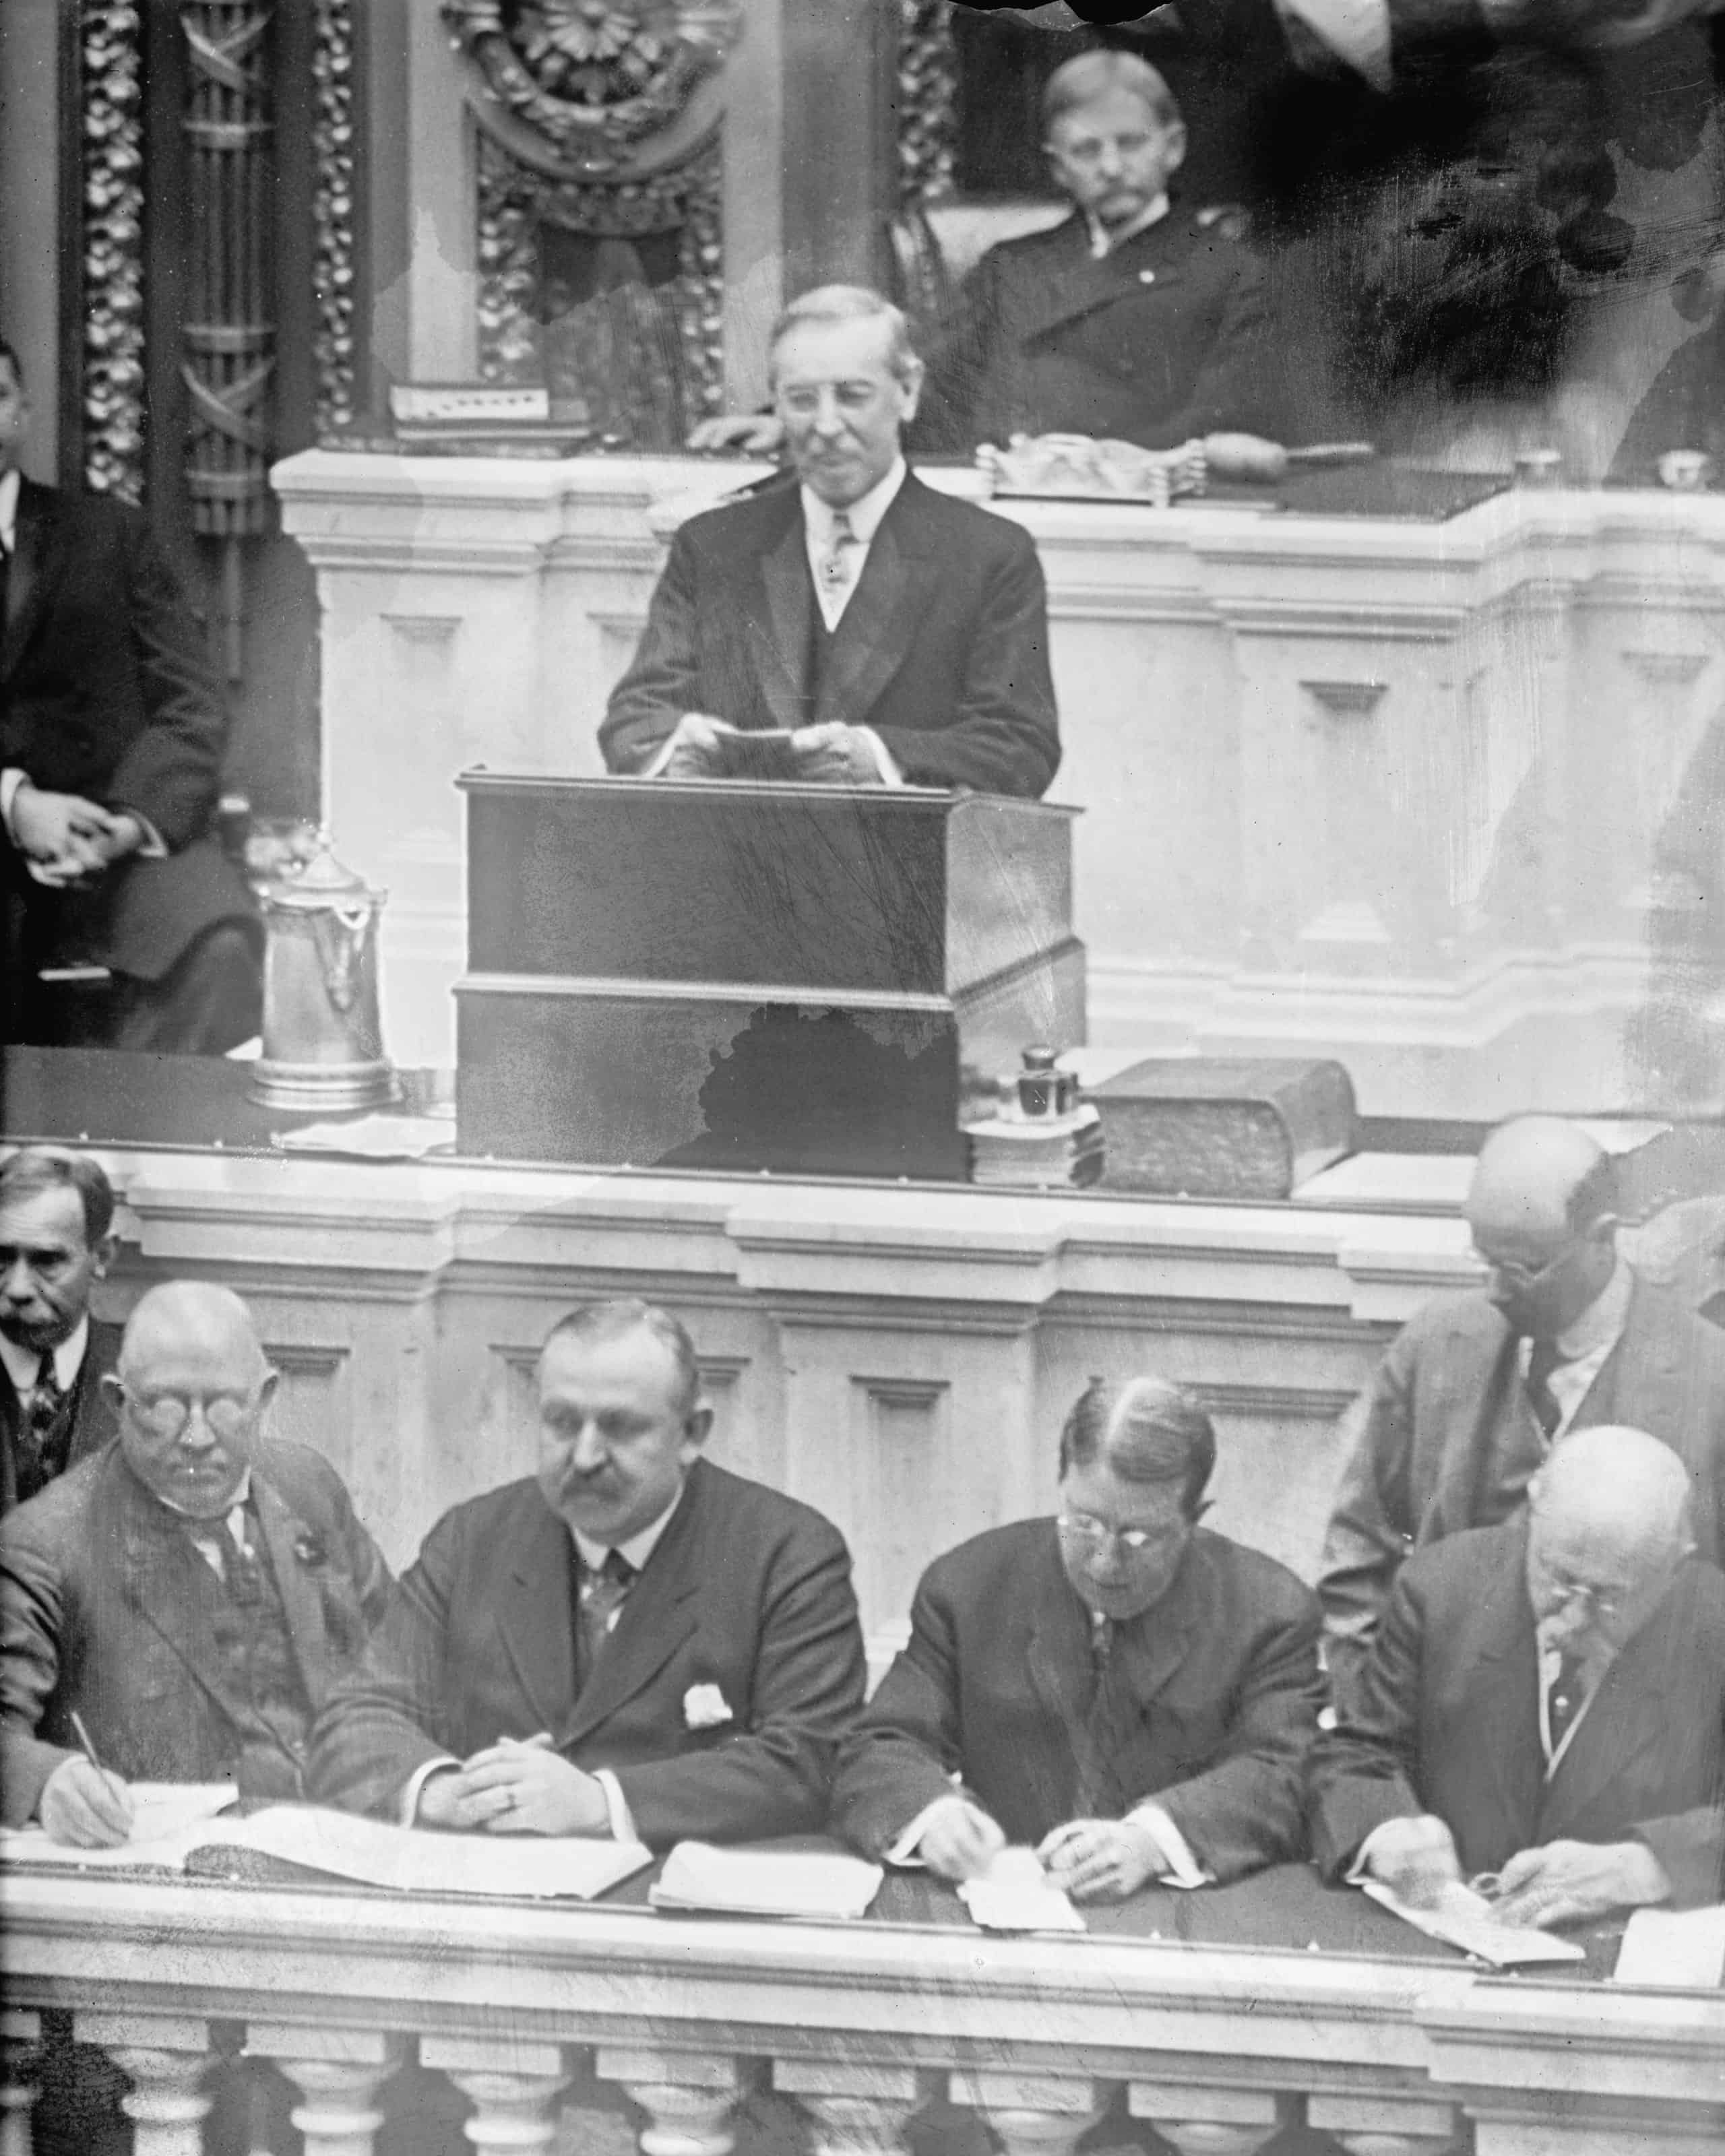
- Avg. annual change in national debt, fiscal 1913-1921: +30.1% (+$2.6 billion)
- Total change in national debt, fiscal 1913-1921: +722.2% (+$21.1 billion)
- National debt at the end of fiscal 1921: $24.0 billion
- National debt at the end of fiscal 1913: $2.9 billion
- Party affiliation: Democratic
The post This US President Increased the National Debt by Over 700% appeared first on 24/7 Wall St..