


The Typical House in This Beautiful American Town Only Costs $84,950
For much of the COVID-19 pandemic, consumer prices rose far faster than incomes. Even though wage gains have overtaken inflation in more recent years, the effects of soaring prices are still evident in communities across the United States — particularly in the housing market. 24/7 Wall St. : Home prices in the U.S. have […] The post The Typical House in This Beautiful American Town Only Costs $84,950 appeared first on 24/7 Wall St..

For much of the COVID-19 pandemic, consumer prices rose far faster than incomes. Even though wage gains have overtaken inflation in more recent years, the effects of soaring prices are still evident in communities across the United States — particularly in the housing market.
24/7 Wall St. Key Points:
- Home prices in the U.S. have surged in the years since the pandemic, giving way to a housing affordability crisis.
- Still, there are parts of the country where home prices remain closely in line with what local residents can afford.
- Also: Discover the next Nvidia
As of February 2025, the typical American home on the market was listed for $412,000, according to Realtor.com’s housing market database. While the median list price is considerably lower than the all-time high of $449,000 reported in June 2022, it is also still about 38% higher than the January 2020 median list price of $299,250. (This is how Baby Boomers impacted the housing market for younger buyers.)
Historically high home prices are due in large part to a housing shortage. Fueled by zoning restrictions and high materials costs, new housing construction has not kept pace with demand, and partially as a result, the U.S. may have as many as 4.5 million fewer homes than it needs, according to some estimates.
In recent years, high housing costs have been compounded by mortgage rates, which are now hovering near their highest levels in a decade and a half. Borrowing costs aside, the typical home on the market is listed for about 5.3 times more than what the typical American household earns in a year. Still, location matters when it comes to the housing market, and in many parts of the country, home ownership remains far more affordable than it does across the U.S. as a whole.
Using county-level data from Realtor.com, 24/7 Wall St. identified America’s most affordable housing markets. We reviewed the median list price in February 2025 for over 3,000 U.S. counties and county equivalents and calculated the local housing affordability ratio using five year estimates from the U.S. Census Bureau’s American Community Survey. To avoid statistical anomalies, only counties with at least 100 listed homes in February 2025 were considered.
Among the 45 counties on this list, the typical home for sale is listed for anywhere from 2.6 to just 1.4 times more than the local median household income. The majority of counties on this list are in the Midwest, including 15 in Illinois and five in Iowa. The 11 Northeast counties on this list are located exclusively in Pennsylvania and New York, while the six southern counties on this list are spread across Alabama, Oklahoma, Texas, and West Virginia. (Here is a look at the states with the highest foreclosure rates.)
The relative affordability of homeownership in these places is due primarily to low list prices, rather than especially high incomes. Nationwide, the typical home on the market is listed for about $227 per square foot. Meanwhile, in every county on this list, the typical home is on the market for less than $150 per square foot, and in most cases, less than $100. Additionally, according to the latest five year ACS estimates, the typical American household earns $78,538 annually, more than the median household income in every county on this list — often by tens of thousands of dollars.
These are America’s most affordable housing markets.
Why It Matters

Supply constraints and rising demand have given way to a housing affordability crisis in the United States. Not even considering historically high mortgage rates, the typical American home has a median list price that is over five times more than what the typical household earns in a year. Notably, however, some parts of the country appear to have been largely spared from the housing crisis. In these places, home prices remain connected to incomes to a greater degree than is common in much of the rest of the country.
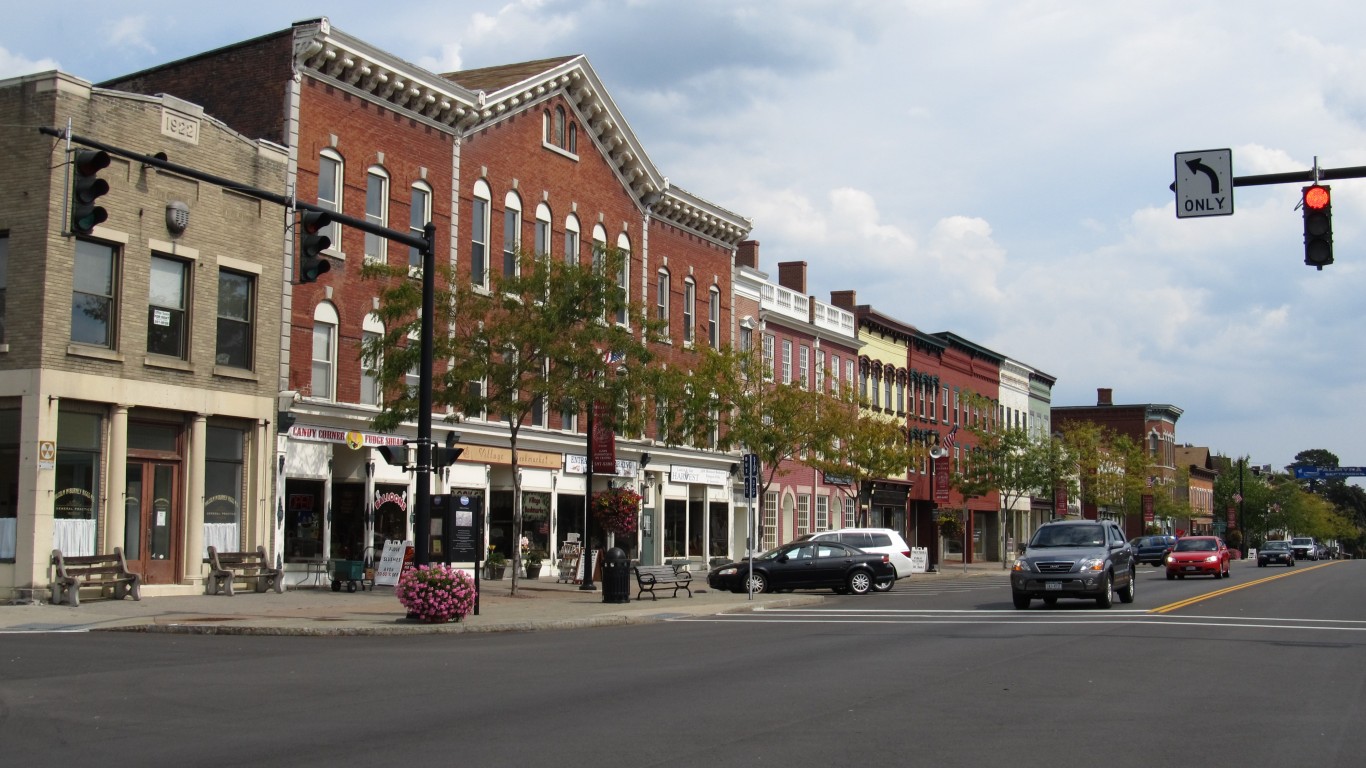
45. Indiana County, Pennsylvania
- Typical home price relative to income: 2.6 times higher than median income
- Median home list price in February 2025: $155,200 ($89 per square foot)
- Median household income: $58,739
- 1-year change in median list price: +1.5%
- Total number of listed homes in February 2025: 160
44. Wayne County, New York
- Typical home price relative to income: 2.6 times higher than median income
- Median home list price in February 2025: $194,900 ($129 per square foot)
- Median household income: $73,914
- 1-year change in median list price: -35.0%
- Total number of listed homes in February 2025: 151
43. Ingham County, Michigan

- Typical home price relative to income: 2.6 times higher than median income
- Median home list price in February 2025: $169,200 ($132 per square foot)
- Median household income: $64,354
- 1-year change in median list price: +9.2%
- Total number of listed homes in February 2025: 661
42. Webster County, Iowa
- Typical home price relative to income: 2.6 times higher than median income
- Median home list price in February 2025: $178,100 ($135 per square foot)
- Median household income: $68,054
- 1-year change in median list price: +22.8%
- Total number of listed homes in February 2025: 127
41. Cowley County, Kansas

- Typical home price relative to income: 2.6 times higher than median income
- Median home list price in February 2025: $152,200 ($91 per square foot)
- Median household income: $58,263
- 1-year change in median list price: +32.4%
- Total number of listed homes in February 2025: 116
40. Hutchinson County, Texas
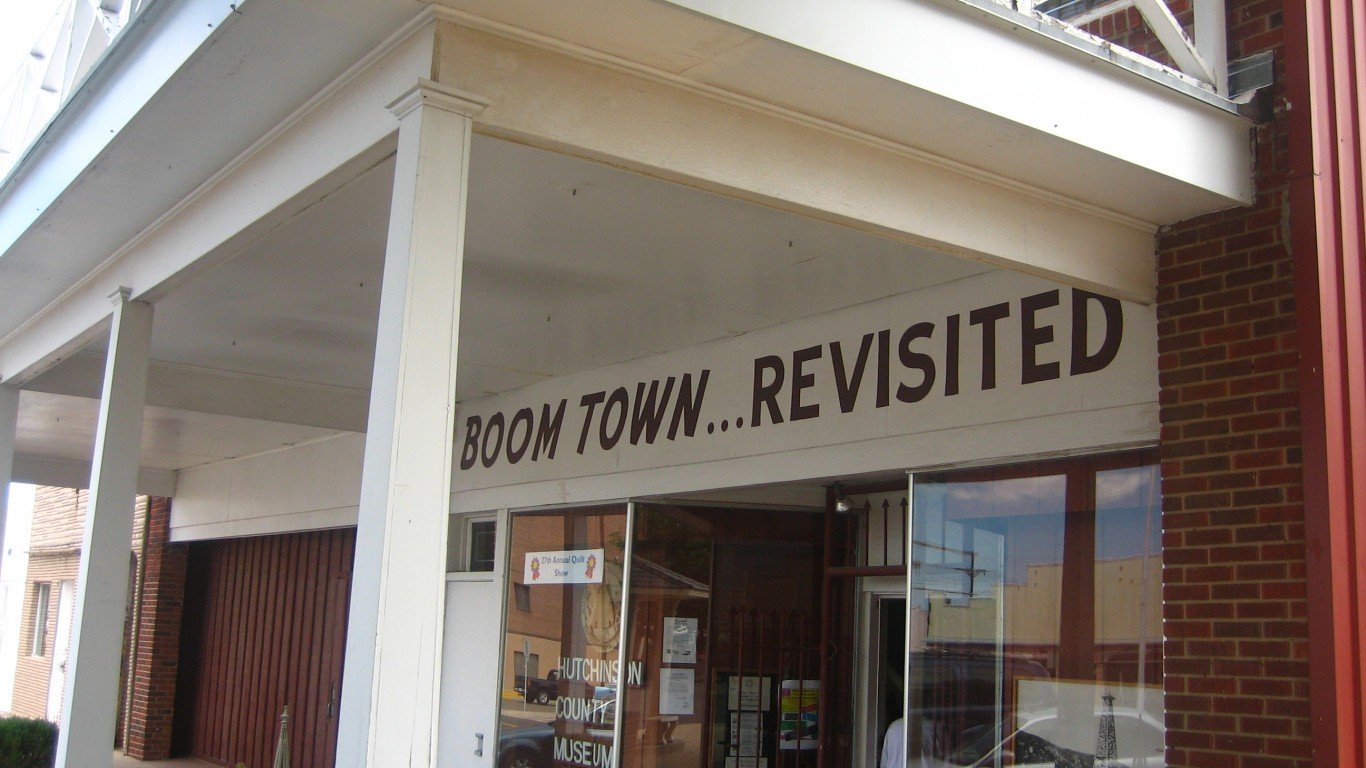
- Typical home price relative to income: 2.6 times higher than median income
- Median home list price in February 2025: $169,500 ($89 per square foot)
- Median household income: $65,470
- 1-year change in median list price: +25.6%
- Total number of listed homes in February 2025: 118
39. Marion County, West Virginia

- Typical home price relative to income: 2.6 times higher than median income
- Median home list price in February 2025: $174,700 ($112 per square foot)
- Median household income: $67,537
- 1-year change in median list price: -14.5%
- Total number of listed homes in February 2025: 135
38. Chemung County, New York
- Typical home price relative to income: 2.6 times higher than median income
- Median home list price in February 2025: $163,725 ($106 per square foot)
- Median household income: $63,469
- 1-year change in median list price: +11.8%
- Total number of listed homes in February 2025: 294
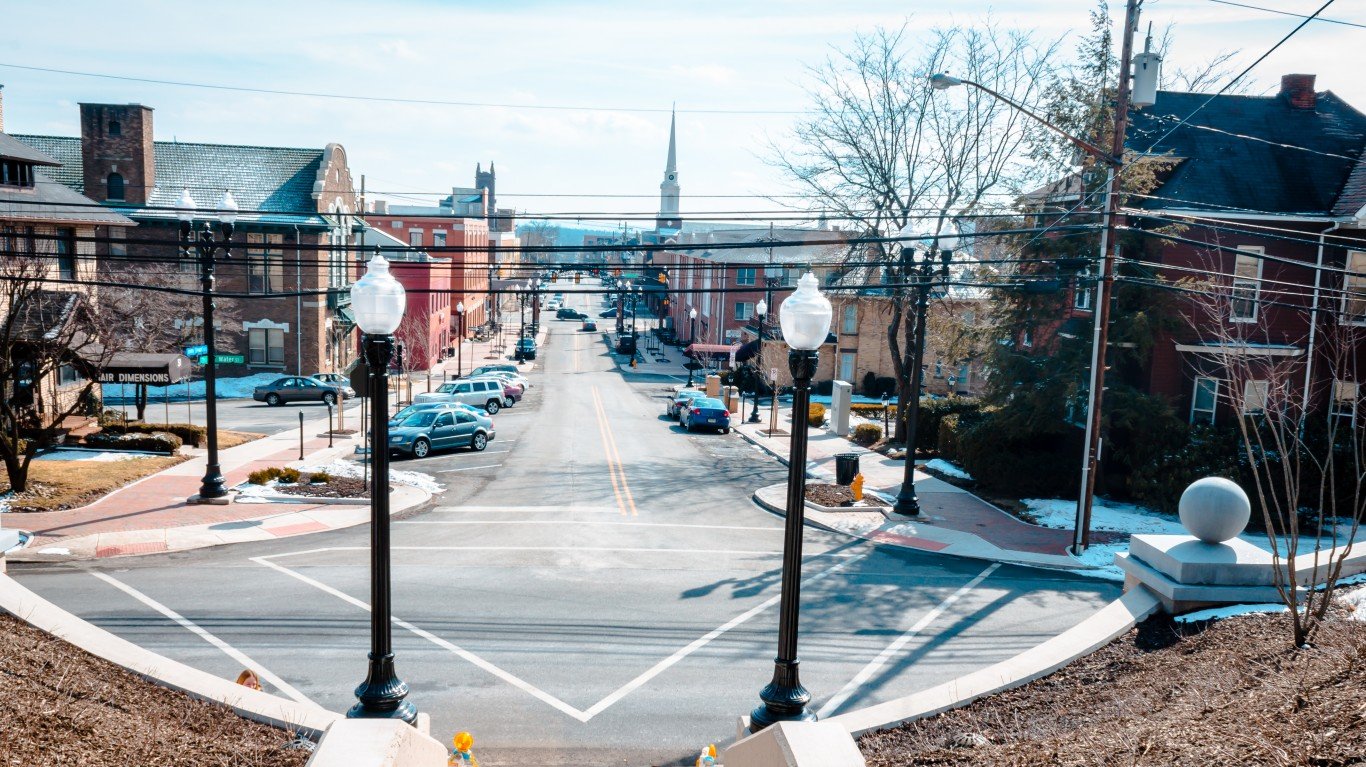
37. Blair County, Pennsylvania

- Typical home price relative to income: 2.6 times higher than median income
- Median home list price in February 2025: $156,250 ($98 per square foot)
- Median household income: $60,594
- 1-year change in median list price: +6.0%
- Total number of listed homes in February 2025: 184
36. Kay County, Oklahoma

- Typical home price relative to income: 2.6 times higher than median income
- Median home list price in February 2025: $144,950 ($94 per square foot)
- Median household income: $56,673
- 1-year change in median list price: -7.2%
- Total number of listed homes in February 2025: 171
35. Wapello County, Iowa
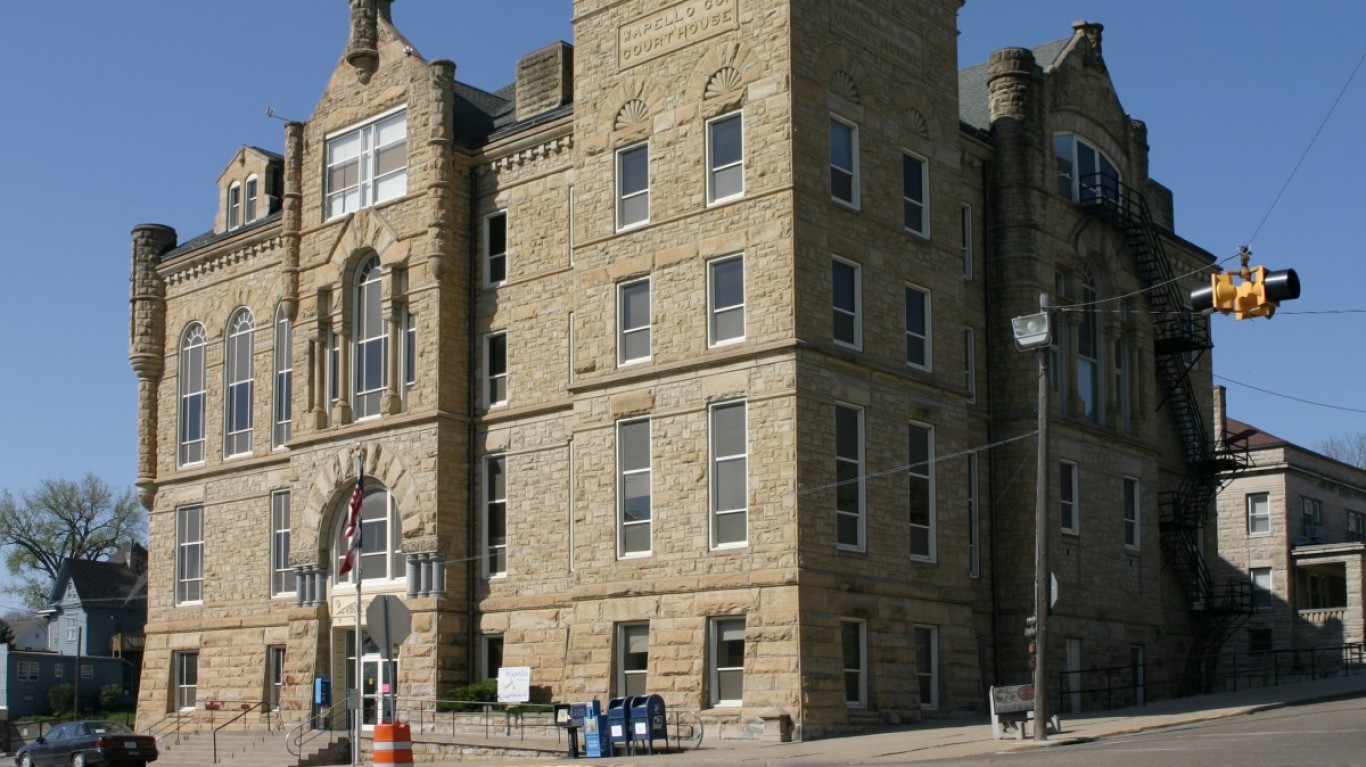
- Typical home price relative to income: 2.5 times higher than median income
- Median home list price in February 2025: $152,950 ($125 per square foot)
- Median household income: $60,034
- 1-year change in median list price: -2.8%
- Total number of listed homes in February 2025: 146
34. Kanawha County, West Virginia

- Typical home price relative to income: 2.5 times higher than median income
- Median home list price in February 2025: $150,000 ($106 per square foot)
- Median household income: $58,887
- 1-year change in median list price: -2.9%
- Total number of listed homes in February 2025: 473
33. Wayne County, Indiana

- Typical home price relative to income: 2.5 times higher than median income
- Median home list price in February 2025: $143,725 ($108 per square foot)
- Median household income: $56,652
- 1-year change in median list price: -9.1%
- Total number of listed homes in February 2025: 225
32. Montgomery County, Kansas
- Typical home price relative to income: 2.5 times higher than median income
- Median home list price in February 2025: $133,125 ($75 per square foot)
- Median household income: $53,242
- 1-year change in median list price: -1.4%
- Total number of listed homes in February 2025: 147
31. Chenango County, New York
- Typical home price relative to income: 2.5 times higher than median income
- Median home list price in February 2025: $153,675 ($102 per square foot)
- Median household income: $62,093
- 1-year change in median list price: -11.7%
- Total number of listed homes in February 2025: 149
30. Whiteside County, Illinois
- Typical home price relative to income: 2.5 times higher than median income
- Median home list price in February 2025: $158,950 ($100 per square foot)
- Median household income: $64,536
- 1-year change in median list price: +10.6%
- Total number of listed homes in February 2025: 156
29. Genesee County, Michigan

- Typical home price relative to income: 2.4 times higher than median income
- Median home list price in February 2025: $147,850 ($114 per square foot)
- Median household income: $60,673
- 1-year change in median list price: -24.1%
- Total number of listed homes in February 2025: 1,299
28. Madison County, Illinois

- Typical home price relative to income: 2.4 times higher than median income
- Median home list price in February 2025: $182,200 ($128 per square foot)
- Median household income: $74,800
- 1-year change in median list price: -4.7%
- Total number of listed homes in February 2025: 630
27. Coles County, Illinois
- Typical home price relative to income: 2.4 times higher than median income
- Median home list price in February 2025: $133,725 ($94 per square foot)
- Median household income: $56,040
- 1-year change in median list price: +3.9%
- Total number of listed homes in February 2025: 107
26. Macoupin County, Illinois

- Typical home price relative to income: 2.4 times higher than median income
- Median home list price in February 2025: $162,175 ($105 per square foot)
- Median household income: $68,518
- 1-year change in median list price: +20.2%
- Total number of listed homes in February 2025: 115
25. Macon County, Illinois

- Typical home price relative to income: 2.4 times higher than median income
- Median home list price in February 2025: $147,725 ($84 per square foot)
- Median household income: $62,449
- 1-year change in median list price: -4.7%
- Total number of listed homes in February 2025: 269
24. Wayne County, Michigan

- Typical home price relative to income: 2.4 times higher than median income
- Median home list price in February 2025: $140,000 ($120 per square foot)
- Median household income: $59,521
- 1-year change in median list price: +12.0%
- Total number of listed homes in February 2025: 5,097
23. Okmulgee County, Oklahoma

- Typical home price relative to income: 2.3 times higher than median income
- Median home list price in February 2025: $124,500 ($97 per square foot)
- Median household income: $53,123
- 1-year change in median list price: -23.8%
- Total number of listed homes in February 2025: 157
22. Allegany County, New York

- Typical home price relative to income: 2.3 times higher than median income
- Median home list price in February 2025: $142,450 ($79 per square foot)
- Median household income: $61,233
- 1-year change in median list price: -13.6%
- Total number of listed homes in February 2025: 141
21. Grant County, Indiana

- Typical home price relative to income: 2.3 times higher than median income
- Median home list price in February 2025: $124,900 ($94 per square foot)
- Median household income: $54,007
- 1-year change in median list price: -16.1%
- Total number of listed homes in February 2025: 146
20. Des Moines County, Iowa

- Typical home price relative to income: 2.3 times higher than median income
- Median home list price in February 2025: $139,900 ($103 per square foot)
- Median household income: $60,662
- 1-year change in median list price: +2.7%
- Total number of listed homes in February 2025: 185
19. Mercer County, Pennsylvania

- Typical home price relative to income: 2.3 times higher than median income
- Median home list price in February 2025: $139,225 ($145 per square foot)
- Median household income: $60,614
- 1-year change in median list price: +2.2%
- Total number of listed homes in February 2025: 301
18. Sangamon County, Illinois

- Typical home price relative to income: 2.2 times higher than median income
- Median home list price in February 2025: $164,900 ($109 per square foot)
- Median household income: $74,114
- 1-year change in median list price: -5.7%
- Total number of listed homes in February 2025: 382
17. Clinton County, Iowa
- Typical home price relative to income: 2.2 times higher than median income
- Median home list price in February 2025: $144,950 ($95 per square foot)
- Median household income: $65,177
- 1-year change in median list price: -35.7%
- Total number of listed homes in February 2025: 167
16. Northumberland County, Pennsylvania

- Typical home price relative to income: 2.2 times higher than median income
- Median home list price in February 2025: $128,250 ($86 per square foot)
- Median household income: $57,948
- 1-year change in median list price: -15.2%
- Total number of listed homes in February 2025: 167
15. Cambria County, Pennsylvania

- Typical home price relative to income: 2.2 times higher than median income
- Median home list price in February 2025: $123,750 ($81 per square foot)
- Median household income: $56,292
- 1-year change in median list price: +23.9%
- Total number of listed homes in February 2025: 224
14. Schuylkill County, Pennsylvania

- Typical home price relative to income: 2.2 times higher than median income
- Median home list price in February 2025: $147,000 ($94 per square foot)
- Median household income: $66,901
- 1-year change in median list price: +5.8%
- Total number of listed homes in February 2025: 407
13. Dallas County, Alabama

- Typical home price relative to income: 2.2 times higher than median income
- Median home list price in February 2025: $80,625 ($64 per square foot)
- Median household income: $36,810
- 1-year change in median list price: +3.0%
- Total number of listed homes in February 2025: 136
12. Vermilion County, Illinois
- Typical home price relative to income: 2.2 times higher than median income
- Median home list price in February 2025: $119,075 ($78 per square foot)
- Median household income: $54,537
- 1-year change in median list price: +35.4%
- Total number of listed homes in February 2025: 185
11. Lee County, Iowa

- Typical home price relative to income: 2.2 times higher than median income
- Median home list price in February 2025: $129,650 ($91 per square foot)
- Median household income: $59,803
- 1-year change in median list price: -3.3%
- Total number of listed homes in February 2025: 122
10. Dunklin County, Missouri

- Typical home price relative to income: 2.2 times higher than median income
- Median home list price in February 2025: $102,475 ($70 per square foot)
- Median household income: $47,368
- 1-year change in median list price: -14.6%
- Total number of listed homes in February 2025: 106
9. Rock Island County, Illinois

- Typical home price relative to income: 2.1 times higher than median income
- Median home list price in February 2025: $142,925 ($101 per square foot)
- Median household income: $66,768
- 1-year change in median list price: +7.5%
- Total number of listed homes in February 2025: 363
8. Tazewell County, Illinois

- Typical home price relative to income: 2.1 times higher than median income
- Median home list price in February 2025: $159,925 ($106 per square foot)
- Median household income: $76,704
- 1-year change in median list price: -6.4%
- Total number of listed homes in February 2025: 247
7. Knox County, Illinois

- Typical home price relative to income: 2.1 times higher than median income
- Median home list price in February 2025: $109,900 ($88 per square foot)
- Median household income: $53,291
- 1-year change in median list price: +15.8%
- Total number of listed homes in February 2025: 137
6. Henry County, Illinois

- Typical home price relative to income: 2.0 times higher than median income
- Median home list price in February 2025: $139,900 ($93 per square foot)
- Median household income: $69,912
- 1-year change in median list price: +5.8%
- Total number of listed homes in February 2025: 109
5. Franklin County, Illinois

- Typical home price relative to income: 1.9 times higher than median income
- Median home list price in February 2025: $102,400 ($77 per square foot)
- Median household income: $53,471
- 1-year change in median list price: -6.2%
- Total number of listed homes in February 2025: 136
4. Peoria County, Illinois

- Typical home price relative to income: 1.9 times higher than median income
- Median home list price in February 2025: $123,350 ($91 per square foot)
- Median household income: $64,938
- 1-year change in median list price: -1.3%
- Total number of listed homes in February 2025: 489
3. McDonough County, Illinois

- Typical home price relative to income: 1.9 times higher than median income
- Median home list price in February 2025: $95,250 ($68 per square foot)
- Median household income: $50,434
- 1-year change in median list price: +12.9%
- Total number of listed homes in February 2025: 111
2. Lawrence County, Pennsylvania

- Typical home price relative to income: 1.7 times higher than median income
- Median home list price in February 2025: $106,237 ($71 per square foot)
- Median household income: $60,779
- 1-year change in median list price: -17.6%
- Total number of listed homes in February 2025: 327
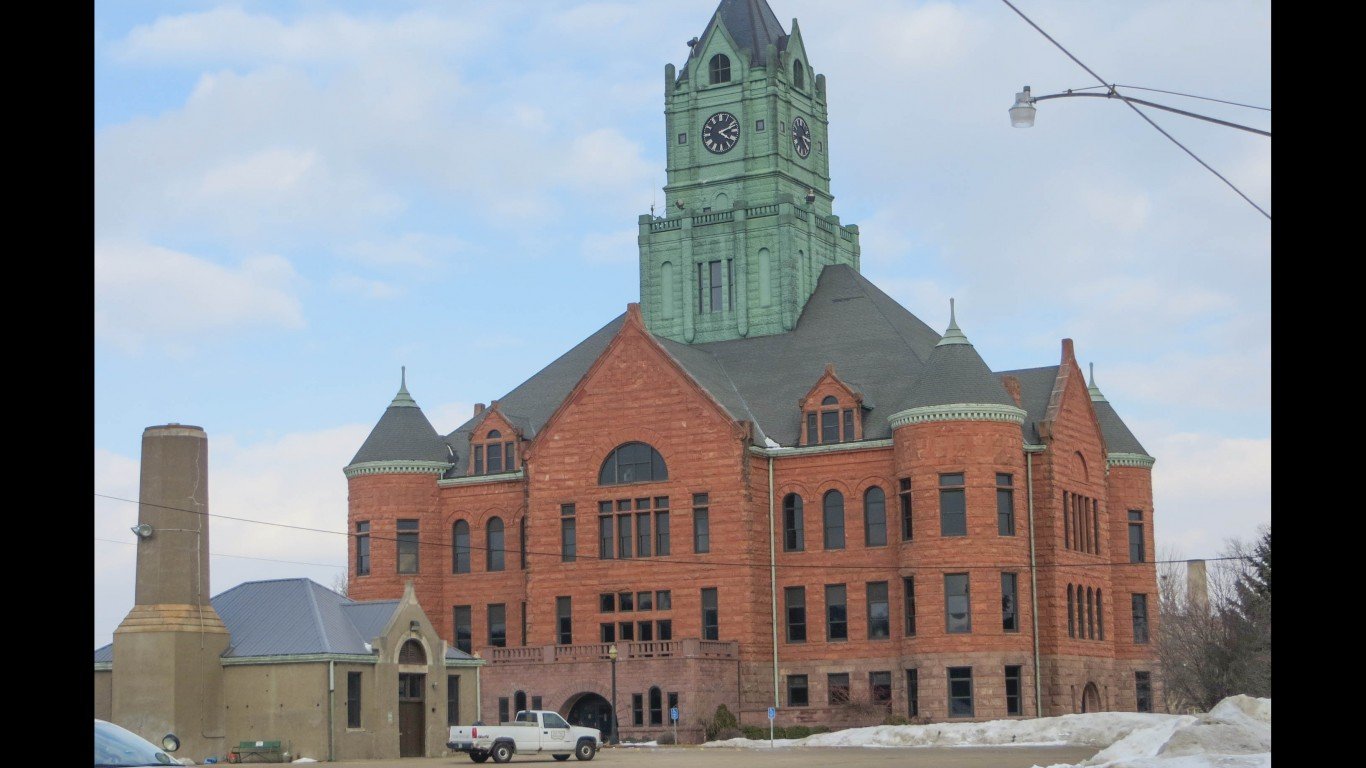
1. Fulton County, Illinois

- Typical home price relative to income: 1.4 times higher than median income
- Median home list price in February 2025: $84,950 ($65 per square foot)
- Median household income: $58,617
- 1-year change in median list price: -4.2%
- Total number of listed homes in February 2025: 106
The post The Typical House in This Beautiful American Town Only Costs $84,950 appeared first on 24/7 Wall St..