


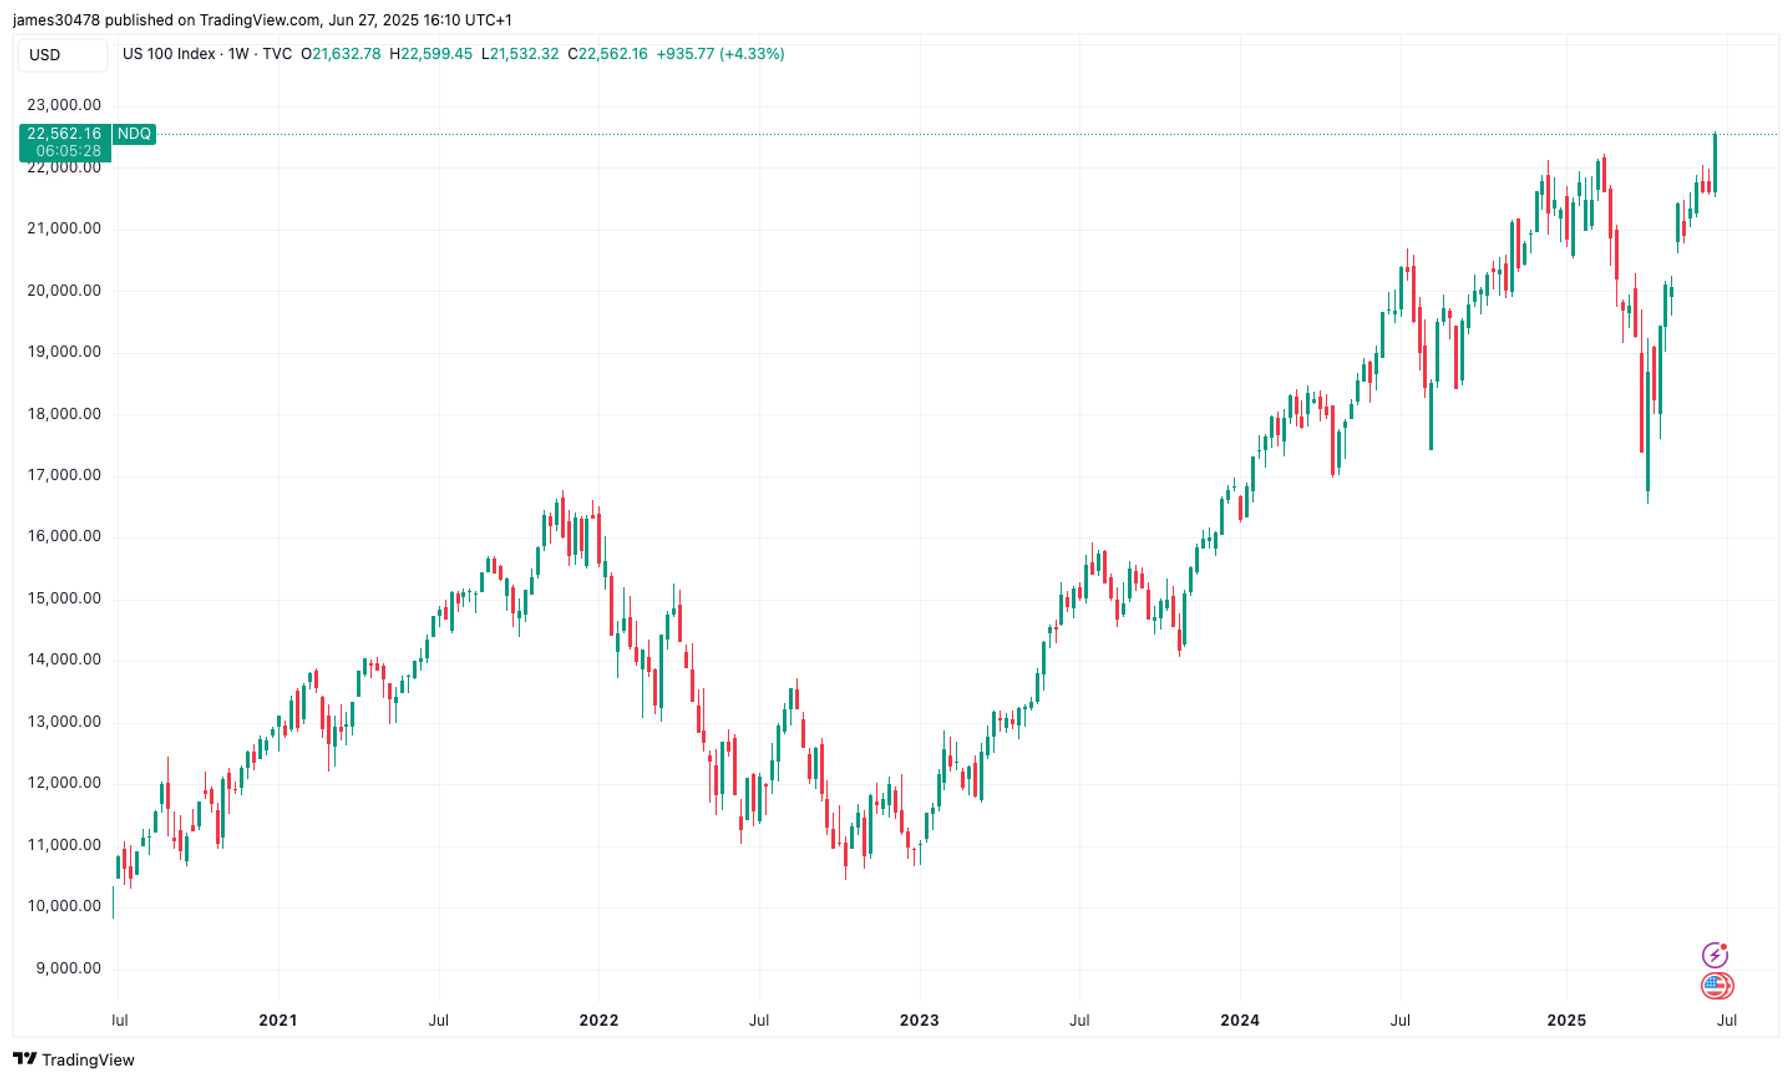


S&P 500 hits all-time high - Now what?
Here's what could happen to the S&P 500 index next.
The naysayers were once again proven wrong.
Despite an economy in turmoil, an uncertain Fed, and geopolitical unease, the S&P 500 has climbed the proverbial wall of worry and notched a new all-time high, surpassing levels last seen in February before President Trump's tariff announcements sent stocks reeling.
The S&P 500's returns have been impressive, gaining over 23% since President Trump switched gears and paused reciprocal tariffs for 90 days on April 9 to hammer out trade deals.
Related: Jim Cramer sends strong message on Nvidia stock at all-time highs
It's been an even more dramatic run for the technology-heavy Nasdaq Composite.
Since its early April low, that index has shot up over 32%, largely on the back of AI powerhouses like Nvidia and Palantir, which have gained 64% and 95% over the same period.
The moves will likely have many scratching their heads, wondering what could happen next to the benchmark index.
Fortunately, long-time analyst Ryan Detrick, chief strategist of Carson Group, has crunched the numbers to see what the S&P 500 historically has done in the wake of similar record-setting highs. 
Stocks suggest Fed blinks, economy avoids recession
The lifeblood of stock market returns is revenue and profit growth. The more sales and earnings, the more willing investors are to pay up for shares.
Because of this, economic health is key to the S&P 500's performance. If households and businesses are expected to open their wallets more in the future, it's good for business, and that's good for stock market returns.
Related: Veteran Tesla bull drops surprising 3-word verdict on robotaxi ride
Earlier this year, worries that tariffs would spike inflation, crimping spending, led many to believe we're on the cusp of stagflation (inflation without GDP growth) or an outright recession.
Those worries were compounded by the fact that the Federal Reserve hit the brakes on rate cuts this year due to concerns that lower rates alongside tariffs would cause inflation to skyrocket.
The concerns haven't fully disappeared, but they've retreated.
While US GDP growth in the first quarter was slightly negative, most expect GDP to recover in the second quarter and for full-year GDP to be positive.
The Federal Reserve pegs GDP growth at 1.4% this year, and the Atlanta Fed's GDPNow tracking tool suggests second-quarter GDP increased by 3.4%.
Of course, the GDPNow measure will change as more data arrives, but it's likely the second quarter numbers will be solid.
More Experts
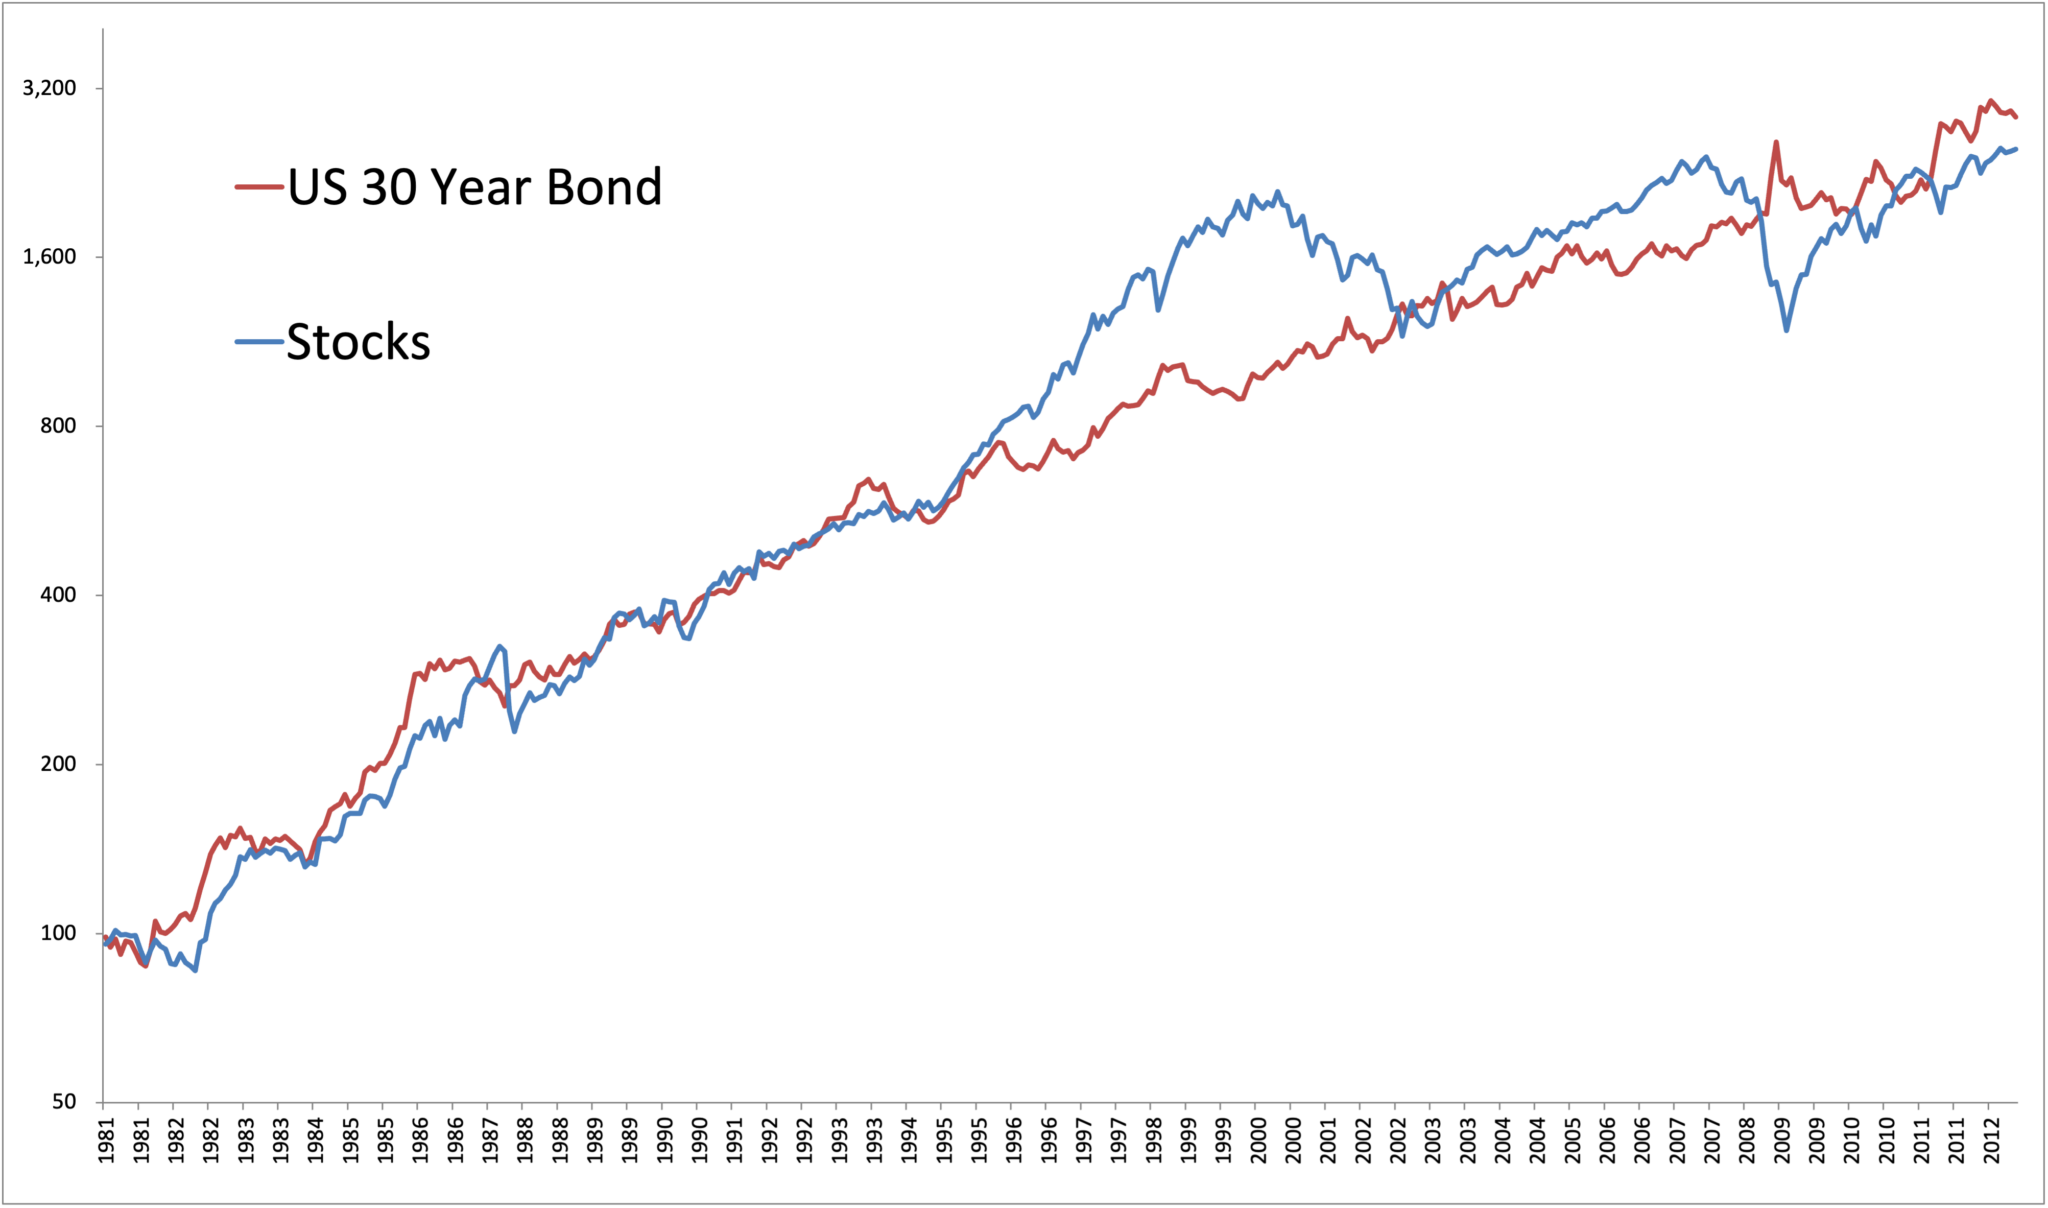
- Analyst makes bold call on stocks, bonds, and gold
- TheStreet Stocks & Markets Podcast #8: Common Sense Investing With David Miller
- Veteran fund manager sends dire message on stocks
If so, the US may sidestep a profit-busting economic reckoning, allowing investors to ratchet higher their models for corporate profit.
Additionally, the stock market has become more optimistic about the likelihood of Fed rate cuts later this year.
Fed Chair Jerome Powell is under intense pressure from President Trump for rate cuts, and a wobbly jobs market could mean that the Fed won't stay sidelined much longer as long as inflation remains in check.
In April, core Personal Consumption Expenditures (PCE) inflation, the gauge favored by the Fed, showed prices rose 2.5% from one year ago. That's above the Fed's 2% target but arguably not overly concerning, given that the Fed cut rates by 1% last year when inflation was higher.
Analyst crunches S&P 500 data for clues to what happens next
The S&P 500 may have priced in a lot of the potential upside associated with a healthier-than-expected economy.
The S&P 500's price-to-earnings ratio, a key valuation measure used by investors, peaked over 22 in February 2025 when the S&P 500 last made a new high.
After retreating to 19 in April, the runup in stock prices has outpaced upward earnings revisions, causing the S&P 500's P/E ratio to swell again. According to FactSet, the benchmark index trades with a forward one-year P/E ratio of nearly 22.
Historically, gains in the following year when the S&P 500's P/E ratio has been this high have been harder to come by, with a negative average return from 1971 through 2020. Image source: TheStreet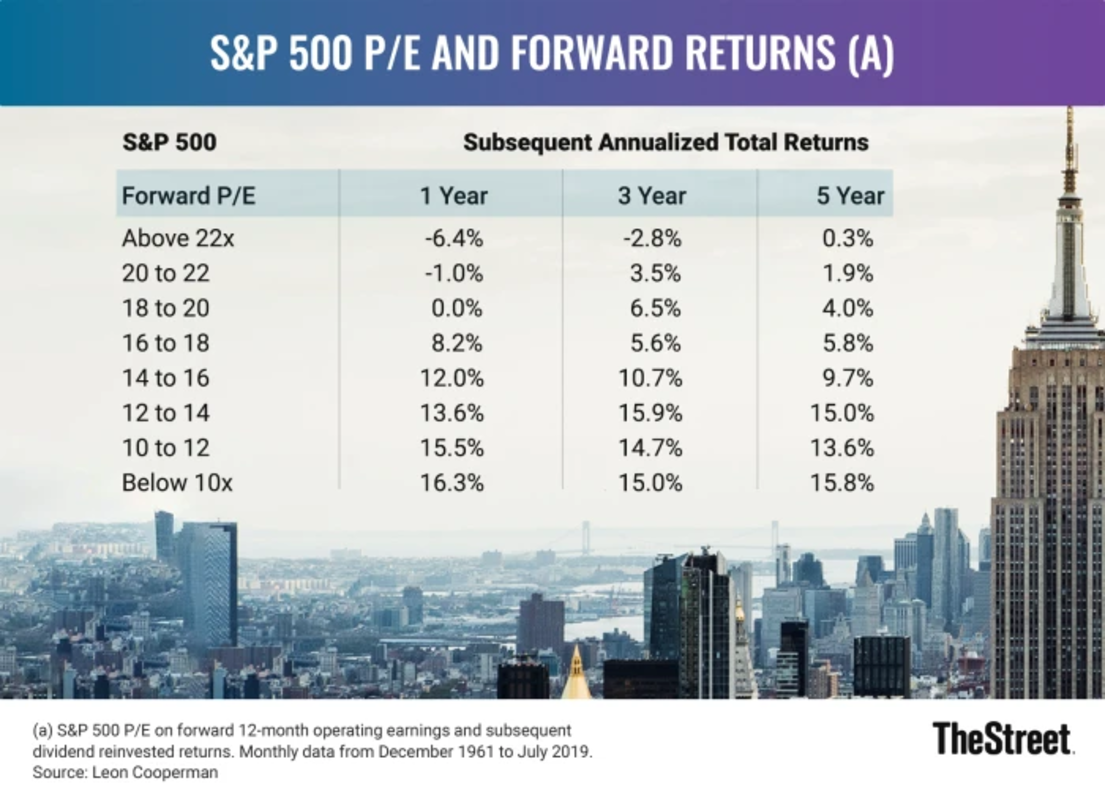
History certainly isn't a guarantee, but Ryan Detrick considered what's happened in the past when stocks have behaved similarly, and his study also suggests lackluster returns are possible from here.
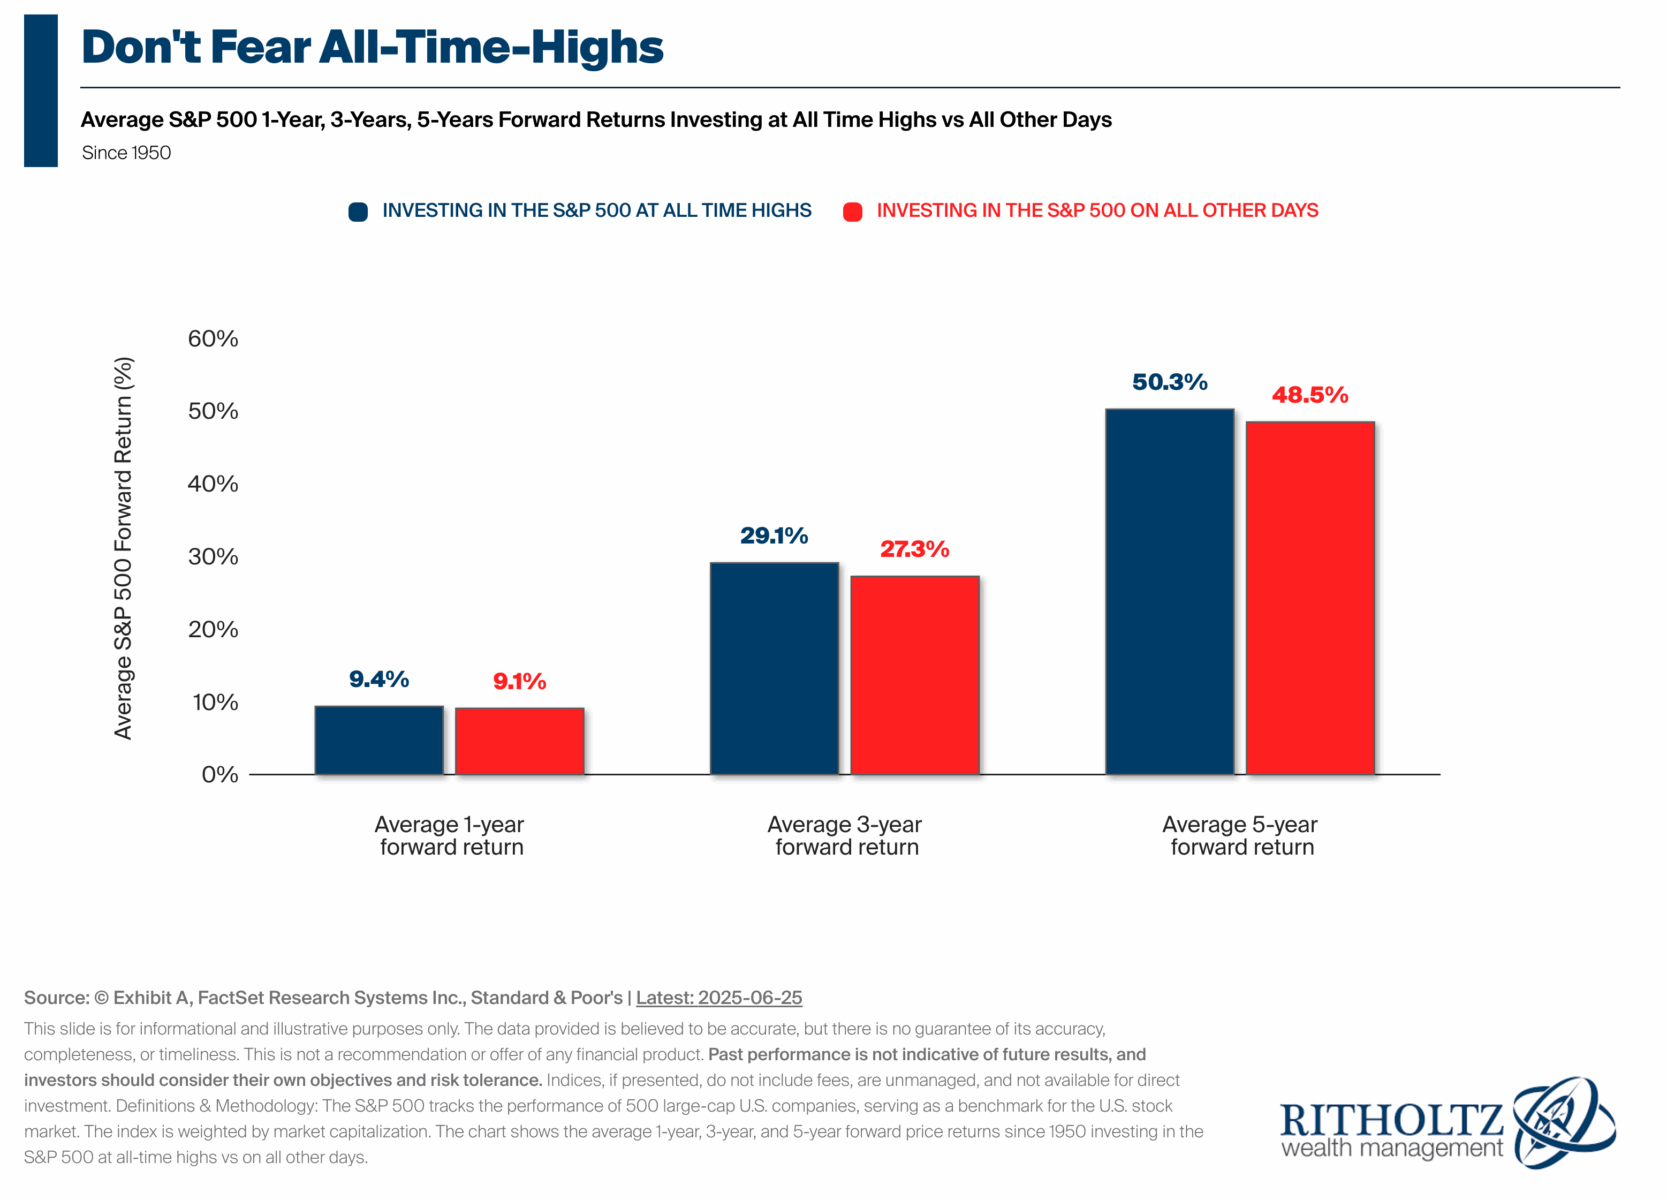
"The S&P 500 hasn't hit a new high in more than four months, but that could end any day now," wrote Detrick on X. "Turns out, when it goes between 4-12 months without a new ATH [all-time high] and then hits one, the forward returns are quite muted. Not once up double digits a year later. Hmm."
Detrick spotted four prior instances that met his criteria for similarity. The average return one year after notching the new high after not having a new high for between four and twelve months is just 4.4%, significantly below the stock market's average 11%-plus annual return over the past 50 years.
The shorter-term returns are potentially more concerning, though. In his study, the average 3-month and 6-month returns for the S&P 500 were negative 5% and negative 1.3%, respectively.
Of course, anything can happen. Much will depend on what actually happens with inflation, jobs, the Fed, and trade deals. Still, the data may suggest that investors should temper their outlook, at least for now.
It's not all bad news for most investors, though. Remember, stock market weakness can provide a great opportunity to buy the dip on the market or individual stocks. Just ask anyone who bought stocks in April.
Related: Legendary fund manager issues stock market prediction as S&P 500 tests all-time highs