


Richest County in Every State
The American Dream, a core tenet of how the U.S. perceives itself, is often defined by the belief that success and upward socioeconomic mobility are achievable through hard work and determination. But a recent study found that public confidence in the American Dream is fading. According to the Pew Research Center, only 53% of the […] The post Richest County in Every State appeared first on 24/7 Wall St..

The American Dream, a core tenet of how the U.S. perceives itself, is often defined by the belief that success and upward socioeconomic mobility are achievable through hard work and determination. But a recent study found that public confidence in the American Dream is fading. According to the Pew Research Center, only 53% of the U.S. population believe the American Dream is still possible, and 41% believe that while it was once possible, it no longer is.
Key Points
-
A growing body of evidence suggests that upward economic mobility is harder today for many Americans than it has been in previous decades.
-
Still, the United States remains the wealthiest country in the world — and every state in the country is home to communities that demonstrate the levels of prosperity that the U.S. economy can still secure.
-
Consulting a professional advisor can help you achieve financial security and independence. Click here to get started now.
The growing pessimism reflected in this survey is not entirely unfounded. According to a 2019 Pew study, Millennials — Americans born between 1981 and 1996 — are the first generation since at least Baby Boomers to have a lower inflation-adjusted income than the previous generation did at the same age. Depending on education level, the median household income among Millennials is 4% to 11% lower than that of Gen Xers at the same age. Additionally, in the ongoing housing crisis, 75% of American households cannot afford a new, median-priced home, according to the National Association of Home Builders.
But while the American Dream may be fading in some respects, there is also substantial evidence to the contrary. The United States economy is by far the largest in the world, and the country’s material wealth affords much of the population a relatively high standard of living. Although the U.S. accounts for only about 4% of the global population, it is also home to 38% of the world’s millionaires, according to the Swiss investment bank UBS.
Even though the nearly 22 million Americans who are millionaires represent a relatively small share of the total U.S. population, there are communities across the country characterized, in part, by high incomes and widespread prosperity.
Using five-year estimates from the U.S. Census Bureau’s 2023 American Community Survey, 24/7 Wall St. identified the richest county in every state. Within each state, we identified the county or county-equivalent with the highest median household income. Supplemental data on average cost of living by state and county are the latest estimates from the Bureau of Economic Analysis and the U.S. Department of Commerce. All other supplemental data are five-year estimates from the 2023 ACS.
Median household incomes among the places on this list range from about $83,000 to well over $150,000. For context, the median household income nationwide is about $78,500. Additionally, nearly every county on this list has a lower poverty rate than the state as a whole.
In many cases, high incomes in these areas are likely attributable, at least in part, to a strong job market. In the vast majority of counties on this list — 48 out of 50 — the five-year average annual jobless rate is lower than the comparable statewide unemployment rate, often by multiple percentage points. (Here is a look at the U.S. presidents who oversaw the best job markets in history.)
Partly because of above-average incomes, the places on this list also typically have a higher cost of living than the state as a whole. Higher consumer prices in these places are, in most cases, reflected in the real estate market, as home values also tend to be higher in these counties than they are in much of the rest of the state. (Here is a look at the least expensive counties to live in every state.)
These are the richest counties in every state.
Why It Matters
The United States is the wealthiest country in the world as measured by economic output, and as a result, it is also home to one of the wealthiest populations globally. Every state is home to at least one county where incomes are well above what is typical across the nation as a whole. These places generally have low poverty rates, strong job markets, and higher-than-average home values.
Alabama: Shelby County
- Median household income in county: $93,543 ($62,027 statewide)
- Poverty rate in county: 6.9% (15.6% statewide)
- Households earning at least $200,000 in county: 15.2% (7.2% statewide)
- Median home value in county: $298,700 ($195,100 statewide)
- 5-year avg. unemployment rate in county: 2.9% (4.8% statewide)
- Cost of living in county: 6.1% lower than national avg. (10.0% lower than national avg. statewide)
- Num. of counties considered in state: 67
Alaska: Aleutians West Census Area

- Median household income in census area: $107,344 ($89,336 statewide)
- Poverty rate in census area: 9.2% (10.2% statewide)
- Households earning at least $200,000 in census area: 14.0% (13.8% statewide)
- Median home value in census area: $419,100 ($333,300 statewide)
- 5-year avg. unemployment rate in census area: 4.1% (5.8% statewide)
- Cost of living in census area: 5.5% higher than national avg. (1.7% higher than national avg. statewide)
- Num. of county equivalents considered in state: 30
Arizona: Maricopa County

- Median household income in county: $85,518 ($76,872 statewide)
- Poverty rate in county: 11.3% (12.8% statewide)
- Households earning at least $200,000 in county: 12.9% (10.6% statewide)
- Median home value in county: $414,700 ($358,900 statewide)
- 5-year avg. unemployment rate in county: 4.6% (5.2% statewide)
- Cost of living in county: 0.4% lower than national avg. (1.1% higher than national avg. statewide)
- Num. of counties considered in state: 15
Arkansas: Benton County

- Median household income in county: $89,879 ($58,773 statewide)
- Poverty rate in county: 7.6% (16.0% statewide)
- Households earning at least $200,000 in county: 14.2% (6.3% statewide)
- Median home value in county: $285,100 ($175,300 statewide)
- 5-year avg. unemployment rate in county: 3.1% (5.1% statewide)
- Cost of living in county: 6.7% lower than national avg. (13.5% lower than national avg. statewide)
- Num. of counties considered in state: 75
California: Santa Clara County

- Median household income in county: $159,674 ($96,334 statewide)
- Poverty rate in county: 6.9% (12.0% statewide)
- Households earning at least $200,000 in county: 40.0% (19.4% statewide)
- Median home value in county: $1,382,800 ($695,400 statewide)
- 5-year avg. unemployment rate in county: 4.5% (6.4% statewide)
- Cost of living in county: 12.0% higher than national avg. (12.6% higher than national avg. statewide)
- Num. of counties considered in state: 58
Colorado: Douglas County

- Median household income in county: $145,737 ($92,470 statewide)
- Poverty rate in county: 3.2% (9.4% statewide)
- Households earning at least $200,000 in county: 30.6% (15.8% statewide)
- Median home value in county: $674,000 ($502,200 statewide)
- 5-year avg. unemployment rate in county: 3.6% (4.5% statewide)
- Cost of living in county: 16.2% higher than national avg. (1.4% higher than national avg. statewide)
- Num. of counties considered in state: 64
Connecticut: Western Connecticut Planning Region

- Median household income in planning region: $124,553 ($93,760 statewide)
- Poverty rate in planning region: 7.4% (10.0% statewide)
- Households earning at least $200,000 in planning region: 31.7% (18.2% statewide)
- Median home value in planning region: $625,400 ($343,200 statewide)
- 5-year avg. unemployment rate in planning region: 5.5% (5.6% statewide)
- Cost of living in planning region: N/A (3.7% higher than national avg. statewide)
- Num. of county equivalents considered in state: 9
Delaware: New Castle County
- Median household income in county: $89,901 ($82,855 statewide)
- Poverty rate in county: 10.2% (10.7% statewide)
- Households earning at least $200,000 in county: 14.1% (11.5% statewide)
- Median home value in county: $329,800 ($326,800 statewide)
- 5-year avg. unemployment rate in county: 4.9% (5.1% statewide)
- Cost of living in county: 1.3% lower than national avg. (0.7% lower than national avg. statewide)
- Num. of counties considered in state: 3
Florida: St. Johns County

- Median household income in county: $106,169 ($71,711 statewide)
- Poverty rate in county: 6.7% (12.6% statewide)
- Households earning at least $200,000 in county: 20.6% (10.1% statewide)
- Median home value in county: $457,600 ($325,000 statewide)
- 5-year avg. unemployment rate in county: 3.9% (4.8% statewide)
- Cost of living in county: 7.1% higher than national avg. (3.5% higher than national avg. statewide)
- Num. of counties considered in state: 67
Georgia: Forsyth County

- Median household income in county: $138,000 ($74,664 statewide)
- Poverty rate in county: 4.5% (13.5% statewide)
- Households earning at least $200,000 in county: 28.9% (11% statewide)
- Median home value in county: $493,800 ($272,900 statewide)
- 5-year avg. unemployment rate in county: 3.4% (5.1% statewide)
- Cost of living in county: 4.3% higher than national avg. (3.3% lower than national avg. statewide)
- Num. of counties considered in state: 159
Hawaii: Honolulu County

- Median household income in county: $104,264 ($98,317 statewide)
- Poverty rate in county: 9.1% (10.0% statewide)
- Households earning at least $200,000 in county: 19.1% (17.5% statewide)
- Median home value in county: $873,000 ($808,200 statewide)
- 5-year avg. unemployment rate in county: 4.8% (5.0% statewide)
- Cost of living in county: 14.0% higher than national avg. (8.6% higher than national avg. statewide)
- Num. of counties considered in state: 5
Idaho: Teton County

- Median household income in county: $90,740 ($74,636 statewide)
- Poverty rate in county: 9.4% (10.6% statewide)
- Households earning at least $200,000 in county: 13.0% (8.4% statewide)
- Median home value in county: $595,900 ($376,000 statewide)
- 5-year avg. unemployment rate in county: 1.5% (3.7% statewide)
- Cost of living in county: 7.5% higher than national avg. (8.6% lower than national avg. statewide)
- Num. of counties considered in state: 44
Illinois: DuPage County

- Median household income in county: $110,502 ($81,702 statewide)
- Poverty rate in county: 6.4% (11.7% statewide)
- Households earning at least $200,000 in county: 21.6% (13.1% statewide)
- Median home value in county: $374,100 ($250,500 statewide)
- 5-year avg. unemployment rate in county: 4.8% (5.8% statewide)
- Cost of living in county: 11.3% higher than national avg. (1.1% lower than national avg. statewide)
- Num. of counties considered in state: 102
Indiana: Hamilton County

- Median household income in county: $117,957 ($70,051 statewide)
- Poverty rate in county: 4.3% (12.2% statewide)
- Households earning at least $200,000 in county: 24.2% (7.6% statewide)
- Median home value in county: $379,100 ($201,600 statewide)
- 5-year avg. unemployment rate in county: 2.8% (4.3% statewide)
- Cost of living in county: 2.6% higher than national avg. (7.8% lower than national avg. statewide)
- Num. of counties considered in state: 92
Iowa: Dallas County
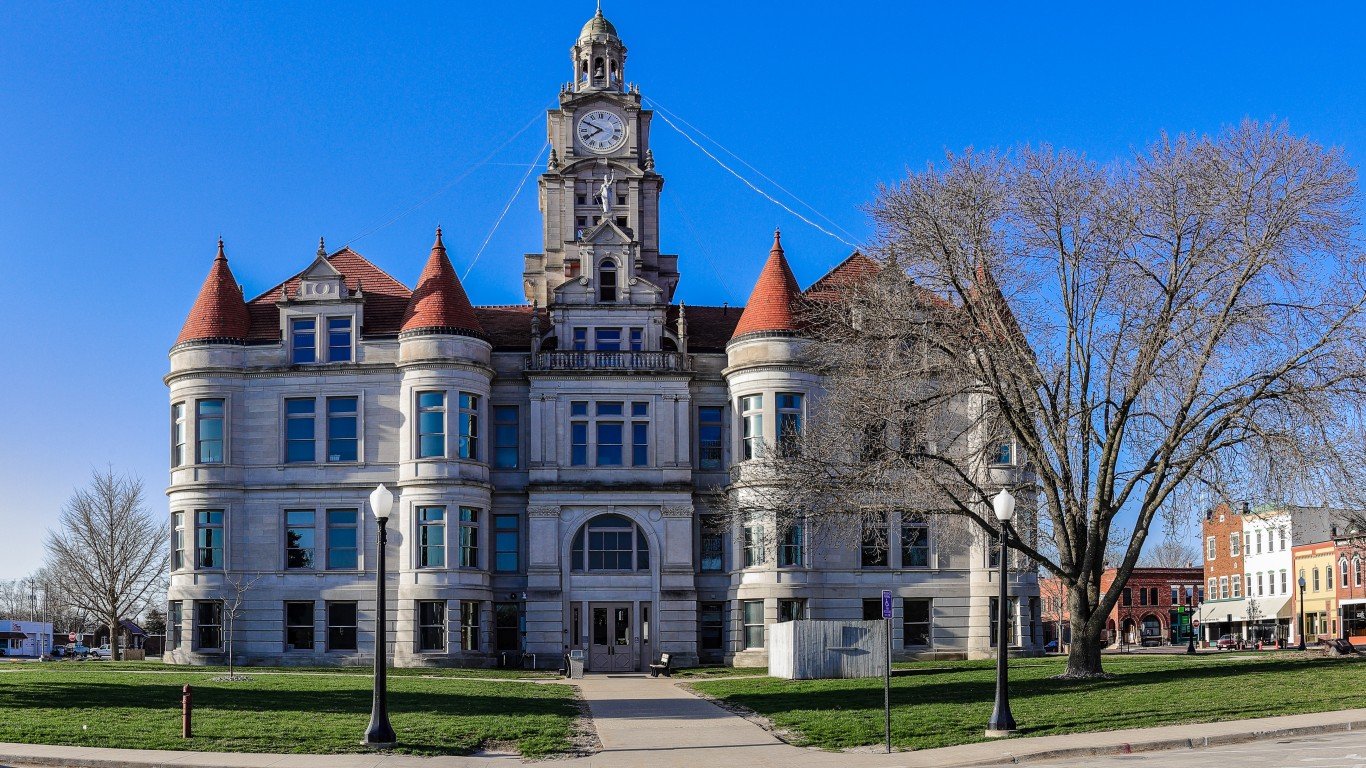
- Median household income in county: $102,349 ($73,147 statewide)
- Poverty rate in county: 5.8% (11.0% statewide)
- Households earning at least $200,000 in county: 18.0% (8% statewide)
- Median home value in county: $333,400 ($195,900 statewide)
- 5-year avg. unemployment rate in county: 2.9% (3.6% statewide)
- Cost of living in county: 5.2% lower than national avg. (11.2% lower than national avg. statewide)
- Num. of counties considered in state: 99
Kansas: Johnson County

- Median household income in county: $107,261 ($72,639 statewide)
- Poverty rate in county: 5.3% (11.5% statewide)
- Households earning at least $200,000 in county: 19.4% (8.8% statewide)
- Median home value in county: $366,000 ($203,400 statewide)
- 5-year avg. unemployment rate in county: 3.2% (3.9% statewide)
- Cost of living in county: 1.6% lower than national avg. (10.0% lower than national avg. statewide)
- Num. of counties considered in state: 105
Kentucky: Oldham County
- Median household income in county: $121,491 ($62,417 statewide)
- Poverty rate in county: 4.0% (16.1% statewide)
- Households earning at least $200,000 in county: 22.7% (6.7% statewide)
- Median home value in county: $375,000 ($192,300 statewide)
- 5-year avg. unemployment rate in county: 3.3% (4.8% statewide)
- Cost of living in county: 6.6% lower than national avg. (9.5% lower than national avg. statewide)
- Num. of counties considered in state: 120
Louisiana: Ascension Parish
- Median household income in parish: $92,266 ($60,023 statewide)
- Poverty rate in parish: 10.3% (18.9% statewide)
- Households earning at least $200,000 in parish: 13.5% (7.4% statewide)
- Median home value in parish: $265,300 ($208,700 statewide)
- 5-year avg. unemployment rate in parish: 4.5% (6.3% statewide)
- Cost of living in parish: 6.0% lower than national avg. (11.7% lower than national avg. statewide)
- Num. of parishes considered in state: 64
Maine: Cumberland County

- Median household income in county: $92,983 ($71,773 statewide)
- Poverty rate in county: 7.1% (10.8% statewide)
- Households earning at least $200,000 in county: 14.9% (8.4% statewide)
- Median home value in county: $411,400 ($266,400 statewide)
- 5-year avg. unemployment rate in county: 3.2% (3.9% statewide)
- Cost of living in county: 3.9% higher than national avg. (2.9% lower than national avg. statewide)
- Num. of counties considered in state: 16
Maryland: Howard County

- Median household income in county: $146,982 ($101,652 statewide)
- Poverty rate in county: 5.1% (9.3% statewide)
- Households earning at least $200,000 in county: 33.7% (19.2% statewide)
- Median home value in county: $576,700 ($397,700 statewide)
- 5-year avg. unemployment rate in county: 3.6% (4.9% statewide)
- Cost of living in county: 13.2% higher than national avg. (4.0% higher than national avg. statewide)
- Num. of counties considered in state: 24
Massachusetts: Middlesex County

- Median household income in county: $126,779 ($101,341 statewide)
- Poverty rate in county: 7.5% (10.0% statewide)
- Households earning at least $200,000 in county: 29.6% (21.1% statewide)
- Median home value in county: $687,200 ($525,800 statewide)
- 5-year avg. unemployment rate in county: 4.2% (5.1% statewide)
- Cost of living in county: 12.5% higher than national avg. (8.2% higher than national avg. statewide)
- Num. of counties considered in state: 14
Michigan: Livingston County
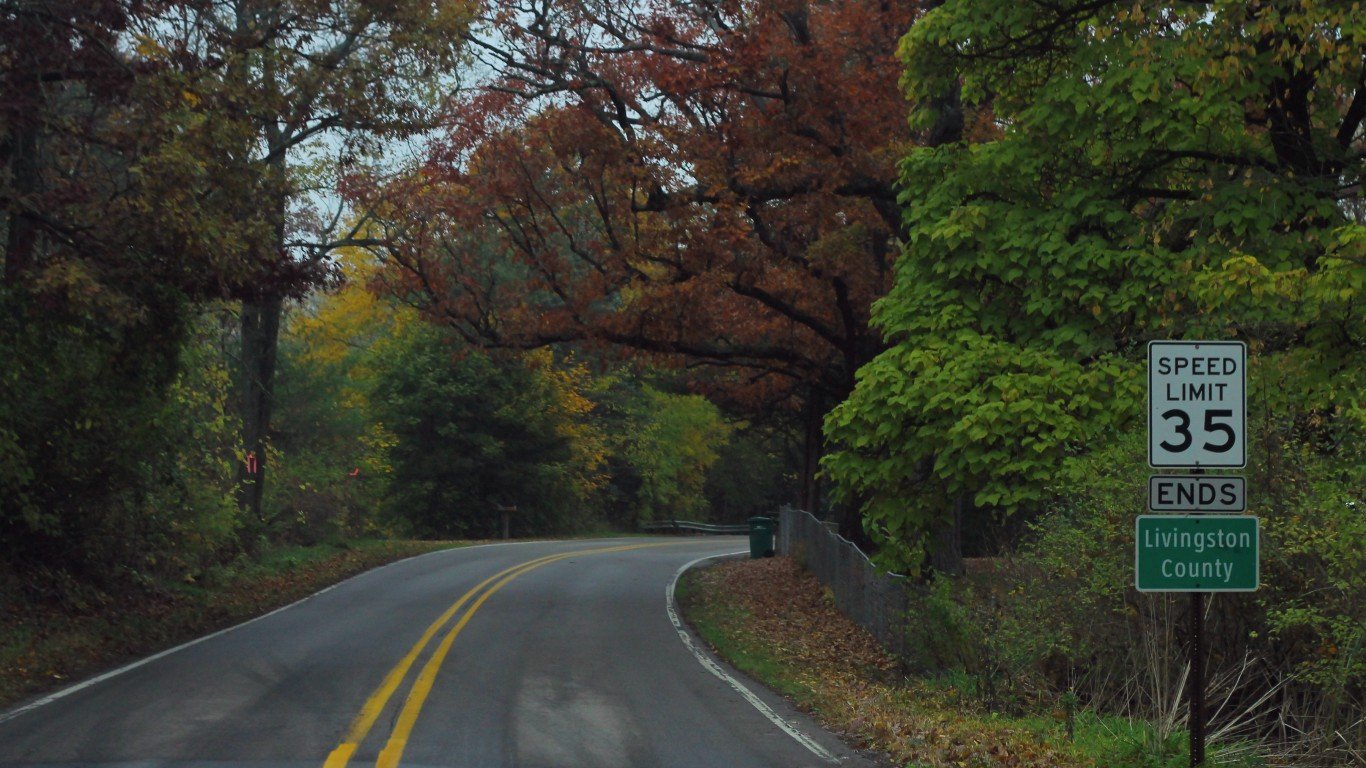
- Median household income in county: $101,315 ($71,149 statewide)
- Poverty rate in county: 4.9% (13.1% statewide)
- Households earning at least $200,000 in county: 16.2% (9% statewide)
- Median home value in county: $331,100 ($217,600 statewide)
- 5-year avg. unemployment rate in county: 3.7% (5.8% statewide)
- Cost of living in county: 1.1% lower than national avg. (5.8% lower than national avg. statewide)
- Num. of counties considered in state: 83
Minnesota: Carver County

- Median household income in county: $123,144 ($87,556 statewide)
- Poverty rate in county: 4.2% (9.2% statewide)
- Households earning at least $200,000 in county: 25.1% (13.1% statewide)
- Median home value in county: $426,900 ($305,500 statewide)
- 5-year avg. unemployment rate in county: 3.1% (3.9% statewide)
- Cost of living in county: 8.1% higher than national avg. (1.6% lower than national avg. statewide)
- Num. of counties considered in state: 87
Mississippi: DeSoto County

- Median household income in county: $82,980 ($54,915 statewide)
- Poverty rate in county: 10.0% (19.1% statewide)
- Households earning at least $200,000 in county: 8.2% (5.3% statewide)
- Median home value in county: $248,700 ($161,400 statewide)
- 5-year avg. unemployment rate in county: 3.7% (6.0% statewide)
- Cost of living in county: 9.6% lower than national avg. (12.7% lower than national avg. statewide)
- Num. of counties considered in state: 82
Missouri: St. Charles County
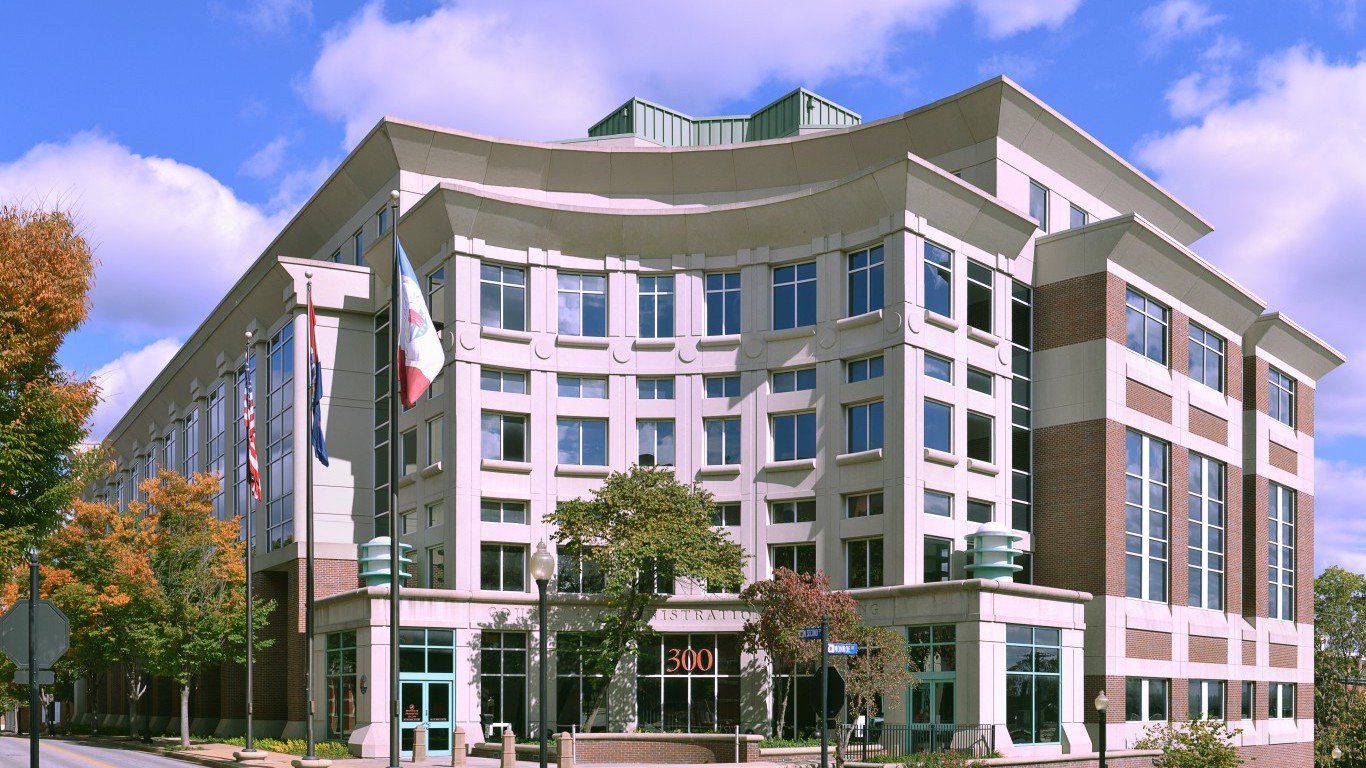
- Median household income in county: $102,912 ($68,920 statewide)
- Poverty rate in county: 4.7% (12.6% statewide)
- Households earning at least $200,000 in county: 15.1% (8.1% statewide)
- Median home value in county: $296,800 ($215,600 statewide)
- 5-year avg. unemployment rate in county: 2.8% (4.1% statewide)
- Cost of living in county: 1.9% lower than national avg. (8.2% lower than national avg. statewide)
- Num. of counties considered in state: 115
Montana: Gallatin County

- Median household income in county: $87,454 ($69,922 statewide)
- Poverty rate in county: 10.2% (12.0% statewide)
- Households earning at least $200,000 in county: 14.0% (8.1% statewide)
- Median home value in county: $604,900 ($338,100 statewide)
- 5-year avg. unemployment rate in county: 2.3% (3.8% statewide)
- Cost of living in county: 2.1% lower than national avg. (9.8% lower than national avg. statewide)
- Num. of counties considered in state: 56
Nebraska: Sarpy County
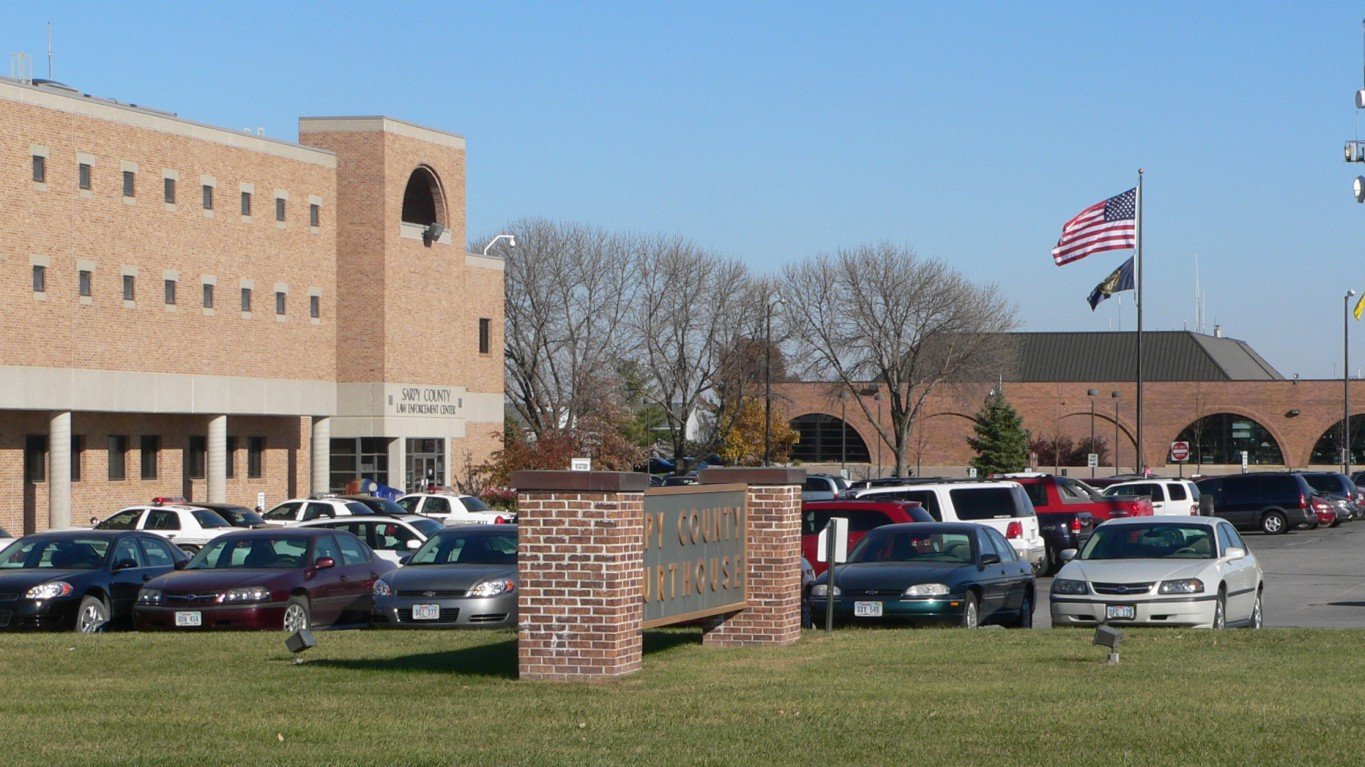
- Median household income in county: $101,402 ($74,985 statewide)
- Poverty rate in county: 5.2% (10.3% statewide)
- Households earning at least $200,000 in county: 14.3% (9% statewide)
- Median home value in county: $287,600 ($223,800 statewide)
- 5-year avg. unemployment rate in county: 2.4% (3.0% statewide)
- Cost of living in county: 5.9% lower than national avg. (9.6% lower than national avg. statewide)
- Num. of counties considered in state: 93
Nevada: Storey County
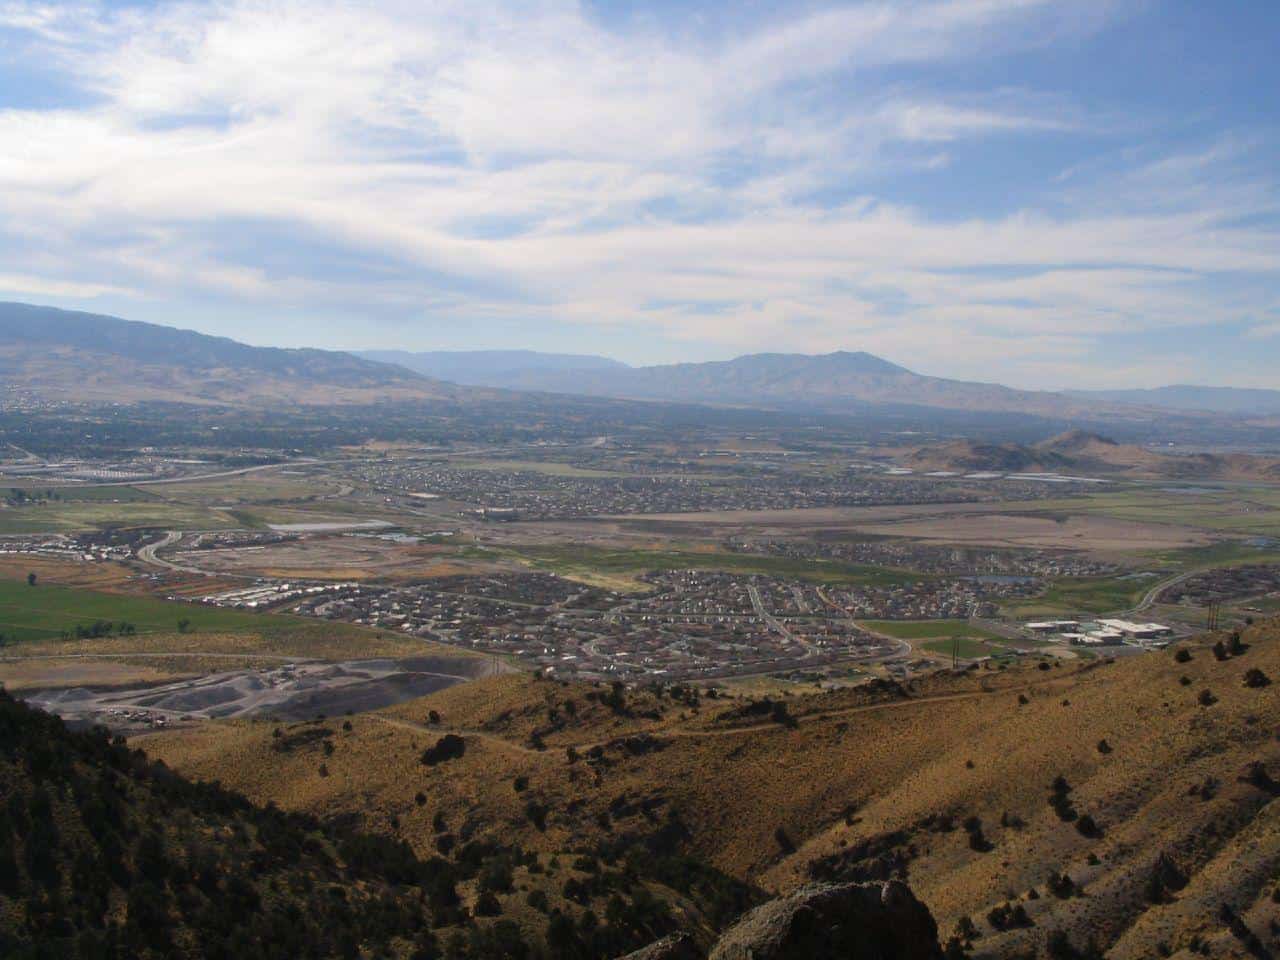
- Median household income in county: $96,000 ($75,561 statewide)
- Poverty rate in county: 7.1% (12.6% statewide)
- Households earning at least $200,000 in county: 8.1% (9.8% statewide)
- Median home value in county: $393,100 ($406,100 statewide)
- 5-year avg. unemployment rate in county: 6.8% (6.8% statewide)
- Cost of living in county: 8.2% lower than national avg. (3.0% lower than national avg. statewide)
- Num. of counties considered in state: 16
New Hampshire: Rockingham County

- Median household income in county: $113,927 ($95,628 statewide)
- Poverty rate in county: 4.8% (7.2% statewide)
- Households earning at least $200,000 in county: 21.6% (15.7% statewide)
- Median home value in county: $461,400 ($367,200 statewide)
- 5-year avg. unemployment rate in county: 3.5% (3.4% statewide)
- Cost of living in county: 4.4% higher than national avg. (5.3% higher than national avg. statewide)
- Num. of counties considered in state: 10
New Jersey: Hunterdon County

- Median household income in county: $139,453 ($101,050 statewide)
- Poverty rate in county: 3.8% (9.8% statewide)
- Households earning at least $200,000 in county: 31.4% (20.7% statewide)
- Median home value in county: $498,800 ($427,600 statewide)
- 5-year avg. unemployment rate in county: 4.6% (6.2% statewide)
- Cost of living in county: 9.9% higher than national avg. (8.9% higher than national avg. statewide)
- Num. of counties considered in state: 21
New Mexico: Los Alamos County

- Median household income in county: $143,188 ($62,125 statewide)
- Poverty rate in county: 2.9% (18.1% statewide)
- Households earning at least $200,000 in county: 27.3% (7.1% statewide)
- Median home value in county: $452,500 ($232,200 statewide)
- 5-year avg. unemployment rate in county: 2.2% (6.0% statewide)
- Cost of living in county: 5.1% lower than national avg. (9.6% lower than national avg. statewide)
- Num. of counties considered in state: 33
New York: Nassau County

- Median household income in county: $143,408 ($84,578 statewide)
- Poverty rate in county: 5.3% (13.7% statewide)
- Households earning at least $200,000 in county: 33.4% (16.4% statewide)
- Median home value in county: $658,700 ($403,000 statewide)
- 5-year avg. unemployment rate in county: 4.8% (6.2% statewide)
- Cost of living in county: 20.6% higher than national avg. (7.6% higher than national avg. statewide)
- Num. of counties considered in state: 62
North Carolina: Wake County

- Median household income in county: $101,763 ($69,904 statewide)
- Poverty rate in county: 7.9% (13.2% statewide)
- Households earning at least $200,000 in county: 19.3% (9.5% statewide)
- Median home value in county: $422,800 ($259,400 statewide)
- 5-year avg. unemployment rate in county: 4.2% (4.8% statewide)
- Cost of living in county: 0.3% lower than national avg. (5.9% lower than national avg. statewide)
- Num. of counties considered in state: 100
North Dakota: Burke County
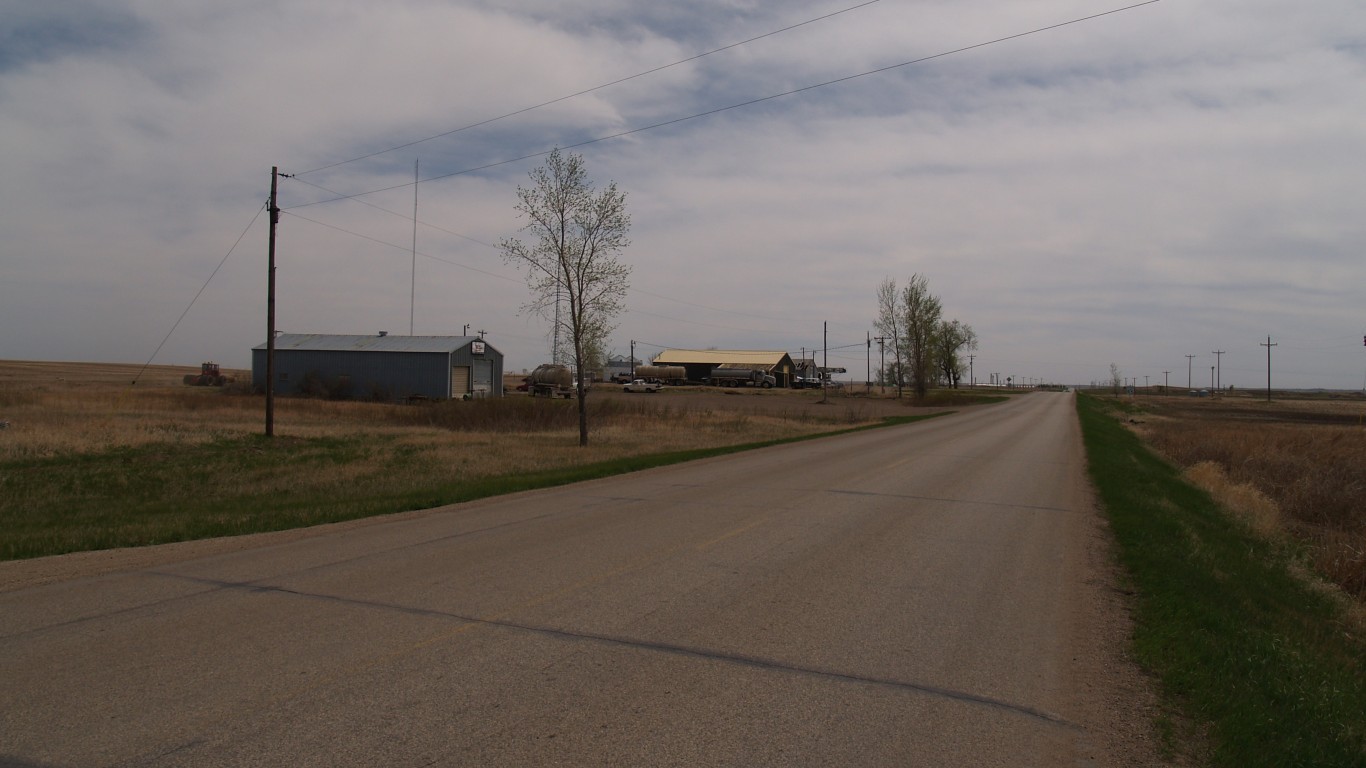
- Median household income in county: $96,339 ($75,949 statewide)
- Poverty rate in county: 5.1% (10.6% statewide)
- Households earning at least $200,000 in county: 19.8% (9.2% statewide)
- Median home value in county: $141,900 ($241,100 statewide)
- 5-year avg. unemployment rate in county: 4.4% (2.8% statewide)
- Cost of living in county: 11.4% lower than national avg. (11.4% lower than national avg. statewide)
- Num. of counties considered in state: 53
Ohio: Delaware County
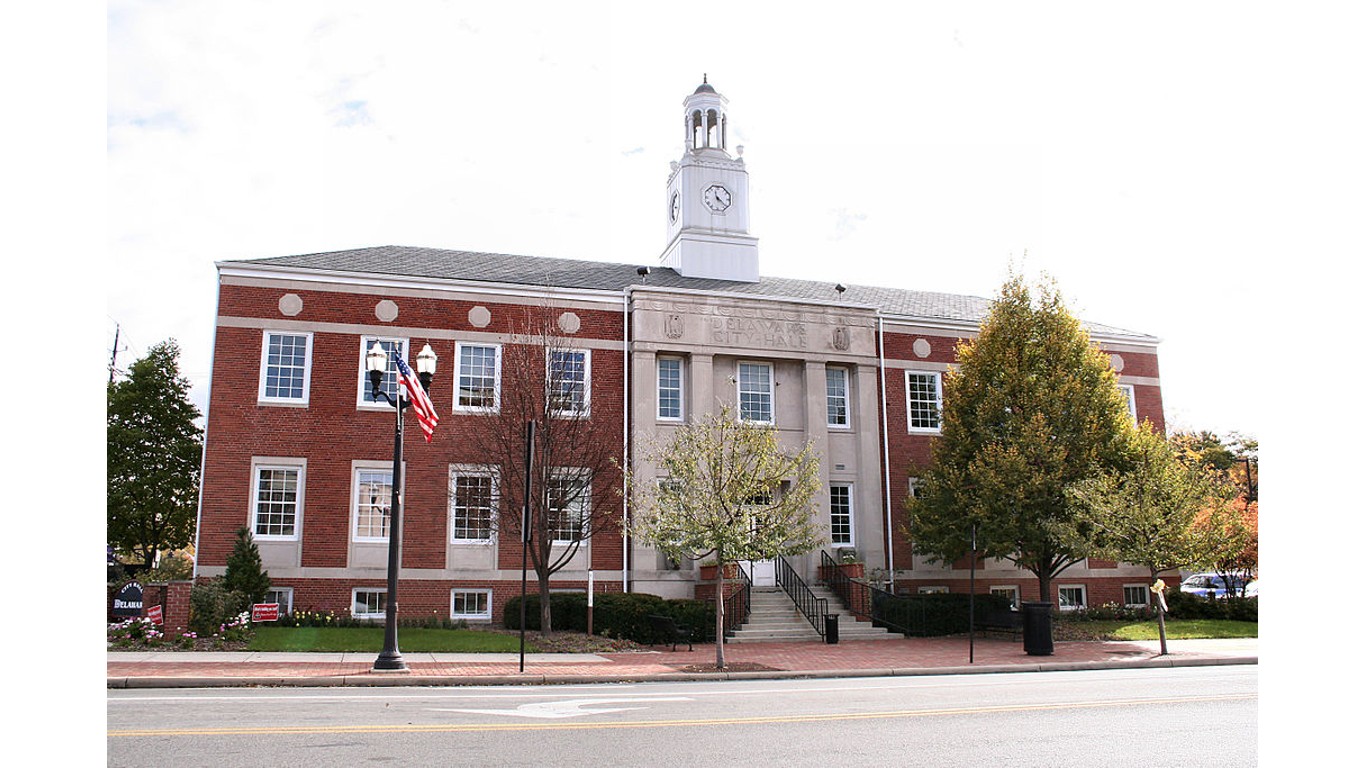
- Median household income in county: $130,088 ($69,680 statewide)
- Poverty rate in county: 5.0% (13.2% statewide)
- Households earning at least $200,000 in county: 27.3% (8.5% statewide)
- Median home value in county: $419,500 ($199,200 statewide)
- 5-year avg. unemployment rate in county: 3.0% (4.8% statewide)
- Cost of living in county: 0.5% lower than national avg. (8.2% lower than national avg. statewide)
- Num. of counties considered in state: 88
Oklahoma: Canadian County
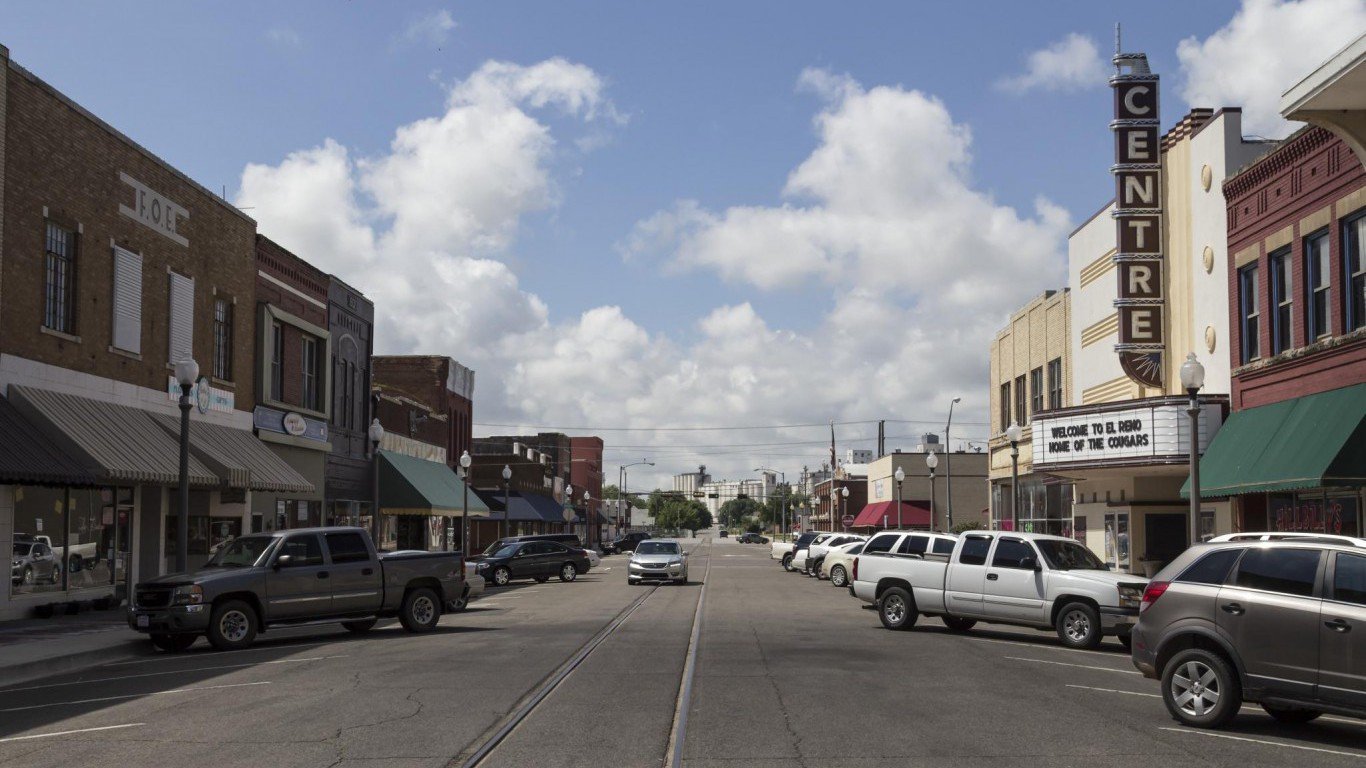
- Median household income in county: $85,427 ($63,603 statewide)
- Poverty rate in county: 8.6% (15.3% statewide)
- Households earning at least $200,000 in county: 8.1% (6.9% statewide)
- Median home value in county: $230,300 ($185,900 statewide)
- 5-year avg. unemployment rate in county: 4.0% (4.9% statewide)
- Cost of living in county: 6.2% lower than national avg. (11.7% lower than national avg. statewide)
- Num. of counties considered in state: 77
Oregon: Washington County

- Median household income in county: $104,434 ($80,426 statewide)
- Poverty rate in county: 8.0% (11.9% statewide)
- Households earning at least $200,000 in county: 18.6% (11.8% statewide)
- Median home value in county: $558,500 ($454,200 statewide)
- 5-year avg. unemployment rate in county: 4.5% (5.4% statewide)
- Cost of living in county: 7.3% higher than national avg. (4.7% higher than national avg. statewide)
- Num. of counties considered in state: 36
Pennsylvania: Chester County

- Median household income in county: $123,041 ($76,081 statewide)
- Poverty rate in county: 5.9% (11.8% statewide)
- Households earning at least $200,000 in county: 27.3% (11.1% statewide)
- Median home value in county: $461,800 ($240,500 statewide)
- 5-year avg. unemployment rate in county: 3.8% (5.2% statewide)
- Cost of living in county: 3.1% higher than national avg. (2.5% lower than national avg. statewide)
- Num. of counties considered in state: 67
Rhode Island: Bristol County

- Median household income in county: $110,926 ($86,372 statewide)
- Poverty rate in county: 6.8% (10.9% statewide)
- Households earning at least $200,000 in county: 22.3% (12.9% statewide)
- Median home value in county: $468,000 ($368,800 statewide)
- 5-year avg. unemployment rate in county: 3.1% (5.7% statewide)
- Cost of living in county: 10.8% higher than national avg. (1.4% higher than national avg. statewide)
- Num. of counties considered in state: 5
South Carolina: Beaufort County

- Median household income in county: $84,819 ($66,818 statewide)
- Poverty rate in county: 10.5% (14.2% statewide)
- Households earning at least $200,000 in county: 14.7% (8.3% statewide)
- Median home value in county: $407,600 ($236,700 statewide)
- 5-year avg. unemployment rate in county: 3.0% (5.0% statewide)
- Cost of living in county: 0.3% lower than national avg. (6.8% lower than national avg. statewide)
- Num. of counties considered in state: 46
South Dakota: Lincoln County
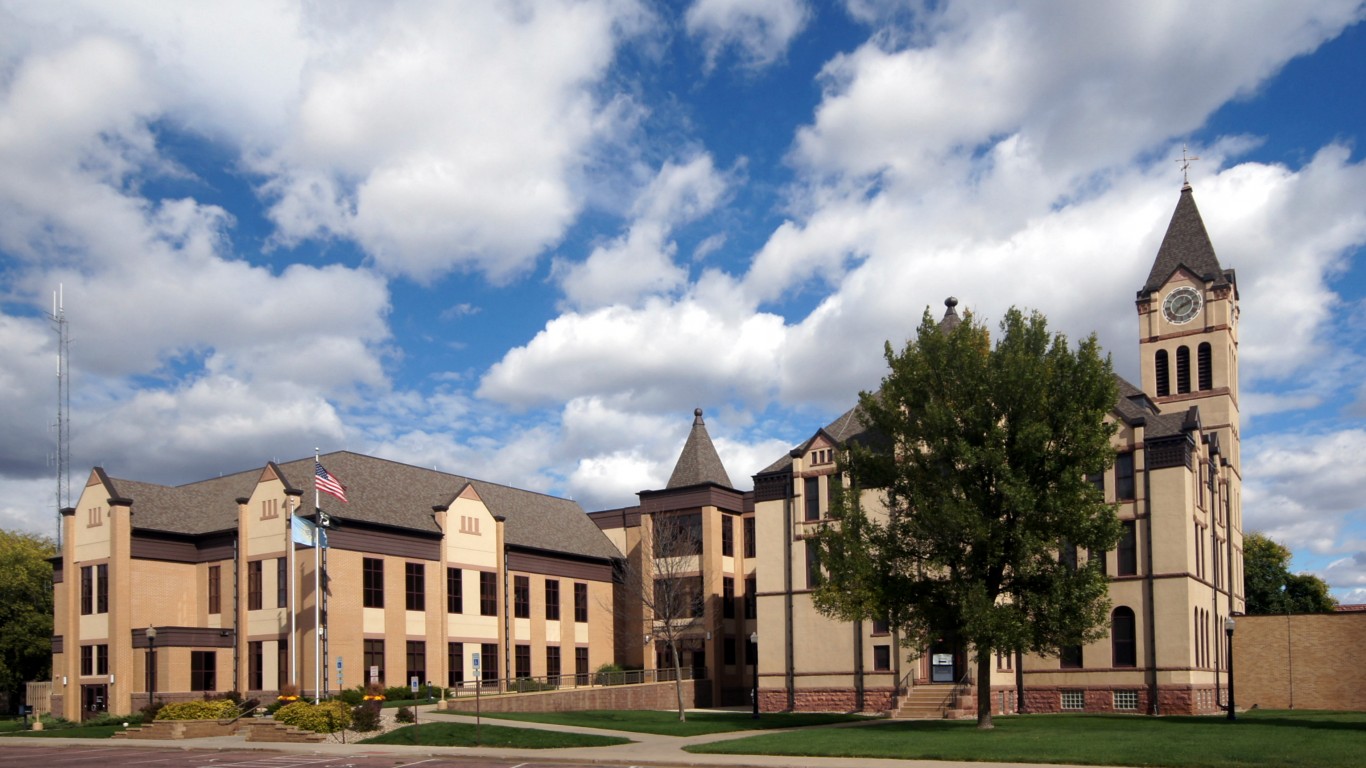
- Median household income in county: $96,552 ($72,421 statewide)
- Poverty rate in county: 5.8% (12.0% statewide)
- Households earning at least $200,000 in county: 11.7% (7.4% statewide)
- Median home value in county: $323,500 ($236,800 statewide)
- 5-year avg. unemployment rate in county: 1.6% (3.0% statewide)
- Cost of living in county: 4.2% lower than national avg. (11.9% lower than national avg. statewide)
- Num. of counties considered in state: 66
Tennessee: Williamson County
- Median household income in county: $131,202 ($67,097 statewide)
- Poverty rate in county: 4.5% (13.8% statewide)
- Households earning at least $200,000 in county: 29.2% (8.3% statewide)
- Median home value in county: $673,700 ($256,800 statewide)
- 5-year avg. unemployment rate in county: 2.0% (4.7% statewide)
- Cost of living in county: 4.3% higher than national avg. (7.5% lower than national avg. statewide)
- Num. of counties considered in state: 95
Texas: Rockwall County

- Median household income in county: $124,917 ($76,292 statewide)
- Poverty rate in county: 4.3% (13.8% statewide)
- Households earning at least $200,000 in county: 23.3% (11.7% statewide)
- Median home value in county: $386,000 ($260,400 statewide)
- 5-year avg. unemployment rate in county: 4.0% (5.1% statewide)
- Cost of living in county: 8.1% higher than national avg. (2.8% lower than national avg. statewide)
- Num. of counties considered in state: 253
Utah: Summit County

- Median household income in county: $137,058 ($91,750 statewide)
- Poverty rate in county: 4.5% (8.6% statewide)
- Households earning at least $200,000 in county: 33.2% (12.6% statewide)
- Median home value in county: $1,000,400 ($455,000 statewide)
- 5-year avg. unemployment rate in county: 2.1% (3.4% statewide)
- Cost of living in county: 11.0% higher than national avg. (5.0% lower than national avg. statewide)
- Num. of counties considered in state: 29
Vermont: Chittenden County
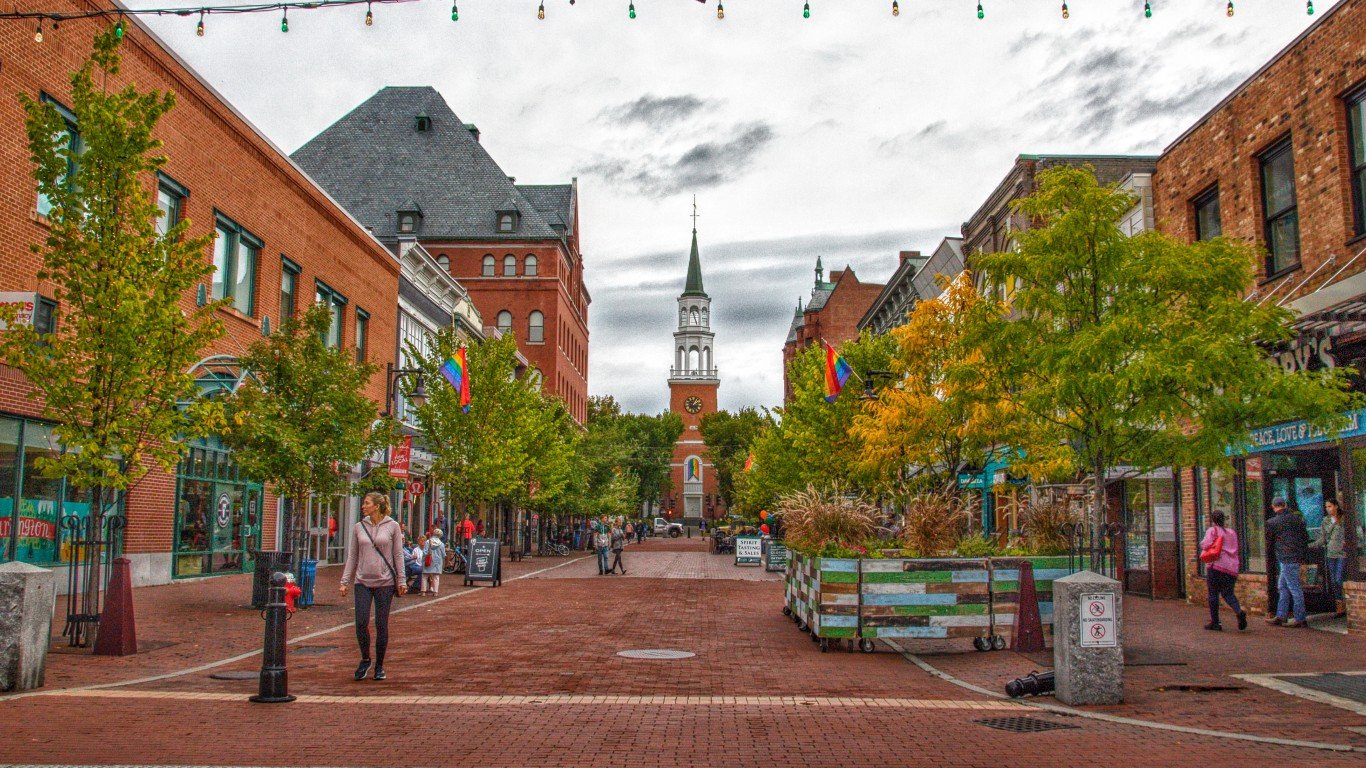
- Median household income in county: $94,310 ($78,024 statewide)
- Poverty rate in county: 10.4% (10.3% statewide)
- Households earning at least $200,000 in county: 14.9% (10.2% statewide)
- Median home value in county: $404,500 ($290,500 statewide)
- 5-year avg. unemployment rate in county: 3.7% (3.7% statewide)
- Cost of living in county: 4.6% higher than national avg. (3.4% lower than national avg. statewide)
- Num. of counties considered in state: 14
Virginia: Loudoun County
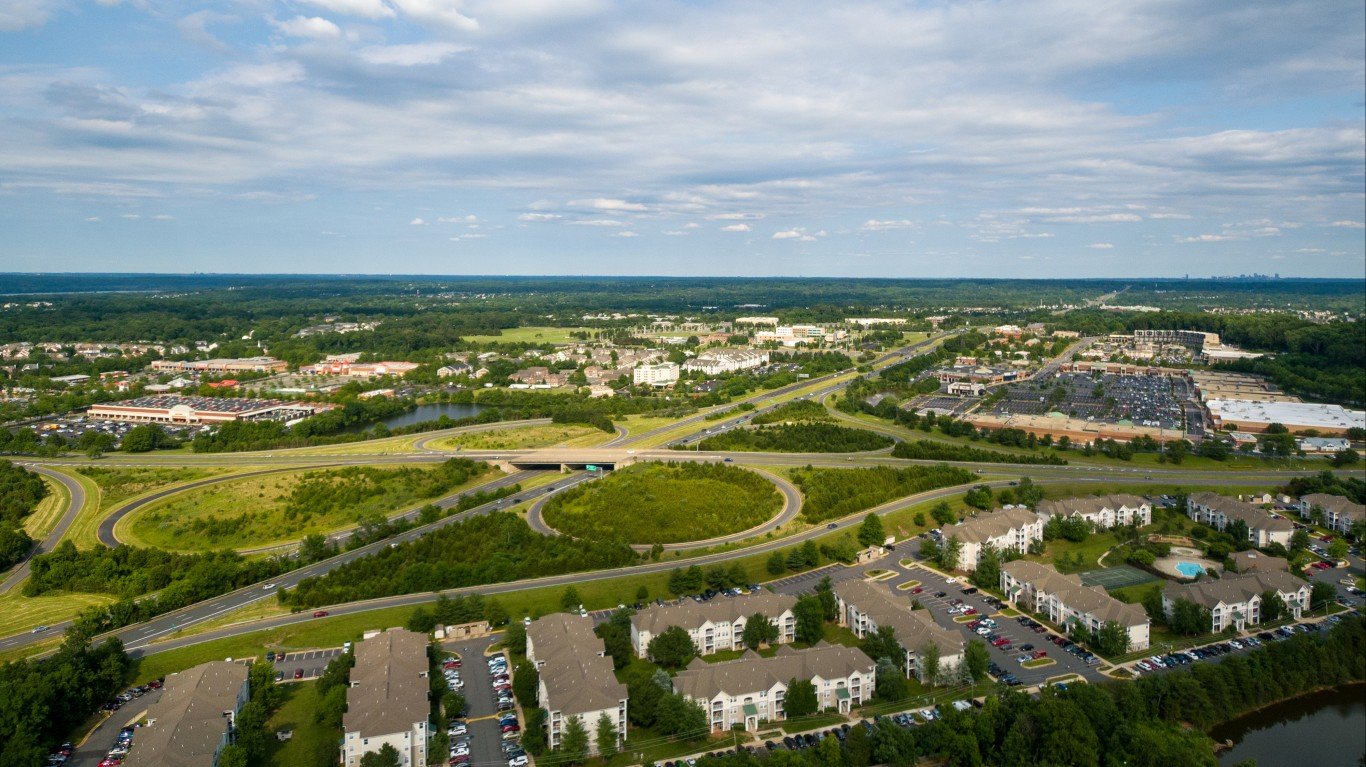
- Median household income in county: $178,707 ($90,974 statewide)
- Poverty rate in county: 4.0% (9.9% statewide)
- Households earning at least $200,000 in county: 43.6% (16.9% statewide)
- Median home value in county: $701,000 ($360,700 statewide)
- 5-year avg. unemployment rate in county: 3.2% (4.3% statewide)
- Cost of living in county: 15.2% higher than national avg. (0.7% higher than national avg. statewide)
- Num. of counties considered in state: 133
Washington: King County

- Median household income in county: $122,148 ($94,952 statewide)
- Poverty rate in county: 8.4% (9.9% statewide)
- Households earning at least $200,000 in county: 28.3% (17.2% statewide)
- Median home value in county: $811,200 ($519,800 statewide)
- 5-year avg. unemployment rate in county: 4.6% (5.0% statewide)
- Cost of living in county: 17.8% higher than national avg. (8.6% higher than national avg. statewide)
- Num. of counties considered in state: 39
West Virginia: Jefferson County

- Median household income in county: $95,523 ($57,917 statewide)
- Poverty rate in county: 8.8% (16.6% statewide)
- Households earning at least $200,000 in county: 14.4% (5.4% statewide)
- Median home value in county: $324,500 ($155,600 statewide)
- 5-year avg. unemployment rate in county: 4.1% (5.7% statewide)
- Cost of living in county: 6.1% lower than national avg. (10.2% lower than national avg. statewide)
- Num. of counties considered in state: 55
Wisconsin: Waukesha County

- Median household income in county: $104,100 ($75,670 statewide)
- Poverty rate in county: 5.2% (10.6% statewide)
- Households earning at least $200,000 in county: 18.1% (8.6% statewide)
- Median home value in county: $373,600 ($247,400 statewide)
- 5-year avg. unemployment rate in county: 2.6% (3.3% statewide)
- Cost of living in county: 1.9% lower than national avg. (6.9% lower than national avg. statewide)
- Num. of counties considered in state: 72
Wyoming: Teton County

- Median household income in county: $112,681 ($74,815 statewide)
- Poverty rate in county: 7.0% (10.7% statewide)
- Households earning at least $200,000 in county: 26.4% (7.9% statewide)
- Median home value in county: $1,371,900 ($285,100 statewide)
- 5-year avg. unemployment rate in county: 2.5% (3.7% statewide)
- Cost of living in county: 9.6% higher than national avg. (9.2% lower than national avg. statewide)
- Num. of counties considered in state: 23
The post Richest County in Every State appeared first on 24/7 Wall St..