


Health Care Deserts: Where A Lack Of Doctors Could Be Hurting Health Outcomes
As America grapples with an aging population, rising chronic illness, and worsening hospital wait times, a new health care crisis is unfolding. From rural counties to entire states, physician shortages are straining overburdened health care systems and worsening health care outcomes for large segments of the population. The concentration of physicians varies widely across the […] The post Health Care Deserts: Where A Lack Of Doctors Could Be Hurting Health Outcomes appeared first on 24/7 Wall St..

Key Points
-
Aging populations and rising illness rates are leading to a physician shortage in the United States.
-
The availability of physicians varies widely from state to state.
-
The states with the fewest physicians per capita also have high rates of medical malpractice and deaths due to medical error.
-
Could your finances use a check-up? Click here to talk to an expert.
As America grapples with an aging population, rising chronic illness, and worsening hospital wait times, a new health care crisis is unfolding. From rural counties to entire states, physician shortages are straining overburdened health care systems and worsening health care outcomes for large segments of the population.
The concentration of physicians varies widely across the country. Adjusted for population, the state with the most physicians has nearly three times as many doctors per capita as the state with the least. Physician concentration is correlated with factors like health care salary and the percentage of doctors who practice in the same state as their residency, as well as outcomes like deaths due to medical error and medical malpractice. A closer look at the data reveals where lack of doctors could be hurting health care outcomes.
To determine the states with the fewest doctors, 24/7 Wall St. reviewed data on practicing physicians from the Kaiser Family Foundation. States were ranked based on the number of professionally practicing physicians as of January 2025 per 100,000 residents. Supplemental data on median annual salary for health care practitioners and technical occupations are from the Bureau of Labor Statistics Occupational Employment and Wage Statistics program and are for May 2024.
Data used to calculate the average dollar amount of medical malpractice payouts per resident from 2015 to 2024 are from the National Practitioner Data Bank of the U.S. Department of Health & Human Services and the U.S. Census Bureau’s Population and Housing Unit Estimates program, while data on mortality due to medical and surgical complications from 2021 to 2023 are from the CDC’s WONDER database. Data on the percentage of physicians practicing in the state of their residency is from the Association of American Medical Colleges and is for 2022. Retention rates are based on individuals who completed residency between 2013 and 2022.
50. Massachusetts

- Concentration of physicians: 526.2 per 100,000 residents (36,840 total)
- Physicians practicing in state of residency: 56.2%
- Median annual salary for healthcare practitioners: $97,790
- Medical malpractice payouts, 2015-2024: $192.27 per capita
- Average medical malpractice payout, 2015-2024: $764,434
- Deaths from medical and surgical care complications, 2021-2023: 0.8 per 100,000 people
49. New York

- Concentration of physicians: 474.4 per 100,000 residents (92,846 total)
- Physicians practicing in state of residency: 54.8%
- Median annual salary for healthcare practitioners: $99,890
- Medical malpractice payouts, 2015-2024: $273.64 per capita
- Average medical malpractice payout, 2015-2024: $502,292
- Deaths from medical and surgical care complications, 2021-2023: 0.9 per 100,000 people
48. Connecticut

- Concentration of physicians: 451.4 per 100,000 residents (16,328 total)
- Physicians practicing in state of residency: 45.6%
- Median annual salary for healthcare practitioners: $97,450
- Medical malpractice payouts, 2015-2024: $201.52 per capita
- Average medical malpractice payout, 2015-2024: $711,861
- Deaths from medical and surgical care complications, 2021-2023: 0.8 per 100,000 people
47. Maryland

- Concentration of physicians: 444.6 per 100,000 residents (27,475 total)
- Physicians practicing in state of residency: 48.2%
- Median annual salary for healthcare practitioners: $95,620
- Medical malpractice payouts, 2015-2024: $117.92 per capita
- Average medical malpractice payout, 2015-2024: $445,997
- Deaths from medical and surgical care complications, 2021-2023: 0.9 per 100,000 people
46. Rhode Island

- Concentration of physicians: 434.4 per 100,000 residents (4,761 total)
- Physicians practicing in state of residency: 42.9%
- Median annual salary for healthcare practitioners: $90,690
- Medical malpractice payouts, 2015-2024: $205.48 per capita
- Average medical malpractice payout, 2015-2024: $561,605
- Deaths from medical and surgical care complications, 2021-2023: 1.1 per 100,000 people
45. Pennsylvania

- Concentration of physicians: 418.3 per 100,000 residents (54,224 total)
- Physicians practicing in state of residency: 49.1%
- Median annual salary for healthcare practitioners: $80,250
- Medical malpractice payouts, 2015-2024: $215.94 per capita
- Average medical malpractice payout, 2015-2024: $464,328
- Deaths from medical and surgical care complications, 2021-2023: 1.0 per 100,000 people
44. Vermont

- Concentration of physicians: 417.3 per 100,000 residents (2,702 total)
- Physicians practicing in state of residency: 52.4%
- Median annual salary for healthcare practitioners: $84,660
- Medical malpractice payouts, 2015-2024: $63.22 per capita
- Average medical malpractice payout, 2015-2024: $435,447
- Deaths from medical and surgical care complications, 2021-2023: 1.3 per 100,000 people
43. Michigan

- Concentration of physicians: 409.4 per 100,000 residents (41,090 total)
- Physicians practicing in state of residency: 54.7%
- Median annual salary for healthcare practitioners: $81,880
- Medical malpractice payouts, 2015-2024: $50.77 per capita
- Average medical malpractice payout, 2015-2024: $254,431
- Deaths from medical and surgical care complications, 2021-2023: 0.9 per 100,000 people
42. Ohio

- Concentration of physicians: 380.6 per 100,000 residents (44,852 total)
- Physicians practicing in state of residency: 53.4%
- Median annual salary for healthcare practitioners: $79,130
- Medical malpractice payouts, 2015-2024: $58.27 per capita
- Average medical malpractice payout, 2015-2024: $482,997
- Deaths from medical and surgical care complications, 2021-2023: 1.3 per 100,000 people
41. Maine

- Concentration of physicians: 379.2 per 100,000 residents (5,293 total)
- Physicians practicing in state of residency: 60.2%
- Median annual salary for healthcare practitioners: $82,860
- Medical malpractice payouts, 2015-2024: $92.84 per capita
- Average medical malpractice payout, 2015-2024: $586,353
- Deaths from medical and surgical care complications, 2021-2023: 0.9 per 100,000 people
40. Illinois

- Concentration of physicians: 371.0 per 100,000 residents (46,563 total)
- Physicians practicing in state of residency: 54.8%
- Median annual salary for healthcare practitioners: $82,960
- Medical malpractice payouts, 2015-2024: $161.52 per capita
- Average medical malpractice payout, 2015-2024: $709,014
- Deaths from medical and surgical care complications, 2021-2023: 1.0 per 100,000 people
39. Delaware

- Concentration of physicians: 364.6 per 100,000 residents (3,762 total)
- Physicians practicing in state of residency: 39.2%
- Median annual salary for healthcare practitioners: $87,840
- Medical malpractice payouts, 2015-2024: $87.95 per capita
- Average medical malpractice payout, 2015-2024: $447,059
- Deaths from medical and surgical care complications, 2021-2023: 0.9 per 100,000 people
38. New Jersey

- Concentration of physicians: 364.2 per 100,000 residents (33,838 total)
- Physicians practicing in state of residency: 48.4%
- Median annual salary for healthcare practitioners: $100,350
- Medical malpractice payouts, 2015-2024: $199.71 per capita
- Average medical malpractice payout, 2015-2024: $514,257
- Deaths from medical and surgical care complications, 2021-2023: 0.8 per 100,000 people
37. Missouri

- Concentration of physicians: 361.5 per 100,000 residents (22,402 total)
- Physicians practicing in state of residency: 52.7%
- Median annual salary for healthcare practitioners: $76,400
- Medical malpractice payouts, 2015-2024: $76.02 per capita
- Average medical malpractice payout, 2015-2024: $398,180
- Deaths from medical and surgical care complications, 2021-2023: 0.8 per 100,000 people
36. Nebraska

- Concentration of physicians: 350.0 per 100,000 residents (6,925 total)
- Physicians practicing in state of residency: 52.2%
- Median annual salary for healthcare practitioners: $79,420
- Medical malpractice payouts, 2015-2024: $65.25 per capita
- Average medical malpractice payout, 2015-2024: $381,935
- Deaths from medical and surgical care complications, 2021-2023: 1.3 per 100,000 people
35. Minnesota
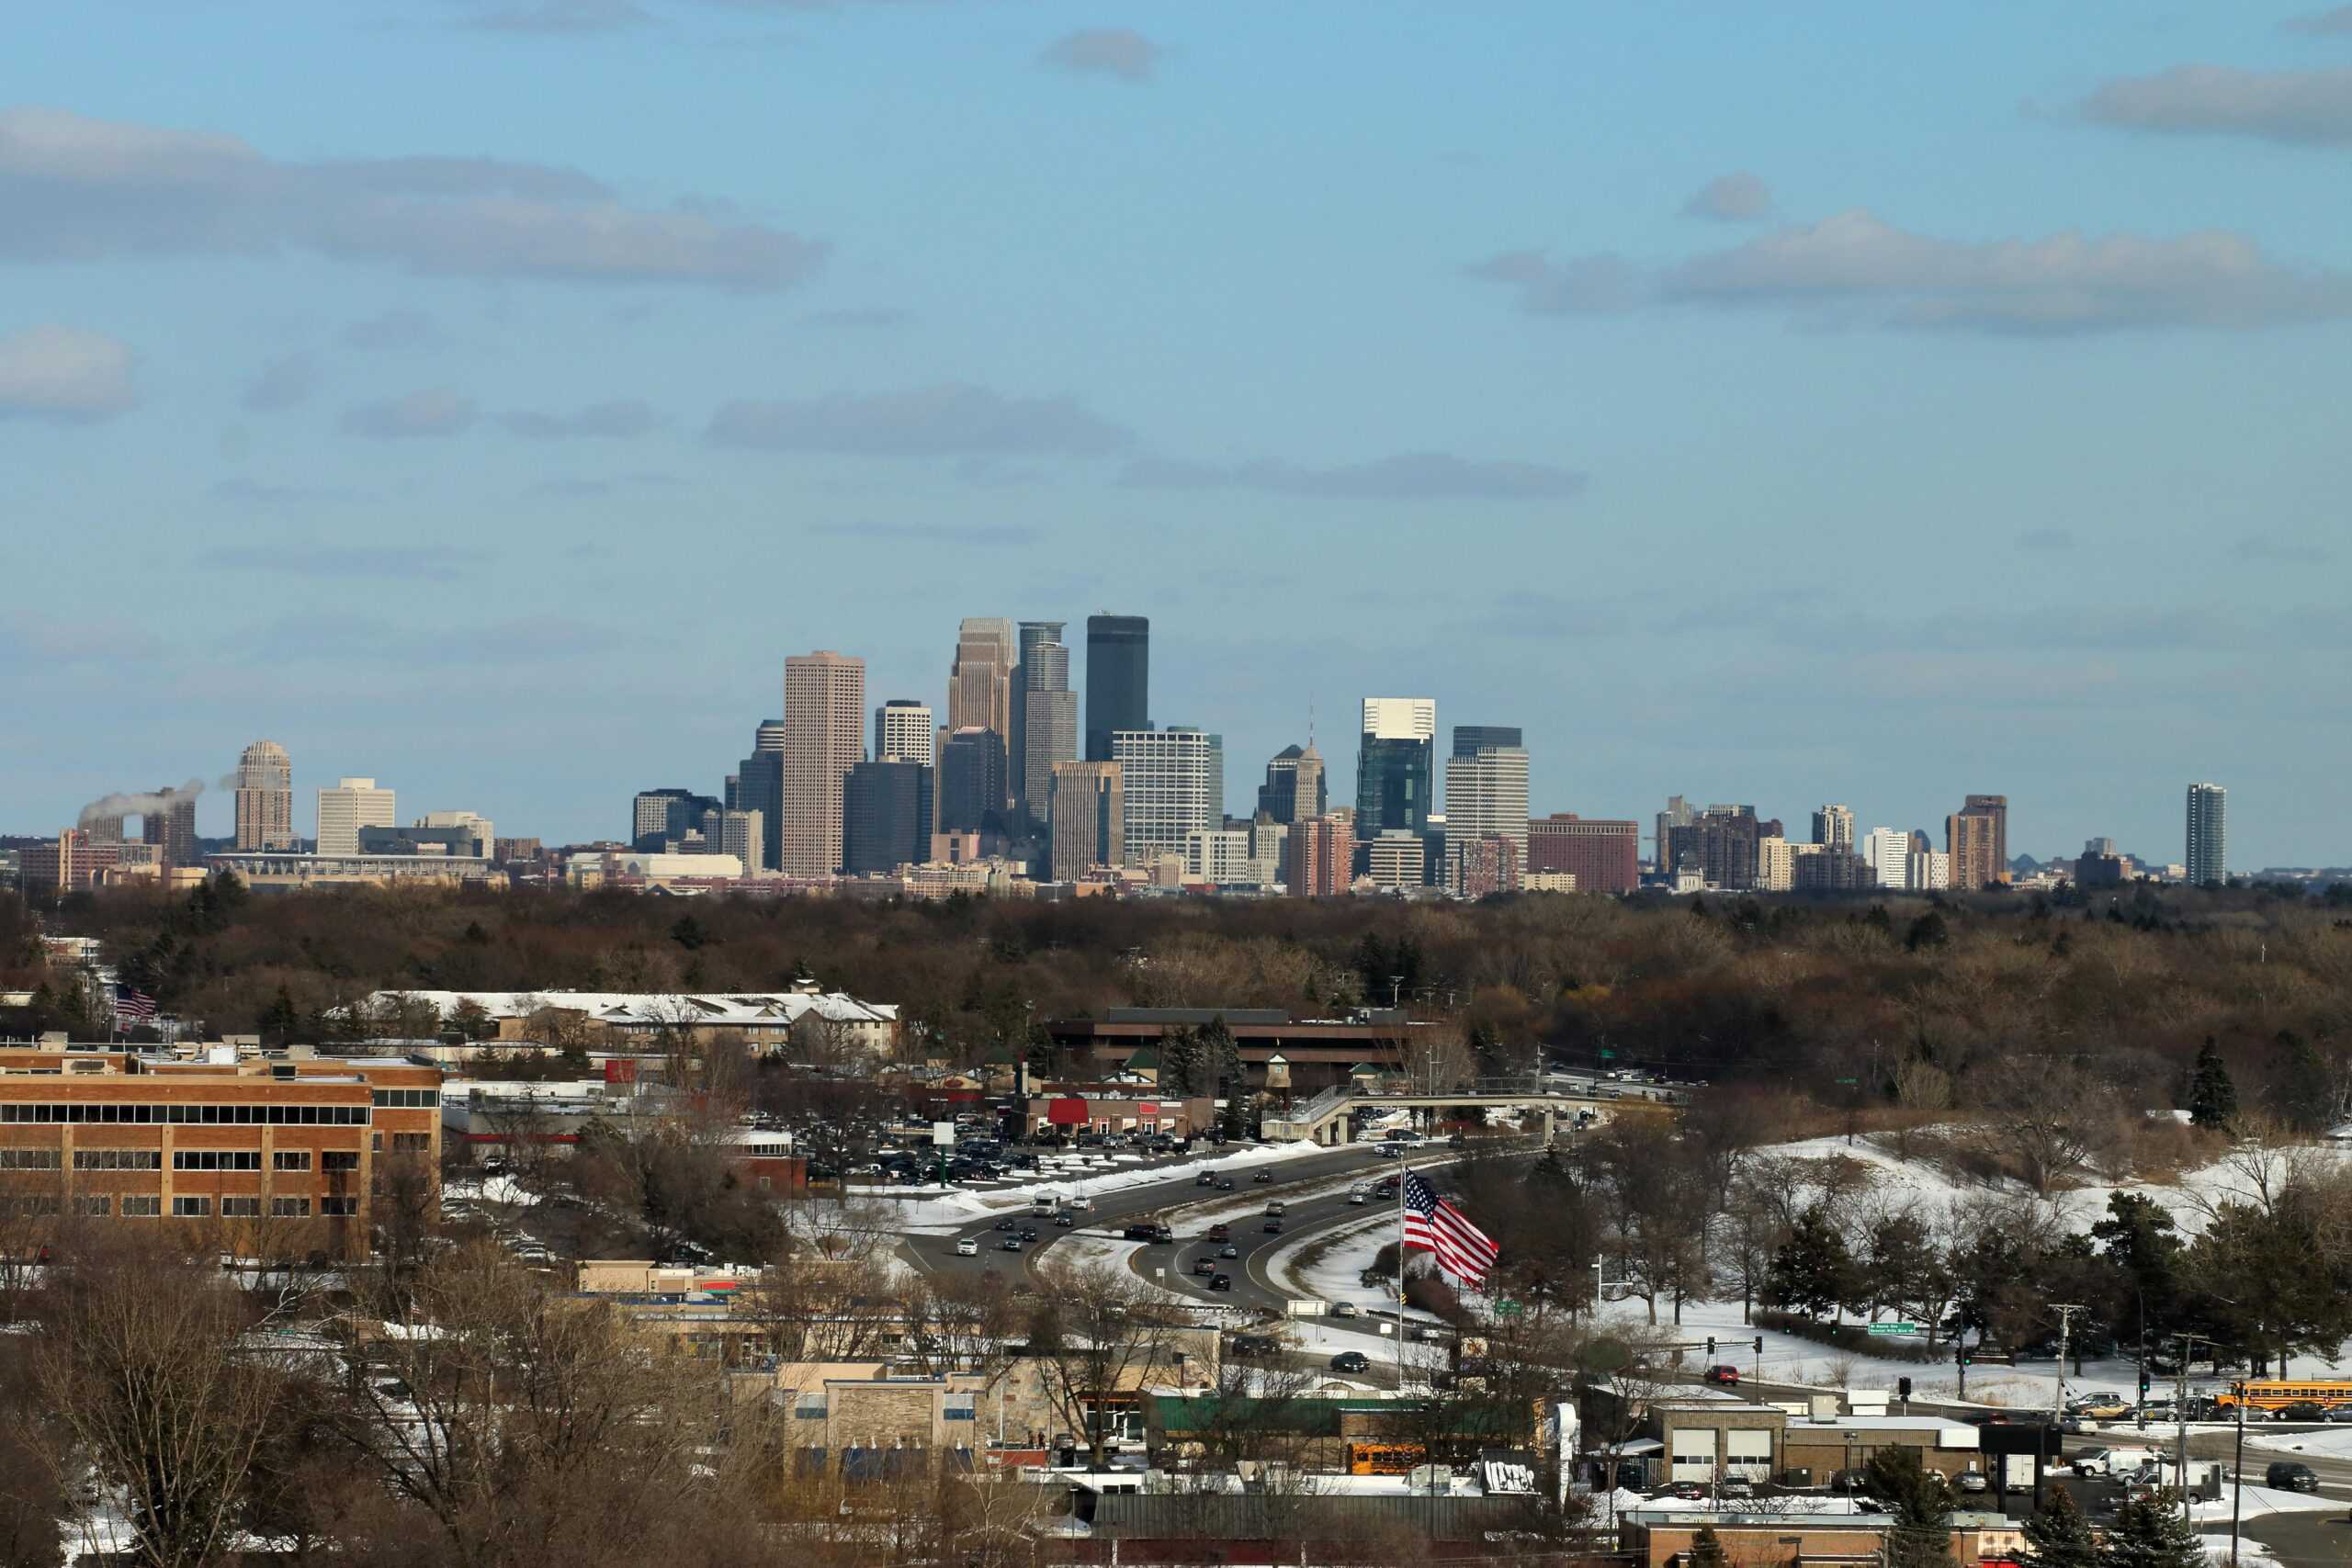
- Concentration of physicians: 342.1 per 100,000 residents (19,632 total)
- Physicians practicing in state of residency: 59.0%
- Median annual salary for healthcare practitioners: $95,380
- Medical malpractice payouts, 2015-2024: $51.98 per capita
- Average medical malpractice payout, 2015-2024: $786,892
- Deaths from medical and surgical care complications, 2021-2023: 1.0 per 100,000 people
34. Wisconsin

- Concentration of physicians: 333.5 per 100,000 residents (19,713 total)
- Physicians practicing in state of residency: 54.0%
- Median annual salary for healthcare practitioners: $81,620
- Medical malpractice payouts, 2015-2024: $33.82 per capita
- Average medical malpractice payout, 2015-2024: $620,748
- Deaths from medical and surgical care complications, 2021-2023: 0.9 per 100,000 people
33. West Virginia

- Concentration of physicians: 328.5 per 100,000 residents (5,814 total)
- Physicians practicing in state of residency: 50.9%
- Median annual salary for healthcare practitioners: $69,340
- Medical malpractice payouts, 2015-2024: $129.82 per capita
- Average medical malpractice payout, 2015-2024: $346,587
- Deaths from medical and surgical care complications, 2021-2023: 1.3 per 100,000 people
32. New Mexico

- Concentration of physicians: 322.0 per 100,000 residents (6,809 total)
- Physicians practicing in state of residency: 52.8%
- Median annual salary for healthcare practitioners: $84,380
- Medical malpractice payouts, 2015-2024: $162.84 per capita
- Average medical malpractice payout, 2015-2024: $376,700
- Deaths from medical and surgical care complications, 2021-2023: 1.5 per 100,000 people
31. New Hampshire

- Concentration of physicians: 318.4 per 100,000 residents (4,464 total)
- Physicians practicing in state of residency: 40.8%
- Median annual salary for healthcare practitioners: $88,160
- Medical malpractice payouts, 2015-2024: $159.46 per capita
- Average medical malpractice payout, 2015-2024: $665,406
- Deaths from medical and surgical care complications, 2021-2023: 1.0 per 100,000 people
30. Oregon

- Concentration of physicians: 318.1 per 100,000 residents (13,468 total)
- Physicians practicing in state of residency: 61.6%
- Median annual salary for healthcare practitioners: $108,070
- Medical malpractice payouts, 2015-2024: $100.46 per capita
- Average medical malpractice payout, 2015-2024: $593,962
- Deaths from medical and surgical care complications, 2021-2023: 1.1 per 100,000 people
29. California

- Concentration of physicians: 315.6 per 100,000 residents (122,963 total)
- Physicians practicing in state of residency: 77.5%
- Median annual salary for healthcare practitioners: $119,990
- Medical malpractice payouts, 2015-2024: $56.44 per capita
- Average medical malpractice payout, 2015-2024: $299,154
- Deaths from medical and surgical care complications, 2021-2023: 0.6 per 100,000 people
28. North Dakota

- Concentration of physicians: 315.3 per 100,000 residents (2,472 total)
- Physicians practicing in state of residency: 59.1%
- Median annual salary for healthcare practitioners: $77,750
- Medical malpractice payouts, 2015-2024: $26.76 per capita
- Average medical malpractice payout, 2015-2024: $368,061
- Deaths from medical and surgical care complications, 2021-2023: 1.1 per 100,000 people
27. Virginia

- Concentration of physicians: 314.1 per 100,000 residents (27,376 total)
- Physicians practicing in state of residency: 51.0%
- Median annual salary for healthcare practitioners: $81,700
- Medical malpractice payouts, 2015-2024: $58.49 per capita
- Average medical malpractice payout, 2015-2024: $493,490
- Deaths from medical and surgical care complications, 2021-2023: 0.9 per 100,000 people
26. Washington

- Concentration of physicians: 310.8 per 100,000 residents (24,280 total)
- Physicians practicing in state of residency: 58.4%
- Median annual salary for healthcare practitioners: $103,660
- Medical malpractice payouts, 2015-2024: $73.92 per capita
- Average medical malpractice payout, 2015-2024: $545,386
- Deaths from medical and surgical care complications, 2021-2023: 1.2 per 100,000 people
25. Hawaii

- Concentration of physicians: 309.5 per 100,000 residents (4,442 total)
- Physicians practicing in state of residency: 49.4%
- Median annual salary for healthcare practitioners: $104,000
- Medical malpractice payouts, 2015-2024: $113.59 per capita
- Average medical malpractice payout, 2015-2024: $634,281
- Deaths from medical and surgical care complications, 2021-2023: 0.7 per 100,000 people
24. Kansas

- Concentration of physicians: 307.5 per 100,000 residents (9,043 total)
- Physicians practicing in state of residency: 53.9%
- Median annual salary for healthcare practitioners: $75,120
- Medical malpractice payouts, 2015-2024: $82.90 per capita
- Average medical malpractice payout, 2015-2024: $219,428
- Deaths from medical and surgical care complications, 2021-2023: 1.5 per 100,000 people
23. Louisiana

- Concentration of physicians: 304.8 per 100,000 residents (13,939 total)
- Physicians practicing in state of residency: 58.0%
- Median annual salary for healthcare practitioners: $69,940
- Medical malpractice payouts, 2015-2024: $121.35 per capita
- Average medical malpractice payout, 2015-2024: $260,824
- Deaths from medical and surgical care complications, 2021-2023: 1.0 per 100,000 people
22. North Carolina

- Concentration of physicians: 298.9 per 100,000 residents (32,386 total)
- Physicians practicing in state of residency: 52.7%
- Median annual salary for healthcare practitioners: $79,210
- Medical malpractice payouts, 2015-2024: $34.21 per capita
- Average medical malpractice payout, 2015-2024: $377,515
- Deaths from medical and surgical care complications, 2021-2023: 1.2 per 100,000 people
21. Tennessee

- Concentration of physicians: 297.6 per 100,000 residents (21,208 total)
- Physicians practicing in state of residency: 47.5%
- Median annual salary for healthcare practitioners: $75,830
- Medical malpractice payouts, 2015-2024: $41.47 per capita
- Average medical malpractice payout, 2015-2024: $328,741
- Deaths from medical and surgical care complications, 2021-2023: 1.3 per 100,000 people
20. Alaska

- Concentration of physicians: 289.6 per 100,000 residents (2,124 total)
- Physicians practicing in state of residency: 70.8%
- Median annual salary for healthcare practitioners: $102,660
- Medical malpractice payouts, 2015-2024: $83.01 per capita
- Average medical malpractice payout, 2015-2024: $515,917
- Deaths from medical and surgical care complications, 2021-2023: 1.0 per 100,000 people
19. Colorado

- Concentration of physicians: 289.4 per 100,000 residents (17,011 total)
- Physicians practicing in state of residency: 58.1%
- Median annual salary for healthcare practitioners: $86,740
- Medical malpractice payouts, 2015-2024: $55.36 per capita
- Average medical malpractice payout, 2015-2024: $467,492
- Deaths from medical and surgical care complications, 2021-2023: 0.9 per 100,000 people
18. Florida

- Concentration of physicians: 286.5 per 100,000 residents (64,791 total)
- Physicians practicing in state of residency: 65.0%
- Median annual salary for healthcare practitioners: $80,020
- Medical malpractice payouts, 2015-2024: $110.63 per capita
- Average medical malpractice payout, 2015-2024: $304,022
- Deaths from medical and surgical care complications, 2021-2023: 0.9 per 100,000 people
17. Kentucky

- Concentration of physicians: 283.5 per 100,000 residents (12,830 total)
- Physicians practicing in state of residency: 50.9%
- Median annual salary for healthcare practitioners: $76,380
- Medical malpractice payouts, 2015-2024: $84.80 per capita
- Average medical malpractice payout, 2015-2024: $378,136
- Deaths from medical and surgical care complications, 2021-2023: 1.3 per 100,000 people
16. South Dakota

- Concentration of physicians: 278.0 per 100,000 residents (2,556 total)
- Physicians practicing in state of residency: 57.7%
- Median annual salary for healthcare practitioners: $69,510
- Medical malpractice payouts, 2015-2024: $80.09 per capita
- Average medical malpractice payout, 2015-2024: $688,143
- Deaths from medical and surgical care complications, 2021-2023: 0.5 per 100,000 people
15. Iowa

- Concentration of physicians: 275.4 per 100,000 residents (8,833 total)
- Physicians practicing in state of residency: 47.3%
- Median annual salary for healthcare practitioners: $74,430
- Medical malpractice payouts, 2015-2024: $69.35 per capita
- Average medical malpractice payout, 2015-2024: $528,284
- Deaths from medical and surgical care complications, 2021-2023: 1.1 per 100,000 people
14. Georgia

- Concentration of physicians: 272.9 per 100,000 residents (30,100 total)
- Physicians practicing in state of residency: 59.0%
- Median annual salary for healthcare practitioners: $81,520
- Medical malpractice payouts, 2015-2024: $114.95 per capita
- Average medical malpractice payout, 2015-2024: $548,590
- Deaths from medical and surgical care complications, 2021-2023: 1.0 per 100,000 people
13. South Carolina

- Concentration of physicians: 272.2 per 100,000 residents (14,626 total)
- Physicians practicing in state of residency: 53.2%
- Median annual salary for healthcare practitioners: $77,920
- Medical malpractice payouts, 2015-2024: $75.05 per capita
- Average medical malpractice payout, 2015-2024: $353,118
- Deaths from medical and surgical care complications, 2021-2023: 1.1 per 100,000 people
12. Indiana

- Concentration of physicians: 269.9 per 100,000 residents (18,519 total)
- Physicians practicing in state of residency: 58.4%
- Median annual salary for healthcare practitioners: $78,330
- Medical malpractice payouts, 2015-2024: $75.13 per capita
- Average medical malpractice payout, 2015-2024: $249,288
- Deaths from medical and surgical care complications, 2021-2023: 1.3 per 100,000 people
11. Arizona

- Concentration of physicians: 268.6 per 100,000 residents (19,961 total)
- Physicians practicing in state of residency: 56.2%
- Median annual salary for healthcare practitioners: $87,750
- Medical malpractice payouts, 2015-2024: $73.91 per capita
- Average medical malpractice payout, 2015-2024: $451,285
- Deaths from medical and surgical care complications, 2021-2023: 0.9 per 100,000 people
10. Alabama

- Concentration of physicians: 262.5 per 100,000 residents (13,410 total)
- Physicians practicing in state of residency: 54.9%
- Median annual salary for healthcare practitioners: $64,590
- Medical malpractice payouts, 2015-2024: $55.04 per capita
- Average medical malpractice payout, 2015-2024: $572,647
- Deaths from medical and surgical care complications, 2021-2023: 1.0 per 100,000 people
9. Arkansas

- Concentration of physicians: 257.4 per 100,000 residents (7,895 total)
- Physicians practicing in state of residency: 56.8%
- Median annual salary for healthcare practitioners: $67,930
- Medical malpractice payouts, 2015-2024: $59.56 per capita
- Average medical malpractice payout, 2015-2024: $403,338
- Deaths from medical and surgical care complications, 2021-2023: 1.6 per 100,000 people
8. Wyoming

- Concentration of physicians: 254.4 per 100,000 residents (1,486 total)
- Physicians practicing in state of residency: 41.1%
- Median annual salary for healthcare practitioners: $81,210
- Medical malpractice payouts, 2015-2024: $84.59 per capita
- Average medical malpractice payout, 2015-2024: $581,247
- Deaths from medical and surgical care complications, 2021-2023: 2.2 per 100,000 people
7. Oklahoma

- Concentration of physicians: 254.1 per 100,000 residents (10,300 total)
- Physicians practicing in state of residency: 59.2%
- Median annual salary for healthcare practitioners: $76,160
- Medical malpractice payouts, 2015-2024: $67.46 per capita
- Average medical malpractice payout, 2015-2024: $299,186
- Deaths from medical and surgical care complications, 2021-2023: 1.0 per 100,000 people
6. Utah

- Concentration of physicians: 251.9 per 100,000 residents (8,610 total)
- Physicians practicing in state of residency: 53.5%
- Median annual salary for healthcare practitioners: $79,440
- Medical malpractice payouts, 2015-2024: $56.06 per capita
- Average medical malpractice payout, 2015-2024: $333,200
- Deaths from medical and surgical care complications, 2021-2023: 1.0 per 100,000 people
5. Montana
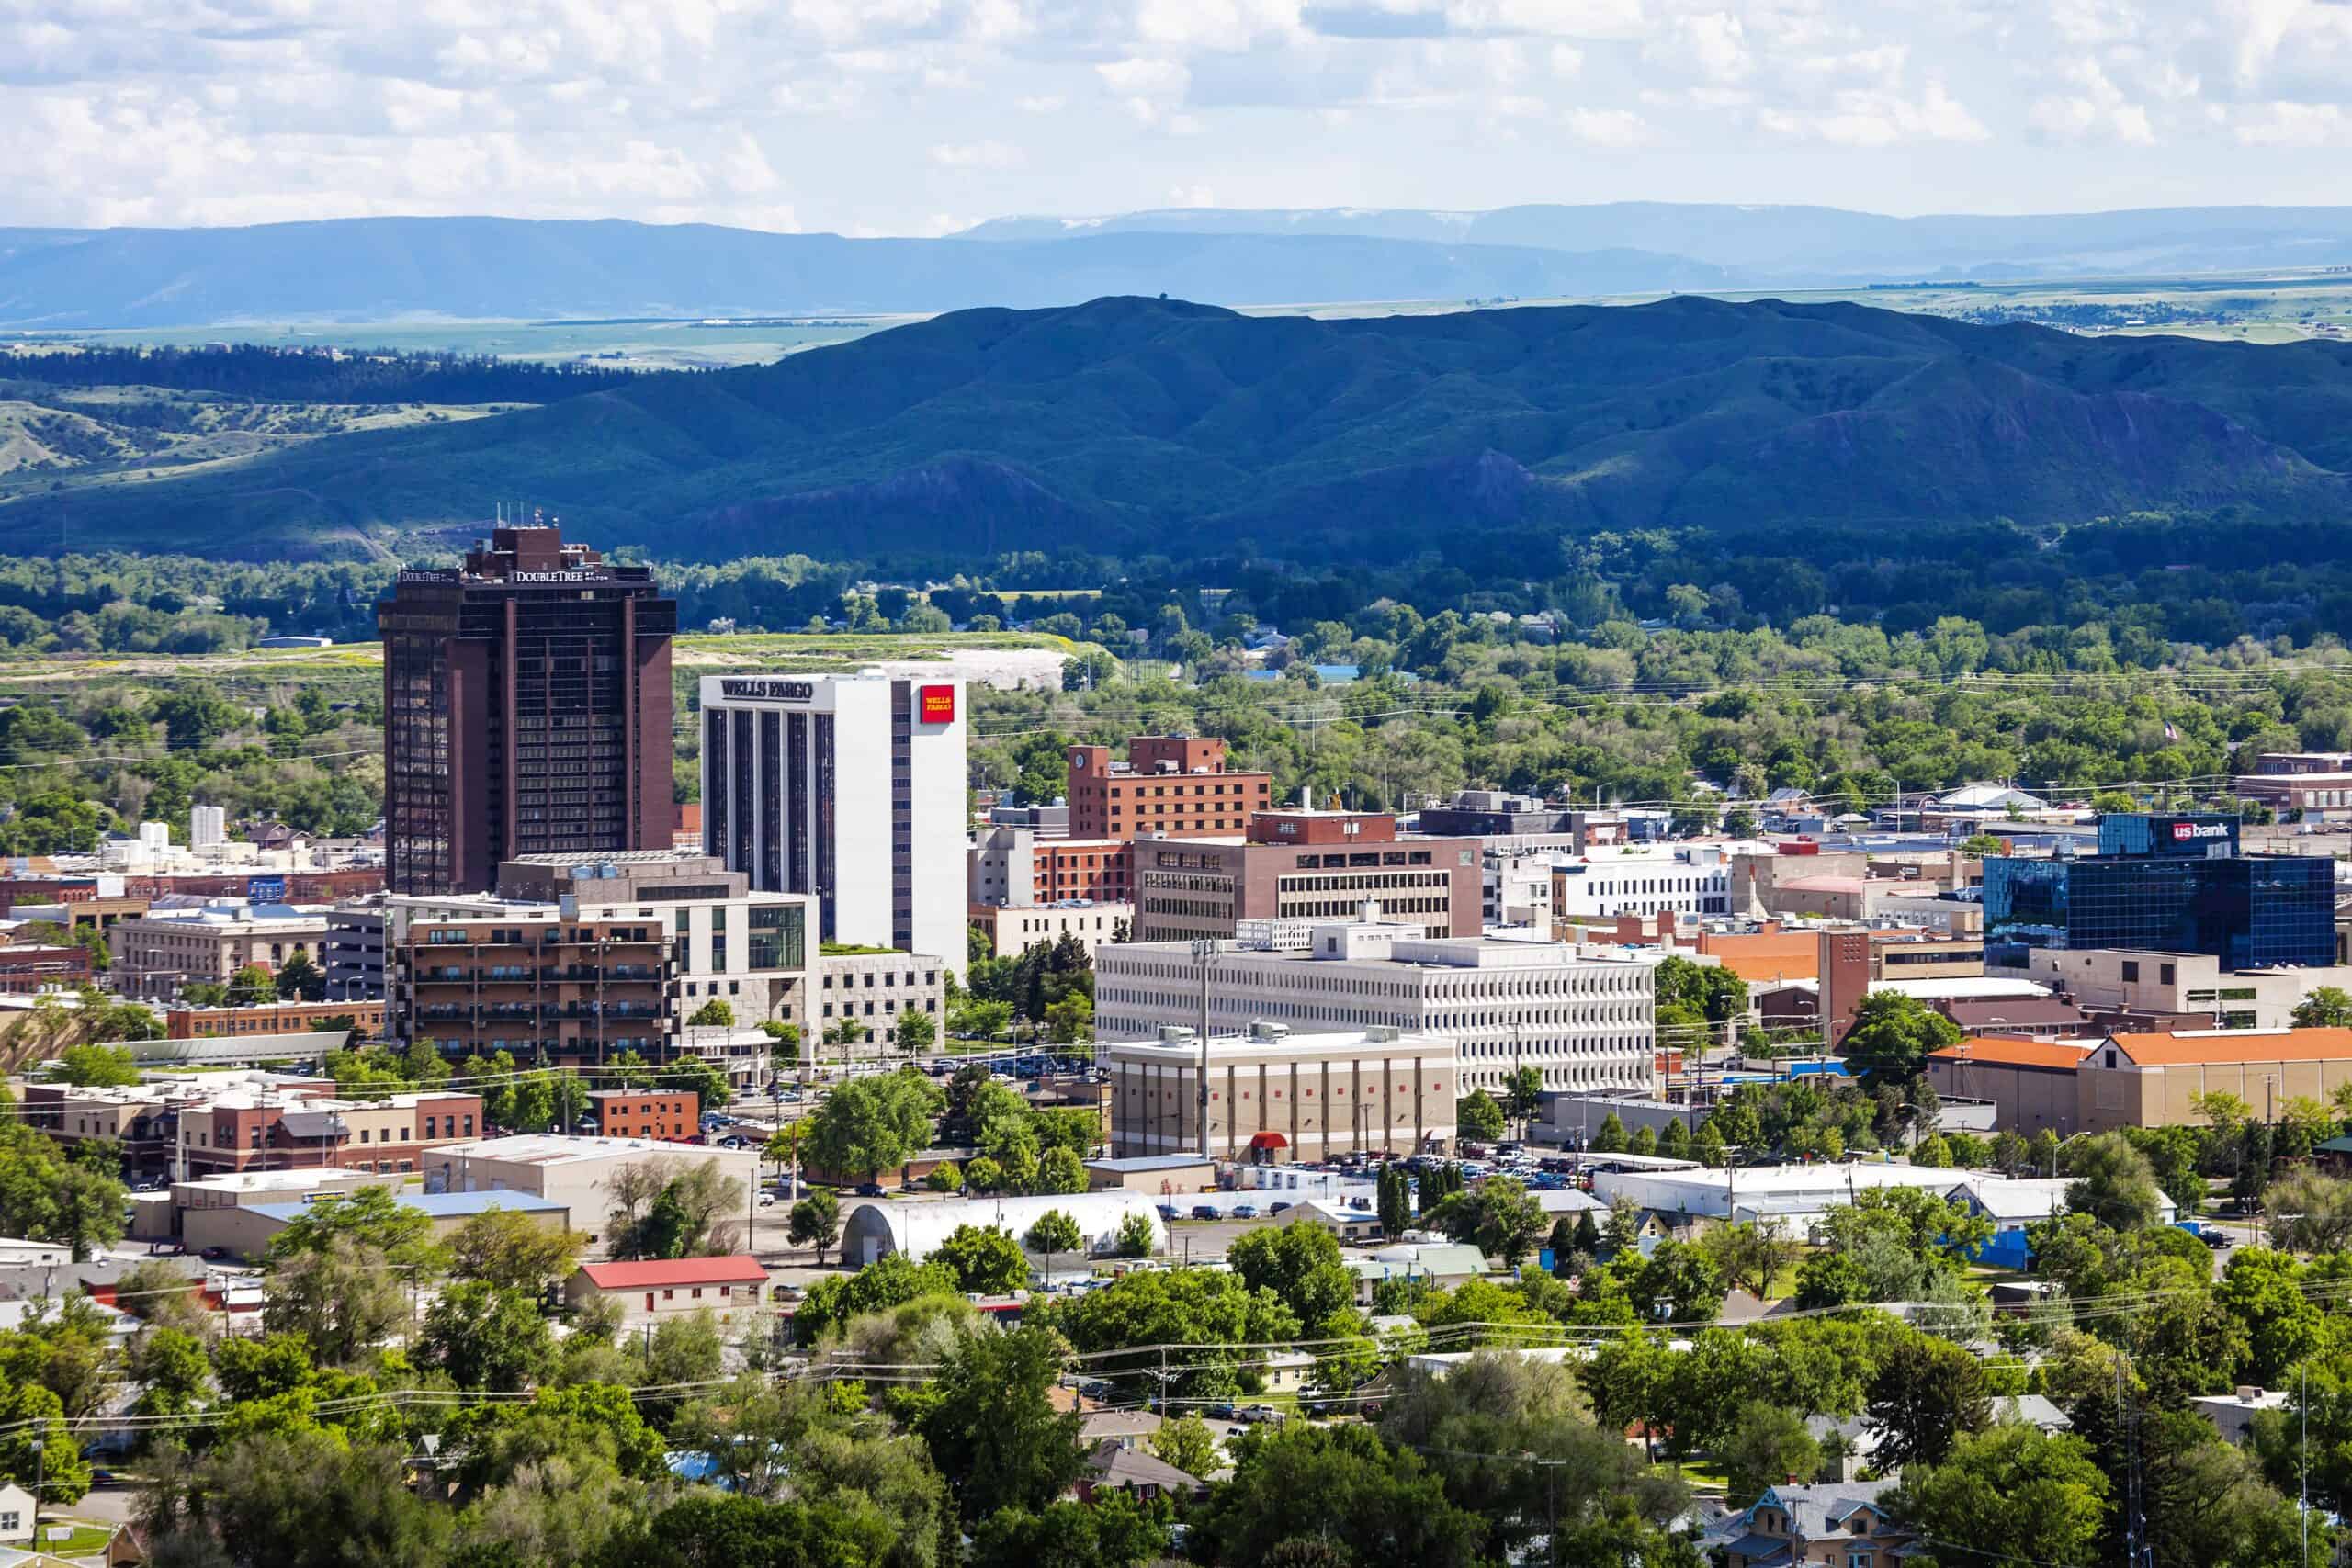
- Concentration of physicians: 248.6 per 100,000 residents (2,816 total)
- Physicians practicing in state of residency: 63.4%
- Median annual salary for healthcare practitioners: $79,850
- Medical malpractice payouts, 2015-2024: $96.80 per capita
- Average medical malpractice payout, 2015-2024: $375,543
- Deaths from medical and surgical care complications, 2021-2023: 1.2 per 100,000 people
4. Mississippi

- Concentration of physicians: 245.3 per 100,000 residents (7,211 total)
- Physicians practicing in state of residency: 58.4%
- Median annual salary for healthcare practitioners: $64,960
- Medical malpractice payouts, 2015-2024: $53.29 per capita
- Average medical malpractice payout, 2015-2024: $326,381
- Deaths from medical and surgical care complications, 2021-2023: 1.6 per 100,000 people
3. Texas

- Concentration of physicians: 243.1 per 100,000 residents (74,164 total)
- Physicians practicing in state of residency: 66.5%
- Median annual salary for healthcare practitioners: $79,510
- Medical malpractice payouts, 2015-2024: $30.24 per capita
- Average medical malpractice payout, 2015-2024: $229,548
- Deaths from medical and surgical care complications, 2021-2023: 1.2 per 100,000 people
2. Nevada

- Concentration of physicians: 208.7 per 100,000 residents (6,667 total)
- Physicians practicing in state of residency: 53.1%
- Median annual salary for healthcare practitioners: $92,980
- Medical malpractice payouts, 2015-2024: $72.56 per capita
- Average medical malpractice payout, 2015-2024: $345,945
- Deaths from medical and surgical care complications, 2021-2023: 1.0 per 100,000 people
1. Idaho

- Concentration of physicians: 192.7 per 100,000 residents (3,786 total)
- Physicians practicing in state of residency: 66.4%
- Median annual salary for healthcare practitioners: $79,780
- Medical malpractice payouts, 2015-2024: $62.22 per capita
- Average medical malpractice payout, 2015-2024: $503,098
- Deaths from medical and surgical care complications, 2021-2023: 1.3 per 100,000 people
The post Health Care Deserts: Where A Lack Of Doctors Could Be Hurting Health Outcomes appeared first on 24/7 Wall St..