


OPEC Update April 2025
The OPEC Monthly Oil Market Report (MOMR) for April 2025 was published recently. The last month reported in most of the OPEC charts that follow is March 2025 and output reported for OPEC nations is crude oil output in thousands of barrels per day (kb/d). In the OPEC charts below the blue line with markers […]
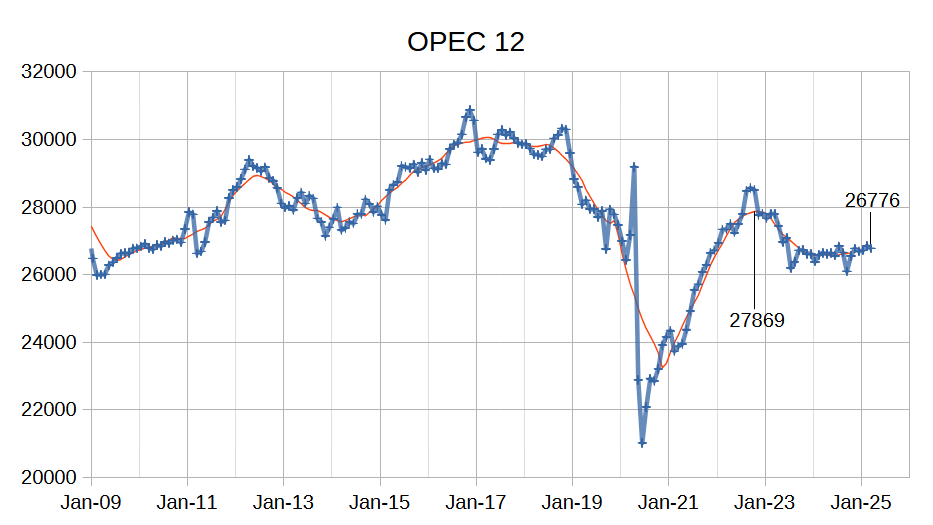
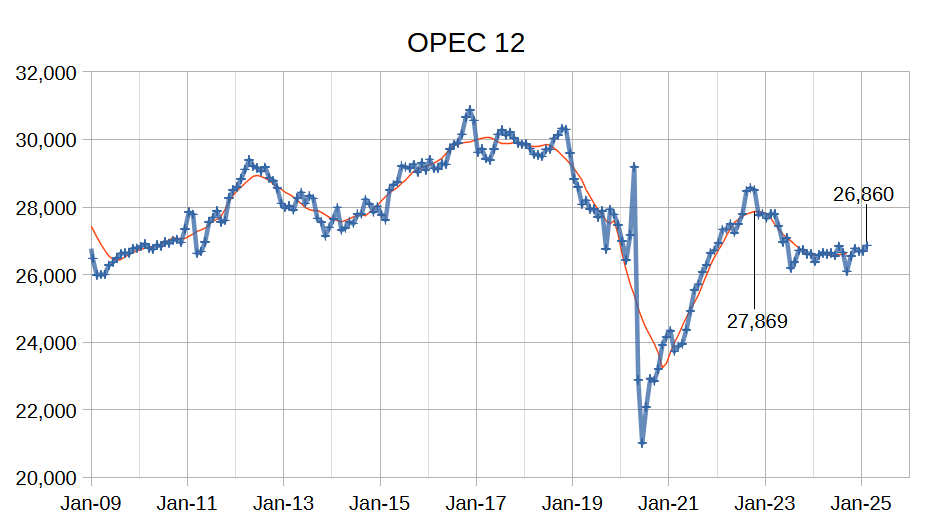
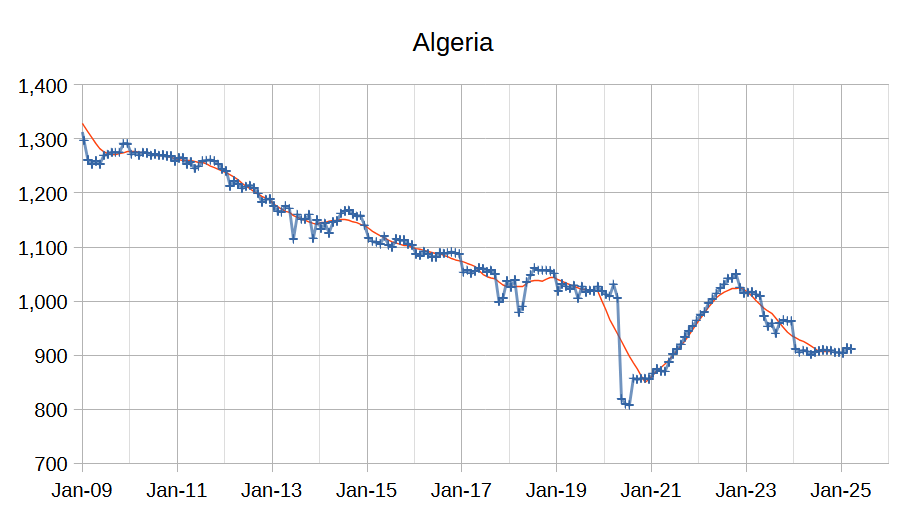
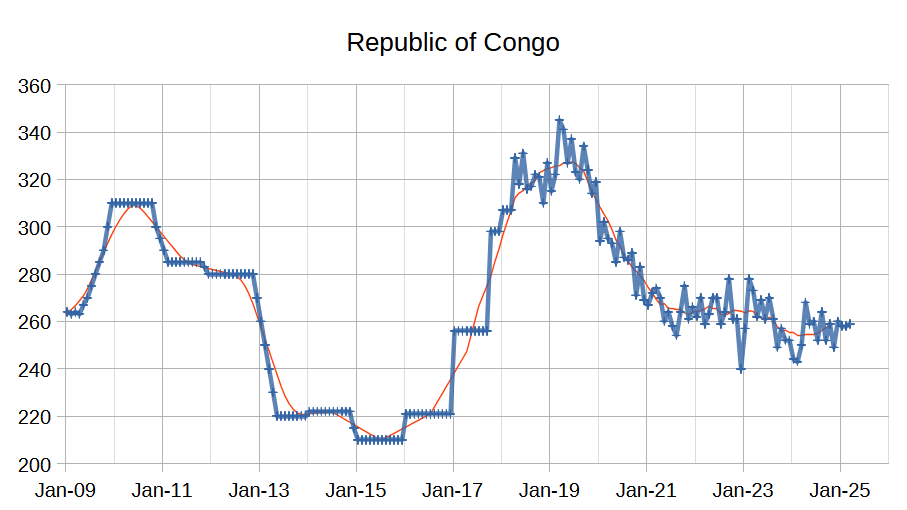
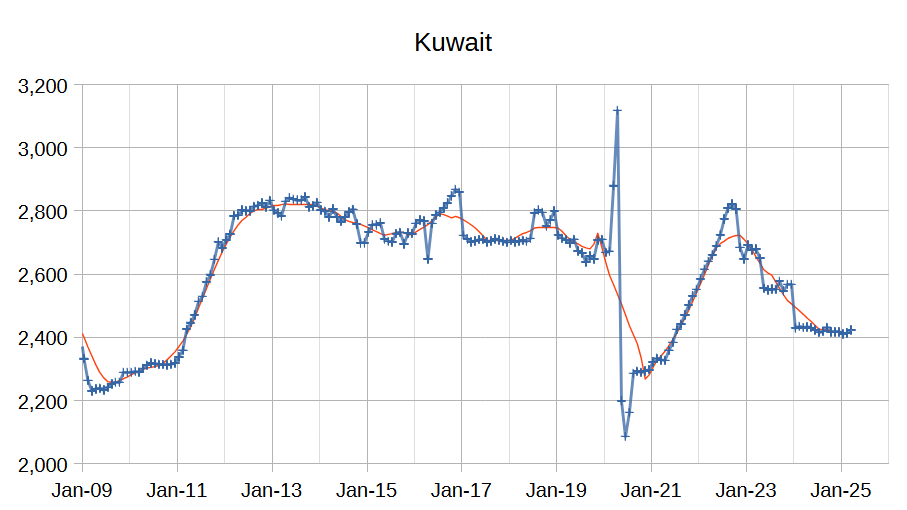
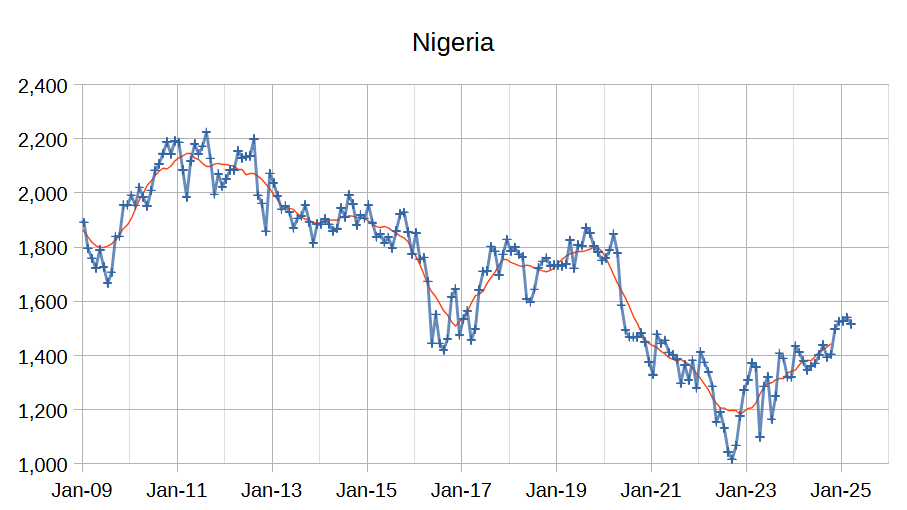
The OPEC Monthly Oil Market Report (MOMR) for April 2025 was published recently. The last month reported in most of the OPEC charts that follow is March 2025 and output reported for OPEC nations is crude oil output in thousands of barrels per day (kb/d). In the OPEC charts below the blue line with markers is monthly output and the thin red line is the centered twelve month average (CTMA) output.
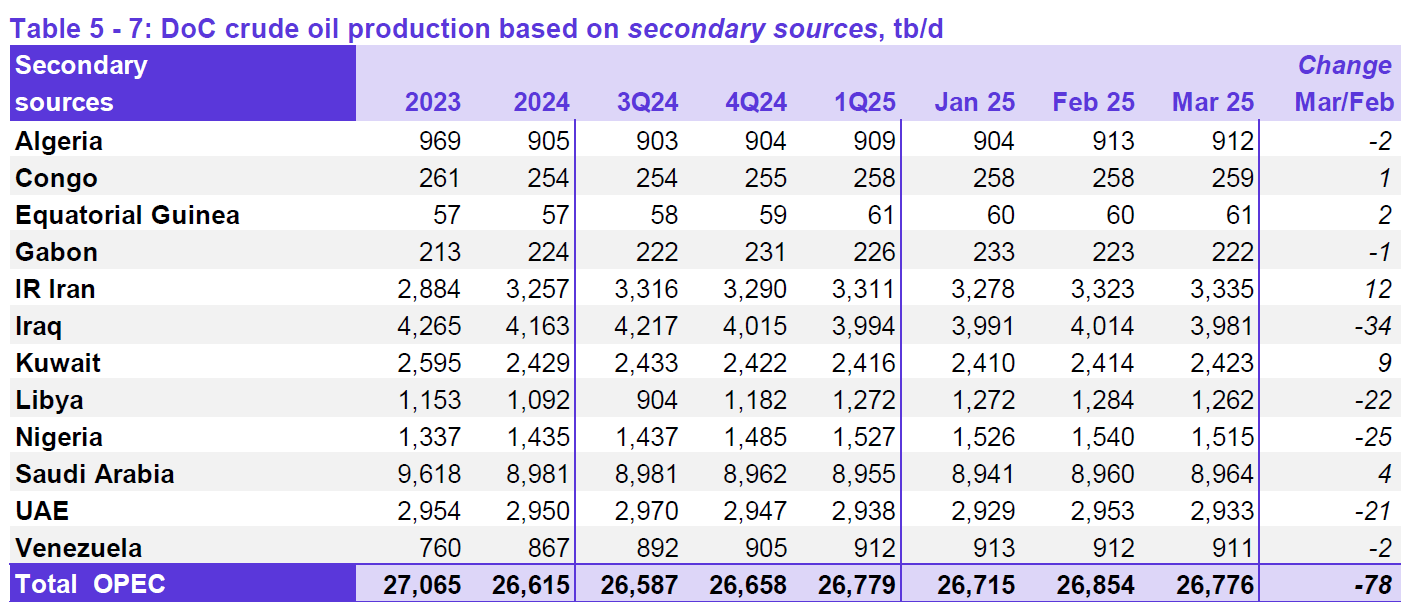
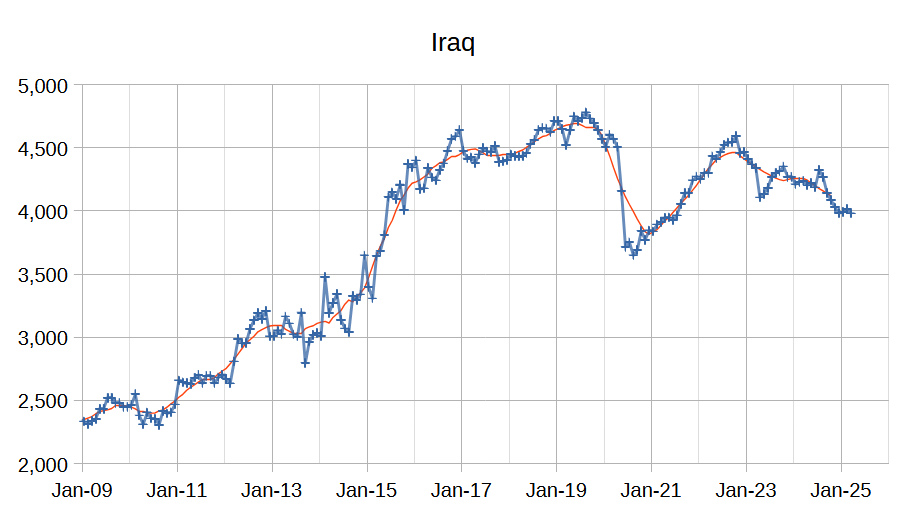
Output for January 2025 was revised higher by 9 kb/d and February 2025 output was revised lower by 6 kb/d compared to last month’s report. OPEC 12 output decreased by 78 kb/d with the largest decreases from Iraq (34 kb/d), Nigeria (25 kb/d), Libya (22 kb/d) and UAE (21 kb/d). Iran (12 kb/d) and Kuwait (9 kb/d) saw increased crude output, other OPEC members had small increases or decreases of 4 kb/d or less.

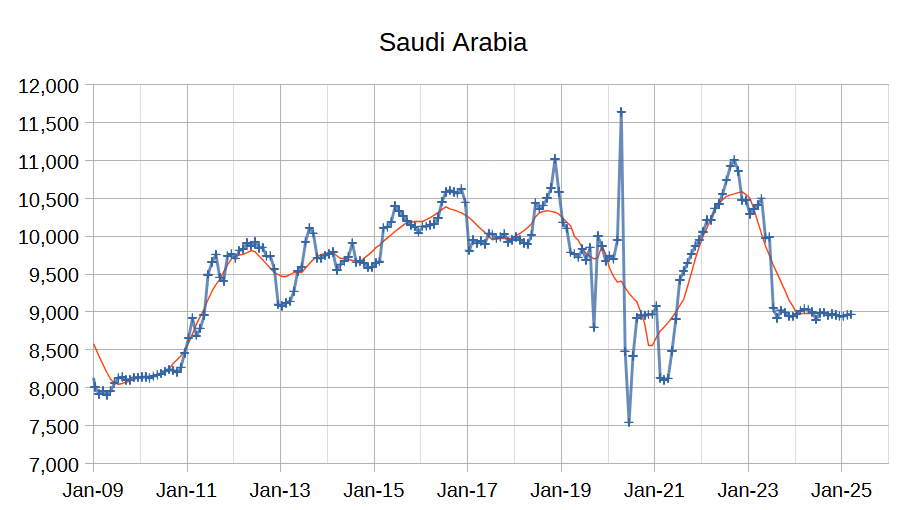
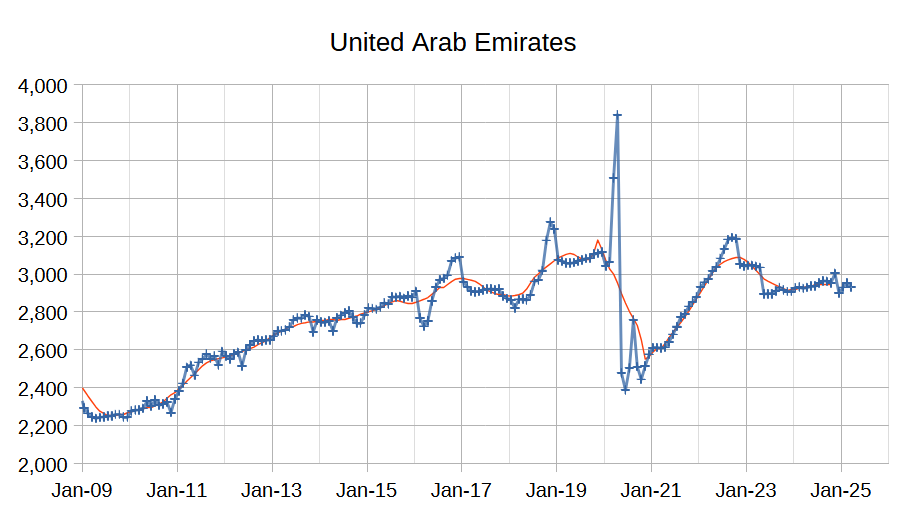
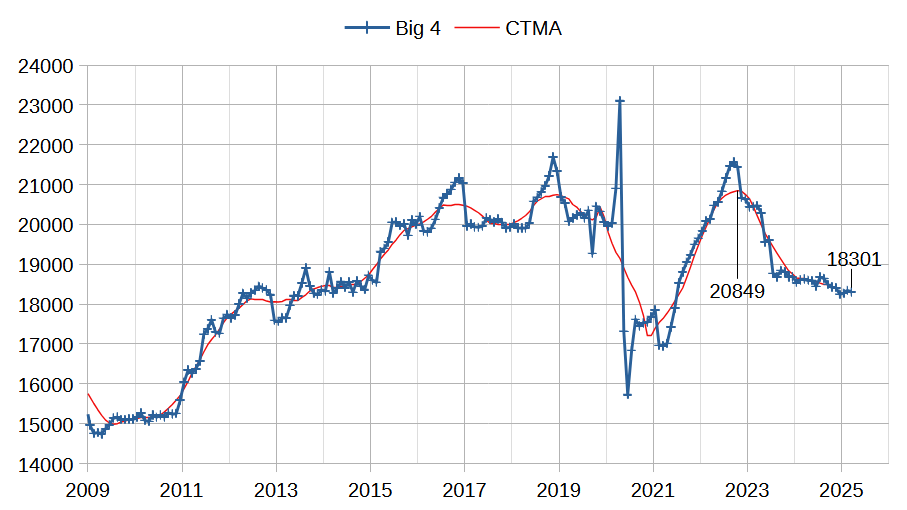
The chart above shows output from the Big 4 OPEC producers that are subject to output quotas (Saudi Arabia, UAE, Iraq, and Kuwait.) After the pandemic, Big 4 average output peaked in 2022 at a centered 12 month average (CTMA) of 20849 kb/d, crude output has been cut by 2548 kb/d relative to the 2022 CTMA peak to 18301 kb/d in March 2025. The Big 4 may have roughly 2548 kb/d of spare capacity when World demand calls for an increase in output.
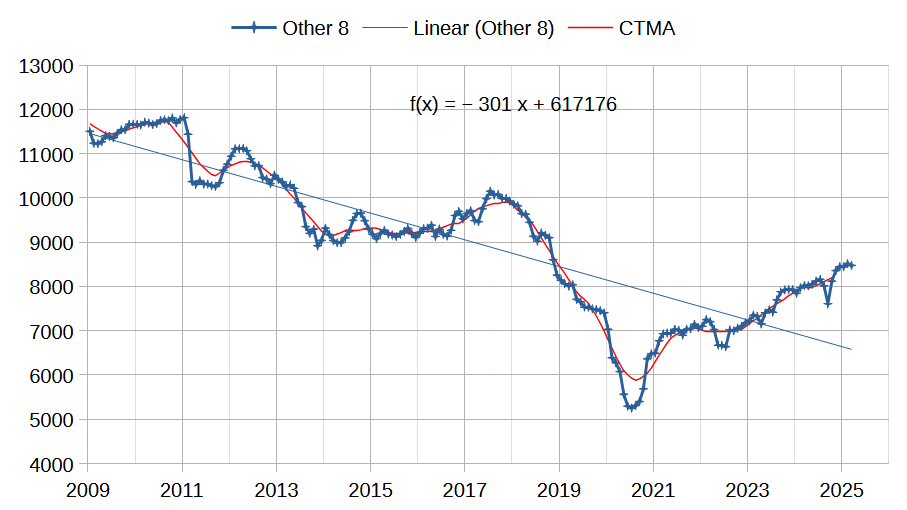
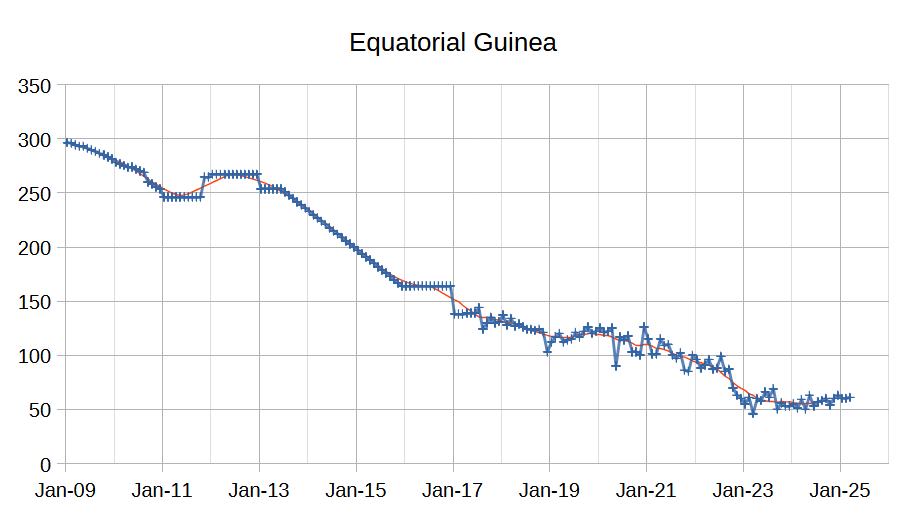
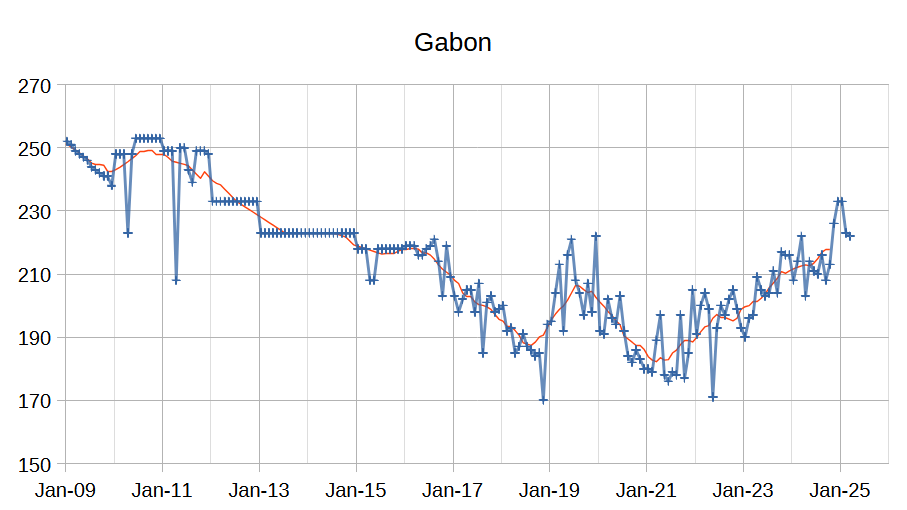
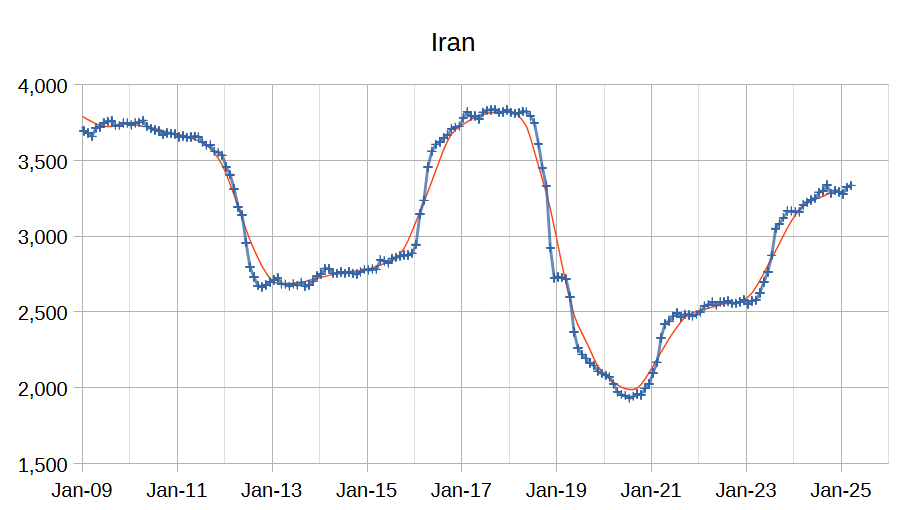
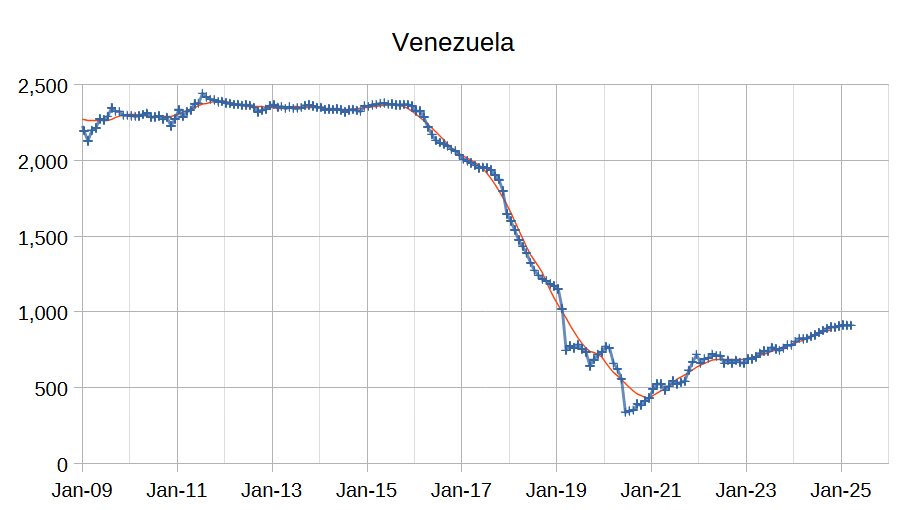
The chart above shows the trend in output for the OPEC 12 members that are not part of the big 4 producers. These Other 8 OPEC nations are producing at close to maximum capacity with the possible exception of Iran and Venezuela that are subject to US sanctions which limits their crude exports and their output. The long term trend is an annual decease of 301 kb/d since 2009, but since the pandemic their output has risen at an annual rate of 600 kb/d mostly due to increases in Venezuela and Iran as they have become more adept at avoiding US sanctions. I expect slower increase in the future for the OPEC Other 8 unless Iran and Venezuela see sanction relief.
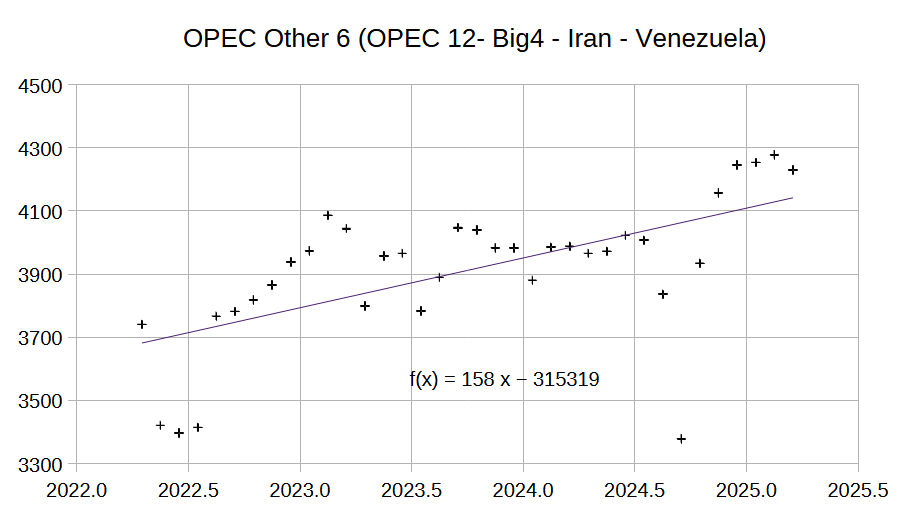
The chart above excludes Iran and Venezuela from the Other 8 OPEC grouping presented in the previous chart. Annual output growth is much slower at 158 kb/d. I believe this output growth is also likely to cease within a few years and Other 8 output may revert to the long term annual decline trend of 300 kb/d by 2027. I also expect OPEC Big 4 spare capacity could be used to keep OPEC 12 output on a plateau for about a decade (spare capacity of 2500 divided by 300 would be 8.3 years and it will be a few years until OPEC other 8 returns to the long term decline trend.)
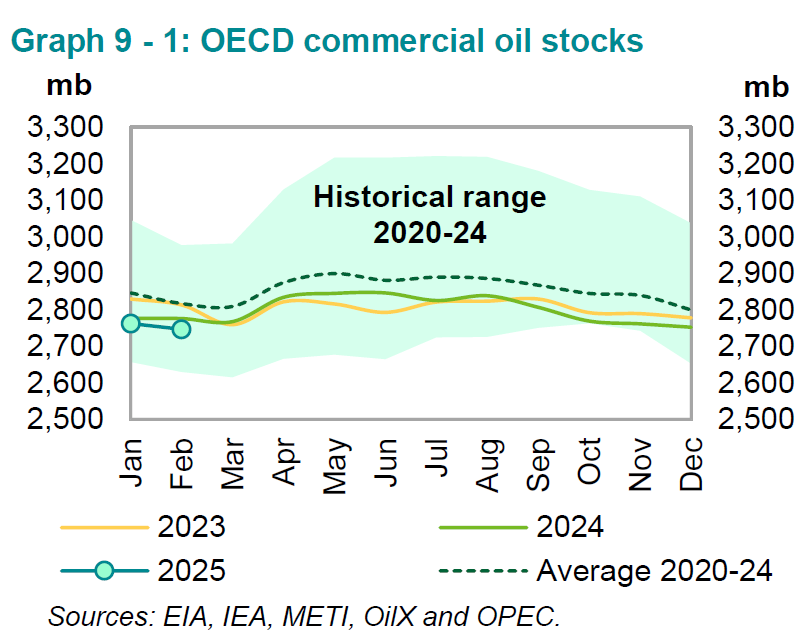
OECD commercial stocks remain well below the 5 year average, but oil prices remain low so this seems to be the new normal. It is also possible that the very high stock levels during the Pandemic may be skewing the average higher. On land commercial stocks have remained at 87 days of forward cover from 2022 to 2024 while oil on water has fallen from 34 days of forward cover in 2022 to 30 days in 2024, about a 3% decrease in total days of forward consumption for on land plus oil on water stocks over a two year stretch.
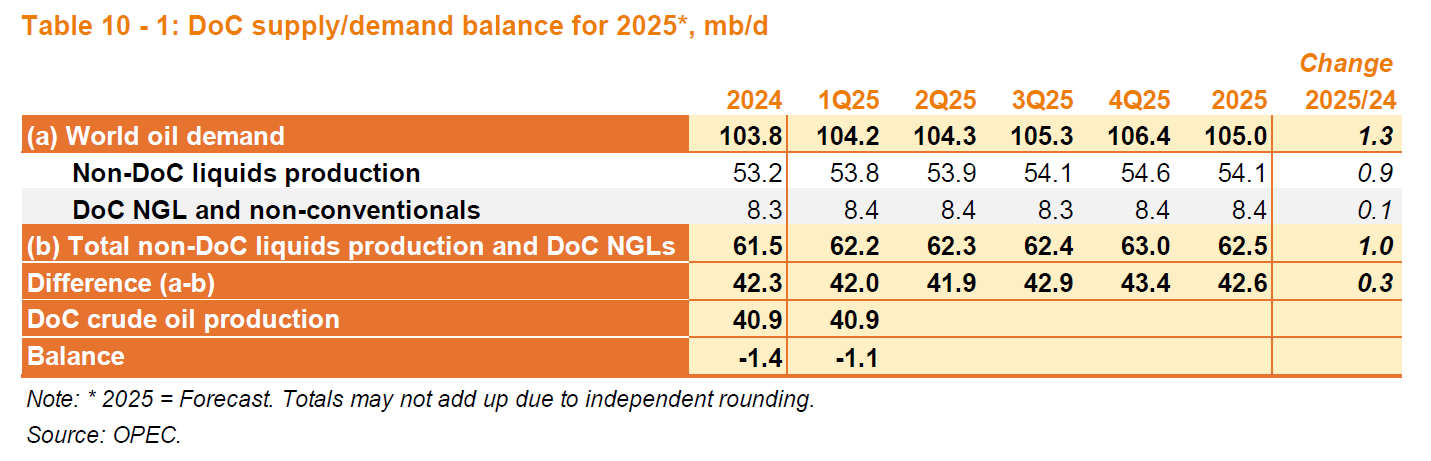
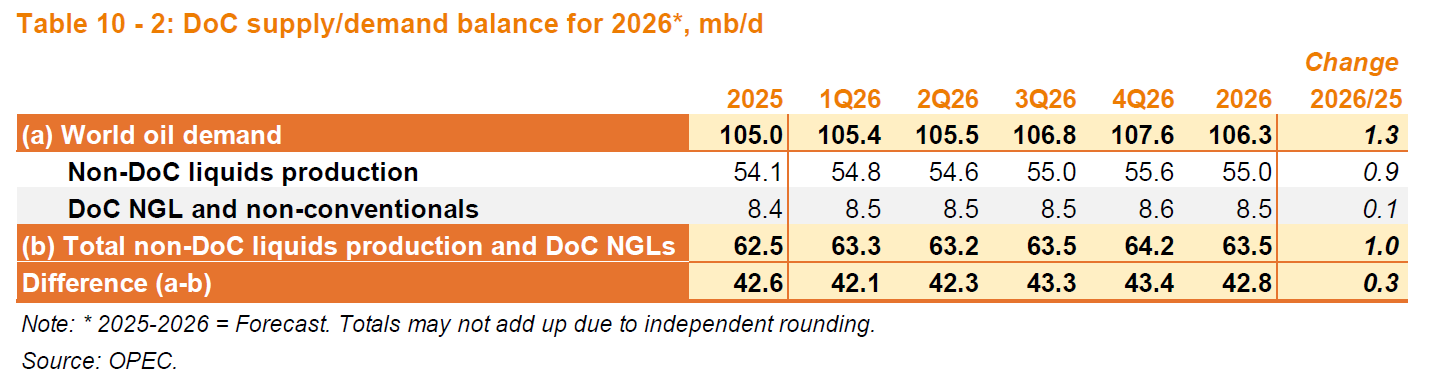
OPEC has reduced its demand estimates for World liquids in 2025 and 2026, but revised its 2024 demand estimate higher by 100 kb/d compared with last month where 2025 was 105.2 Mb/d and 2026 was 106.6 Mb/d compared with 105.0 and 106.3 Mb/d in 2025 and 2026 respectively in this Month’s MOMR.
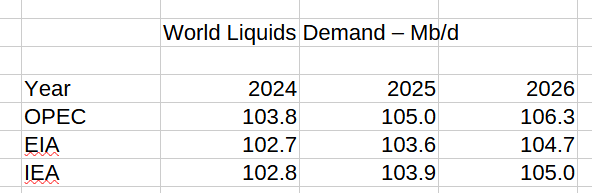
The chart above compares EIA and IEA estimates with OPEC estimates, IEA does not have a 2026 estimate I just added 0.3 Mb/d to the EIA estimate as that was the difference between the EIA and IEA estimates for 2025, but that is a WAG. The average of the OPEC and EIA estimates is 105.5 Mb/d in 2026, the average of the EIA and OPEC estimates in 2025 is 104.3, with the IEA estimate 0.4 Mb/d less than this average, using that as a guide we would get an EIA estimate of 105.5-0.4 or 105.1 Mb/d. In any case the OPEC forecast looks high, perhaps because their 2024 estimate is too high. In fact subtracting 1 Mb/d from the 2024 to 2026 estimates by OPEC results in a similar result as the IEA forecast.
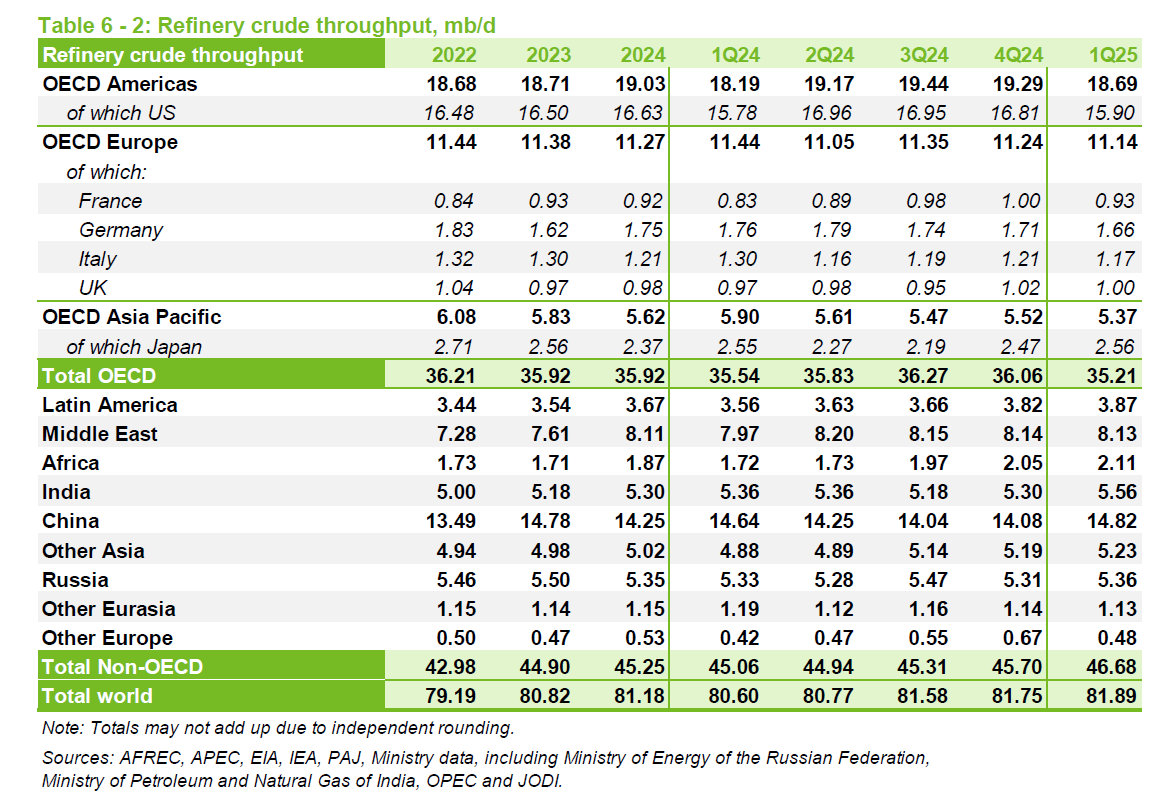
Refinery throughput is likely the best way to evaluate World C+C demand, from OPEC data the peak was 81.68 Mb/d in 2018 (some crude is burned directly for electric power in the Middle East). For the most recent 4 quarters the average refinery throughput was 81.5 Mb/d (higher than last month’s estimate by 0.1 Mb/d) so we may see a new peak this year unless there is a recession due to tariffs and economic turmoil.
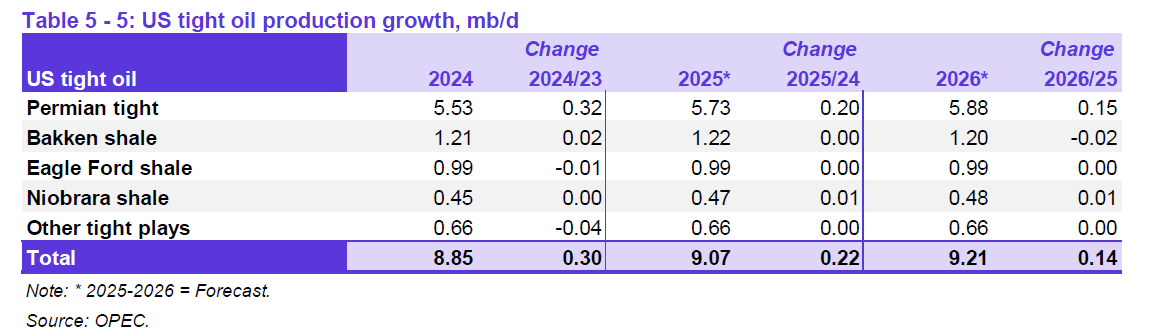
The tight oil forecast for the US in 2025 and 2026 has been revised lower by 30 kb/d in 2025 and 30 kb/d in 2026 compared to last month’s MOMR, the 2024 estimate is unchanged. Most of the increase comes from the Permian Basin.
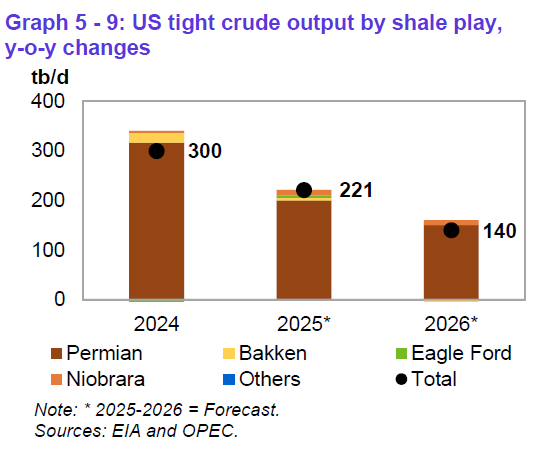
The chart above shows very clearly the slowing growth in US tight oil output and that most of the increase is Permian output.
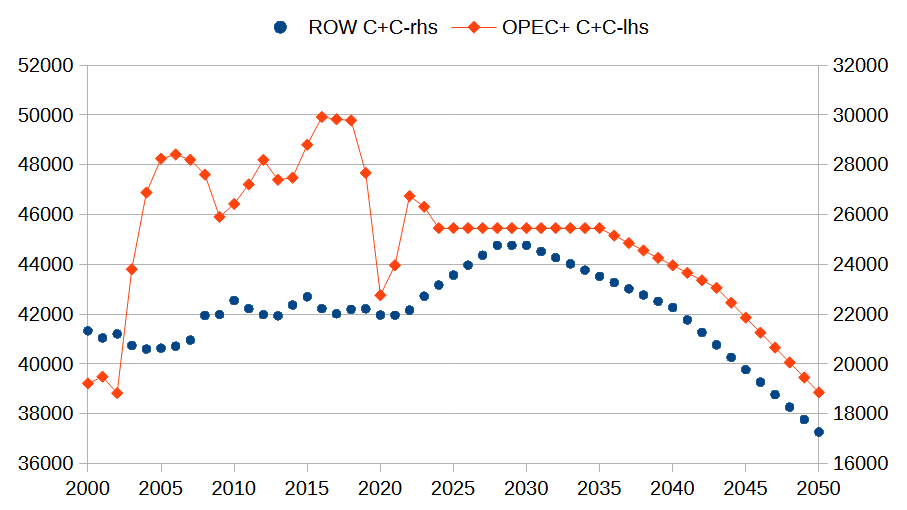
In my previous post I presented an oil shock model with roughly 2.2% annual decline in World C+C output from 2030 to 2050. In the chart above I present a scenario for future output from OPEC + which assumes a plateau in output from 2024 to 2036, then annual decline of 300 kb/d from 2037 to 2043 and annual decline of 600 kb/d from 2044 to 2050. I assume the OPEC Big 4 can offset declining output from the OPEC Other 8 up to 2036 and then Big 4 remains on a plateau while other 8 declines at 300 kb/d up to 2043 and then Big 4 declines at 300 kb/d after 2043. For the Rest of World (ROW) defined as World minus OPEC+ and US, output increases at an annual rate of 400 kb/d (2020-2024 average rate) up to 2028 and then declines at an annual rate of 250 kb/d starting in 2031 and then 500 kb/d starting in 2041.

The chart above shows the US scenario (right scale) and World scenario for C+C output. The US scenario uses the tight oil scenario presented in my previous post (URR=72 Gb) and assumes US non-tight C+C declines at an annual rate of 3% per year after 2024. The World scenario after 2024 is the sum of the OPEC+, ROW and US scenarios presented in the previous two charts. An Excel spreadsheet with this World scenario at link here.
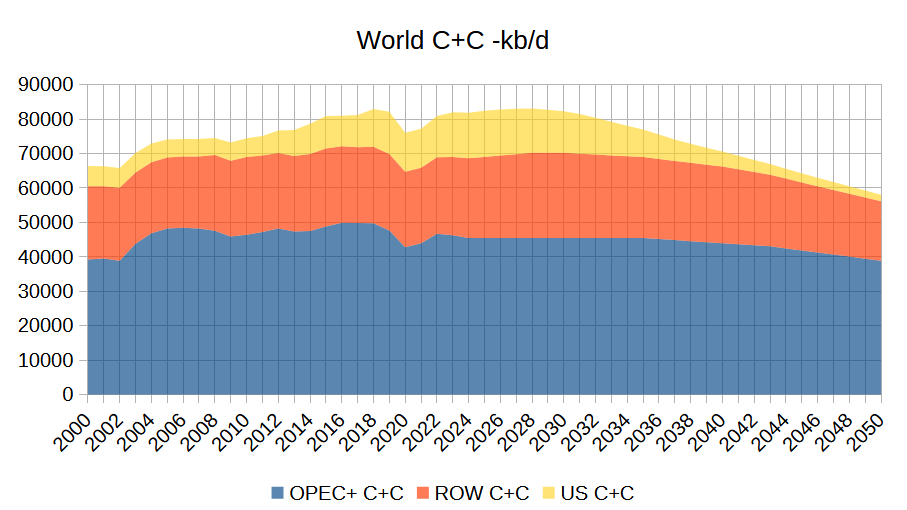
Same scenario different view. Peak is 2028 at 83.1 Mb/d.