


New-Generation Marketing Mix Modelling with Meridian
A quick introduction to the latest MMM framework from Google.Photo by Naser Tamimi on UnsplashWhat is MMM ?How does Meridian differ from previous MMM ?A practical use case with MeridianWhat is MMM ?Marketing Mix Modeling is an old statistical approach that tries to understand the impact of marketing campaigns on KPIs such as sales, conversions and traffic.Every MMM model is basically a regression, in which the regressors (marketing activities and spends, macro-economic factors, seasonality, etc) are fitted vs the target to predict. The obtained coefficients are then used to compute ROI (Return-on-investment) and other efficiency KPIs, eg:MMM approaches can be used to understand the past and make scenarios for the future. Knowing the impact of your marketing campaigns can help to guide budget allocation decisions, and answer questions like :How did the marketing channels drive my revenue or other KPI?What was my marketing return on investment (ROI)?How do I optimize my marketing budget allocation for the future?In MMM, we usually consider different types of variables in our model that can directly affect our target signal. These are typically :Control variables, such as Economic indicators (e.g., GDP, unemployment rate), Competitor activities (if available), Seasonal factors (e.g., holidays, special events), Price changes or promotionsMarketing variables, such as spends or execution (impressions, clicks, etc.)A KPI used as the response (revenue, customers, conversions, etc.)External data (ie weather)Group indication (for ex: region, city, etc.)How does Meridian differ from previous MMM ?A Bayesian frameworkTraditional MMM often use standard regression techniques based on what is called Maximum Likelihood Estimate. This often requires a lot of data to be stable, and provides no information about uncertainty. Traditional MMM regressions provide point estimates, meaning that if our goal is to estimate the coefficients β of each marketing channel (roughly equivalent to our marginal ROI), we would get a scalar value (1.2, 10.5, -2.3, etc…).Bayesian MMM rely on a different approach which uses Bayes theorem and Markov Chain Monte Carlo sampling to estimate our parameters β. But instead of having a scalar value, we get distributions over our parameters. This becomes handy because we can have access to a range of credible value for our parameters, take the mean if we need a value, or a percentile, and get a notion of the standard deviation to represent the uncertainty around our parameter.Imagine you are asking a frequentist and a bayesian about tomorrow’s temperature:Frequentist : tomorrow’s forecasted temperature is 12.5 °CBayesian : tomorrow’s forecasted temperature is a gaussian centered around 11.5 °C with a standard deviation of 1.2°C.Knowing this uncertainty is very helpful when it comes to taking decisions. Of course, this view is a bit simplistic since frequentists will object that we can use p-values for our point estimates and have access to confidence intervals.Bayesian models are also very good at dealing with small amounts of data. Data can always have missing values or be too coarse. This kind of noisy data environment can be a challenge for traditional methods that rely solely upon data to draw their conclusions. Bayesian methods can deal with data sparsity by injecting prior knowledge to the model. Uncertainty in the model parameters will decrease when the dataset increases.image by authorAdstock and SaturationGoogle Meridian includes two important concepts which are adstock and saturation.Adstock models the effect of spend on sales being not instantaneous but accumulating over time.image by authorSaturation effect models the fact that the effect of spend on sales is not linear but saturates at some point (also called Diminishing Returns).image by authorGeo-level ModellingMeridian can perform hierarchical modelling, meaning that you can model groups of data (for ex: regions) in one single model. This is often handy as it is a good solution between having one model for every region (also called unpooled models) and one model which “averages” all regions (pooled models). In this approach, regions kind of “learn” together while keeping their specificity.Components of the modelHere is a simplified view of the components used by Meridian. As mentionned earlier, it is a regression model including several variables.This model will learn parameters from our data
A quick introduction to the latest MMM framework from Google.

- What is MMM ?
- How does Meridian differ from previous MMM ?
- A practical use case with Meridian
What is MMM ?
Marketing Mix Modeling is an old statistical approach that tries to understand the impact of marketing campaigns on KPIs such as sales, conversions and traffic.
Every MMM model is basically a regression, in which the regressors (marketing activities and spends, macro-economic factors, seasonality, etc) are fitted vs the target to predict. The obtained coefficients are then used to compute ROI (Return-on-investment) and other efficiency KPIs, eg: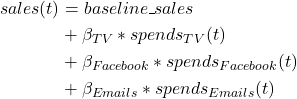
MMM approaches can be used to understand the past and make scenarios for the future. Knowing the impact of your marketing campaigns can help to guide budget allocation decisions, and answer questions like :
How did the marketing channels drive my revenue or other KPI?
What was my marketing return on investment (ROI)?
How do I optimize my marketing budget allocation for the future?
In MMM, we usually consider different types of variables in our model that can directly affect our target signal. These are typically :
- Control variables, such as Economic indicators (e.g., GDP, unemployment rate), Competitor activities (if available), Seasonal factors (e.g., holidays, special events), Price changes or promotions
- Marketing variables, such as spends or execution (impressions, clicks, etc.)
- A KPI used as the response (revenue, customers, conversions, etc.)
- External data (ie weather)
- Group indication (for ex: region, city, etc.)
How does Meridian differ from previous MMM ?
A Bayesian framework
Traditional MMM often use standard regression techniques based on what is called Maximum Likelihood Estimate. This often requires a lot of data to be stable, and provides no information about uncertainty. Traditional MMM regressions provide point estimates, meaning that if our goal is to estimate the coefficients β of each marketing channel (roughly equivalent to our marginal ROI), we would get a scalar value (1.2, 10.5, -2.3, etc…).
Bayesian MMM rely on a different approach which uses Bayes theorem and Markov Chain Monte Carlo sampling to estimate our parameters β. But instead of having a scalar value, we get distributions over our parameters. This becomes handy because we can have access to a range of credible value for our parameters, take the mean if we need a value, or a percentile, and get a notion of the standard deviation to represent the uncertainty around our parameter.
Imagine you are asking a frequentist and a bayesian about tomorrow’s temperature:
Frequentist : tomorrow’s forecasted temperature is 12.5 °C
Bayesian : tomorrow’s forecasted temperature is a gaussian centered around 11.5 °C with a standard deviation of 1.2°C.
Knowing this uncertainty is very helpful when it comes to taking decisions. Of course, this view is a bit simplistic since frequentists will object that we can use p-values for our point estimates and have access to confidence intervals.
Bayesian models are also very good at dealing with small amounts of data. Data can always have missing values or be too coarse. This kind of noisy data environment can be a challenge for traditional methods that rely solely upon data to draw their conclusions. Bayesian methods can deal with data sparsity by injecting prior knowledge to the model. Uncertainty in the model parameters will decrease when the dataset increases.
Adstock and Saturation
Google Meridian includes two important concepts which are adstock and saturation.
Adstock models the effect of spend on sales being not instantaneous but accumulating over time.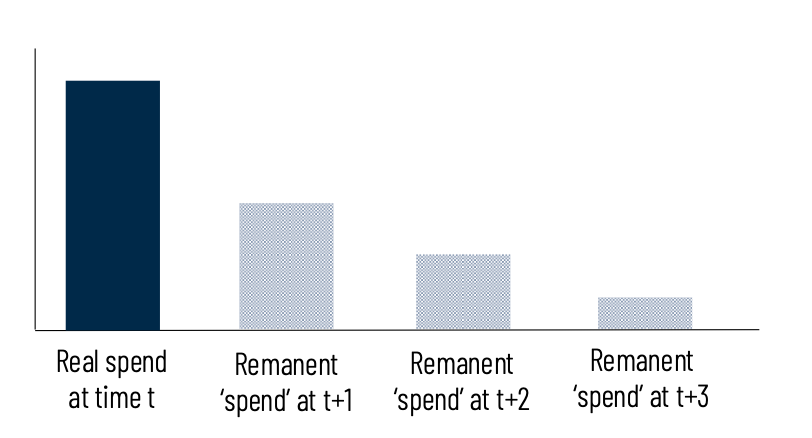
Saturation effect models the fact that the effect of spend on sales is not linear but saturates at some point (also called Diminishing Returns).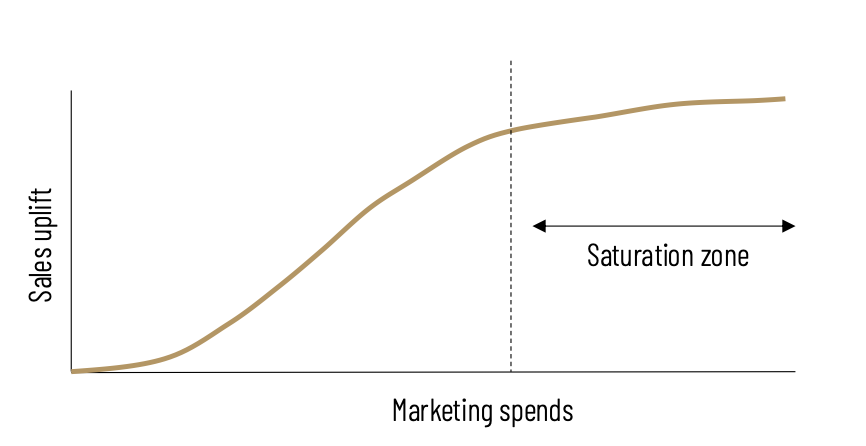
Geo-level Modelling
Meridian can perform hierarchical modelling, meaning that you can model groups of data (for ex: regions) in one single model. This is often handy as it is a good solution between having one model for every region (also called unpooled models) and one model which “averages” all regions (pooled models). In this approach, regions kind of “learn” together while keeping their specificity.
Components of the model
Here is a simplified view of the components used by Meridian. As mentionned earlier, it is a regression model including several variables.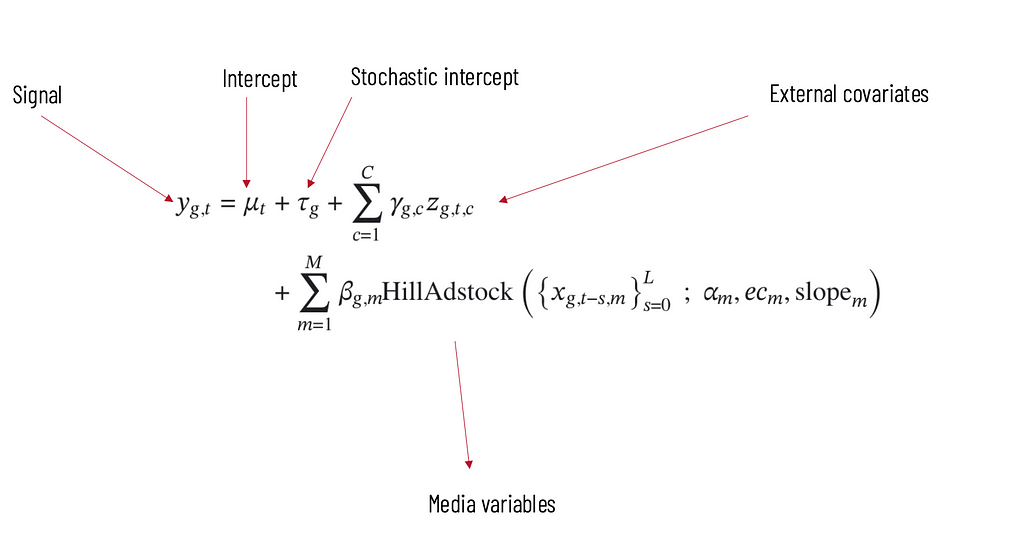
This model will learn parameters from our data