


Dining Out Is Devouring Your Budget — And It’s Worse in Some States Than Others
24/7 Wall St. Insights Americans spent $4,074 on going out to eat per capita in 2023. Dining out costs vary widely from state to state, ranging from $2,870 to $5,298. Many of the states with the highest food services expenditure have large tourism sectors and high cost of living overall. Also: Discover the next Nvidia […] The post Dining Out Is Devouring Your Budget — And It’s Worse in Some States Than Others appeared first on 24/7 Wall St..

24/7 Wall St. Insights
- Americans spent $4,074 on going out to eat per capita in 2023.
- Dining out costs vary widely from state to state, ranging from $2,870 to $5,298.
- Many of the states with the highest food services expenditure have large tourism sectors and high cost of living overall.
- Also: Discover the next Nvidia
Grabbing lunch shouldn’t feel like a splurge — but these days, it often does. Restaurant spending has skyrocketed, and in some states, going out to eat costs far more than you’d expect.
In 2023, Americans spent a combined $1.4 trillion on food services and accommodation, up 42.0% from 2018. Adjusted for population, spending on going out to eat amounts to $4,074 per American per year. That number is as high as $5,298 in some states, and as low as $2,870 in others. A closer look at the data reveals the states where Americans are spending the most on going out to eat.
To determine the states spending the most on going out to eat, 24/7 Wall St. reviewed data on personal consumption expenditures from the Bureau of Economic Analysis. States were ranked based on annual personal expenditure on food services and accommodation per capita in 2023. Expenditure totals were adjusted for population using data from the U.S. Census Bureau.
50. Arkansas

- Personal food service and accommodation expenditure, adjusted for population: $2,870 per capita
- Cost of living: -13.5% less than national average
- Total food service and accommodation expenditure: $8.8 billion
- Total population: 3.1 million
- Other major spending categories: Gasoline and other energy goods, financial services and insurance, clothing and footwear, furnishings and durable household equipment, recreational goods and vehicles, health care
49. West Virginia

- Personal food service and accommodation expenditure, adjusted for population: $2,939 per capita
- Cost of living: -10.2% less than national average
- Total food service and accommodation expenditure: $5.2 billion
- Total population: 1.8 million
- Other major spending categories: Health care, gasoline and other energy goods, groceries, motor vehicles and parts, financial services and insurance, housing and utilities
48. Iowa

- Personal food service and accommodation expenditure, adjusted for population: $2,957 per capita
- Cost of living: -11.2% less than national average
- Total food service and accommodation expenditure: $9.5 billion
- Total population: 3.2 million
- Other major spending categories: Gasoline and other energy goods, motor vehicles and parts, groceries, recreational goods and vehicles, transportation services, health care
47. Idaho
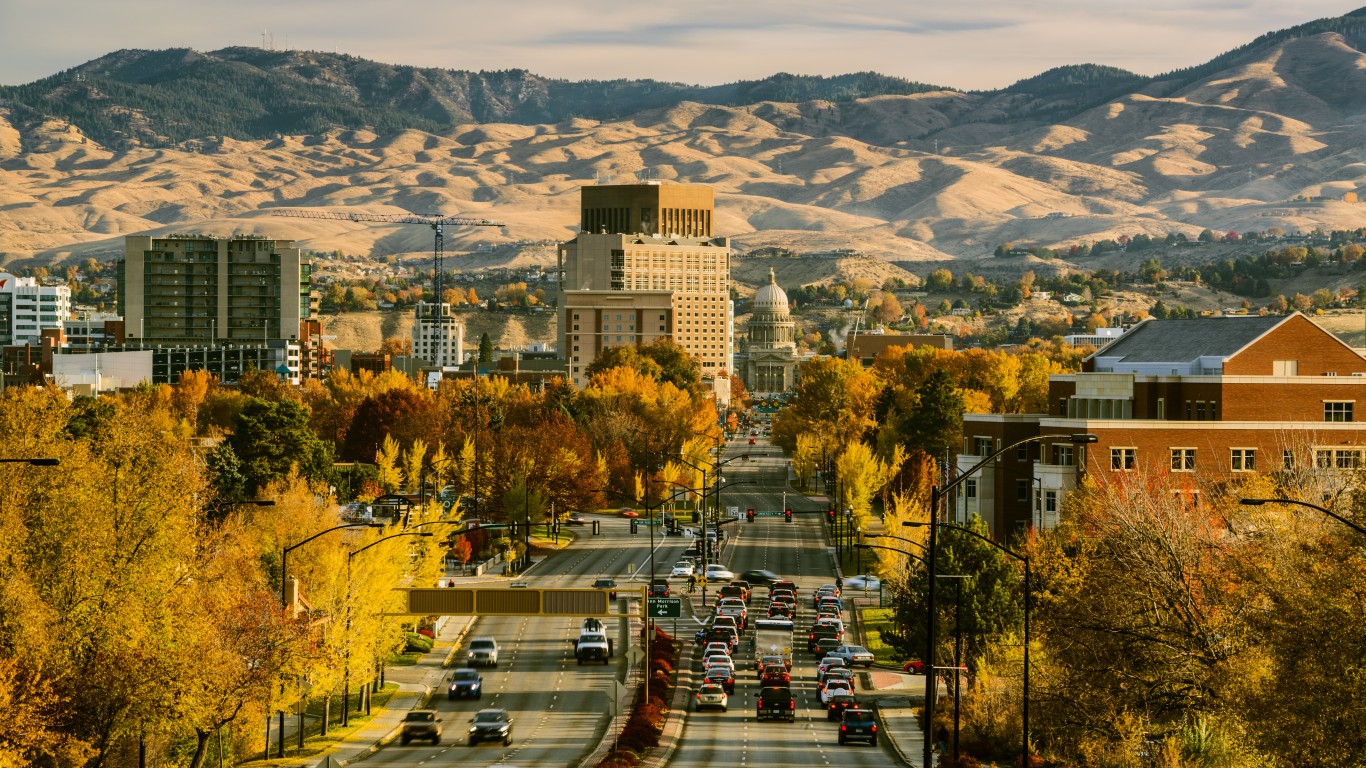
- Personal food service and accommodation expenditure, adjusted for population: $3,004 per capita
- Cost of living: -8.6% less than national average
- Total food service and accommodation expenditure: $5.9 billion
- Total population: 2.0 million
- Other major spending categories: Recreational goods and vehicles, gasoline and other energy goods, motor vehicles and parts, housing and utilities, furnishings and durable household equipment, transportation services
46. Mississippi

- Personal food service and accommodation expenditure, adjusted for population: $3,161 per capita
- Cost of living: -12.7% less than national average
- Total food service and accommodation expenditure: $9.3 billion
- Total population: 2.9 million
- Other major spending categories: Gasoline and other energy goods, clothing and footwear, motor vehicles and parts, groceries, health care
45. Michigan

- Personal food service and accommodation expenditure, adjusted for population: $3,212 per capita
- Cost of living: -5.8% less than national average
- Total food service and accommodation expenditure: $32.2 billion
- Total population: 10.0 million
- Other major spending categories: Financial services and insurance, gasoline and other energy goods, recreational goods and vehicles, groceries, clothing and footwear, housing and utilities
44. Alabama

- Personal food service and accommodation expenditure, adjusted for population: $3,235 per capita
- Cost of living: -10.0% less than national average
- Total food service and accommodation expenditure: $16.5 billion
- Total population: 5.1 million
- Other major spending categories: Motor vehicles and parts, gasoline and other energy goods, clothing and footwear, recreational goods and vehicles, groceries, furnishings and durable household equipment
43. Kansas

- Personal food service and accommodation expenditure, adjusted for population: $3,253 per capita
- Cost of living: -10.0% less than national average
- Total food service and accommodation expenditure: $9.6 billion
- Total population: 2.9 million
- Other major spending categories: Groceries, motor vehicles and parts, financial services and insurance, furnishings and durable household equipment, health care, gasoline and other energy goods
42. Kentucky

- Personal food service and accommodation expenditure, adjusted for population: $3,264 per capita
- Cost of living: -9.5% less than national average
- Total food service and accommodation expenditure: $14.8 billion
- Total population: 4.5 million
- Other major spending categories: Gasoline and other energy goods, health care, groceries, motor vehicles and parts, recreation services
41. Utah

- Personal food service and accommodation expenditure, adjusted for population: $3,273 per capita
- Cost of living: -5.0% less than national average
- Total food service and accommodation expenditure: $11.2 billion
- Total population: 3.4 million
- Other major spending categories: Recreational goods and vehicles, furnishings and durable household equipment, motor vehicles and parts, transportation services, gasoline and other energy goods, housing and utilities
40. Ohio

- Personal food service and accommodation expenditure, adjusted for population: $3,289 per capita
- Cost of living: -8.2% less than national average
- Total food service and accommodation expenditure: $38.8 billion
- Total population: 11.8 million
- Other major spending categories: Health care, recreational goods and vehicles, groceries, gasoline and other energy goods, recreation services, furnishings and durable household equipment
39. Wisconsin

- Personal food service and accommodation expenditure, adjusted for population: $3,335 per capita
- Cost of living: -6.9% less than national average
- Total food service and accommodation expenditure: $19.7 billion
- Total population: 5.9 million
- Other major spending categories: Gasoline and other energy goods, motor vehicles and parts, recreational goods and vehicles, financial services and insurance, health care, furnishings and durable household equipment
38. Indiana

- Personal food service and accommodation expenditure, adjusted for population: $3,342 per capita
- Cost of living: -7.8% less than national average
- Total food service and accommodation expenditure: $22.9 billion
- Total population: 6.9 million
- Other major spending categories: Health care, gasoline and other energy goods, motor vehicles and parts, recreational goods and vehicles, groceries, furnishings and durable household equipment
37. Pennsylvania

- Personal food service and accommodation expenditure, adjusted for population: $3,367 per capita
- Cost of living: -2.5% less than national average
- Total food service and accommodation expenditure: $43.6 billion
- Total population: 13.0 million
- Other major spending categories: Recreational goods and vehicles, financial services and insurance, health care, furnishings and durable household equipment, gasoline and other energy goods, clothing and footwear
36. Minnesota
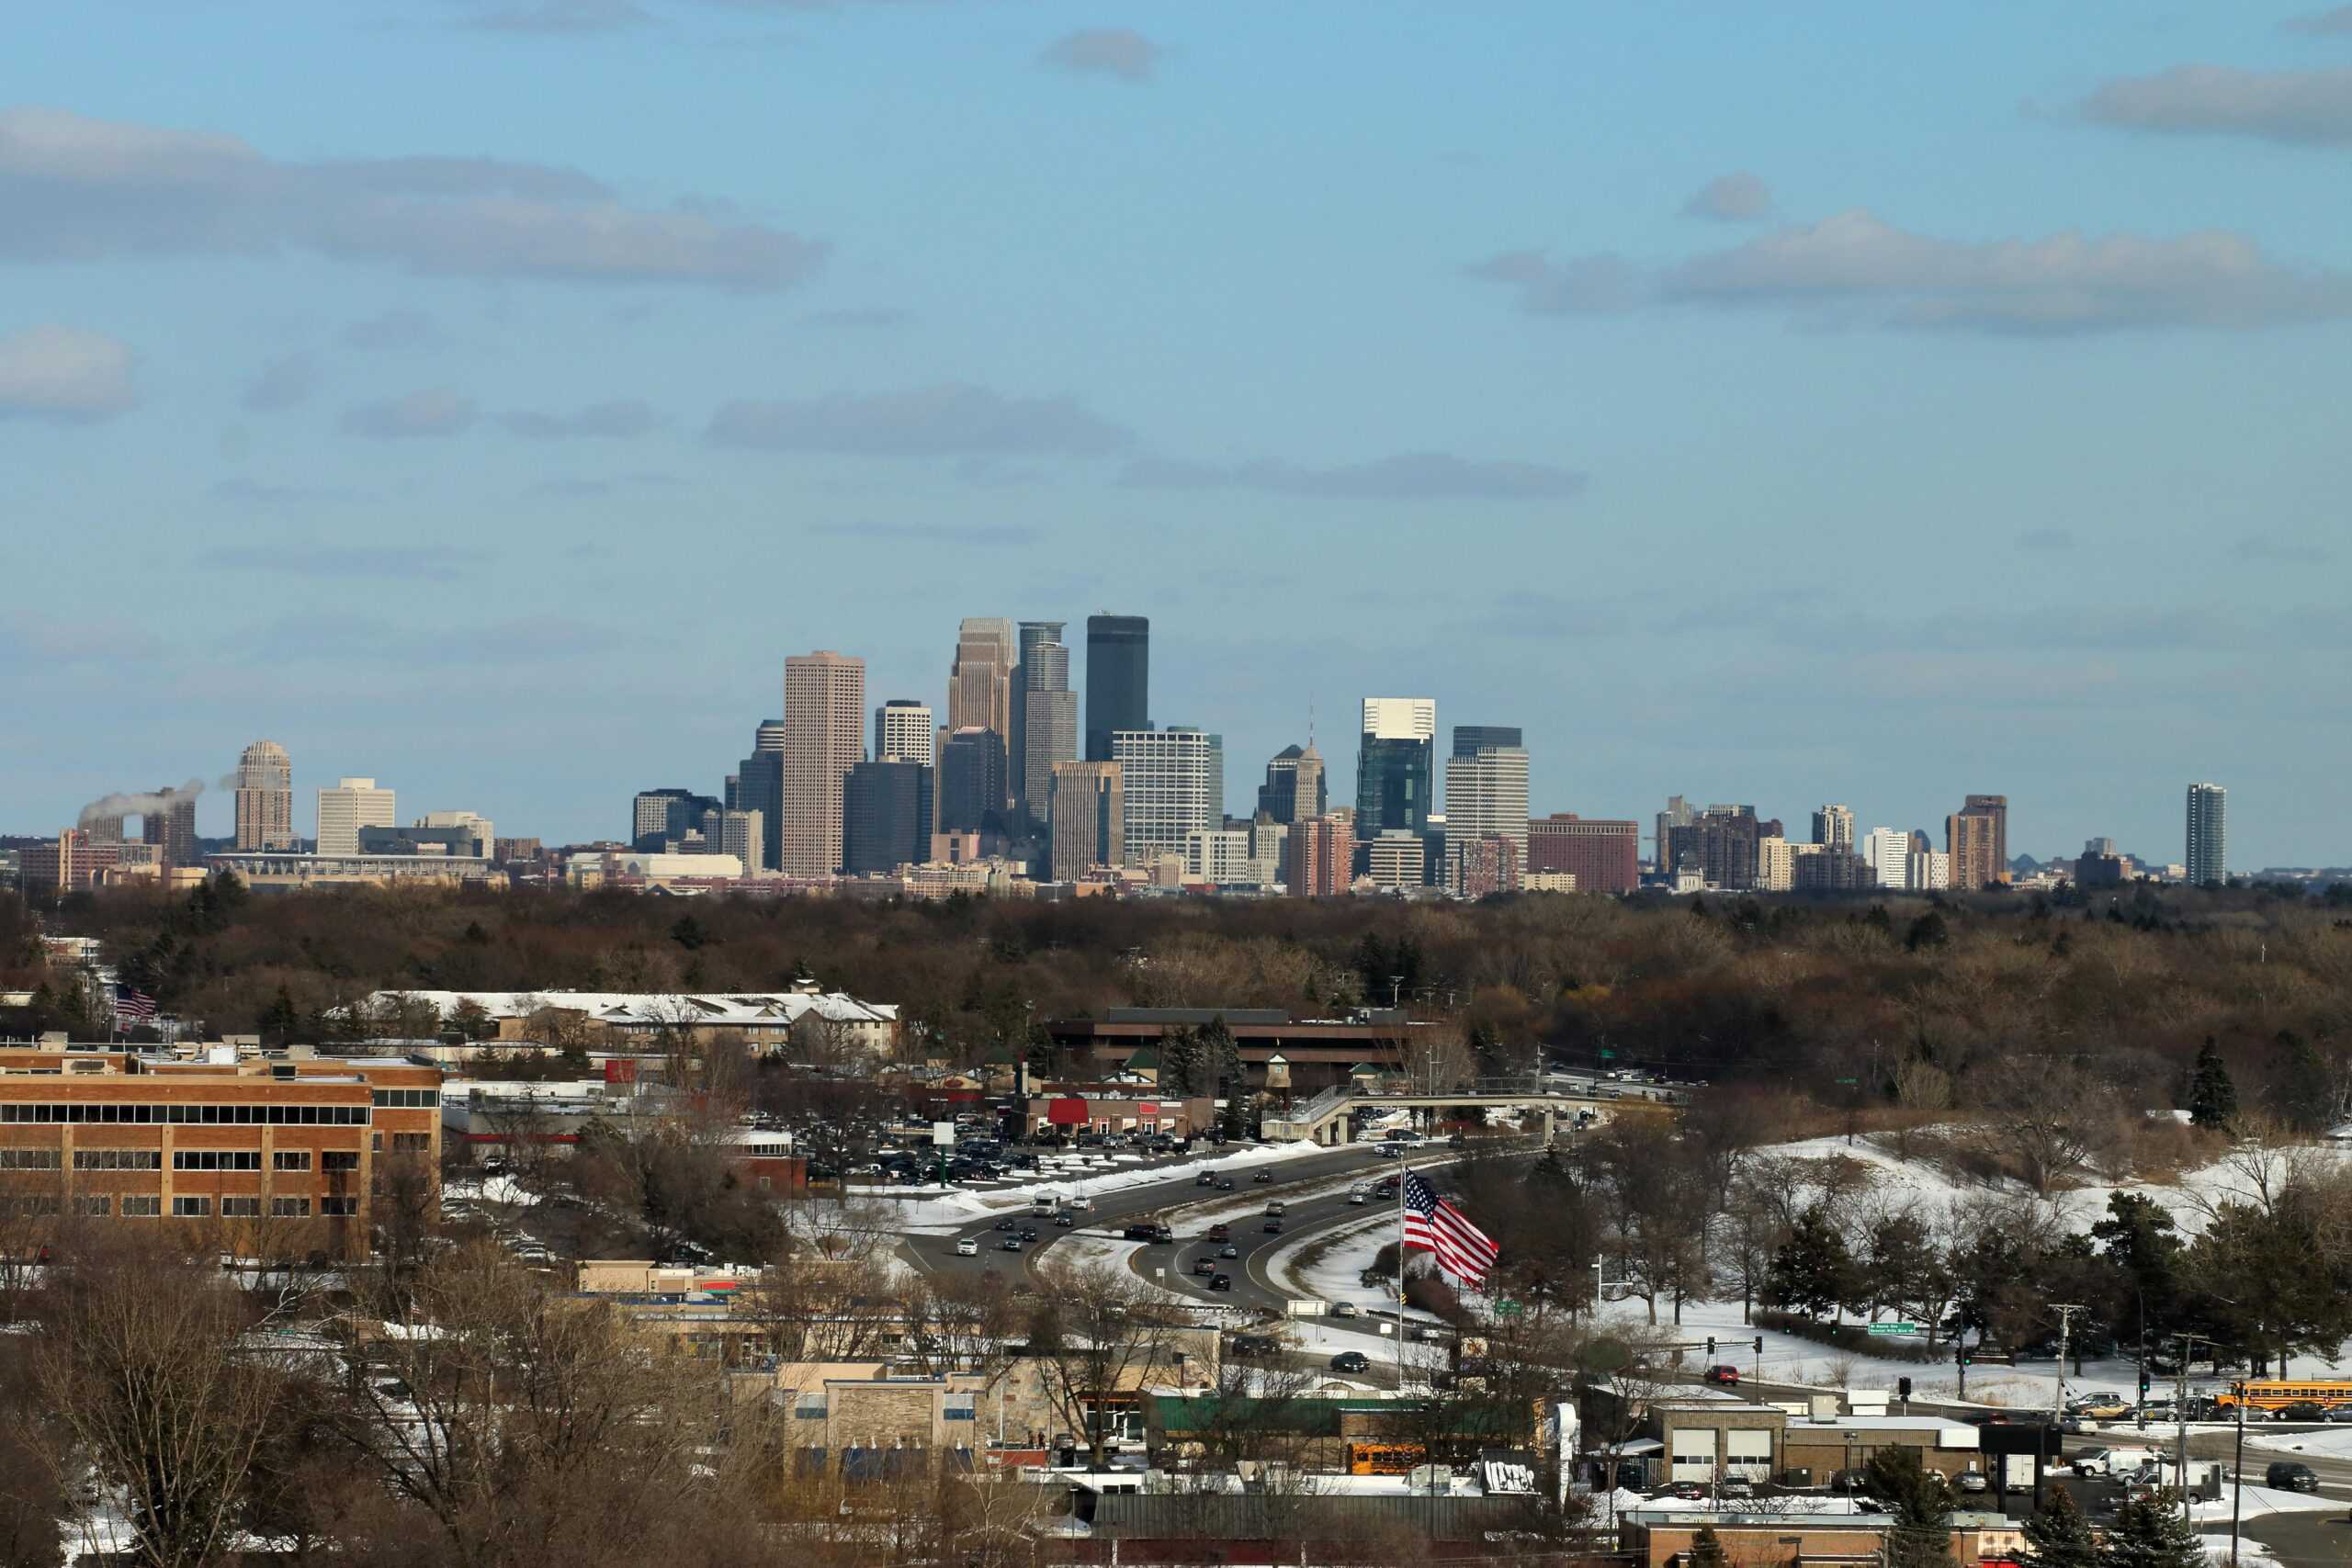
- Personal food service and accommodation expenditure, adjusted for population: $3,368 per capita
- Cost of living: -1.6% less than national average
- Total food service and accommodation expenditure: $19.3 billion
- Total population: 5.7 million
- Other major spending categories: Recreational goods and vehicles, motor vehicles and parts, financial services and insurance, health care, gasoline and other energy goods, clothing and footwear
35. Nebraska

- Personal food service and accommodation expenditure, adjusted for population: $3,371 per capita
- Cost of living: -9.6% less than national average
- Total food service and accommodation expenditure: $6.7 billion
- Total population: 2.0 million
- Other major spending categories: Motor vehicles and parts, gasoline and other energy goods, financial services and insurance, health care, transportation services, recreational goods and vehicles
34. Oklahoma

- Personal food service and accommodation expenditure, adjusted for population: $3,480 per capita
- Cost of living: -11.7% less than national average
- Total food service and accommodation expenditure: $14.1 billion
- Total population: 4.1 million
- Other major spending categories: Motor vehicles and parts, gasoline and other energy goods, clothing and footwear, health care, recreational goods and vehicles
33. Missouri

- Personal food service and accommodation expenditure, adjusted for population: $3,568 per capita
- Cost of living: -8.2% less than national average
- Total food service and accommodation expenditure: $22.1 billion
- Total population: 6.2 million
- Other major spending categories: Gasoline and other energy goods, motor vehicles and parts, financial services and insurance, health care, recreation services, transportation services
32. South Dakota
- Personal food service and accommodation expenditure, adjusted for population: $3,657 per capita
- Cost of living: -11.9% less than national average
- Total food service and accommodation expenditure: $3.4 billion
- Total population: 919,318
- Other major spending categories: Health care, furnishings and durable household equipment, recreation services, transportation services, clothing and footwear
31. North Carolina

- Personal food service and accommodation expenditure, adjusted for population: $3,708 per capita
- Cost of living: -5.9% less than national average
- Total food service and accommodation expenditure: $40.2 billion
- Total population: 10.8 million
- Other major spending categories: Recreational goods and vehicles, furnishings and durable household equipment, motor vehicles and parts, clothing and footwear, groceries, recreation services
30. Louisiana

- Personal food service and accommodation expenditure, adjusted for population: $3,767 per capita
- Cost of living: -11.7% less than national average
- Total food service and accommodation expenditure: $17.2 billion
- Total population: 4.6 million
- Other major spending categories: Motor vehicles and parts, health care, gasoline and other energy goods, clothing and footwear, financial services and insurance
29. Wyoming

- Personal food service and accommodation expenditure, adjusted for population: $3,814 per capita
- Cost of living: -9.2% less than national average
- Total food service and accommodation expenditure: $2.2 billion
- Total population: 584,057
- Other major spending categories: Financial services and insurance, clothing and footwear, motor vehicles and parts, gasoline and other energy goods, groceries, transportation services
28. Georgia

- Personal food service and accommodation expenditure, adjusted for population: $3,820 per capita
- Cost of living: -3.3% less than national average
- Total food service and accommodation expenditure: $42.1 billion
- Total population: 11.0 million
- Other major spending categories: Transportation services, clothing and footwear, groceries, motor vehicles and parts, gasoline and other energy goods, recreation services
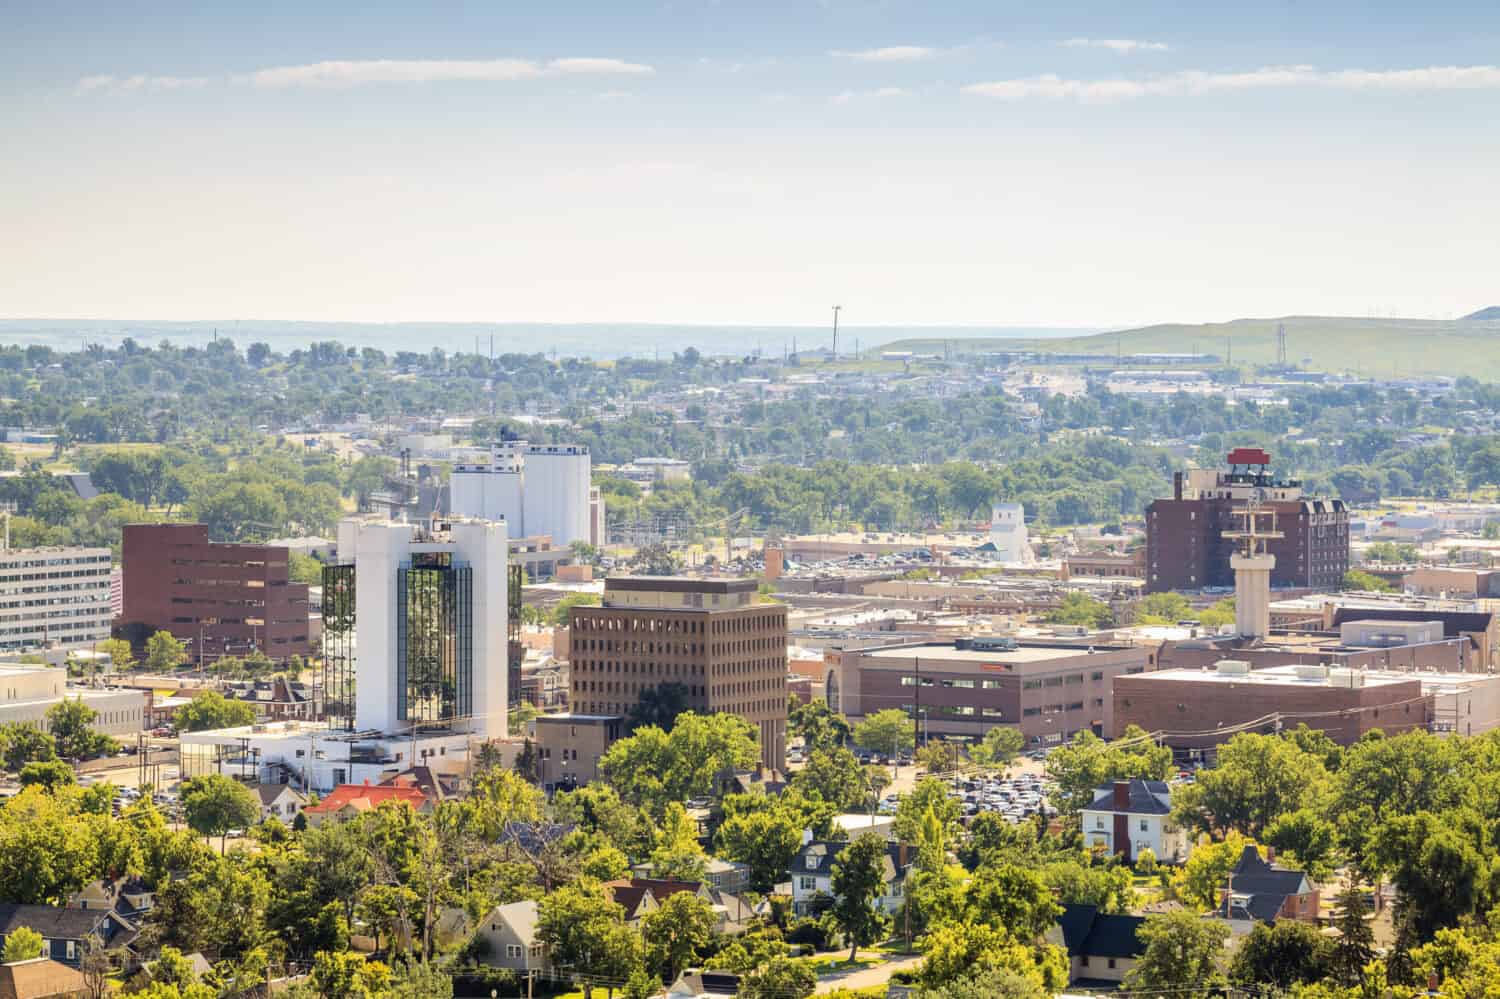
27. North Dakota

- Personal food service and accommodation expenditure, adjusted for population: $3,853 per capita
- Cost of living: -11.4% less than national average
- Total food service and accommodation expenditure: $3.0 billion
- Total population: 783,926
- Other major spending categories: Recreational goods and vehicles, health care, financial services and insurance, motor vehicles and parts, clothing and footwear, furnishings and durable household equipment
26. Maryland

- Personal food service and accommodation expenditure, adjusted for population: $3,888 per capita
- Cost of living: +4.0% more than national average
- Total food service and accommodation expenditure: $24.0 billion
- Total population: 6.2 million
- Other major spending categories: Clothing and footwear, housing and utilities, recreation services, recreational goods and vehicles, transportation services
25. South Carolina

- Personal food service and accommodation expenditure, adjusted for population: $3,911 per capita
- Cost of living: -6.8% less than national average
- Total food service and accommodation expenditure: $21.0 billion
- Total population: 5.4 million
- Other major spending categories: Gasoline and other energy goods, motor vehicles and parts, clothing and footwear, groceries, housing and utilities
24. Tennessee

- Personal food service and accommodation expenditure, adjusted for population: $3,931 per capita
- Cost of living: -7.5% less than national average
- Total food service and accommodation expenditure: $28.0 billion
- Total population: 7.1 million
- Other major spending categories: Clothing and footwear, financial services and insurance, gasoline and other energy goods, motor vehicles and parts, furnishings and durable household equipment
23. New Mexico
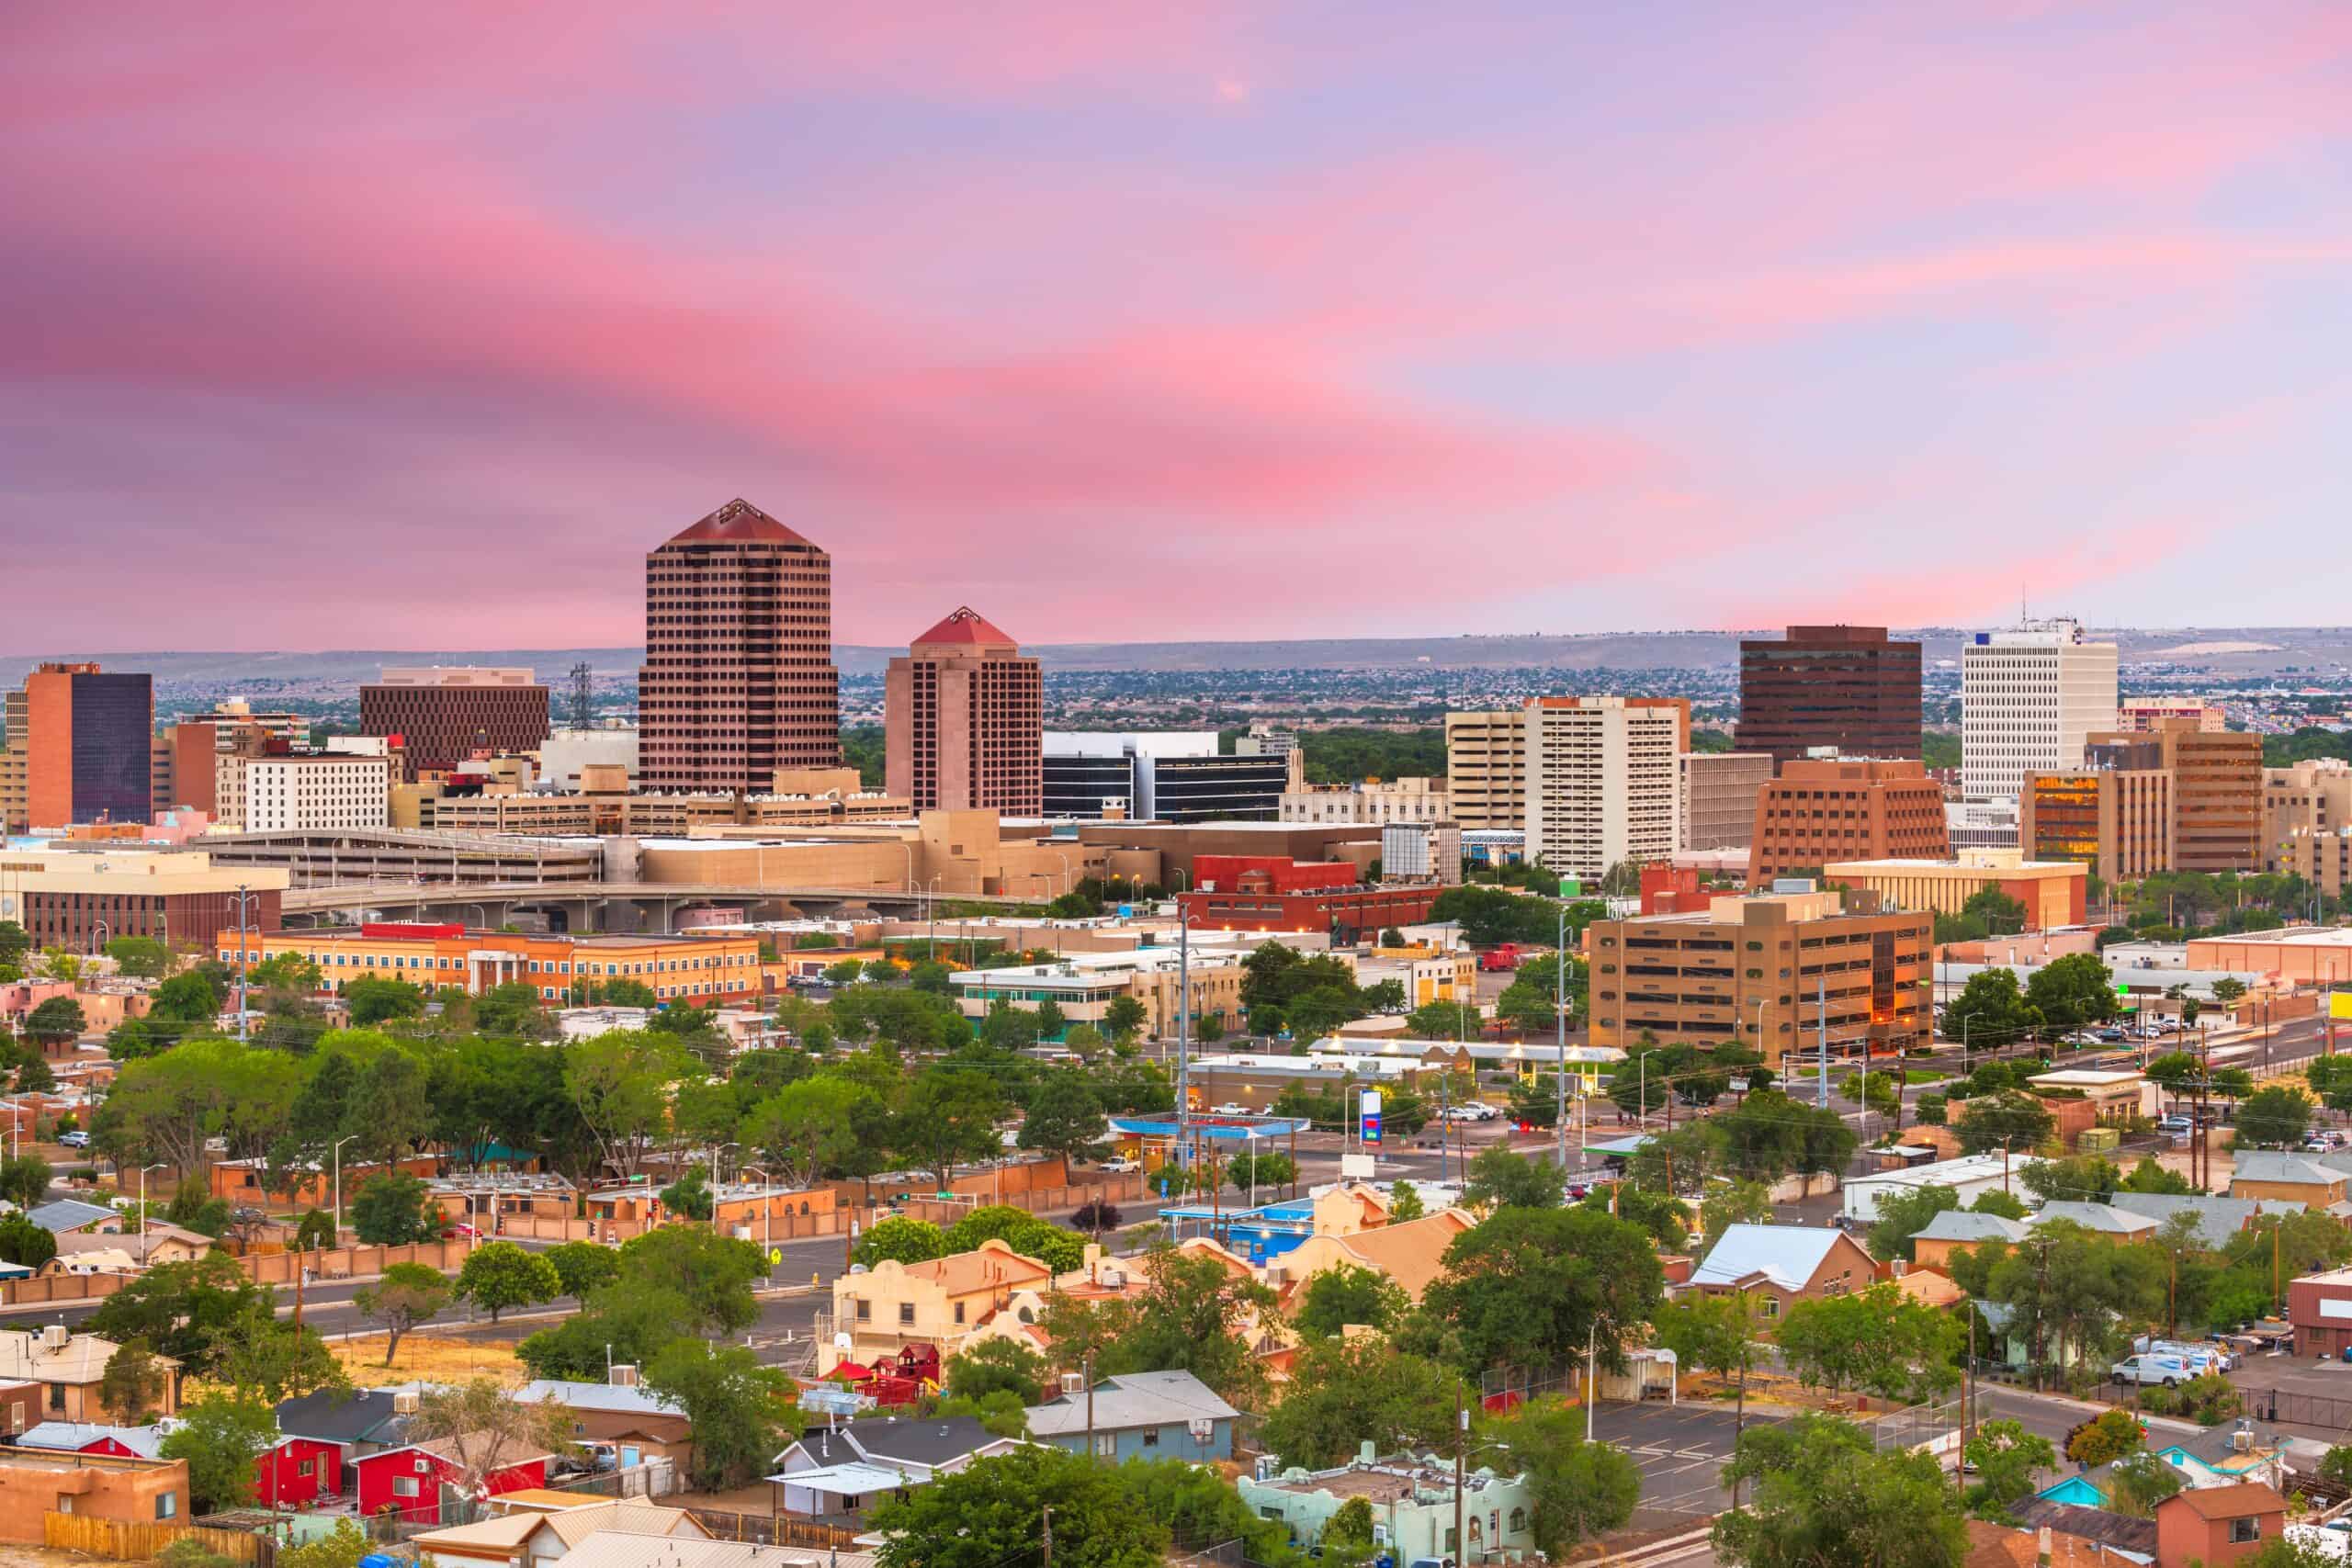
- Personal food service and accommodation expenditure, adjusted for population: $3,932 per capita
- Cost of living: -9.6% less than national average
- Total food service and accommodation expenditure: $8.3 billion
- Total population: 2.1 million
- Other major spending categories: Gasoline and other energy goods, motor vehicles and parts, groceries, housing and utilities, health care
22. Montana
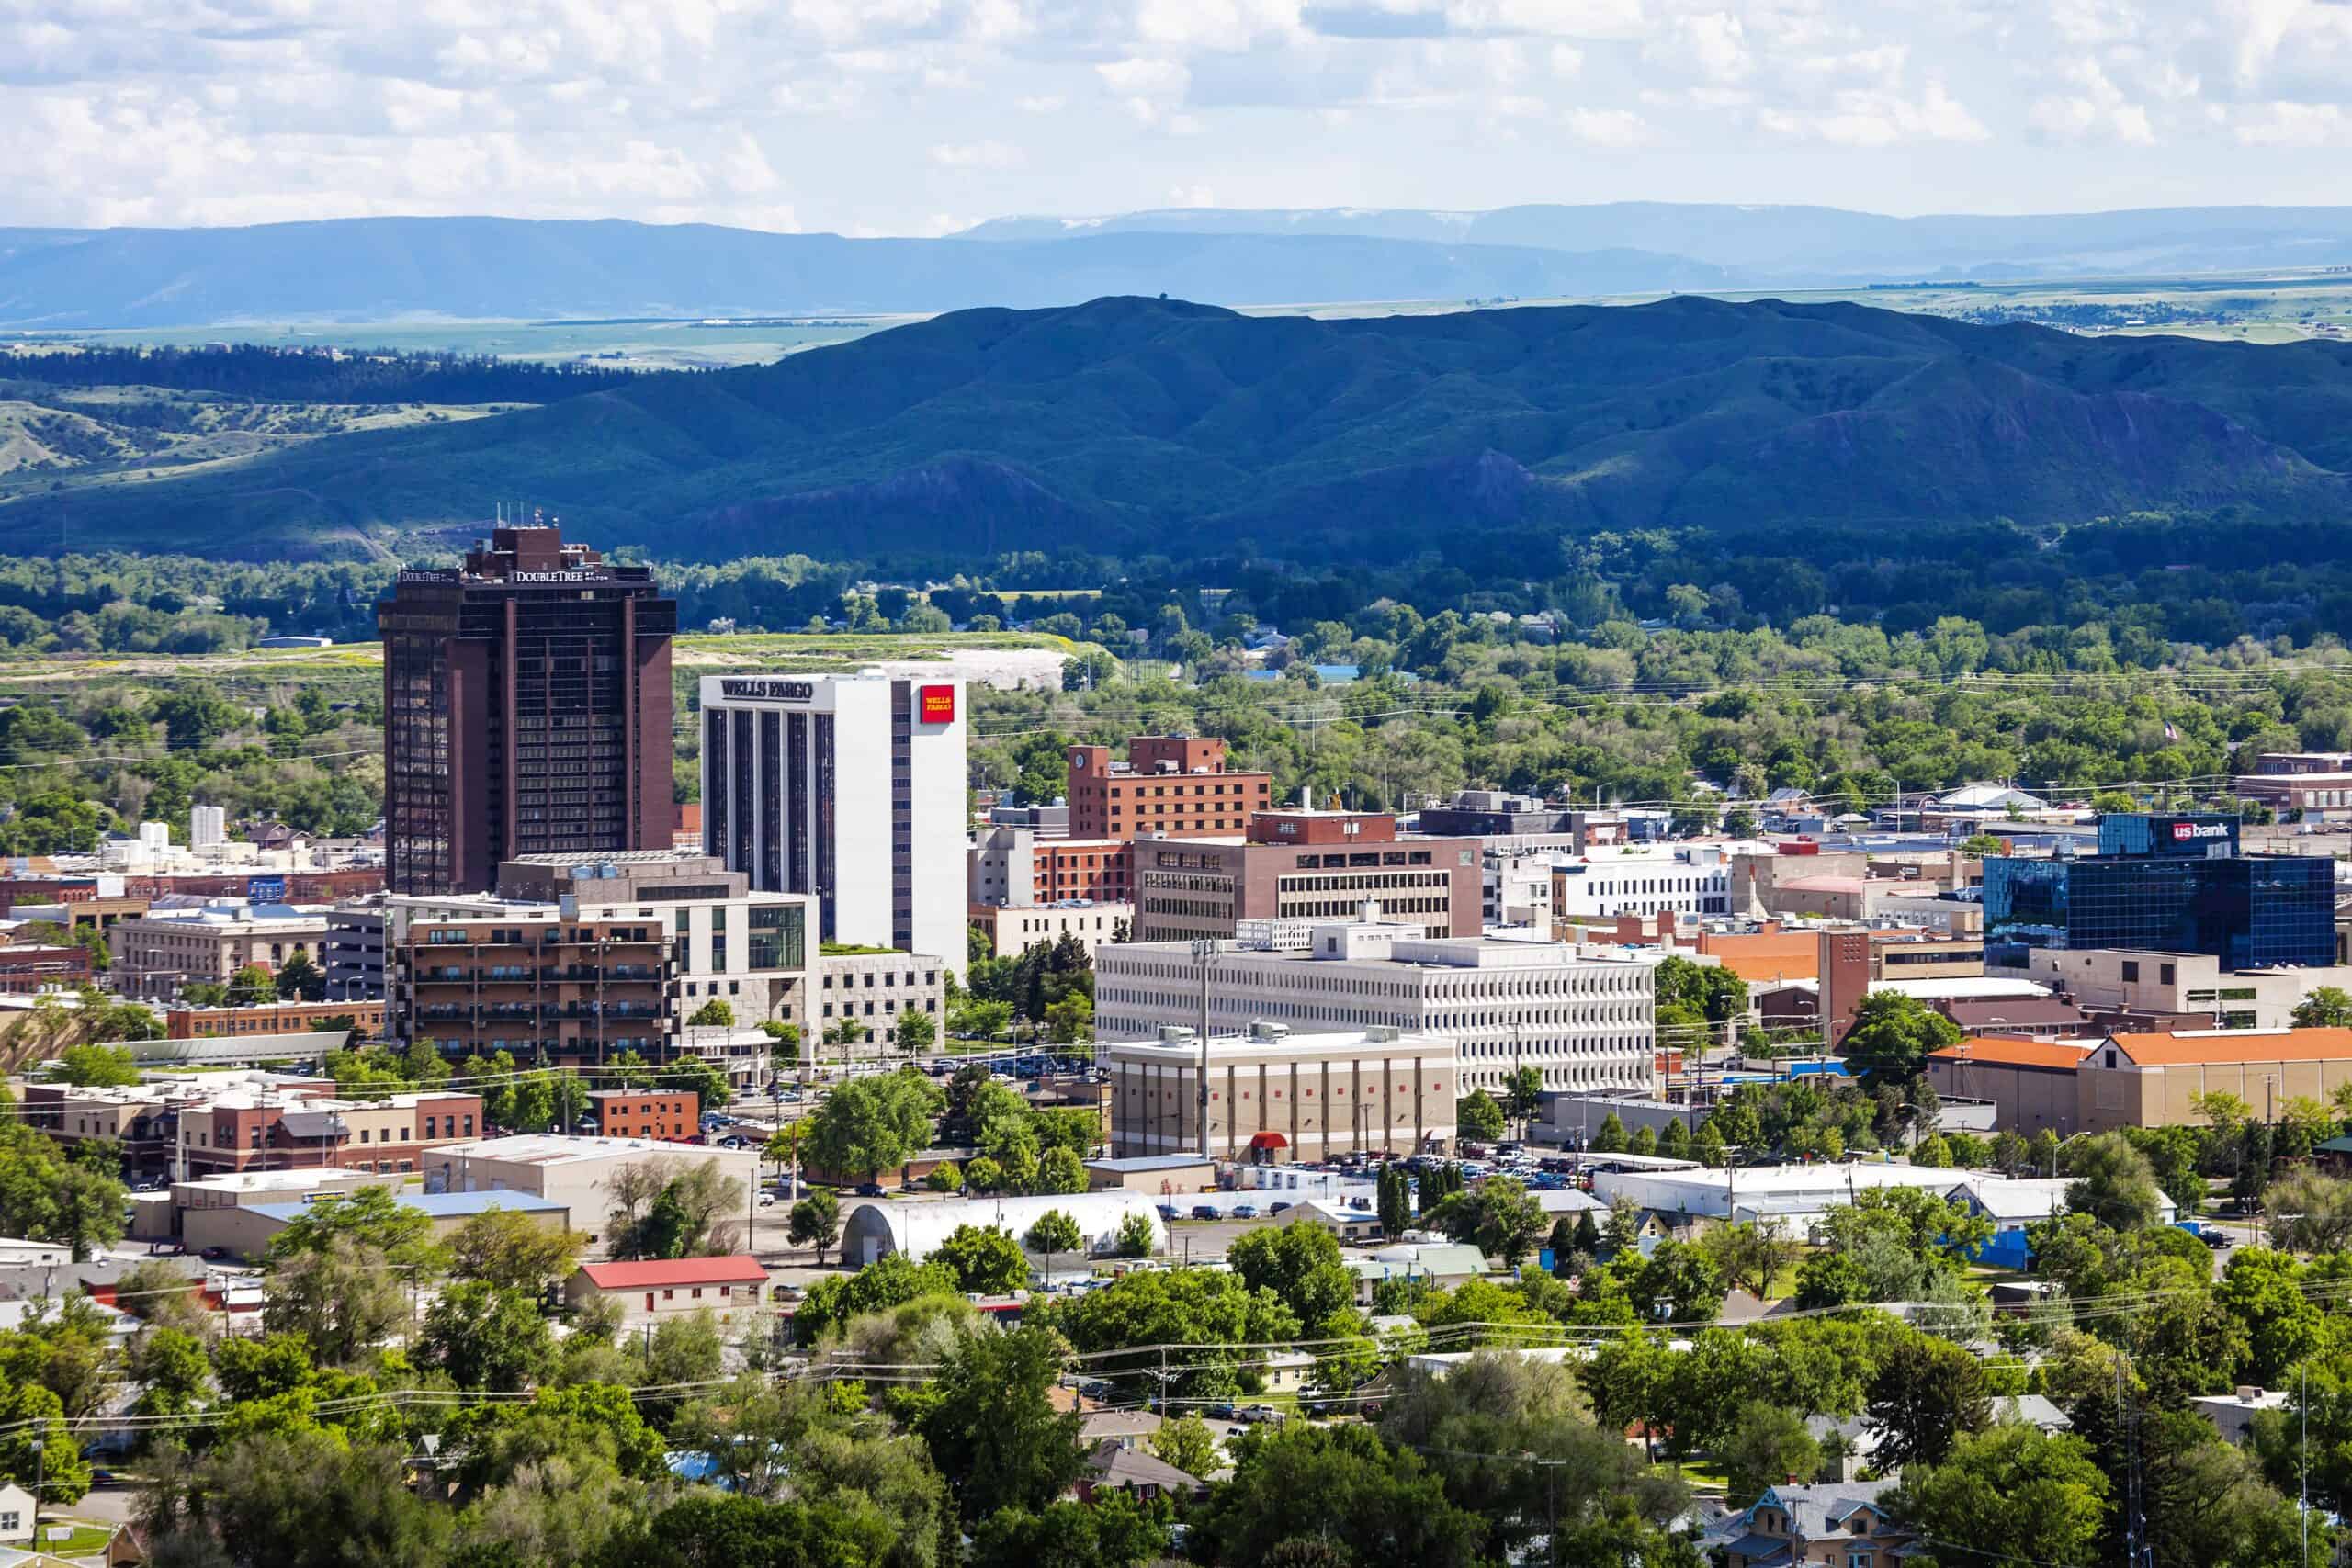
- Personal food service and accommodation expenditure, adjusted for population: $3,965 per capita
- Cost of living: -9.8% less than national average
- Total food service and accommodation expenditure: $4.5 billion
- Total population: 1.1 million
- Other major spending categories: Motor vehicles and parts, groceries, recreation services, gasoline and other energy goods, transportation services, recreational goods and vehicles
21. Texas

- Personal food service and accommodation expenditure, adjusted for population: $3,973 per capita
- Cost of living: -2.8% less than national average
- Total food service and accommodation expenditure: $121.2 billion
- Total population: 30.5 million
- Other major spending categories: Motor vehicles and parts, clothing and footwear, recreation services, financial services and insurance, recreational goods and vehicles
20. Virginia

- Personal food service and accommodation expenditure, adjusted for population: $3,980 per capita
- Cost of living: +0.7% more than national average
- Total food service and accommodation expenditure: $34.7 billion
- Total population: 8.7 million
- Other major spending categories: Recreation services, clothing and footwear, housing and utilities, recreational goods and vehicles, groceries
19. Connecticut

- Personal food service and accommodation expenditure, adjusted for population: $4,065 per capita
- Cost of living: +3.7% more than national average
- Total food service and accommodation expenditure: $14.7 billion
- Total population: 3.6 million
- Other major spending categories: Financial services and insurance, transportation services, furnishings and durable household equipment, recreation services, housing and utilities, clothing and footwear
18. Illinois

- Personal food service and accommodation expenditure, adjusted for population: $4,079 per capita
- Cost of living: -1.1% less than national average
- Total food service and accommodation expenditure: $51.2 billion
- Total population: 12.5 million
- Other major spending categories: Clothing and footwear, transportation services, recreational goods and vehicles, financial services and insurance, furnishings and durable household equipment
17. New Jersey

- Personal food service and accommodation expenditure, adjusted for population: $4,080 per capita
- Cost of living: +8.9% more than national average
- Total food service and accommodation expenditure: $37.9 billion
- Total population: 9.3 million
- Other major spending categories: Clothing and footwear, furnishings and durable household equipment, housing and utilities, financial services and insurance, recreation services, health care
16. Washington

- Personal food service and accommodation expenditure, adjusted for population: $4,083 per capita
- Cost of living: +8.6% more than national average
- Total food service and accommodation expenditure: $31.9 billion
- Total population: 7.8 million
- Other major spending categories: Transportation services, recreational goods and vehicles, recreation services, housing and utilities, furnishings and durable household equipment, groceries
15. Oregon

- Personal food service and accommodation expenditure, adjusted for population: $4,101 per capita
- Cost of living: +4.7% more than national average
- Total food service and accommodation expenditure: $17.4 billion
- Total population: 4.2 million
- Other major spending categories: Furnishings and durable household equipment, recreational goods and vehicles, groceries, clothing and footwear, housing and utilities
14. Nevada

- Personal food service and accommodation expenditure, adjusted for population: $4,115 per capita
- Cost of living: -3.0% less than national average
- Total food service and accommodation expenditure: $13.1 billion
- Total population: 3.2 million
- Other major spending categories: Furnishings and durable household equipment, groceries, recreation services, housing and utilities, financial services and insurance
13. New Hampshire

- Personal food service and accommodation expenditure, adjusted for population: $4,117 per capita
- Cost of living: +5.3% more than national average
- Total food service and accommodation expenditure: $5.8 billion
- Total population: 1.4 million
- Other major spending categories: Motor vehicles and parts, groceries, furnishings and durable household equipment, financial services and insurance, housing and utilities, clothing and footwear
12. Arizona

- Personal food service and accommodation expenditure, adjusted for population: $4,149 per capita
- Cost of living: +1.1% more than national average
- Total food service and accommodation expenditure: $30.8 billion
- Total population: 7.4 million
- Other major spending categories: Housing and utilities, transportation services, furnishings and durable household equipment, motor vehicles and parts, recreation services
11. Vermont

- Personal food service and accommodation expenditure, adjusted for population: $4,153 per capita
- Cost of living: -3.4% less than national average
- Total food service and accommodation expenditure: $2.7 billion
- Total population: 647,464
- Other major spending categories: Groceries, motor vehicles and parts, health care, recreation services, gasoline and other energy goods
10. Delaware

- Personal food service and accommodation expenditure, adjusted for population: $4,243 per capita
- Cost of living: -0.7% less than national average
- Total food service and accommodation expenditure: $4.4 billion
- Total population: 1.0 million
- Other major spending categories: Health care, furnishings and durable household equipment, gasoline and other energy goods, housing and utilities, clothing and footwear
9. Maine

- Personal food service and accommodation expenditure, adjusted for population: $4,470 per capita
- Cost of living: -2.9% less than national average
- Total food service and accommodation expenditure: $6.2 billion
- Total population: 1.4 million
- Other major spending categories: Groceries, gasoline and other energy goods, recreation services, motor vehicles and parts, health care
8. New York

- Personal food service and accommodation expenditure, adjusted for population: $4,637 per capita
- Cost of living: +7.6% more than national average
- Total food service and accommodation expenditure: $90.8 billion
- Total population: 19.6 million
- Other major spending categories: Clothing and footwear, health care, financial services and insurance, transportation services, housing and utilities
7. Rhode Island

- Personal food service and accommodation expenditure, adjusted for population: $4,821 per capita
- Cost of living: +1.4% more than national average
- Total food service and accommodation expenditure: $5.3 billion
- Total population: 1.1 million
- Other major spending categories: Transportation services, recreation services, groceries, housing and utilities, health care
6. Florida

- Personal food service and accommodation expenditure, adjusted for population: $4,845 per capita
- Cost of living: +3.5% more than national average
- Total food service and accommodation expenditure: $109.6 billion
- Total population: 22.6 million
- Other major spending categories: Furnishings and durable household equipment, housing and utilities, financial services and insurance, recreational goods and vehicles, groceries
5. Massachusetts

- Personal food service and accommodation expenditure, adjusted for population: $4,864 per capita
- Cost of living: +8.2% more than national average
- Total food service and accommodation expenditure: $34.1 billion
- Total population: 7.0 million
- Other major spending categories: Transportation services, housing and utilities, financial services and insurance, health care, recreation services
4. Alaska

- Personal food service and accommodation expenditure, adjusted for population: $5,107 per capita
- Cost of living: +1.7% more than national average
- Total food service and accommodation expenditure: $3.7 billion
- Total population: 733,406
- Other major spending categories: Health care, recreation services, recreational goods and vehicles, transportation services, furnishings and durable household equipment
3. California
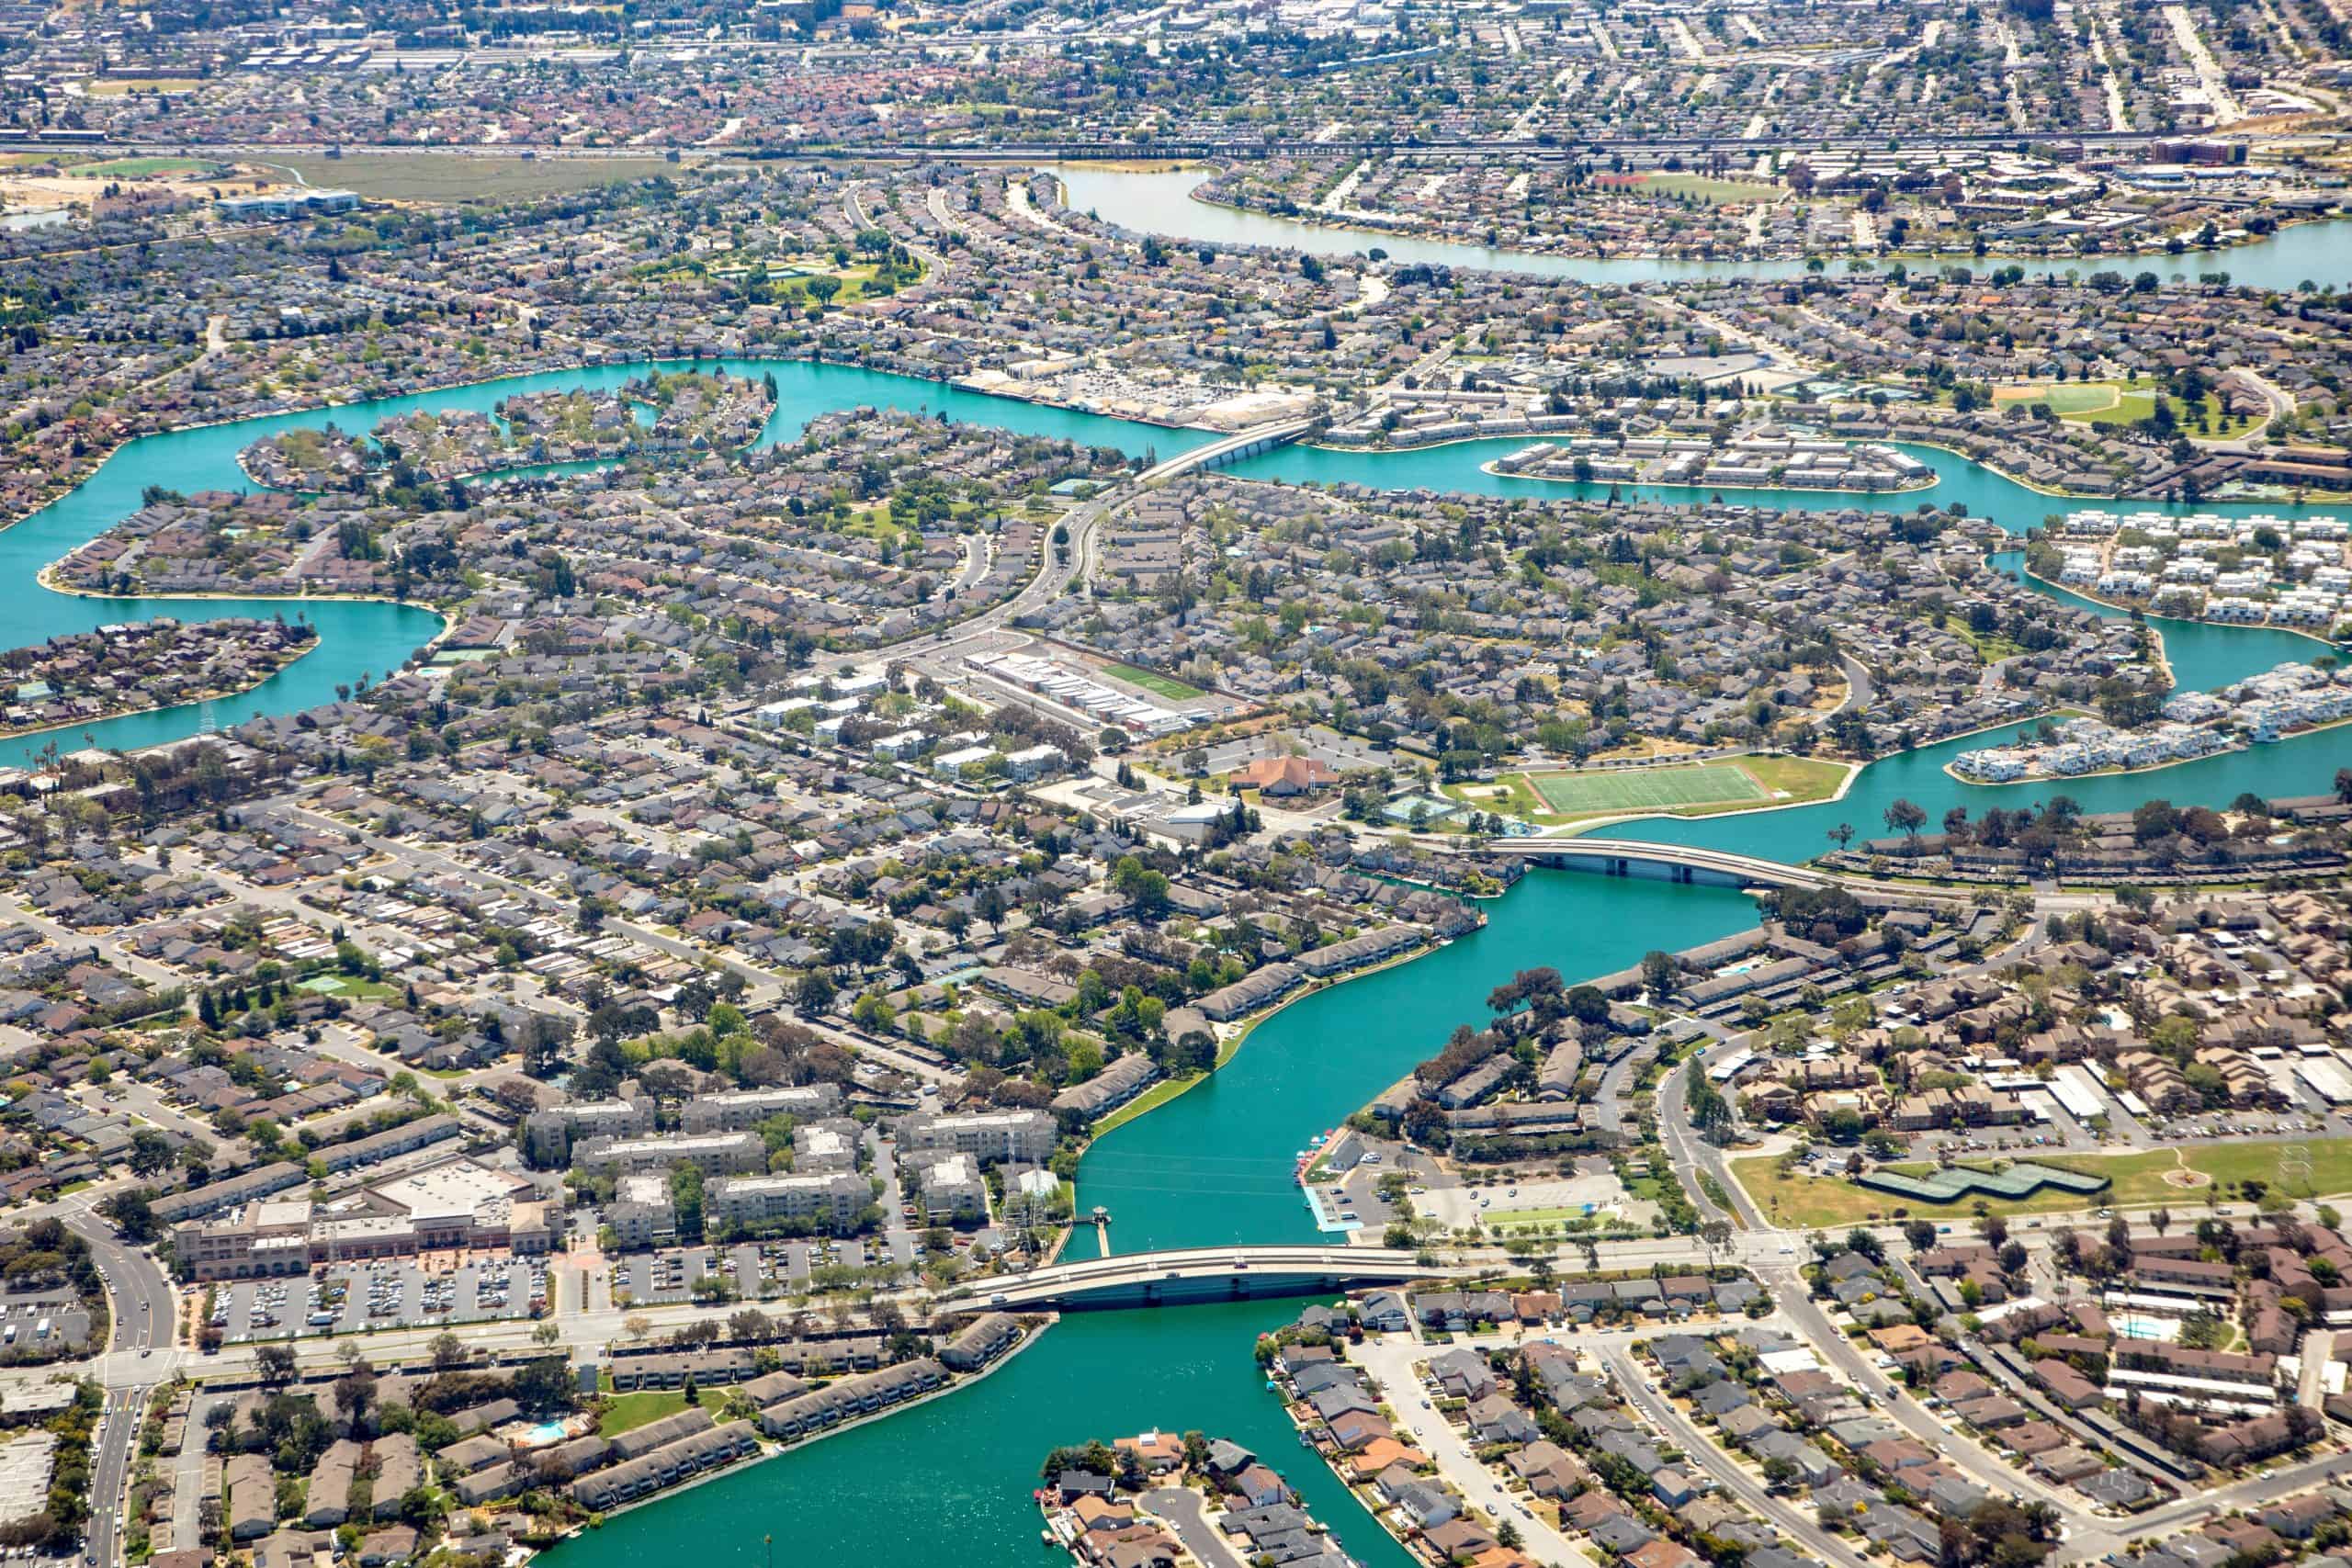
- Personal food service and accommodation expenditure, adjusted for population: $5,189 per capita
- Cost of living: +12.6% more than national average
- Total food service and accommodation expenditure: $202.2 billion
- Total population: 39.0 million
- Other major spending categories: Clothing and footwear, recreation services, housing and utilities, transportation services, health care
2. Colorado

- Personal food service and accommodation expenditure, adjusted for population: $5,295 per capita
- Cost of living: +1.4% more than national average
- Total food service and accommodation expenditure: $31.1 billion
- Total population: 5.9 million
- Other major spending categories: Furnishings and durable household equipment, recreation services, housing and utilities, recreational goods and vehicles, clothing and footwear
1. Hawaii

- Personal food service and accommodation expenditure, adjusted for population: $5,298 per capita
- Cost of living: +8.6% more than national average
- Total food service and accommodation expenditure: $7.6 billion
- Total population: 1.4 million
- Other major spending categories: Groceries, housing and utilities, transportation services, recreation services, clothing and footwear
The post Dining Out Is Devouring Your Budget — And It’s Worse in Some States Than Others appeared first on 24/7 Wall St..