


Best Years For Gunmakers Since the 1980s
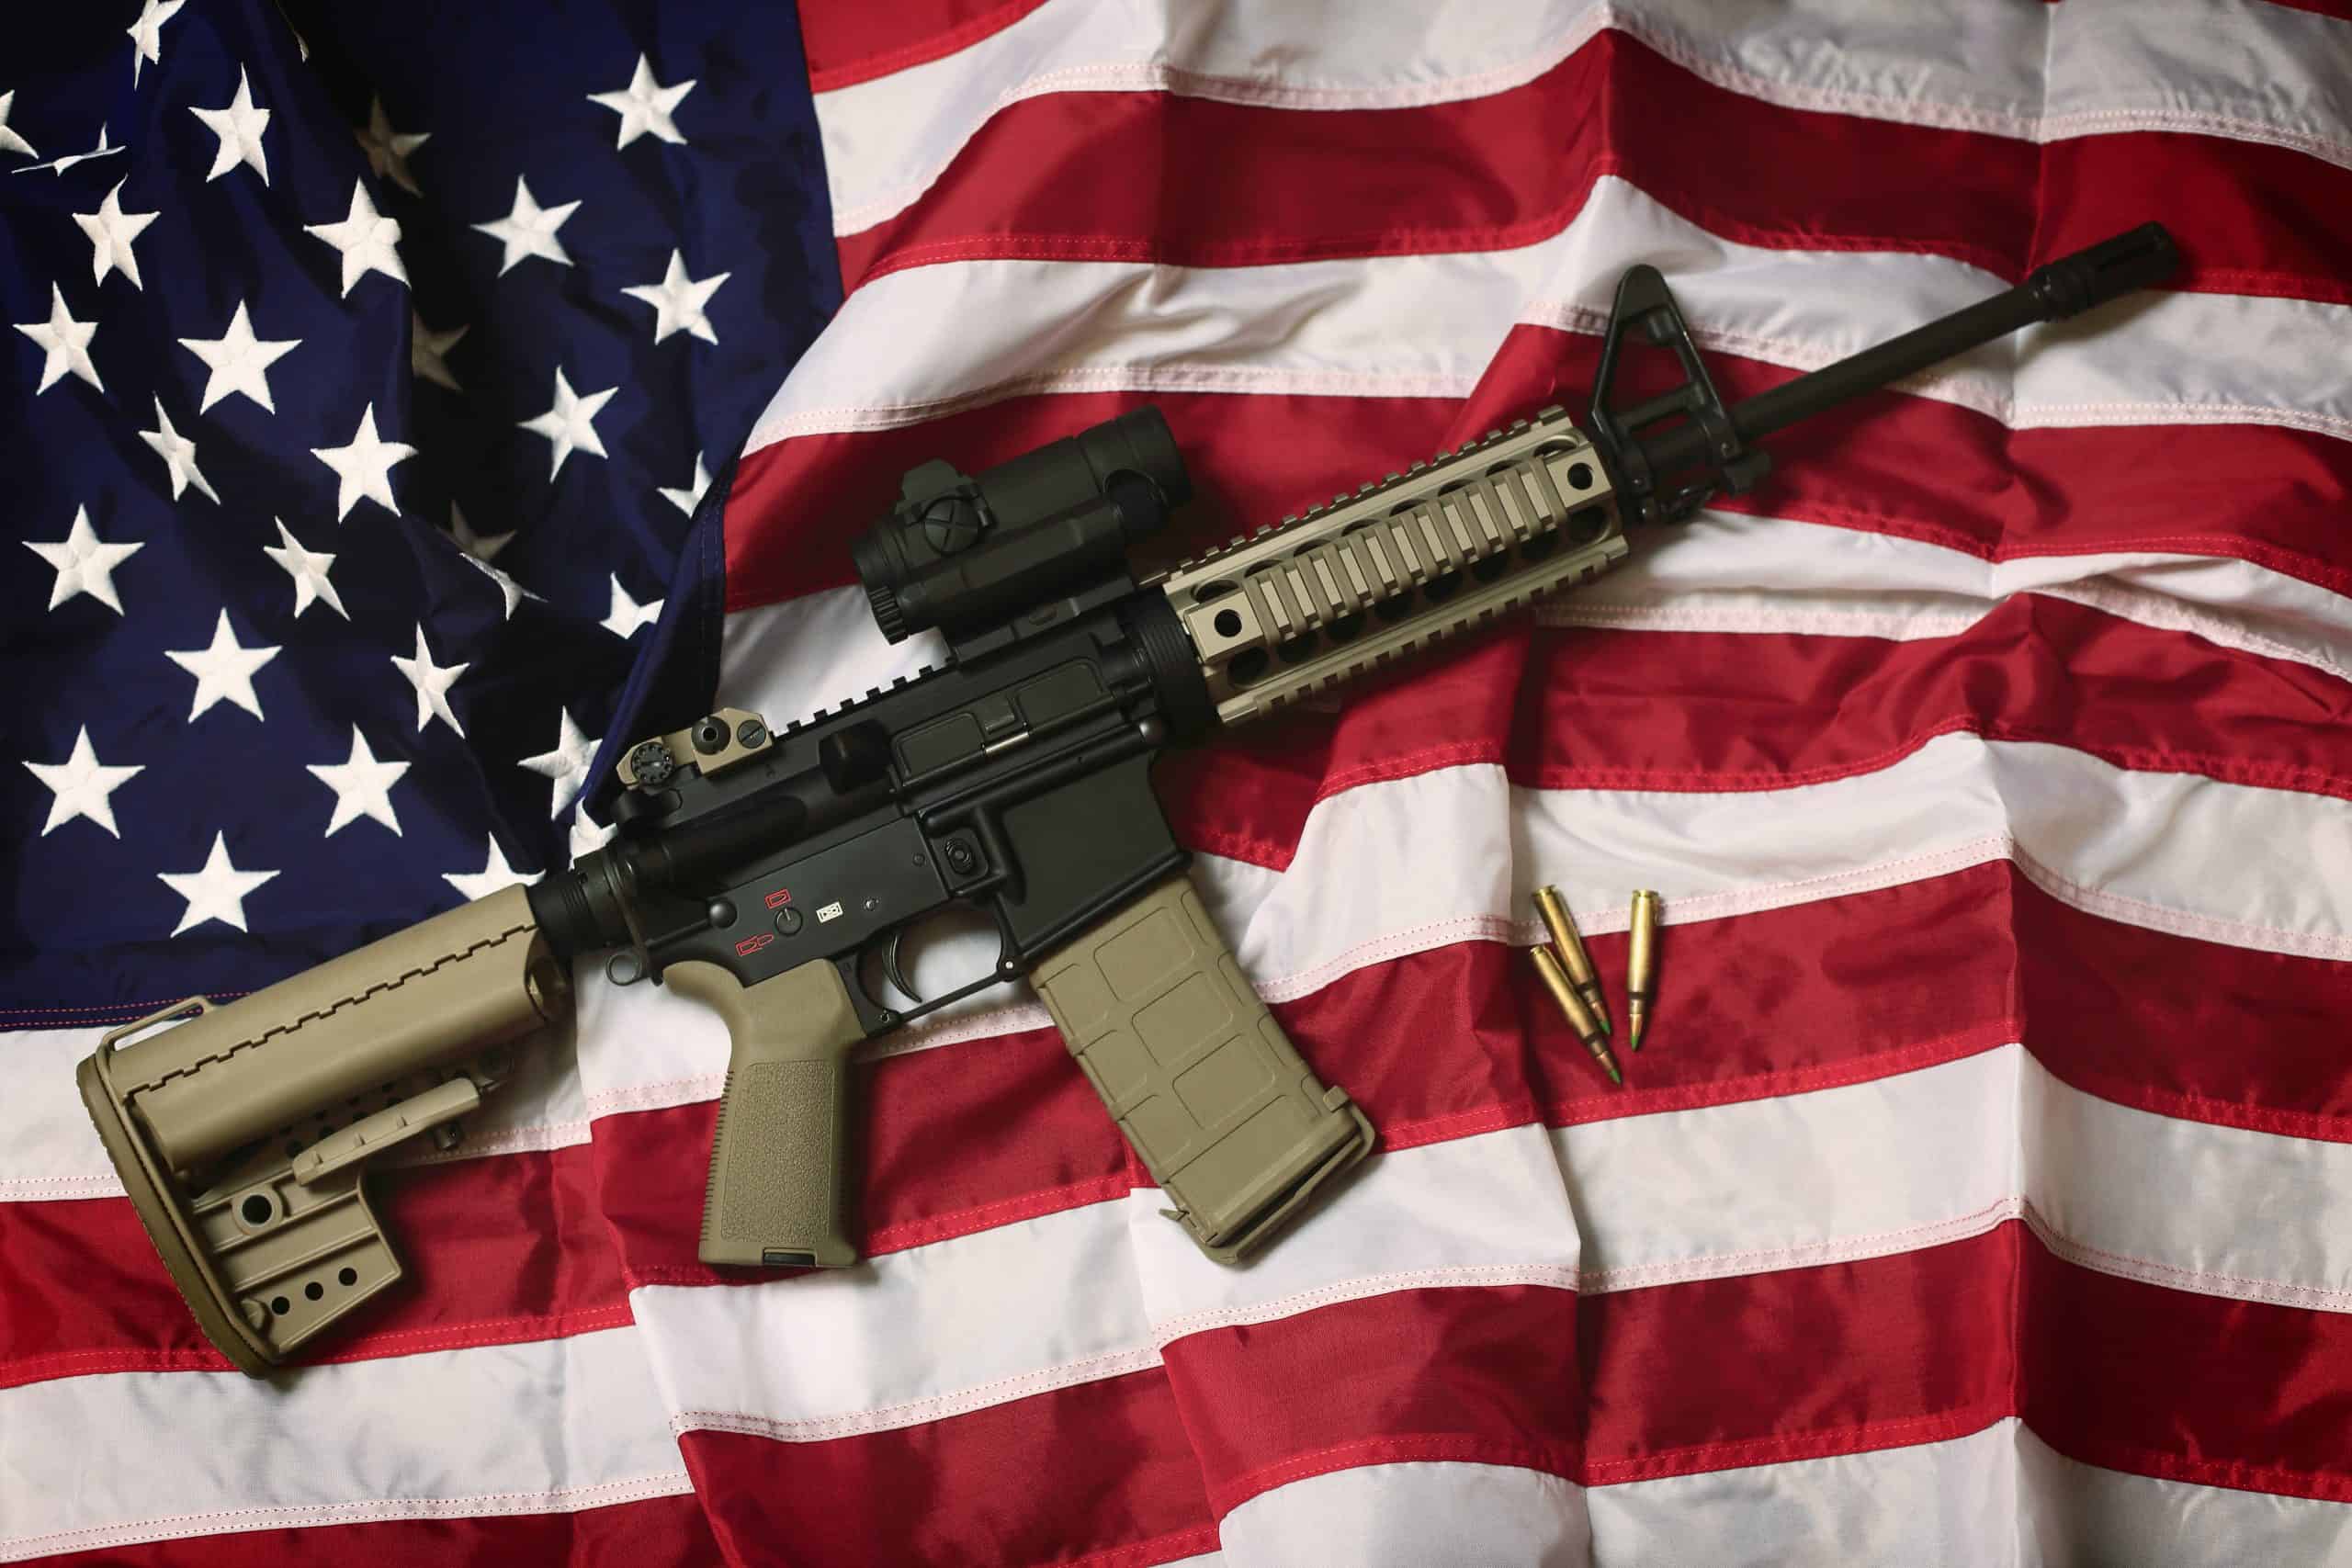
Estimates as to the total number of firearms in circulation in the United States range from about 392 million to over 500 million. Even assuming the low-end estimate, a report from the Geneva-based research organization Small Arms Survey shows that the U.S. is the only country in the world with more civilian-owned guns than people. […] The post Best Years For Gunmakers Since the 1980s appeared first on 24/7 Wall St..
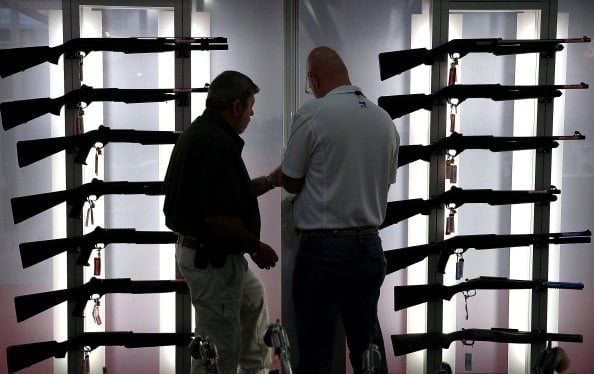
Estimates as to the total number of firearms in circulation in the United States range from about 392 million to over 500 million. Even assuming the low-end estimate, a report from the Geneva-based research organization Small Arms Survey shows that the U.S. is the only country in the world with more civilian-owned guns than people.
Key Points
-
Recent estimates suggest that there may be as many as half a billion firearms in circulation in the United States — and while many of these firearms are decades old, government data shows that a disproportionate share of them were sold in recent years.
-
Data from the ATF indicates that of the more than 325 million firearms Americans have bought since the mid-1980s, nearly half were sold within the last decade.
-
Consulting a professional advisor can help you achieve financial security and independence. Click here to get started. Click here to get started now.
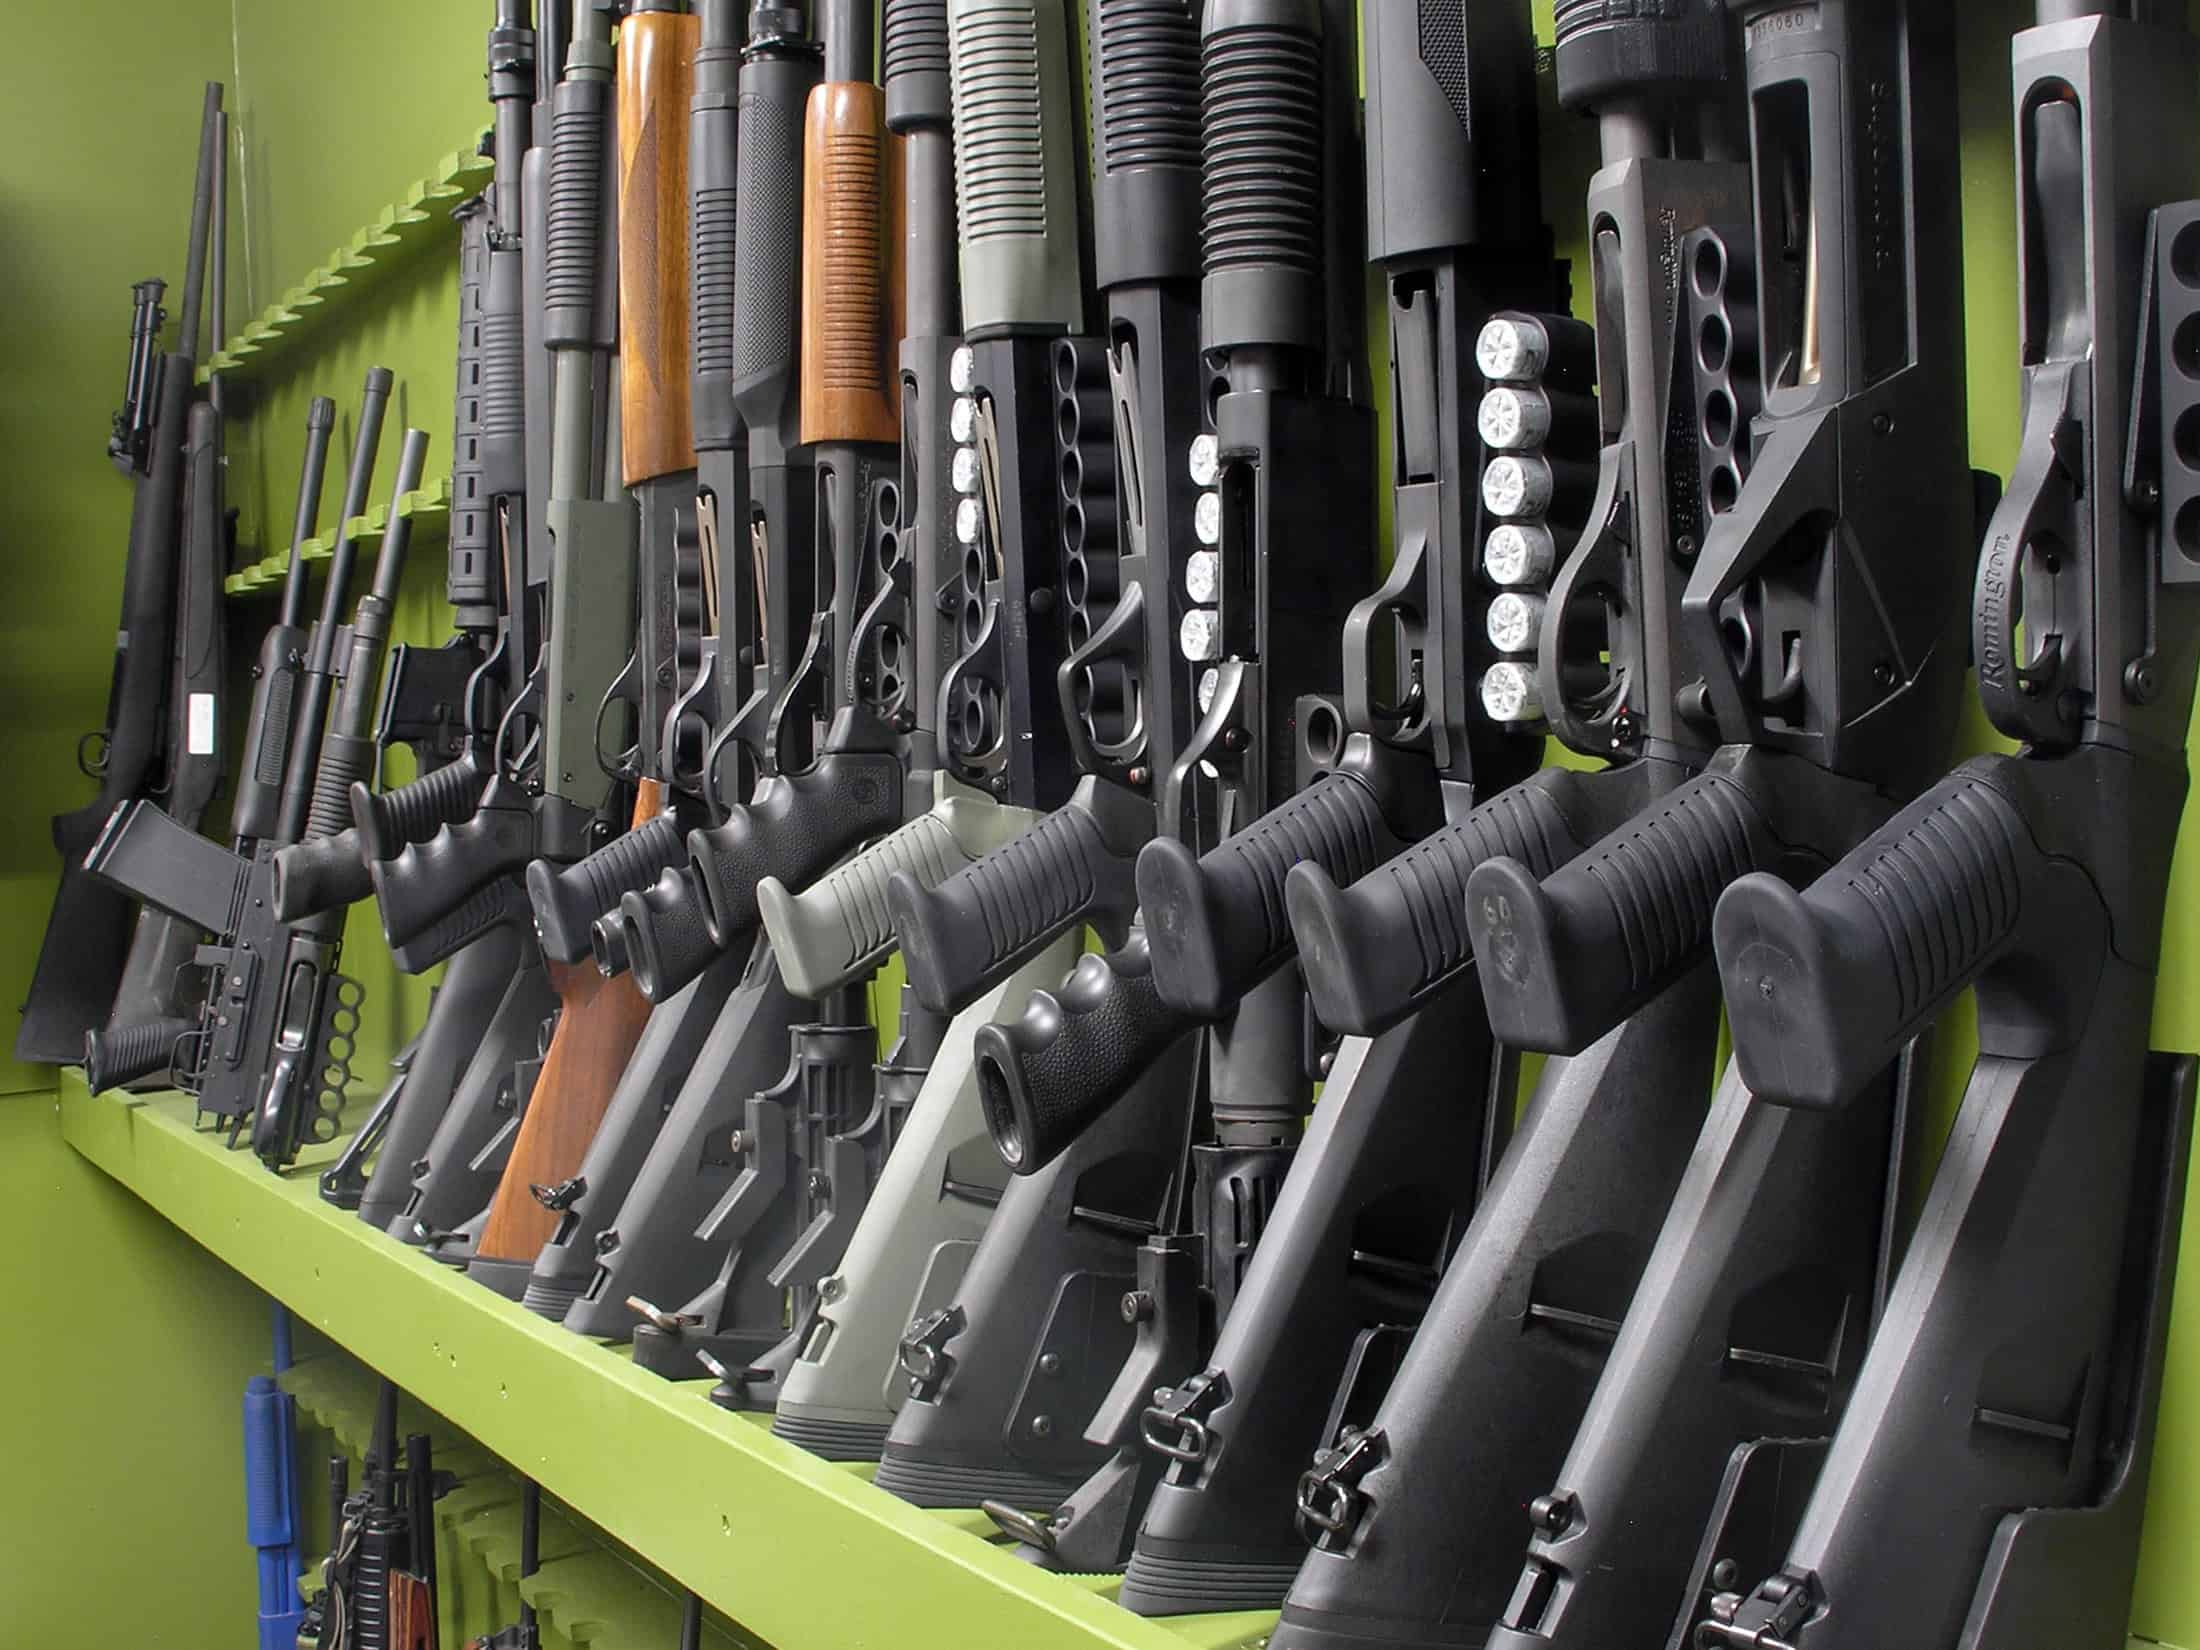
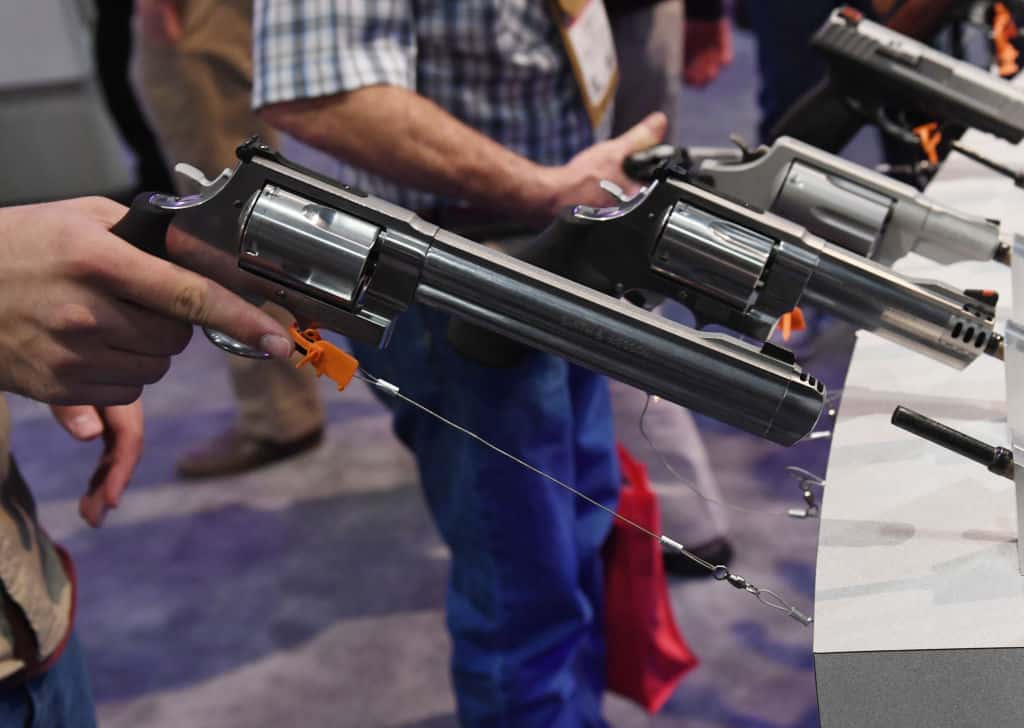
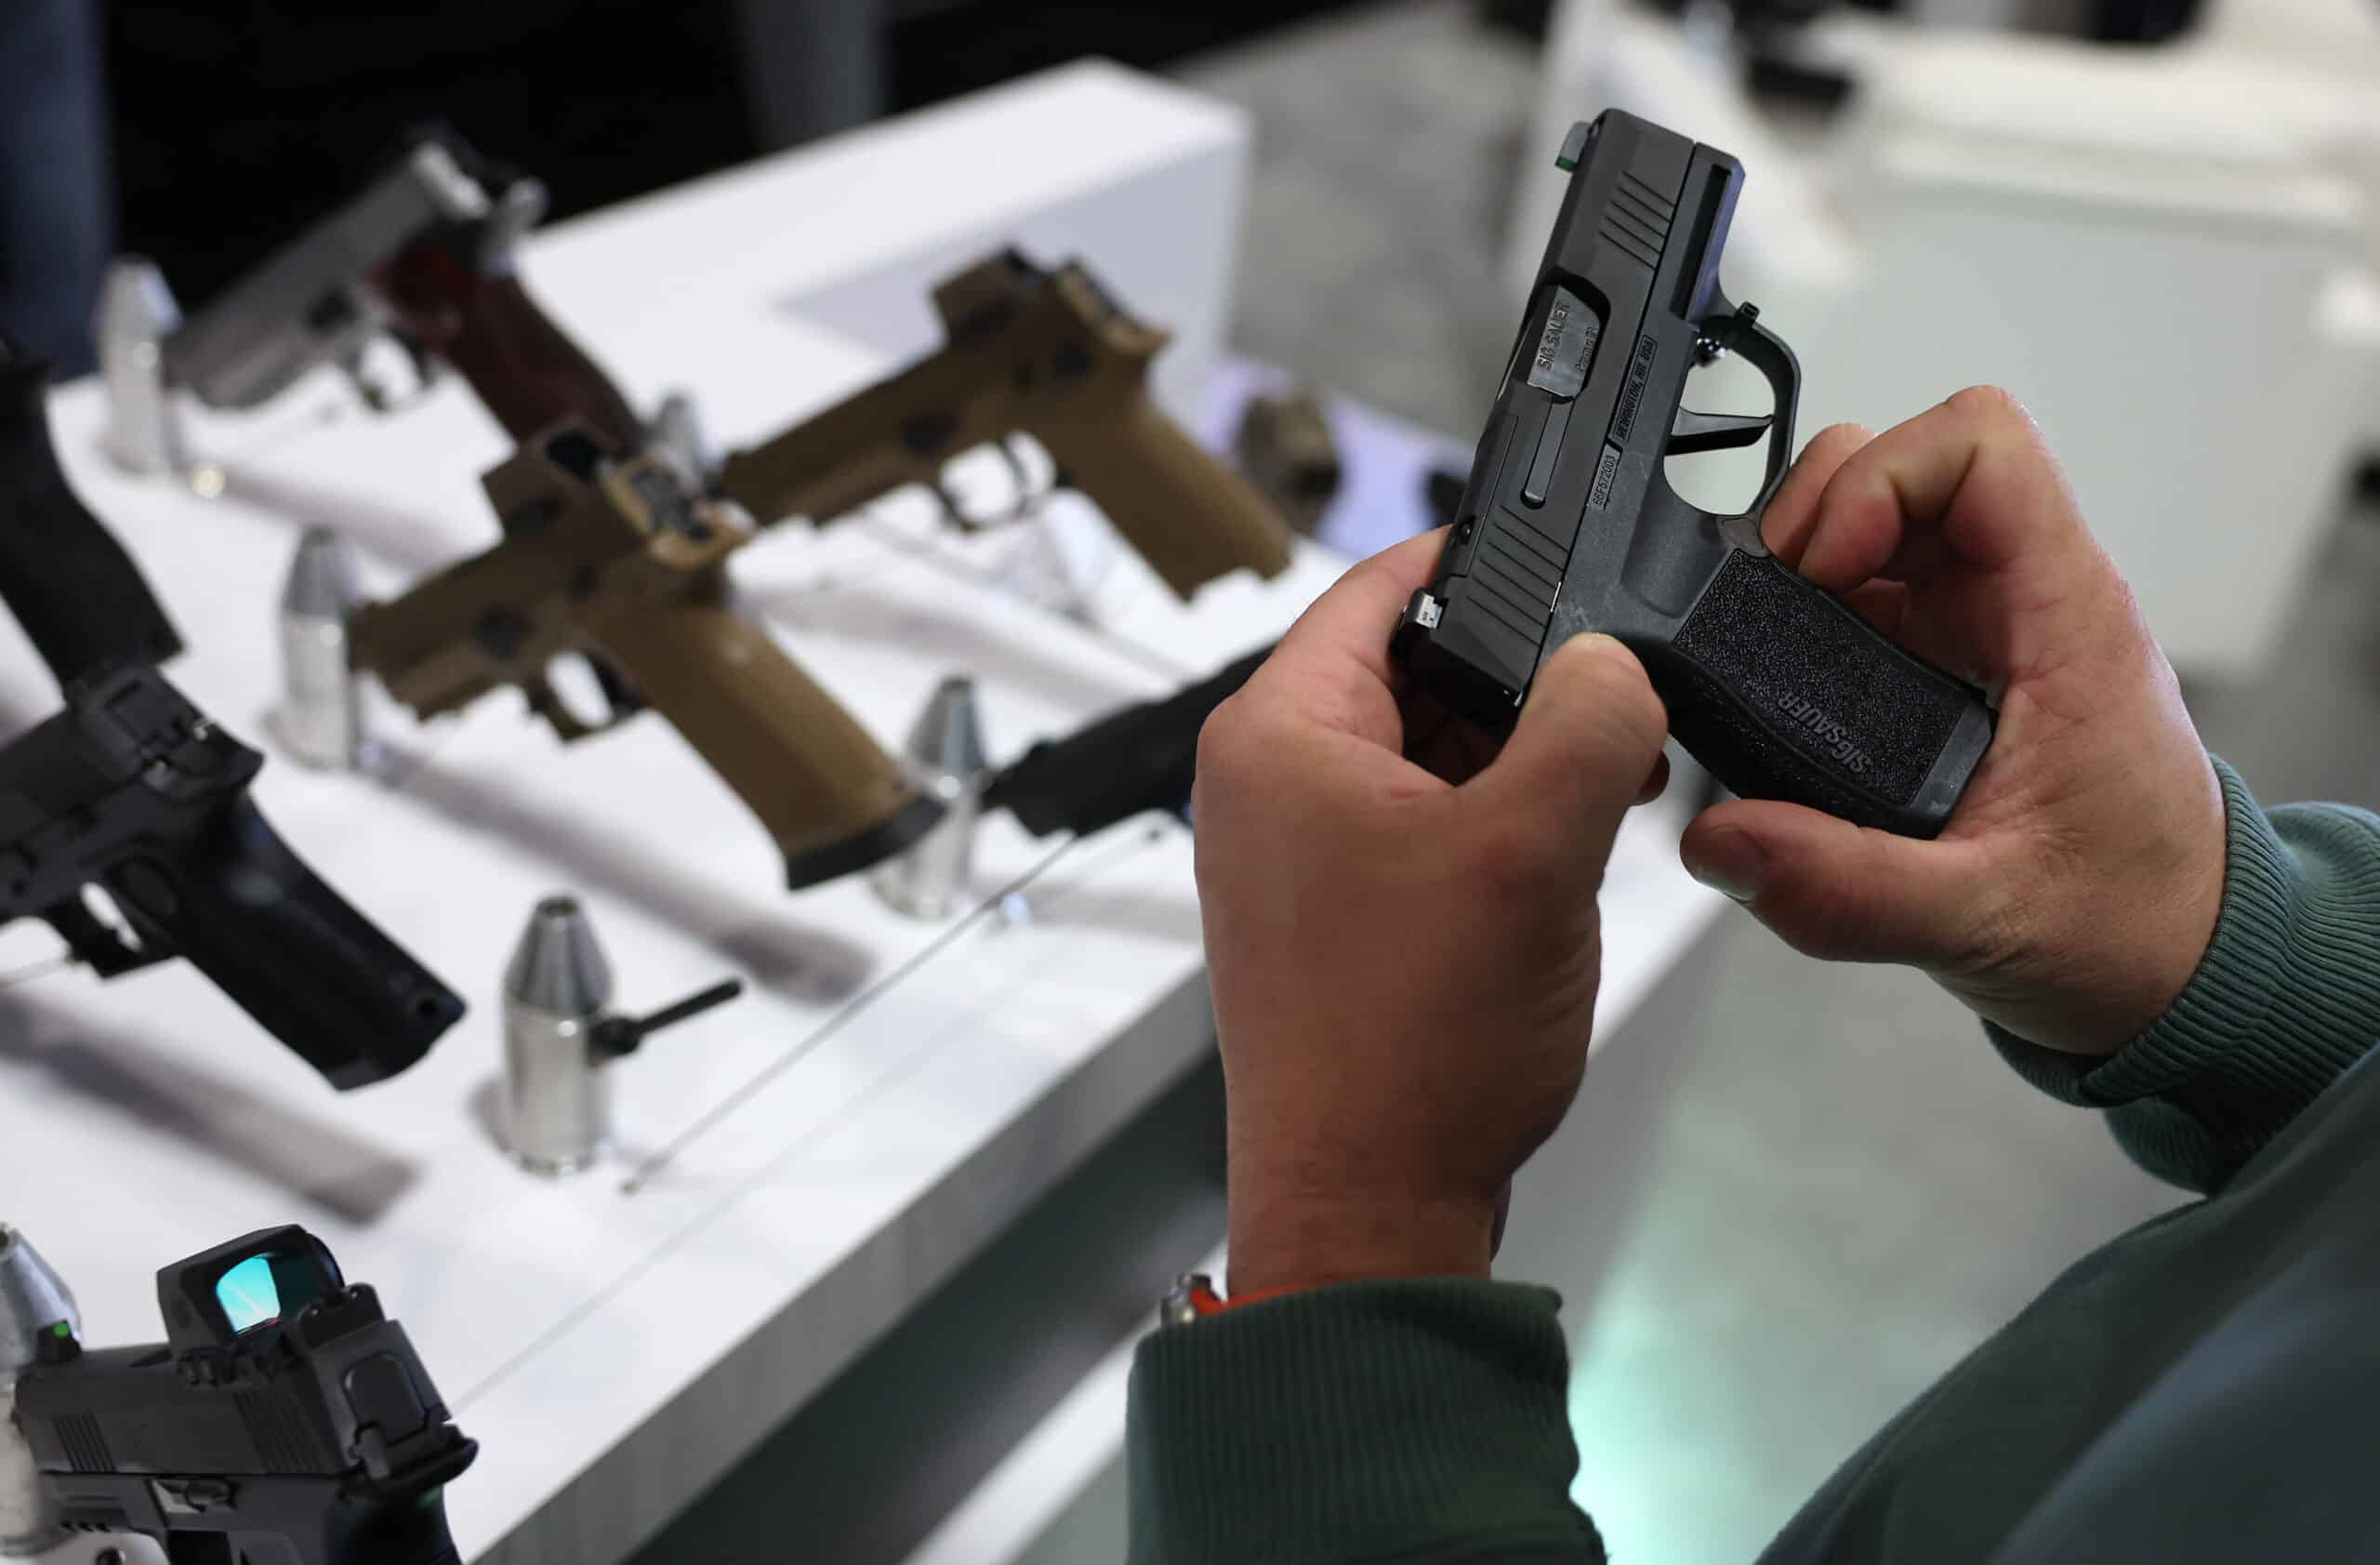
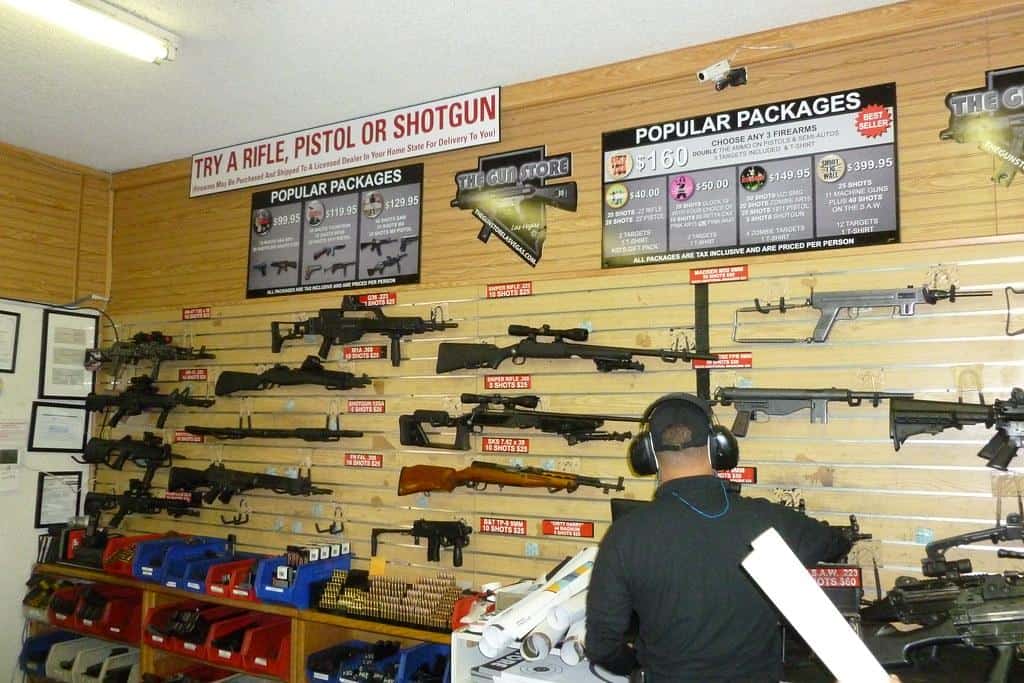
Consumer demand for firearms is fueling a multi-billion dollar industry. The National Shooting Sports Foundation, a firearm trade association, recently reported America’s arms and ammunition industry generated over $91.6 billion in economic output and supported nearly 383,000 jobs in 2024 alone. Data from the federal government also suggests that, since the mid-1980s, over 325 million firearms have been sold in the United States, and in recent years, domestic gun sales have skyrocketed.
Using historical firearm production, import, and export data from the Bureau of Alcohol, Tobacco, Firearms, and Explosives, 24/7 Wall St. calculated the number of guns Americans have bought in each of the last 38 years. For every year between 1986 and 2023, we tallied the number of firearms manufactured in and imported to the U.S., then subtracted the number of firearms exported to foreign markets. We also included separate numbers reflecting handgun, rifle, and shotgun sales in each of the last 38 years. It is important to note that firearms classified by the ATF as “miscellaneous” are also included in the annual totals.
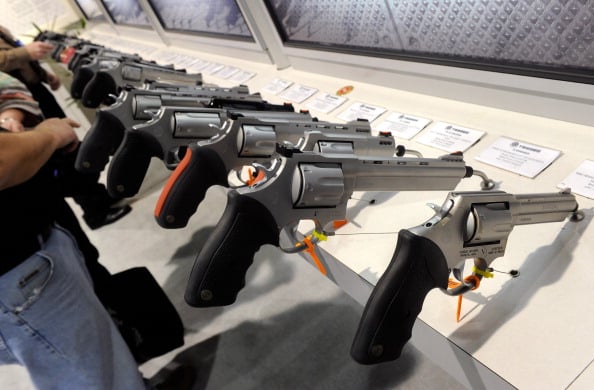
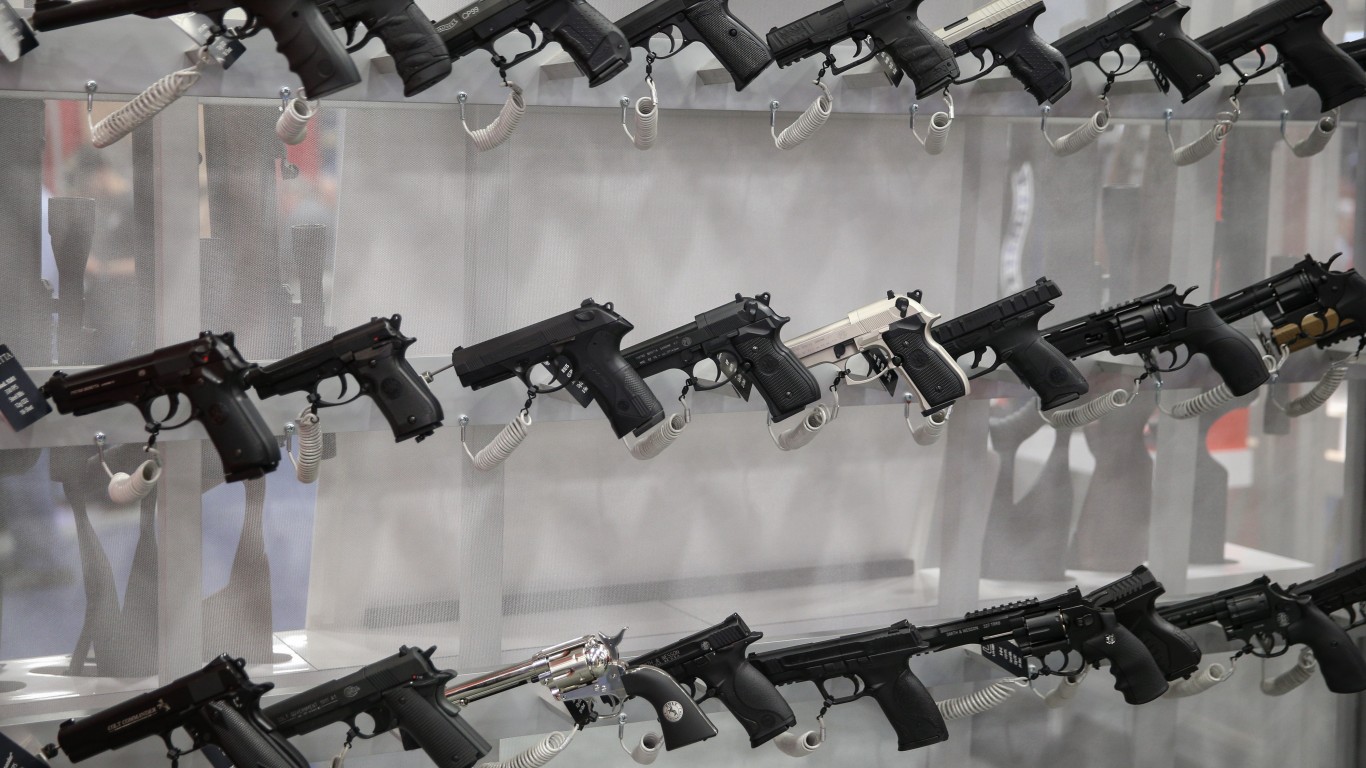
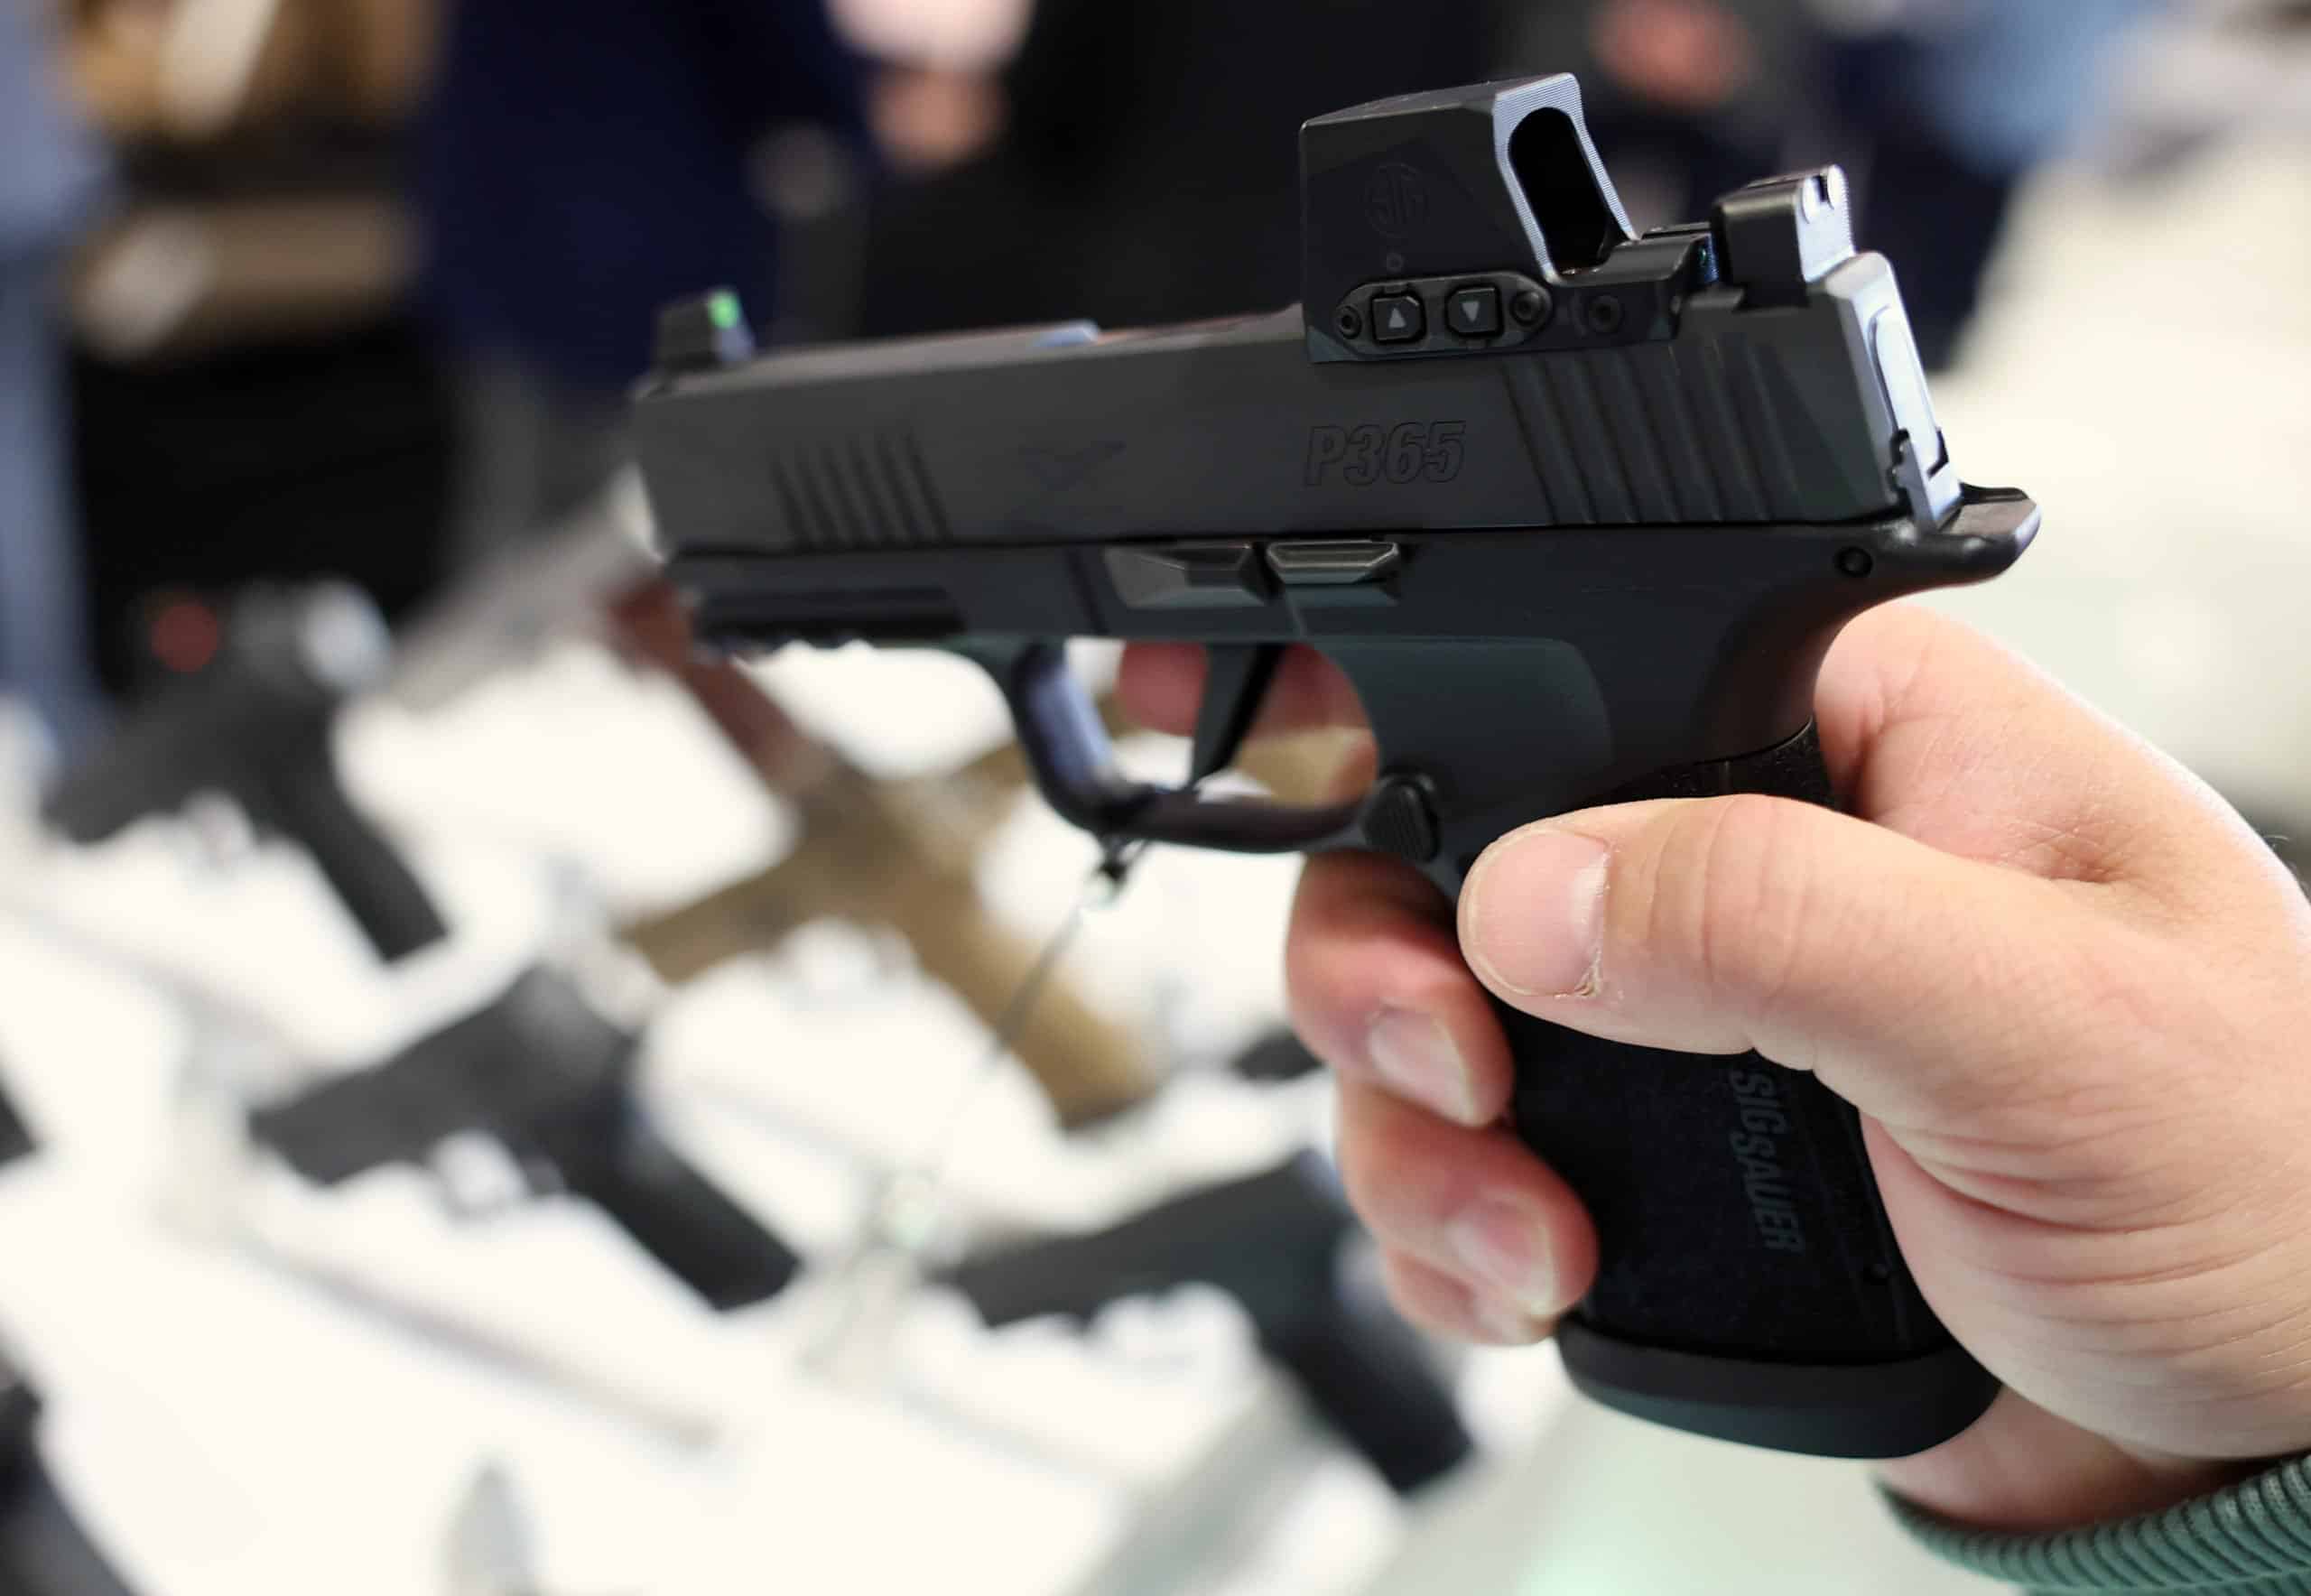
Gun sales in the United States topped 10 million for the first time in 2012, and annual sales volume has yet to fall back below that threshold. While gun sales have been trending up for years, consumer demand for firearms in the U.S. skyrocketed during the COVID-19 pandemic. Over the three year period from 2020 to 2022, an estimated 59.9 million guns were sold in the U.S., about 7.7 million more than were sold in the entire decade of the 1990s. (Here is a look at the companies driving pistol sales.)
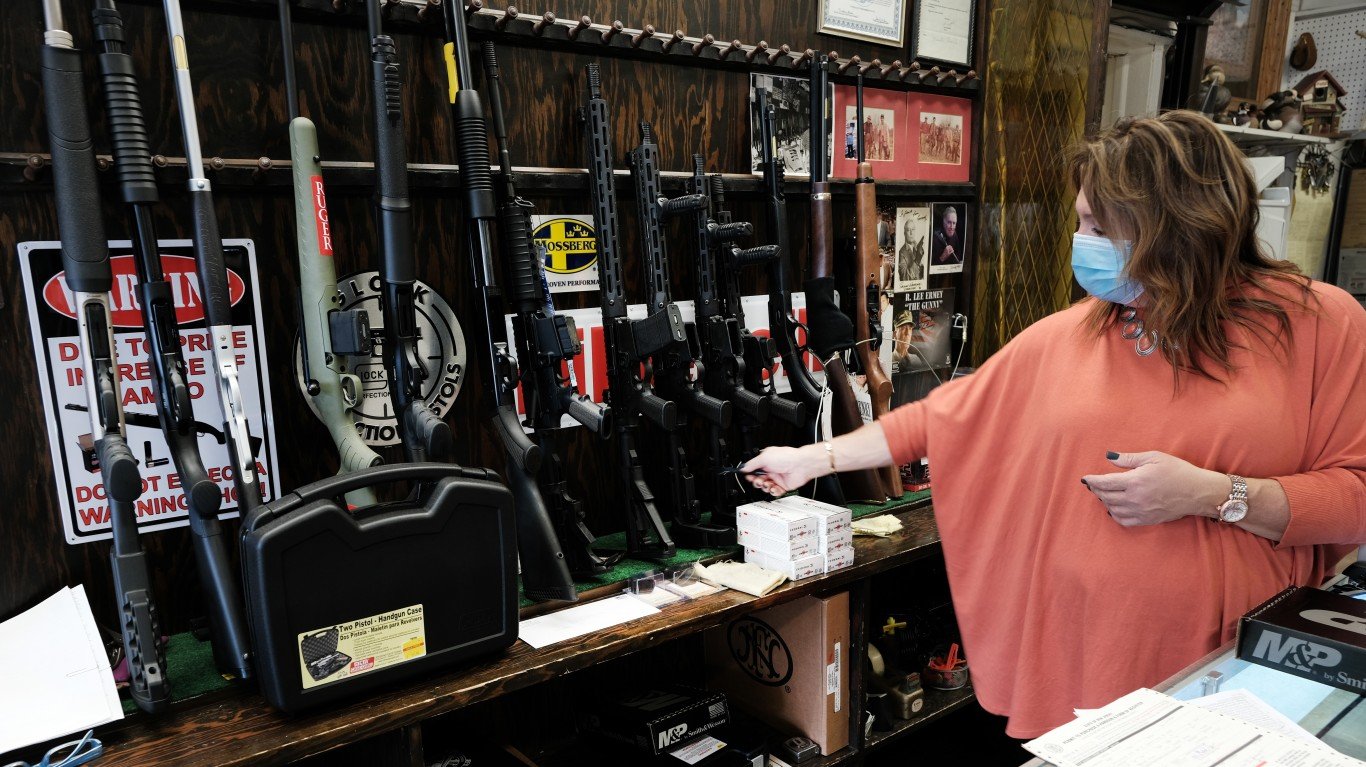
America is the world’s largest consumer market for firearms, and consequently, many of the world’s largest gunmakers — including some headquartered overseas — have major production facilities within the United States. Partially as a result, most firearms sold to American consumers over the last 38 years were also manufactured domestically. Between 1986 and 2023, about two out of every three guns sold in the U.S. were also made in the United States. (Here is a look at the top gunmaker in each state.)
Why it Matters
The United States has always had a strong gun culture, but in recent years, firearm sales have surged nationwide. In the last three years alone, Americans bought more guns than they did during the entire decade of the 1990s. Partially as a result, the U.S. is now the only country in the world with more guns than people, and America’s arms and ammunition industry has evolved into a multi-billion dollar behemoth.
1986: 3,524,486 firearms

- Estimated U.S. firearm sales in 1986: 3,524,486 — the fewest in last 38 years (80.1% American made; 19.9% imported)
- Estimated U.S. handgun sales in 1986: 1,534,305 — the fewest in last 38 years (84.9% American made; 15.1% imported)
- Estimated U.S. rifle sales in 1986: 1,202,283 — 37th most in last 38 years (77.6% American made; 22.4% imported)
- Estimated U.S. shotgun sales in 1986: 783,539 — the fewest in last 38 years (74.3% American made; 25.7% imported)
1987: 4,335,131 firearms

- Estimated U.S. firearm sales in 1987: 4,335,131 — 34th most in last 38 years (75.5% American made; 24.5% imported)
- Estimated U.S. handgun sales in 1987: 1,869,634 — 28th most in last 38 years (81.7% American made; 18.3% imported)
- Estimated U.S. rifle sales in 1987: 1,379,280 — 34th most in last 38 years (70.0% American made; 30.0% imported)
- Estimated U.S. shotgun sales in 1987: 1,089,232 — 30th most in last 38 years (71.8% American made; 28.2% imported)
1988: 4,982,963 firearms
- Estimated U.S. firearm sales in 1988: 4,982,963 — 25th most in last 38 years (74.4% American made; 25.6% imported)
- Estimated U.S. handgun sales in 1988: 2,345,516 — 23rd most in last 38 years (73.5% American made; 26.5% imported)
- Estimated U.S. rifle sales in 1988: 1,373,451 — 35th most in last 38 years (79.4% American made; 20.6% imported)
- Estimated U.S. shotgun sales in 1988: 1,231,379 — 17th most in last 38 years (69.8% American made; 30.2% imported)
1989: 5,164,892 firearms
- Estimated U.S. firearm sales in 1989: 5,164,892 — 22nd most in last 38 years (80.5% American made; 19.5% imported)
- Estimated U.S. handgun sales in 1989: 2,354,994 — 22nd most in last 38 years (81.3% American made; 18.7% imported)
- Estimated U.S. rifle sales in 1989: 1,627,305 — 29th most in last 38 years (82.0% American made; 18.0% imported)
- Estimated U.S. shotgun sales in 1989: 1,142,479 — 27th most in last 38 years (76.0% American made; 24.0% imported)
1990: 4,442,152 firearms

- Estimated U.S. firearm sales in 1990: 4,442,152 — 32nd most in last 38 years (81.0% American made; 19.0% imported)
- Estimated U.S. handgun sales in 1990: 2,110,221 — 25th most in last 38 years (78.7% American made; 21.3% imported)
- Estimated U.S. rifle sales in 1990: 1,343,335 — 36th most in last 38 years (84.9% American made; 15.1% imported)
- Estimated U.S. shotgun sales in 1990: 936,485 — 35th most in last 38 years (79.5% American made; 20.5% imported)
1991: 3,882,598 firearms

- Estimated U.S. firearm sales in 1991: 3,882,598 — 37th most in last 38 years (81.4% American made; 18.6% imported)
- Estimated U.S. handgun sales in 1991: 1,939,116 — 26th most in last 38 years (84.9% American made; 15.1% imported)
- Estimated U.S. rifle sales in 1991: 1,103,700 — the fewest in last 38 years (71.8% American made; 28.2% imported)
- Estimated U.S. shotgun sales in 1991: 826,766 — 37th most in last 38 years (86.0% American made; 14.0% imported)
1992: 6,618,755 firearms
- Estimated U.S. firearm sales in 1992: 6,618,755 — 19th most in last 38 years (57.0% American made; 43.0% imported)
- Estimated U.S. handgun sales in 1992: 2,930,536 — 19th most in last 38 years (66.5% American made; 33.5% imported)
- Estimated U.S. rifle sales in 1992: 2,335,007 — 16th most in last 38 years (39.0% American made; 61.0% imported)
- Estimated U.S. shotgun sales in 1992: 1,341,010 — 12th most in last 38 years (67.0% American made; 33.0% imported)
1993: 7,667,754 firearms

- Estimated U.S. firearm sales in 1993: 7,667,754 — 16th most in last 38 years (60.3% American made; 39.7% imported)
- Estimated U.S. handgun sales in 1993: 3,709,645 — 16th most in last 38 years (67.5% American made; 32.5% imported)
- Estimated U.S. rifle sales in 1993: 2,671,944 — 14th most in last 38 years (40.4% American made; 59.6% imported)
- Estimated U.S. shotgun sales in 1993: 1,219,579 — 20th most in last 38 years (79.8% American made; 20.2% imported)
1994: 6,649,646 firearms
- Estimated U.S. firearm sales in 1994: 6,649,646 — 18th most in last 38 years (71.7% American made; 28.3% imported)
- Estimated U.S. handgun sales in 1994: 3,333,022 — 18th most in last 38 years (72.5% American made; 27.5% imported)
- Estimated U.S. rifle sales in 1994: 2,082,640 — 20th most in last 38 years (59.3% American made; 40.7% imported)
- Estimated U.S. shotgun sales in 1994: 1,226,268 — 18th most in last 38 years (90.4% American made; 9.6% imported)
1995: 4,995,525 firearms

- Estimated U.S. firearm sales in 1995: 4,995,525 — 24th most in last 38 years (77.9% American made; 22.1% imported)
- Estimated U.S. handgun sales in 1995: 2,199,438 — 24th most in last 38 years (67.9% American made; 32.1% imported)
- Estimated U.S. rifle sales in 1995: 1,581,471 — 31st most in last 38 years (83.5% American made; 16.5% imported)
- Estimated U.S. shotgun sales in 1995: 1,208,470 — 23rd most in last 38 years (88.7% American made; 11.3% imported)
1996: 4,404,020 firearms

- Estimated U.S. firearm sales in 1996: 4,404,020 — 33rd most in last 38 years (80.0% American made; 20.0% imported)
- Estimated U.S. handgun sales in 1996: 1,822,832 — 29th most in last 38 years (73.1% American made; 26.9% imported)
- Estimated U.S. rifle sales in 1996: 1,612,326 — 30th most in last 38 years (83.7% American made; 16.3% imported)
- Estimated U.S. shotgun sales in 1996: 956,997 — 34th most in last 38 years (86.6% American made; 13.4% imported)
1997: 4,257,838 firearms

- Estimated U.S. firearm sales in 1997: 4,257,838 — 35th most in last 38 years (77.9% American made; 22.1% imported)
- Estimated U.S. handgun sales in 1997: 1,772,849 — 32nd most in last 38 years (73.3% American made; 26.7% imported)
- Estimated U.S. rifle sales in 1997: 1,533,652 — 32nd most in last 38 years (76.6% American made; 23.4% imported)
- Estimated U.S. shotgun sales in 1997: 936,011 — 36th most in last 38 years (88.6% American made; 11.4% imported)
1998: 4,510,056 firearms
- Estimated U.S. firearm sales in 1998: 4,510,056 — 31st most in last 38 years (77.8% American made; 22.2% imported)
- Estimated U.S. handgun sales in 1998: 1,771,111 — 33rd most in last 38 years (70.0% American made; 30.0% imported)
- Estimated U.S. rifle sales in 1998: 1,718,625 — 27th most in last 38 years (85.5% American made; 14.5% imported)
- Estimated U.S. shotgun sales in 1998: 998,327 — 33rd most in last 38 years (78.0% American made; 22.0% imported)
1999: 4,719,228 firearms
- Estimated U.S. firearm sales in 1999: 4,719,228 — 28th most in last 38 years (81.1% American made; 18.9% imported)
- Estimated U.S. handgun sales in 1999: 1,556,003 — 37th most in last 38 years (80.2% American made; 19.8% imported)
- Estimated U.S. rifle sales in 1999: 1,702,207 — 28th most in last 38 years (88.4% American made; 11.6% imported)
- Estimated U.S. shotgun sales in 1999: 1,425,209 — 9th most in last 38 years (72.9% American made; 27.1% imported)
2000: 4,717,696 firearms
- Estimated U.S. firearm sales in 2000: 4,717,696 — 29th most in last 38 years (76.8% American made; 23.2% imported)
- Estimated U.S. handgun sales in 2000: 1,670,998 — 35th most in last 38 years (72.1% American made; 27.9% imported)
- Estimated U.S. rifle sales in 2000: 1,832,294 — 24th most in last 38 years (83.7% American made; 16.3% imported)
- Estimated U.S. shotgun sales in 2000: 1,195,340 — 26th most in last 38 years (72.2% American made; 27.8% imported)
2001: 4,126,940 firearms

- Estimated U.S. firearm sales in 2001: 4,126,940 — 36th most in last 38 years (66.9% American made; 33.1% imported)
- Estimated U.S. handgun sales in 2001: 1,593,124 — 36th most in last 38 years (55.4% American made; 44.6% imported)
- Estimated U.S. rifle sales in 2001: 1,461,477 — 33rd most in last 38 years (84.4% American made; 15.6% imported)
- Estimated U.S. shotgun sales in 2001: 1,061,969 — 32nd most in last 38 years (59.7% American made; 40.3% imported)
2002: 4,845,376 firearms
- Estimated U.S. firearm sales in 2002: 4,845,376 — 27th most in last 38 years (66.4% American made; 33.6% imported)
- Estimated U.S. handgun sales in 2002: 1,773,687 — 31st most in last 38 years (58.2% American made; 41.8% imported)
- Estimated U.S. rifle sales in 2002: 1,962,279 — 23rd most in last 38 years (74.1% American made; 25.9% imported)
- Estimated U.S. shotgun sales in 2002: 1,089,183 — 31st most in last 38 years (65.1% American made; 34.9% imported)
2003: 4,632,994 firearms
- Estimated U.S. firearm sales in 2003: 4,632,994 — 30th most in last 38 years (68.3% American made; 31.7% imported)
- Estimated U.S. handgun sales in 2003: 1,708,423 — 34th most in last 38 years (63.1% American made; 36.9% imported)
- Estimated U.S. rifle sales in 2003: 1,796,639 — 26th most in last 38 years (76.1% American made; 23.9% imported)
- Estimated U.S. shotgun sales in 2003: 1,103,943 — 29th most in last 38 years (63.1% American made; 36.9% imported)
2004: 4,869,964 firearms
- Estimated U.S. firearm sales in 2004: 4,869,964 — 26th most in last 38 years (60.8% American made; 39.2% imported)
- Estimated U.S. handgun sales in 2004: 1,822,385 — 30th most in last 38 years (54.0% American made; 46.0% imported)
- Estimated U.S. rifle sales in 2004: 1,827,688 — 25th most in last 38 years (69.1% American made; 30.9% imported)
- Estimated U.S. shotgun sales in 2004: 1,207,794 — 24th most in last 38 years (58.0% American made; 42.0% imported)
2005: 5,153,487 firearms
- Estimated U.S. firearm sales in 2005: 5,153,487 — 23rd most in last 38 years (59.1% American made; 40.9% imported)
- Estimated U.S. handgun sales in 2005: 1,907,335 — 27th most in last 38 years (54.0% American made; 46.0% imported)
- Estimated U.S. rifle sales in 2005: 2,021,374 — 22nd most in last 38 years (66.3% American made; 33.7% imported)
- Estimated U.S. shotgun sales in 2005: 1,209,587 — 22nd most in last 38 years (54.8% American made; 45.2% imported)
2006: 5,718,325 firearms
- Estimated U.S. firearm sales in 2006: 5,718,325 — 21st most in last 38 years (57.5% American made; 42.5% imported)
- Estimated U.S. handgun sales in 2006: 2,399,739 — 21st most in last 38 years (51.4% American made; 48.6% imported)
- Estimated U.S. rifle sales in 2006: 2,053,069 — 21st most in last 38 years (67.9% American made; 32.1% imported)
- Estimated U.S. shotgun sales in 2006: 1,263,667 — 15th most in last 38 years (52.0% American made; 48.0% imported)
2007: 6,461,824 firearms
- Estimated U.S. firearm sales in 2007: 6,461,824 — 20th most in last 38 years (57.5% American made; 42.5% imported)
- Estimated U.S. handgun sales in 2007: 2,917,743 — 20th most in last 38 years (52.5% American made; 47.5% imported)
- Estimated U.S. rifle sales in 2007: 2,162,110 — 19th most in last 38 years (70.8% American made; 29.2% imported)
- Estimated U.S. shotgun sales in 2007: 1,344,034 — 11th most in last 38 years (46.0% American made; 54.0% imported)
2008: 6,876,842 firearms

- Estimated U.S. firearm sales in 2008: 6,876,842 — 17th most in last 38 years (62.1% American made; 37.9% imported)
- Estimated U.S. handgun sales in 2008: 3,426,961 — 17th most in last 38 years (57.2% American made; 42.8% imported)
- Estimated U.S. rifle sales in 2008: 2,232,356 — 18th most in last 38 years (73.0% American made; 27.0% imported)
- Estimated U.S. shotgun sales in 2008: 1,125,484 — 28th most in last 38 years (52.4% American made; 47.6% imported)
2009: 8,968,180 firearms
- Estimated U.S. firearm sales in 2009: 8,968,180 — 14th most in last 38 years (59.8% American made; 40.2% imported)
- Estimated U.S. handgun sales in 2009: 4,511,091 — 14th most in last 38 years (51.6% American made; 48.4% imported)
- Estimated U.S. rifle sales in 2009: 3,051,789 — 12th most in last 38 years (71.7% American made; 28.3% imported)
- Estimated U.S. shotgun sales in 2009: 1,274,923 — 14th most in last 38 years (56.2% American made; 43.8% imported)
2010: 8,057,210 firearms

- Estimated U.S. firearm sales in 2010: 8,057,210 — 15th most in last 38 years (64.8% American made; 35.2% imported)
- Estimated U.S. handgun sales in 2010: 4,494,635 — 15th most in last 38 years (60.3% American made; 39.7% imported)
- Estimated U.S. rifle sales in 2010: 2,301,487 — 17th most in last 38 years (76.2% American made; 23.8% imported)
- Estimated U.S. shotgun sales in 2010: 1,209,930 — 21st most in last 38 years (57.9% American made; 42.1% imported)
2011: 9,497,402 firearms

- Estimated U.S. firearm sales in 2011: 9,497,402 — 13th most in last 38 years (65.8% American made; 34.2% imported)
- Estimated U.S. handgun sales in 2011: 4,752,010 — 13th most in last 38 years (63.7% American made; 36.3% imported)
- Estimated U.S. rifle sales in 2011: 3,236,904 — 11th most in last 38 years (69.2% American made; 30.8% imported)
- Estimated U.S. shotgun sales in 2011: 1,336,579 — 13th most in last 38 years (60.4% American made; 39.6% imported)
2012: 13,135,646 firearms
- Estimated U.S. firearm sales in 2012: 13,135,646 — 7th most in last 38 years (63.1% American made; 36.9% imported)
- Estimated U.S. handgun sales in 2012: 6,634,485 — 10th most in last 38 years (60.4% American made; 39.6% imported)
- Estimated U.S. rifle sales in 2012: 4,330,775 — 6th most in last 38 years (71.3% American made; 28.7% imported)
- Estimated U.S. shotgun sales in 2012: 1,879,617 — 5th most in last 38 years (48.2% American made; 51.8% imported)
2013: 15,991,210 firearms

- Estimated U.S. firearm sales in 2013: 15,991,210 — 5th most in last 38 years (65.4% American made; 34.6% imported)
- Estimated U.S. handgun sales in 2013: 8,073,647 — 6th most in last 38 years (61.7% American made; 38.3% imported)
- Estimated U.S. rifle sales in 2013: 5,355,628 — the most in last 38 years (71.8% American made; 28.2% imported)
- Estimated U.S. shotgun sales in 2013: 2,089,541 — 3rd most in last 38 years (55.2% American made; 44.8% imported)
2014: 12,254,962 firearms

- Estimated U.S. firearm sales in 2014: 12,254,962 — 11th most in last 38 years (70.4% American made; 29.6% imported)
- Estimated U.S. handgun sales in 2014: 6,410,701 — 11th most in last 38 years (65.9% American made; 34.1% imported)
- Estimated U.S. rifle sales in 2014: 3,963,507 — 8th most in last 38 years (80.0% American made; 20.0% imported)
- Estimated U.S. shotgun sales in 2014: 1,523,373 — 8th most in last 38 years (57.4% American made; 42.6% imported)
2015: 12,945,416 firearms

- Estimated U.S. firearm sales in 2015: 12,945,416 — 8th most in last 38 years (69.6% American made; 30.4% imported)
- Estimated U.S. handgun sales in 2015: 6,749,106 — 9th most in last 38 years (63.4% American made; 36.6% imported)
- Estimated U.S. rifle sales in 2015: 4,347,909 — 5th most in last 38 years (81.2% American made; 18.8% imported)
- Estimated U.S. shotgun sales in 2015: 1,402,769 — 10th most in last 38 years (54.1% American made; 45.9% imported)
2016: 16,258,394 firearms

- Estimated U.S. firearm sales in 2016: 16,258,394 — 4th most in last 38 years (68.4% American made; 31.6% imported)
- Estimated U.S. handgun sales in 2016: 9,051,208 — 4th most in last 38 years (59.4% American made; 40.6% imported)
- Estimated U.S. rifle sales in 2016: 4,821,743 — 3rd most in last 38 years (84.9% American made; 15.1% imported)
- Estimated U.S. shotgun sales in 2016: 1,560,431 — 6th most in last 38 years (52.8% American made; 47.2% imported)
2017: 12,331,748 firearms
- Estimated U.S. firearm sales in 2017: 12,331,748 — 10th most in last 38 years (63.6% American made; 36.4% imported)
- Estimated U.S. handgun sales in 2017: 7,402,669 — 7th most in last 38 years (55.6% American made; 44.4% imported)
- Estimated U.S. rifle sales in 2017: 2,917,530 — 13th most in last 38 years (80.4% American made; 19.6% imported)
- Estimated U.S. shotgun sales in 2017: 1,255,247 — 16th most in last 38 years (49.6% American made; 50.4% imported)
2018: 12,804,242 firearms
- Estimated U.S. firearm sales in 2018: 12,804,242 — 9th most in last 38 years (66.4% American made; 33.6% imported)
- Estimated U.S. handgun sales in 2018: 7,131,118 — 8th most in last 38 years (58.8% American made; 41.2% imported)
- Estimated U.S. rifle sales in 2018: 3,366,994 — 10th most in last 38 years (80.6% American made; 19.4% imported)
- Estimated U.S. shotgun sales in 2018: 1,222,283 — 19th most in last 38 years (41.6% American made; 58.4% imported)
2019: 10,681,126 firearms

- Estimated U.S. firearm sales in 2019: 10,681,126 — 12th most in last 38 years (62.7% American made; 37.3% imported)
- Estimated U.S. handgun sales in 2019: 6,067,861 — 12th most in last 38 years (57.2% American made; 42.8% imported)
- Estimated U.S. rifle sales in 2019: 2,470,129 — 15th most in last 38 years (73.7% American made; 26.3% imported)
- Estimated U.S. shotgun sales in 2019: 1,201,668 — 25th most in last 38 years (38.1% American made; 61.9% imported)
2020: 17,366,170 firearms
- Estimated U.S. firearm sales in 2020: 17,366,170 — 3rd most in last 38 years (60.7% American made; 39.3% imported)
- Estimated U.S. handgun sales in 2020: 10,131,483 — 3rd most in last 38 years (60.2% American made; 39.8% imported)
- Estimated U.S. rifle sales in 2020: 3,535,993 — 9th most in last 38 years (75.2% American made; 24.8% imported)
- Estimated U.S. shotgun sales in 2020: 2,383,745 — 2nd most in last 38 years (19.2% American made; 80.8% imported)
2021: 22,666,081 firearms

- Estimated U.S. firearm sales in 2021: 22,666,081 — the most in last 38 years (58.9% American made; 41.1% imported)
- Estimated U.S. handgun sales in 2021: 12,912,617 — the most in last 38 years (59.2% American made; 40.8% imported)
- Estimated U.S. rifle sales in 2021: 5,014,205 — 2nd most in last 38 years (75.3% American made; 24.7% imported)
- Estimated U.S. shotgun sales in 2021: 3,464,319 — the most in last 38 years (18.7% American made; 81.3% imported)
2022: 19,834,407 firearms

- Estimated U.S. firearm sales in 2022: 19,834,407 — 2nd most in last 38 years (64.4% American made; 35.6% imported)
- Estimated U.S. handgun sales in 2022: 11,098,060 — 2nd most in last 38 years (59.6% American made; 40.4% imported)
- Estimated U.S. rifle sales in 2022: 4,547,641 — 4th most in last 38 years (73.9% American made; 26.1% imported)
- Estimated U.S. shotgun sales in 2022: 2,022,955 — 4th most in last 38 years (30.6% American made; 69.4% imported)
2023: 15,226,436 firearms

- Estimated U.S. firearm sales in 2023: 15,226,436 — 6th most in last 38 years (61.0% American made; 39.0% imported)
- Estimated U.S. handgun sales in 2023: 8,302,962 — 5th most in last 38 years (54.4% American made; 45.6% imported)
- Estimated U.S. rifle sales in 2023: 4,083,050 — 7th most in last 38 years (71.5% American made; 28.5% imported)
- Estimated U.S. shotgun sales in 2023: 1,540,289 — 7th most in last 38 years (36.2% American made; 63.8% imported)
The post Best Years For Gunmakers Since the 1980s appeared first on 24/7 Wall St..